
Exergetic Effects of Cooled Cooling Air Technology on the Turbofan Engine during a Typical Mission

 , ,
, ,
Abstract
:1. Introduction
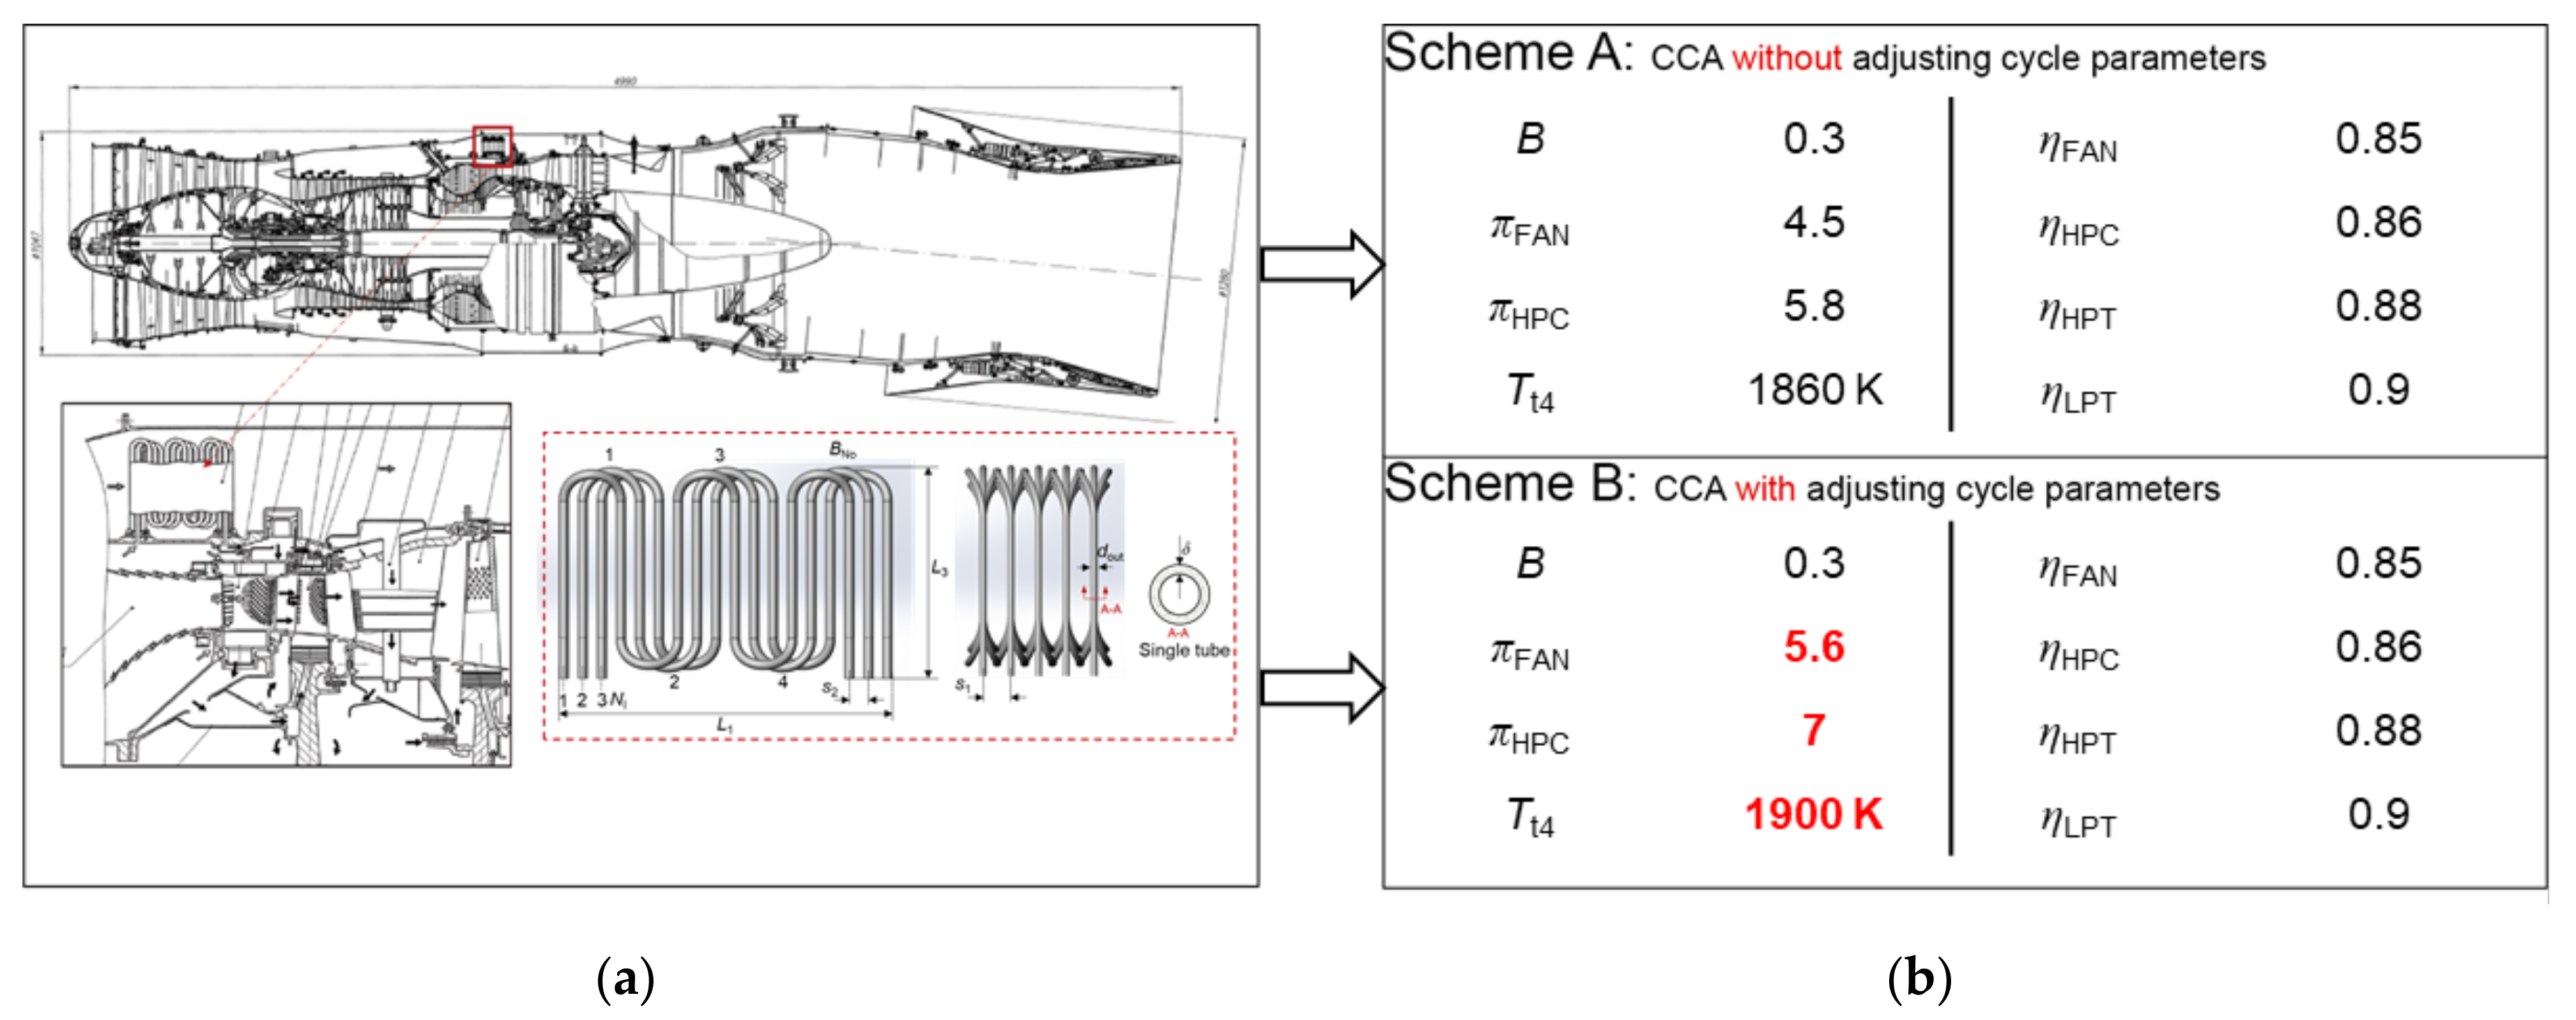
2. Engine Schemes with CCA Technology
3. Methods
- (1)
- Identify the engine scheme type (F-119, scheme A or B) and input its cycle parameters. For the F-119 scheme, the CCA heat exchanger submodule is closed, and for the latter two schemes, this submodule starts using the bypass air to cool the HPC bleed air.
- (2)
- Calculate the thermodynamic parameters at each section for the given engine type, and then the takeoff thrust (FNTO) could be given.
- (3)
- Obtain exergy parameters in each component at takeoff condition, and then calculate the exergy destruction and other exergetic indicators.
- (4)
- Identify the total takeoff weight (W1) and its composition by the ratio of thrust and weight (γTO), and the involved parameters include takeoff fuel factor (0.42), aircraft structural factor (0.465), and payload weight (1205 kg).
- (5)
- Calculate the fighter weight at takeoff task termination based on the flight duration (τ1) and fuel consumption (sfc1), and output it for the next step.
- (6)
- Determine the thrust requirement (FNreq, 2) at the next mission segment by the aircraft force balance analysis model, and pass it to the engine model.
- (7)
- Operate the engine program under the flight environment of the new mission segment to match the needed thrust, and obtain temperature, pressure, and mass flow at each section of this mission. Meanwhile, the fuel consumption (sfc2) is also calculated.
- (8)
- Input the based thermodynamic parameters of the engine at this mission into the exergy analysis model for obtaining exergy indicators.
- (9)
- Repeat steps 4 to 7 until finishing all mission segments.
- (10)
- Finish the energy and exergy analysis of the given scheme under the full flight conditions and return to Step 1 for starting simulation of the next scheme.
- (1)
- The acceleration mission is regarded as a uniformly accelerated process;
- (2)
- The static pressure of exhaust air at the design point is equal to the environmental pressure;
- (3)
- The potential exergy is neglected.
- (4)
- The working conditions of the engine are steady-state and flow;
- (5)
- The properties of the fuel are calculated by RP-3 aviation kerosene, and its lower heating value is 43,370.596 kJ/kg [25];
- (6)
- The working fluid (air and gas) are regarded as ideal gases;
- (7)
- The air compressors and gas turbines are considered adiabatic, and the secondary airflow used to cool the CC wall is mixed with the air participating in combustion.
3.1. Aircraft-Engine Thermodynamic Model
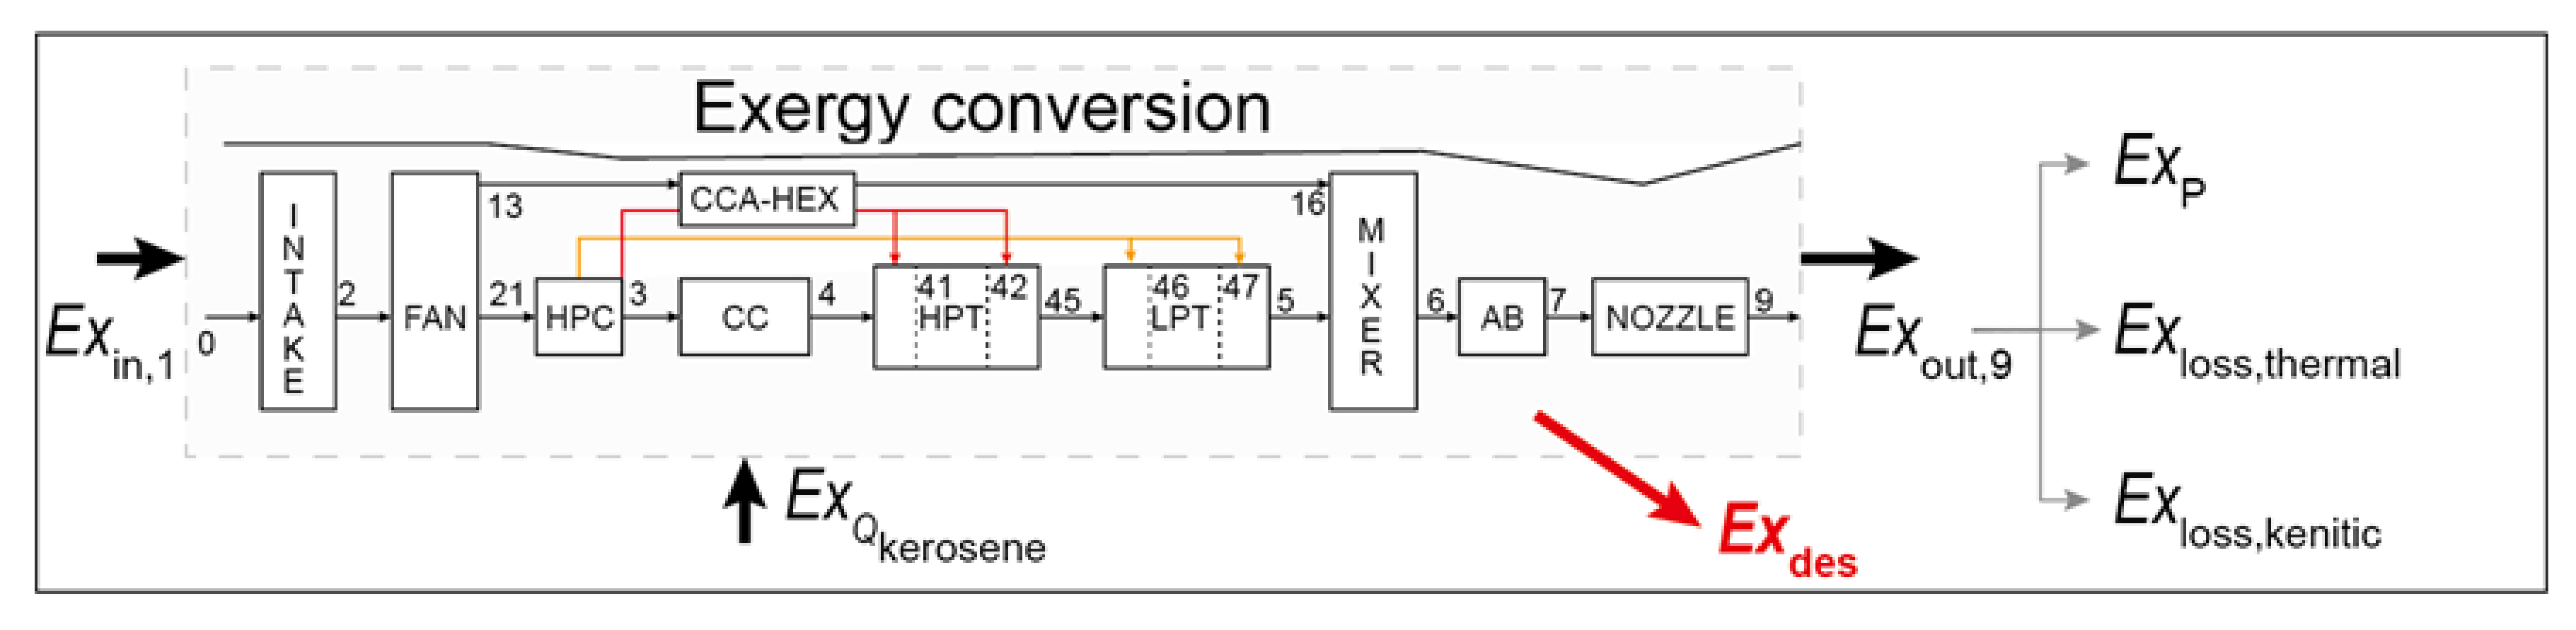
3.2. Exergy Model of Engine with CCA Technology
3.2.1. Exergy of Terms and Balance Equation
3.2.2. Exergy Model of Each Component
- Intake:

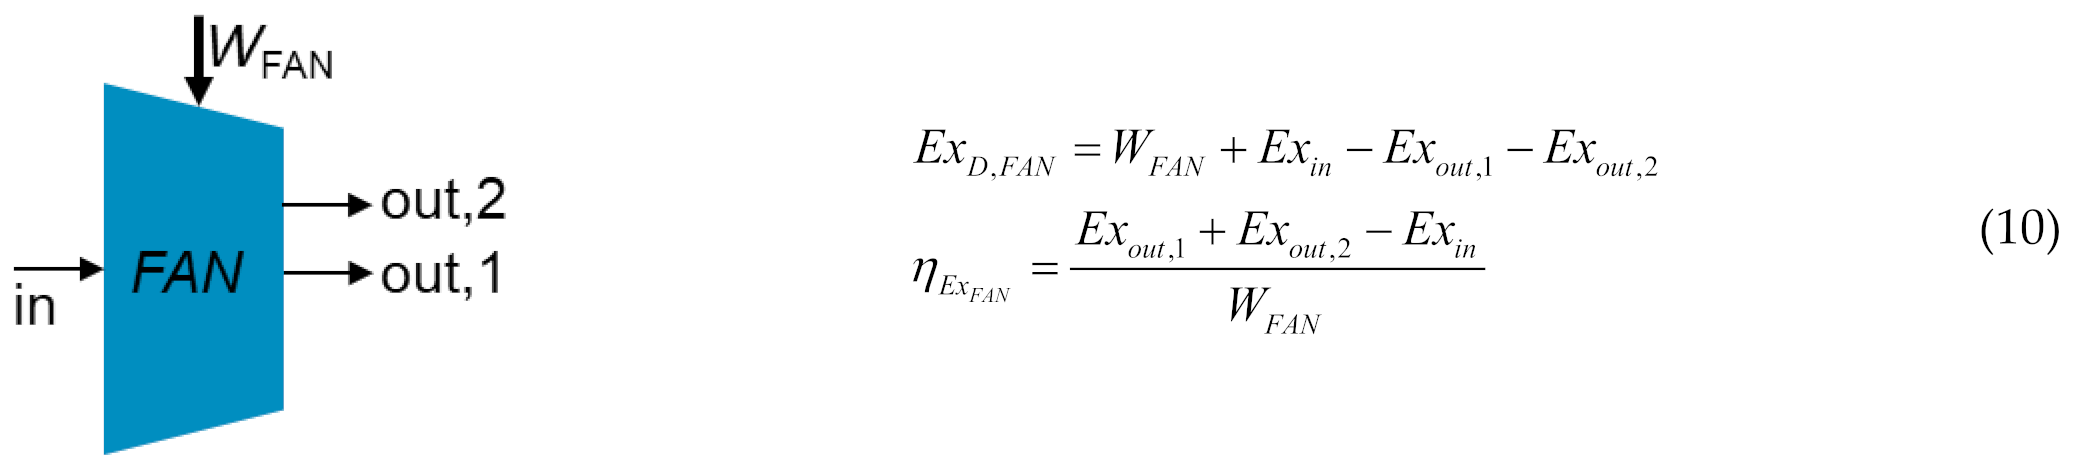
- Fan (FAN):
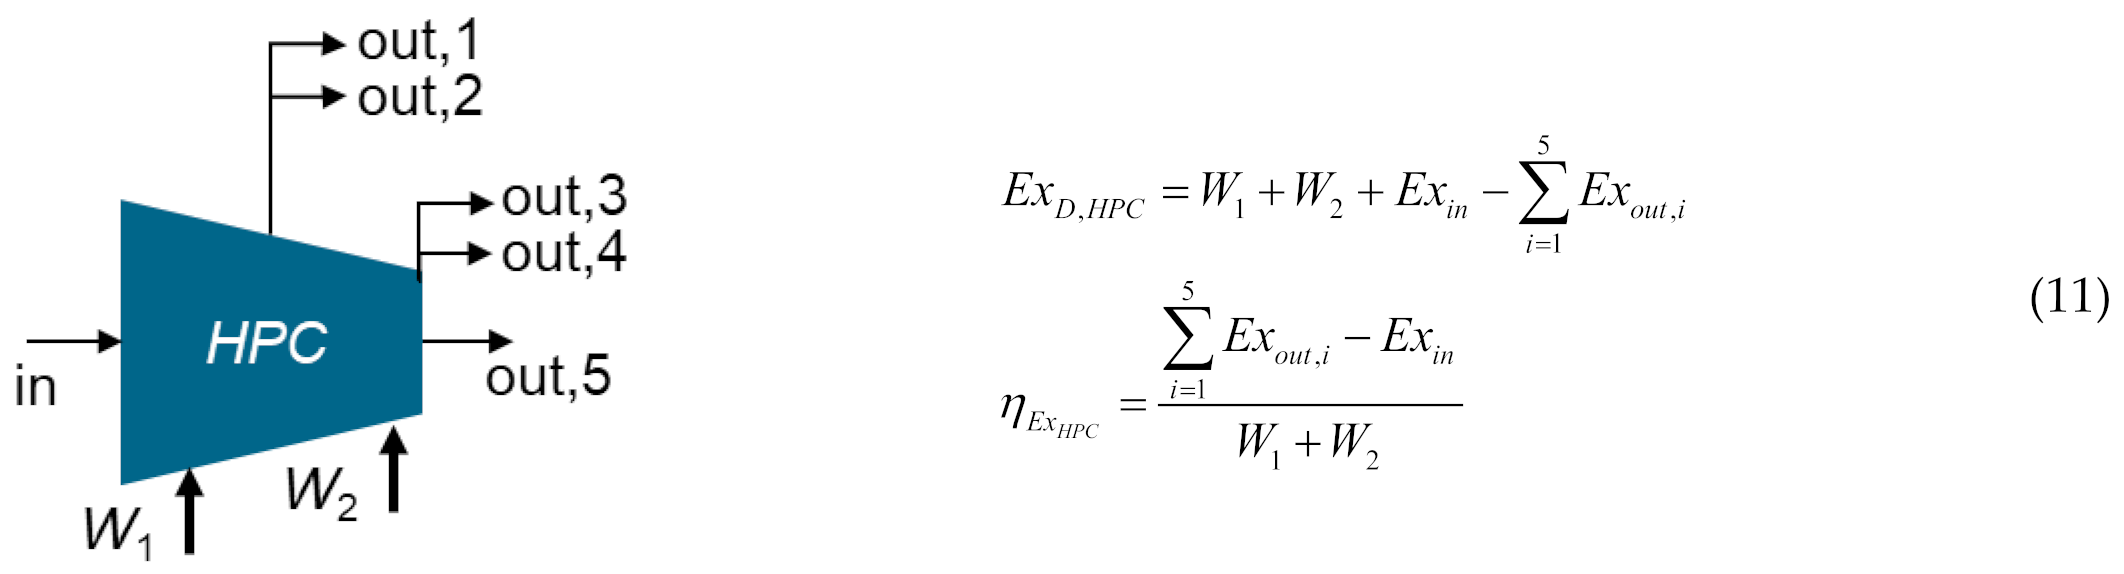
- High-pressure compressor (HPC):
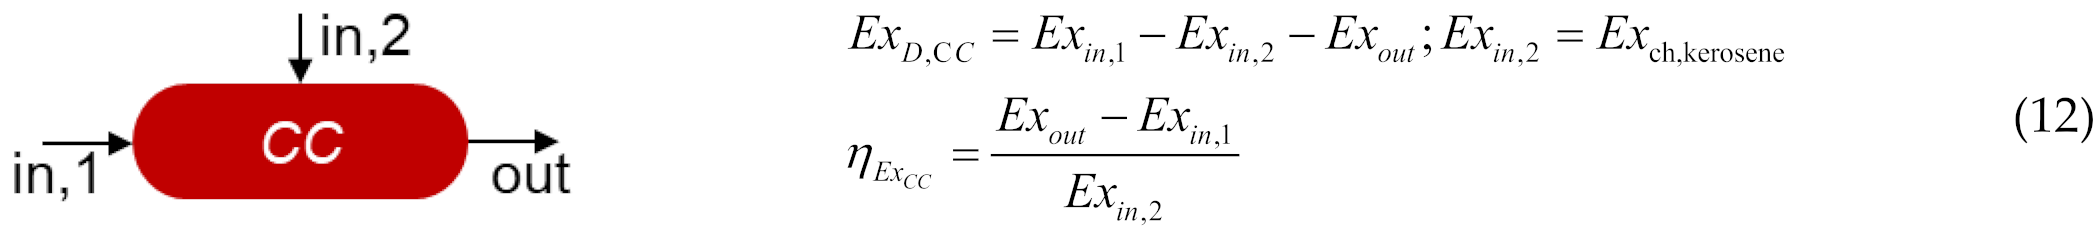
- Combusting chamber (CC) and afterburning (AB):
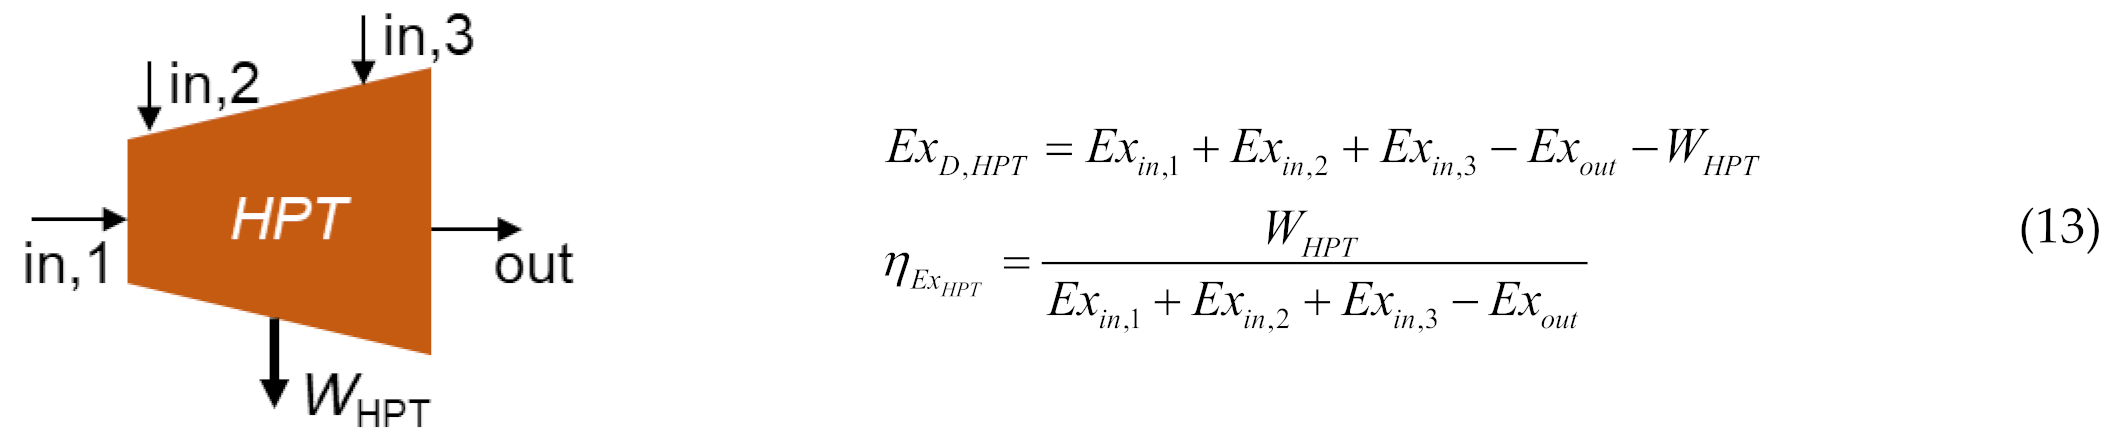
- High-pressure turbine (HPT), and the control volume and relations of LPT are similar to HPT:
- Mixer (MIXER):

- Nozzle (NOZZLE):

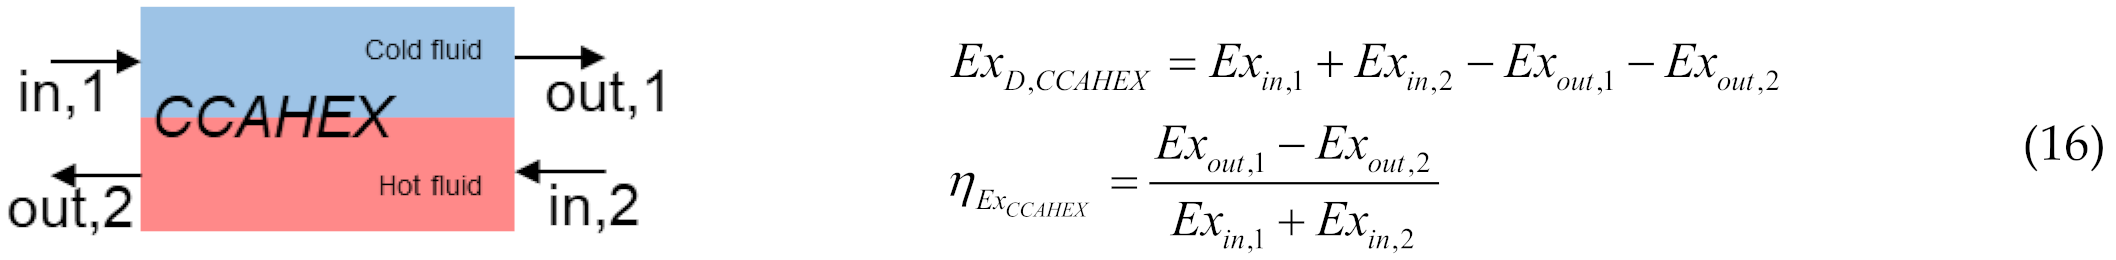
- Heat exchanger (HEX):
3.2.3. Avoidable and Unavoidable Exergy Destruction
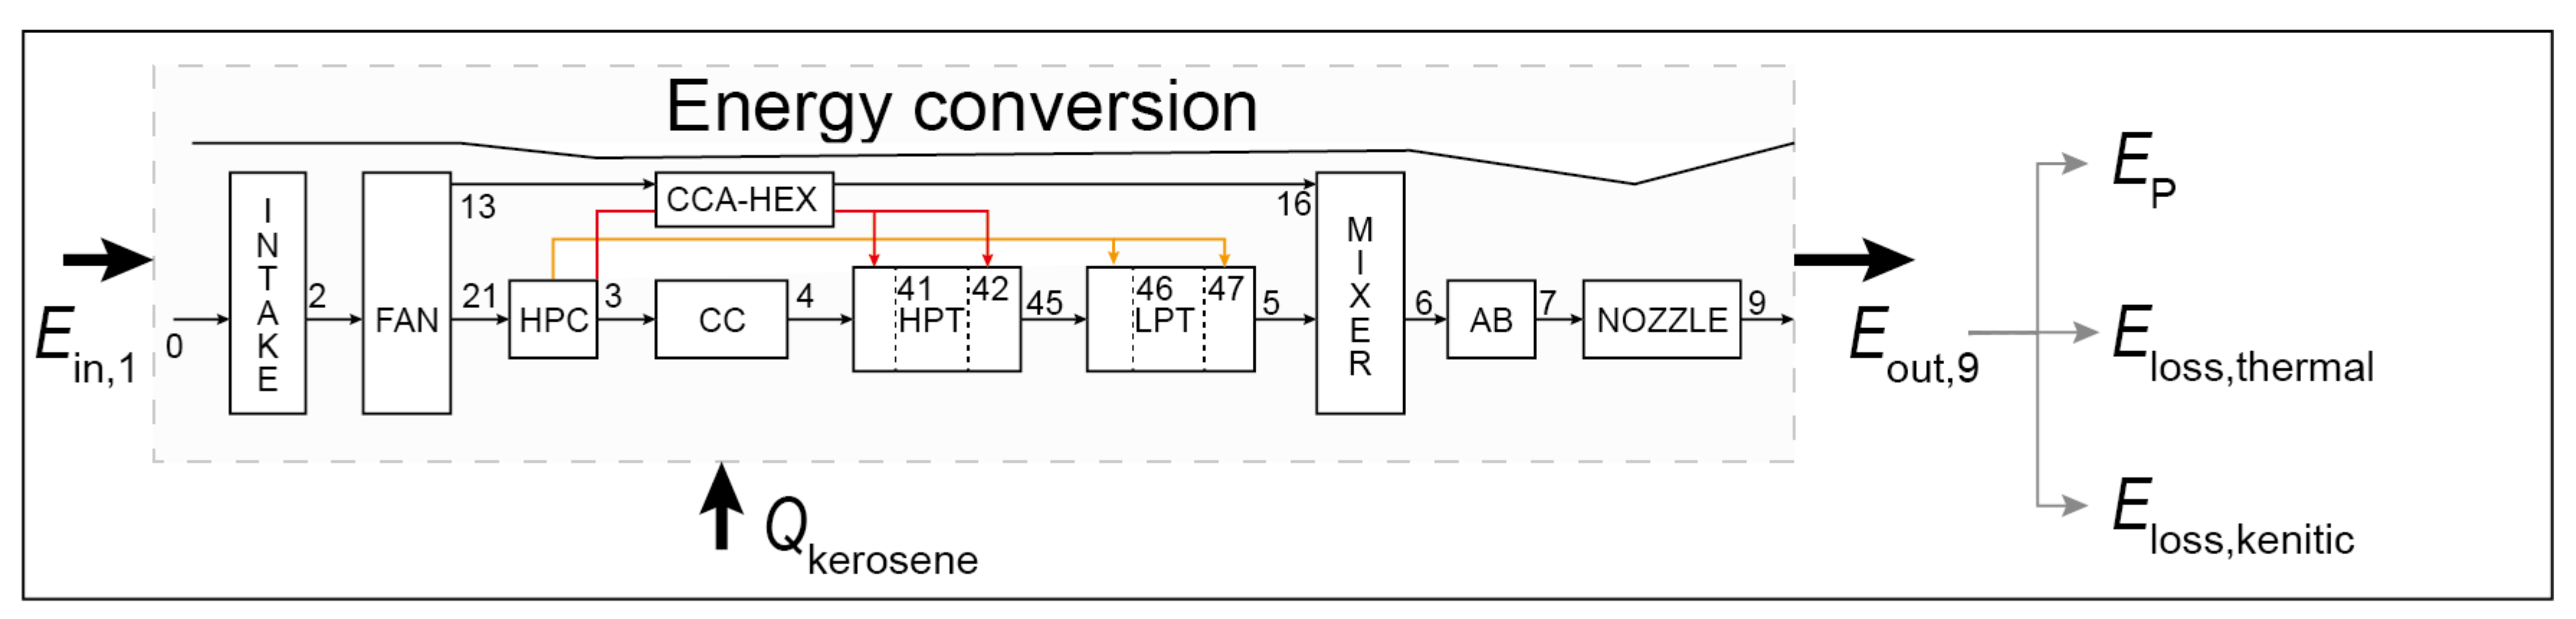
3.3. Energy and Exergy Indicators
3.3.1. Energy Indicators
3.3.2. Exergy Indicators
4. Results
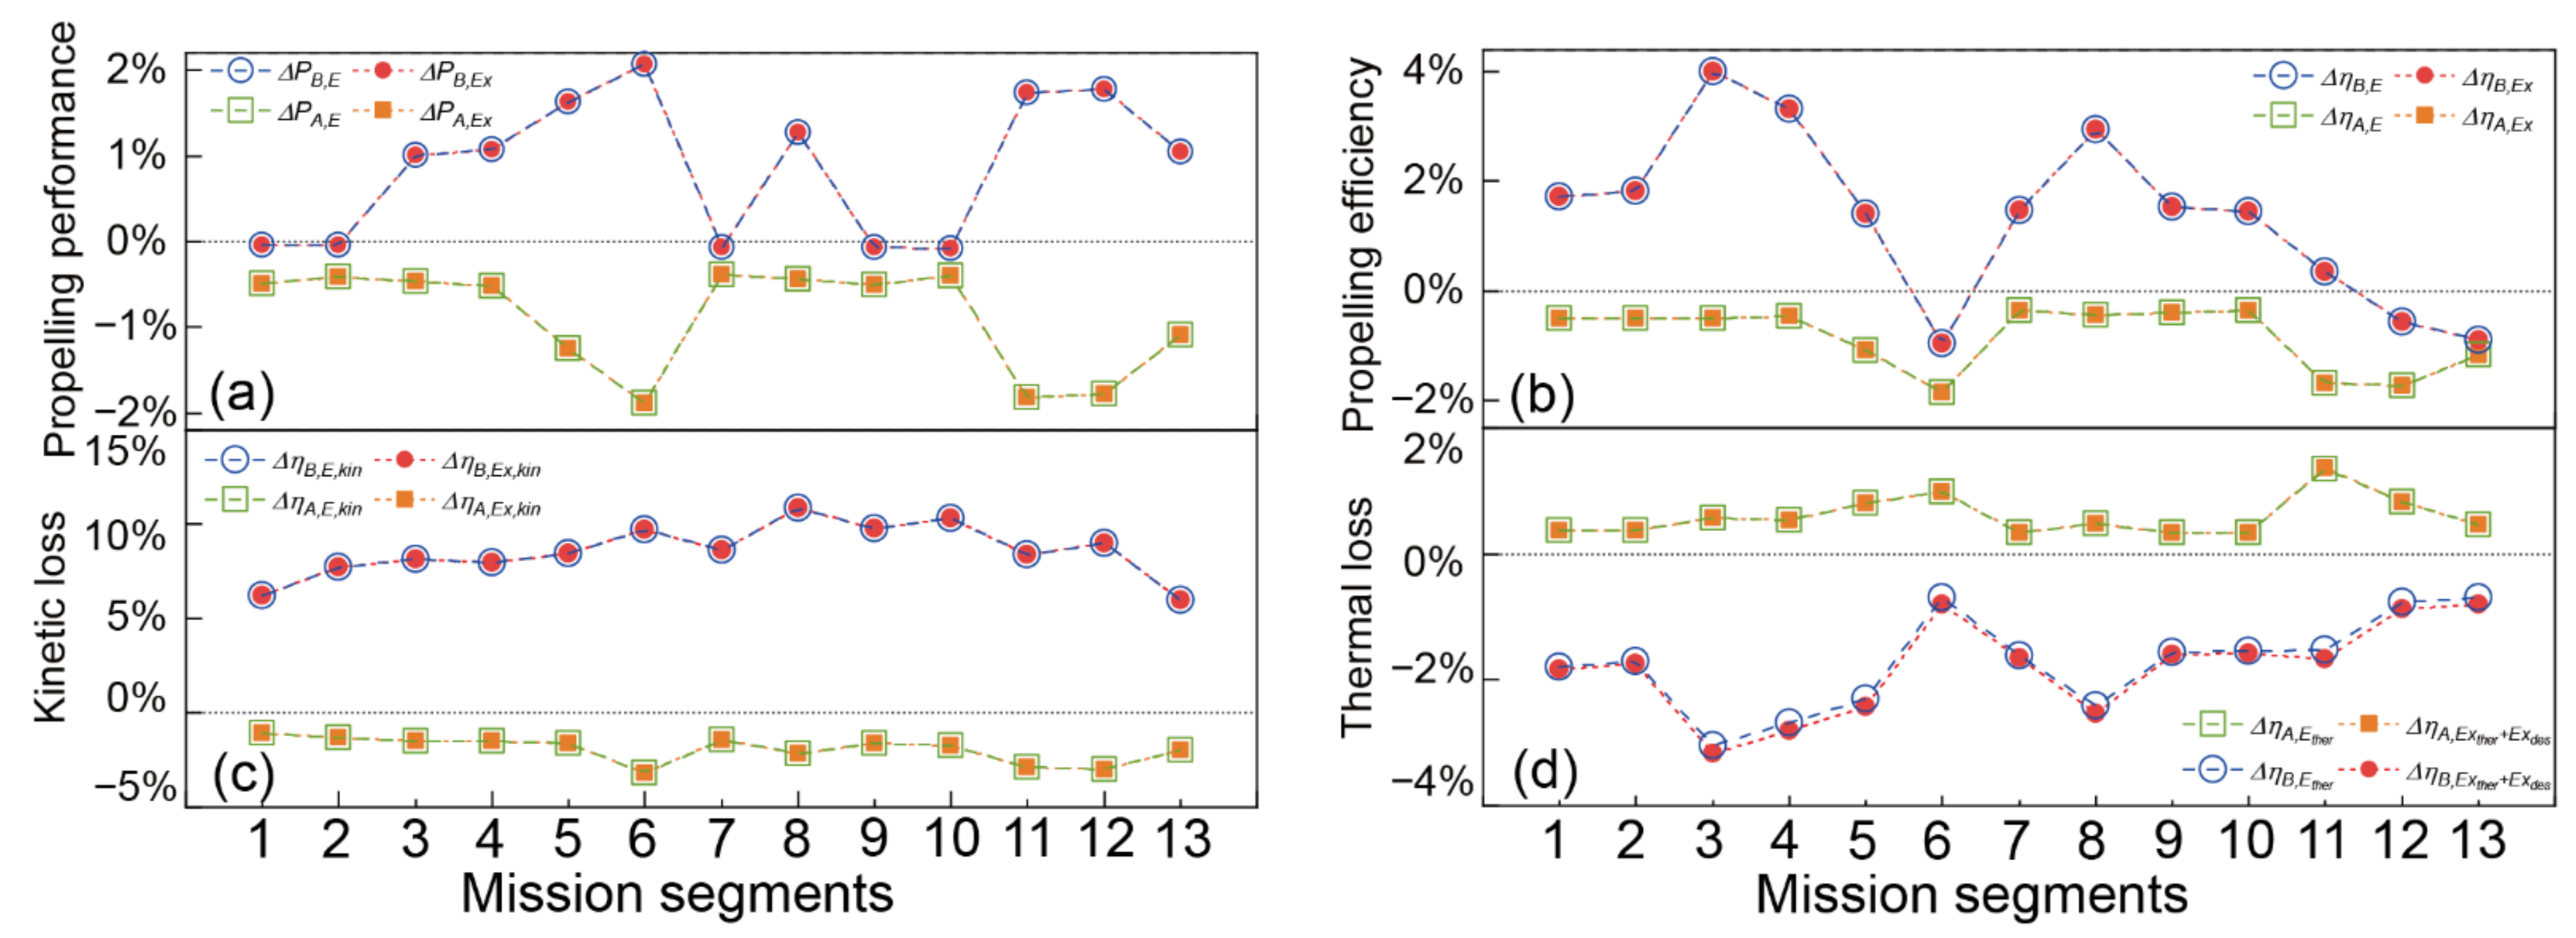
4.1. Comparison of Overall Energy and Exergy Indicators
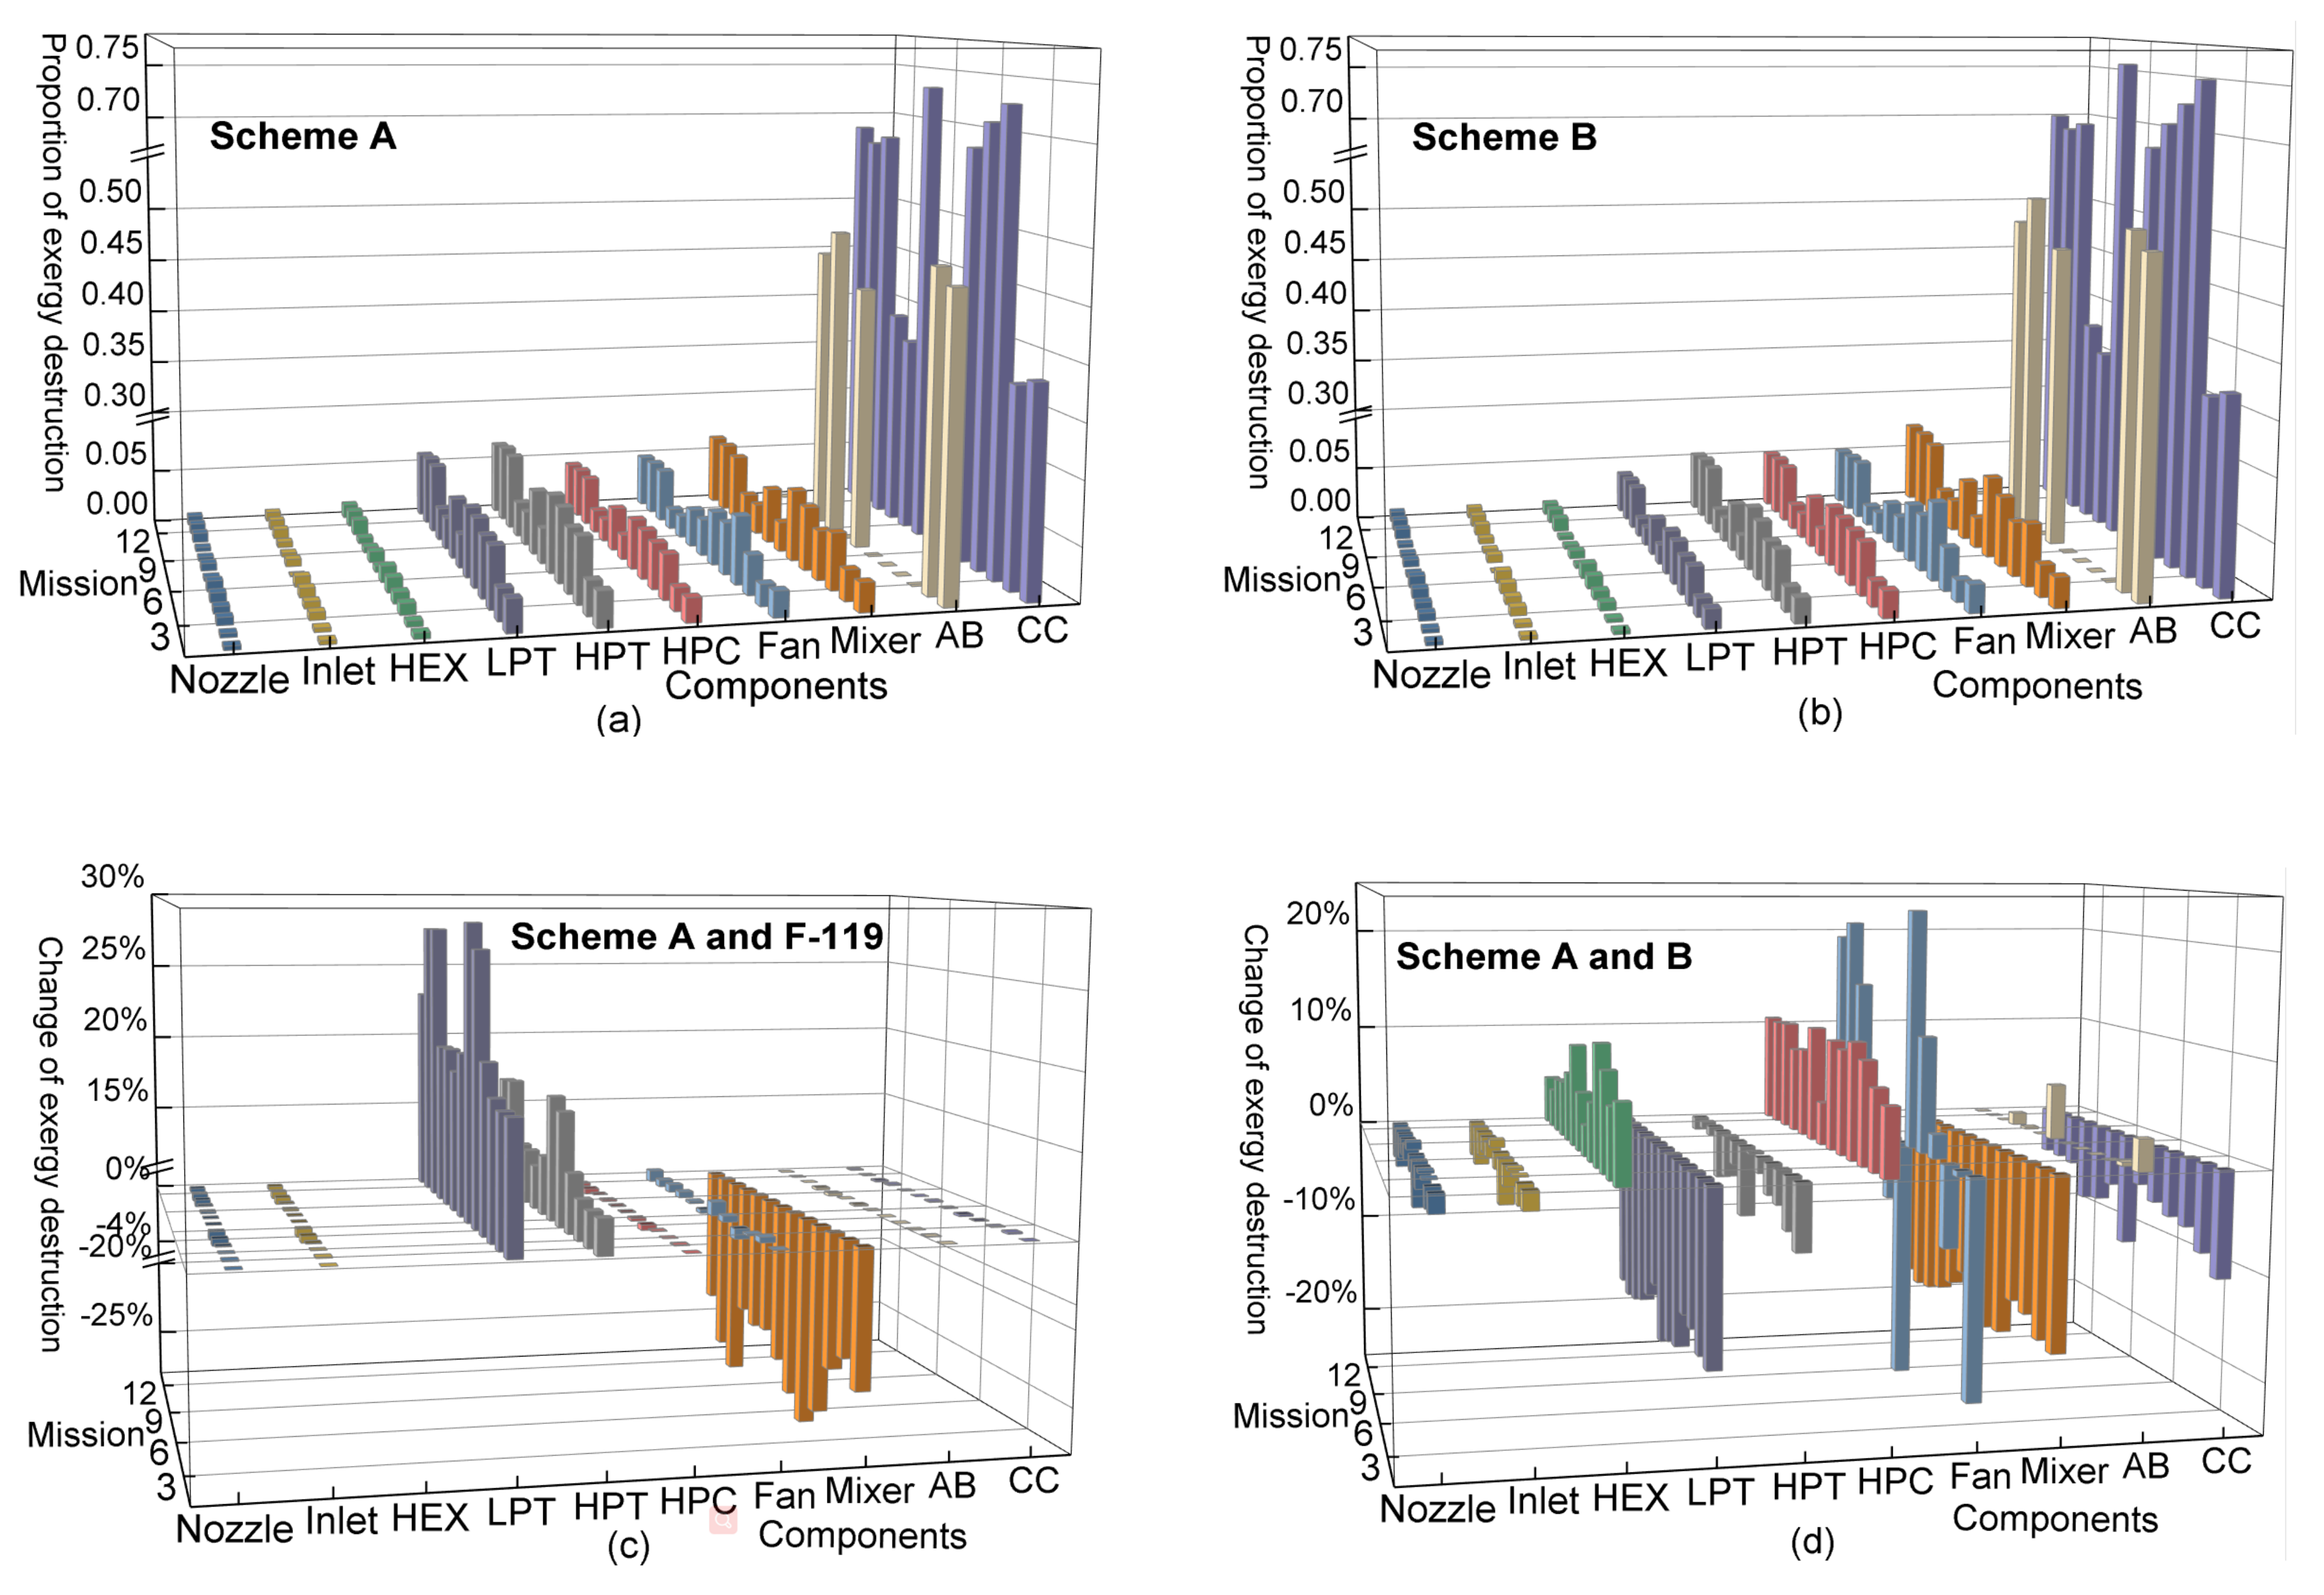
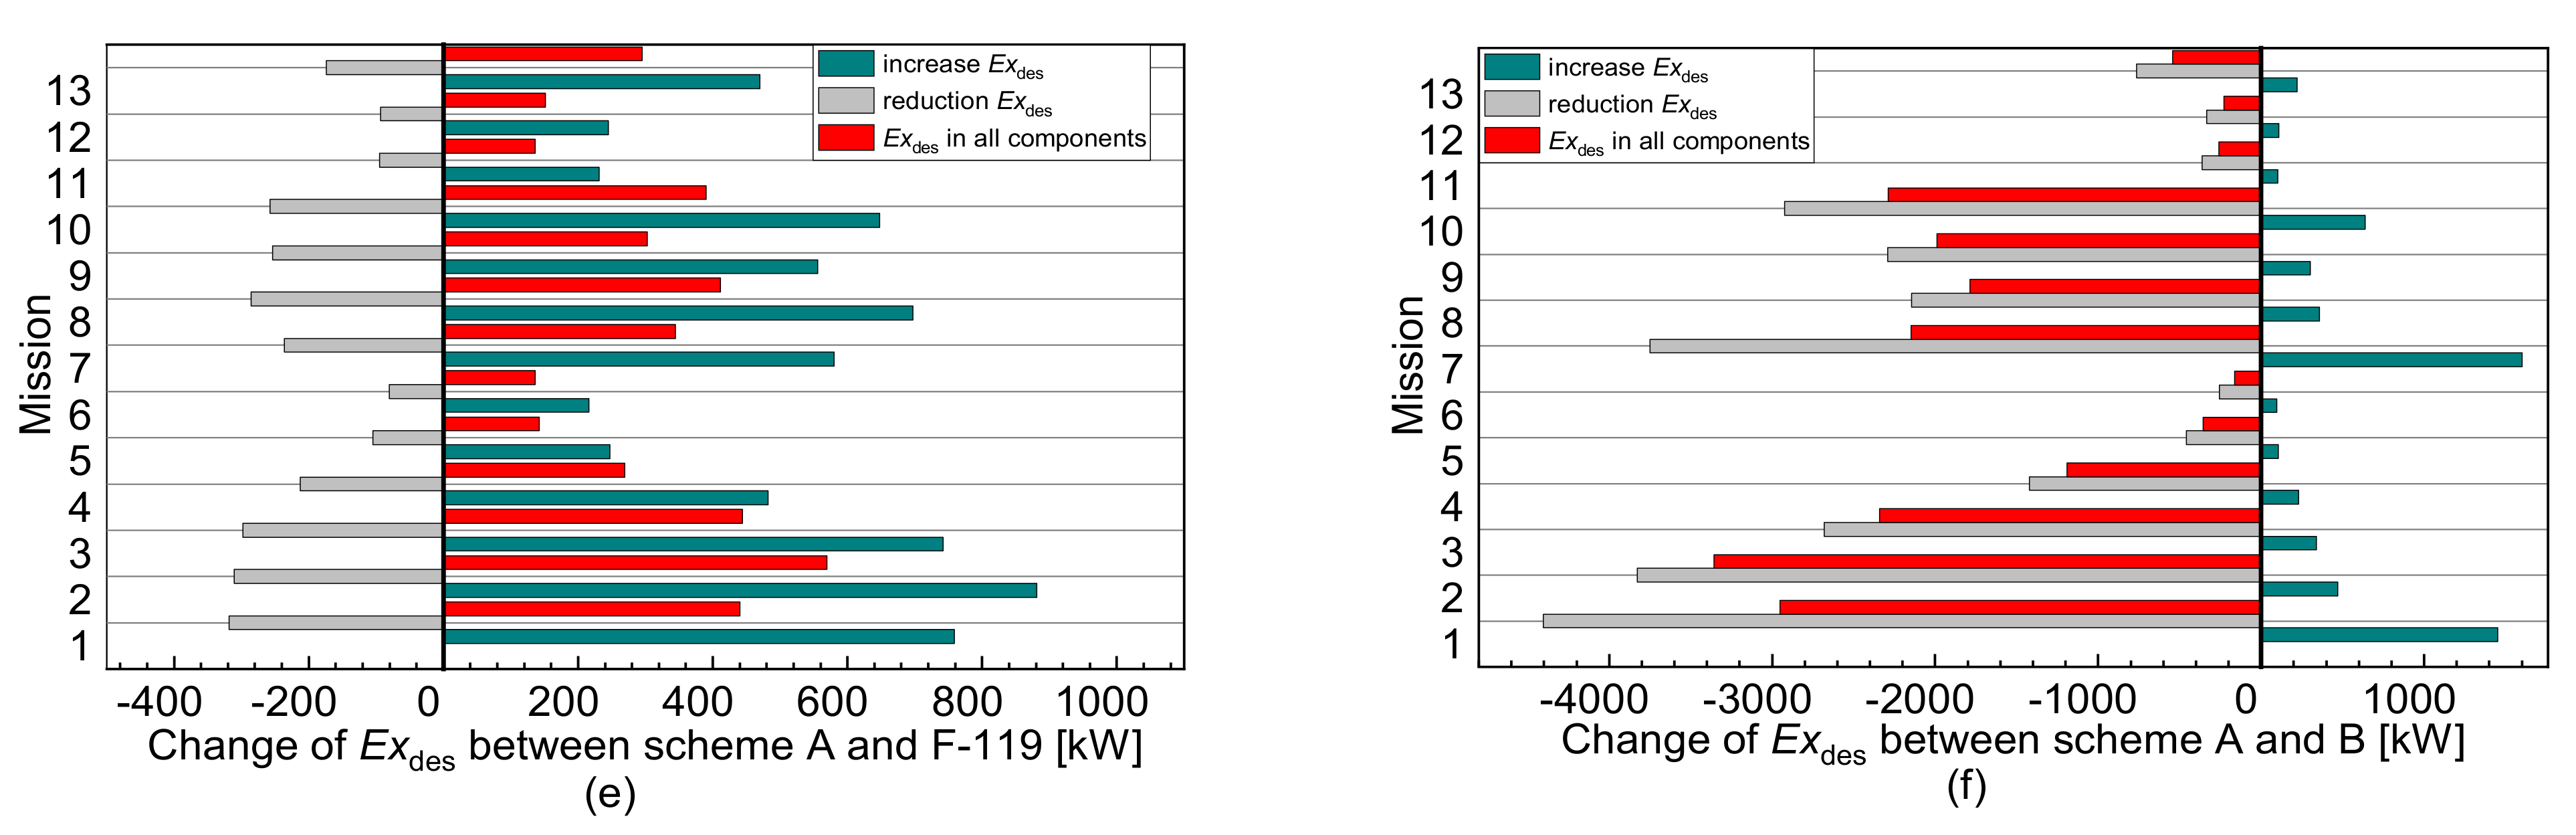
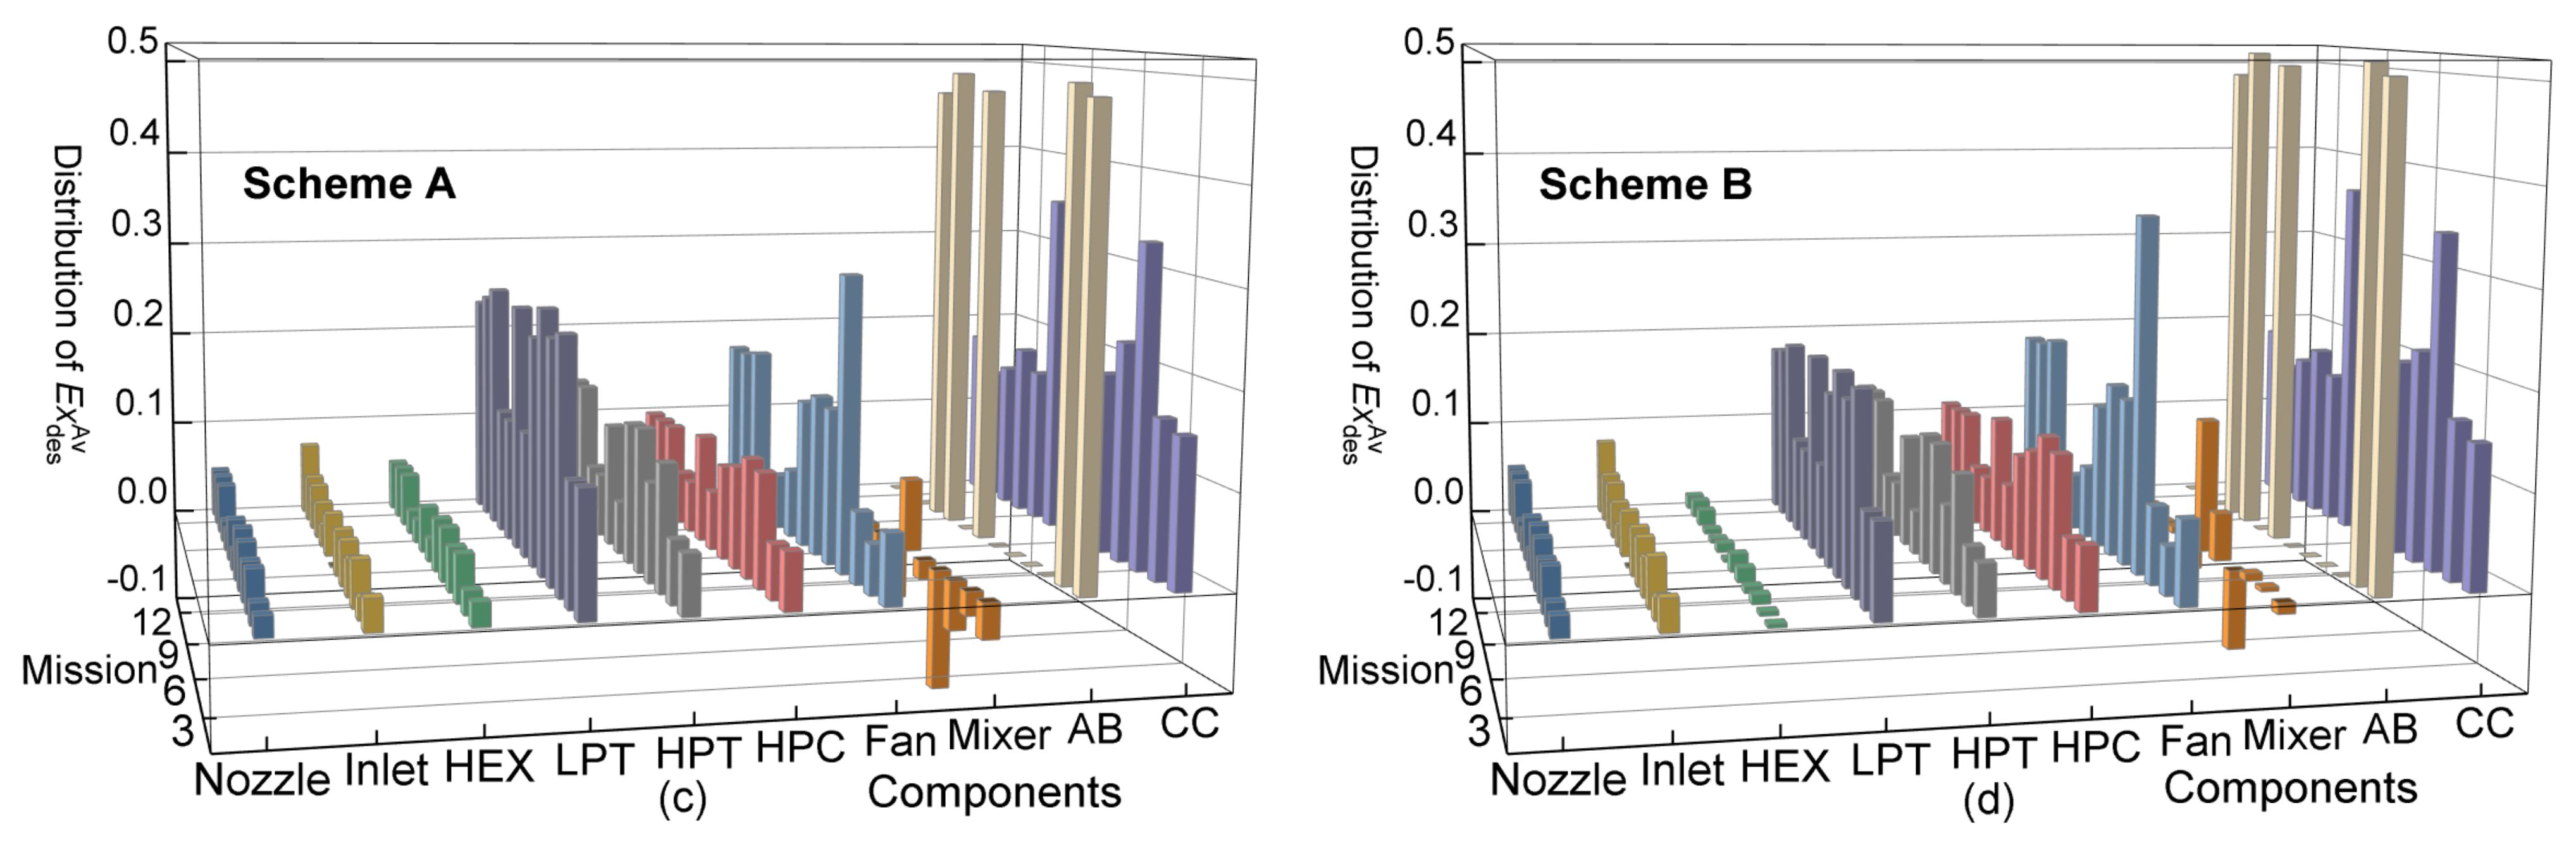
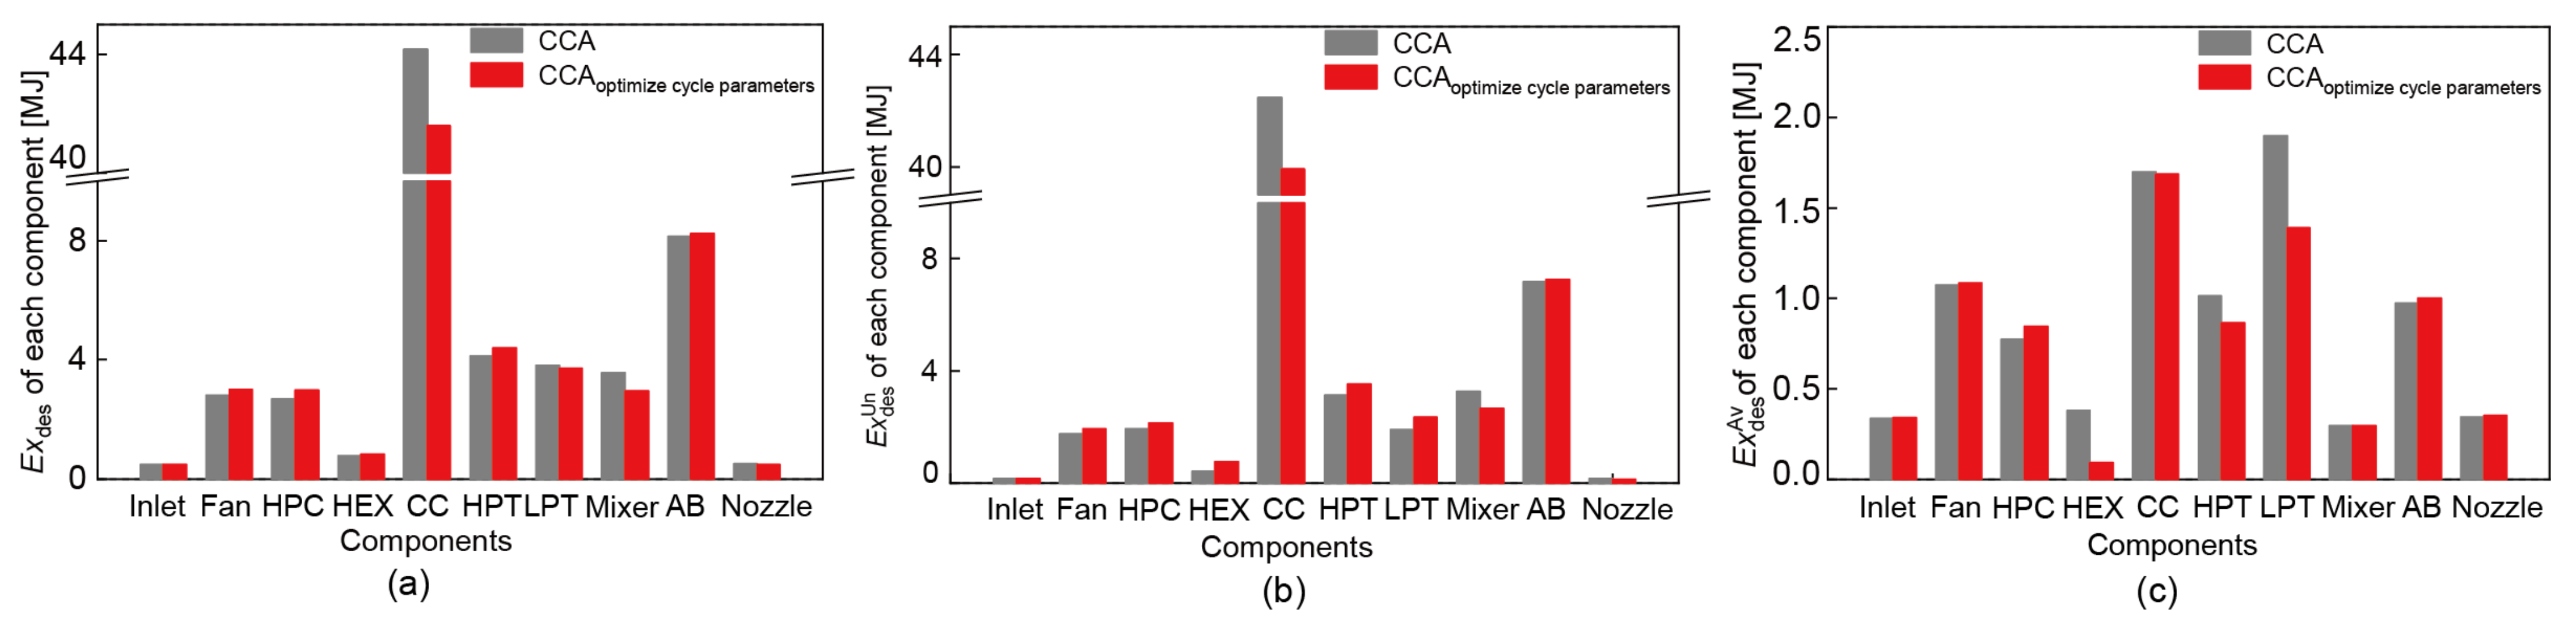
4.2. Effect of CCA Technology on the Exergy Destruction
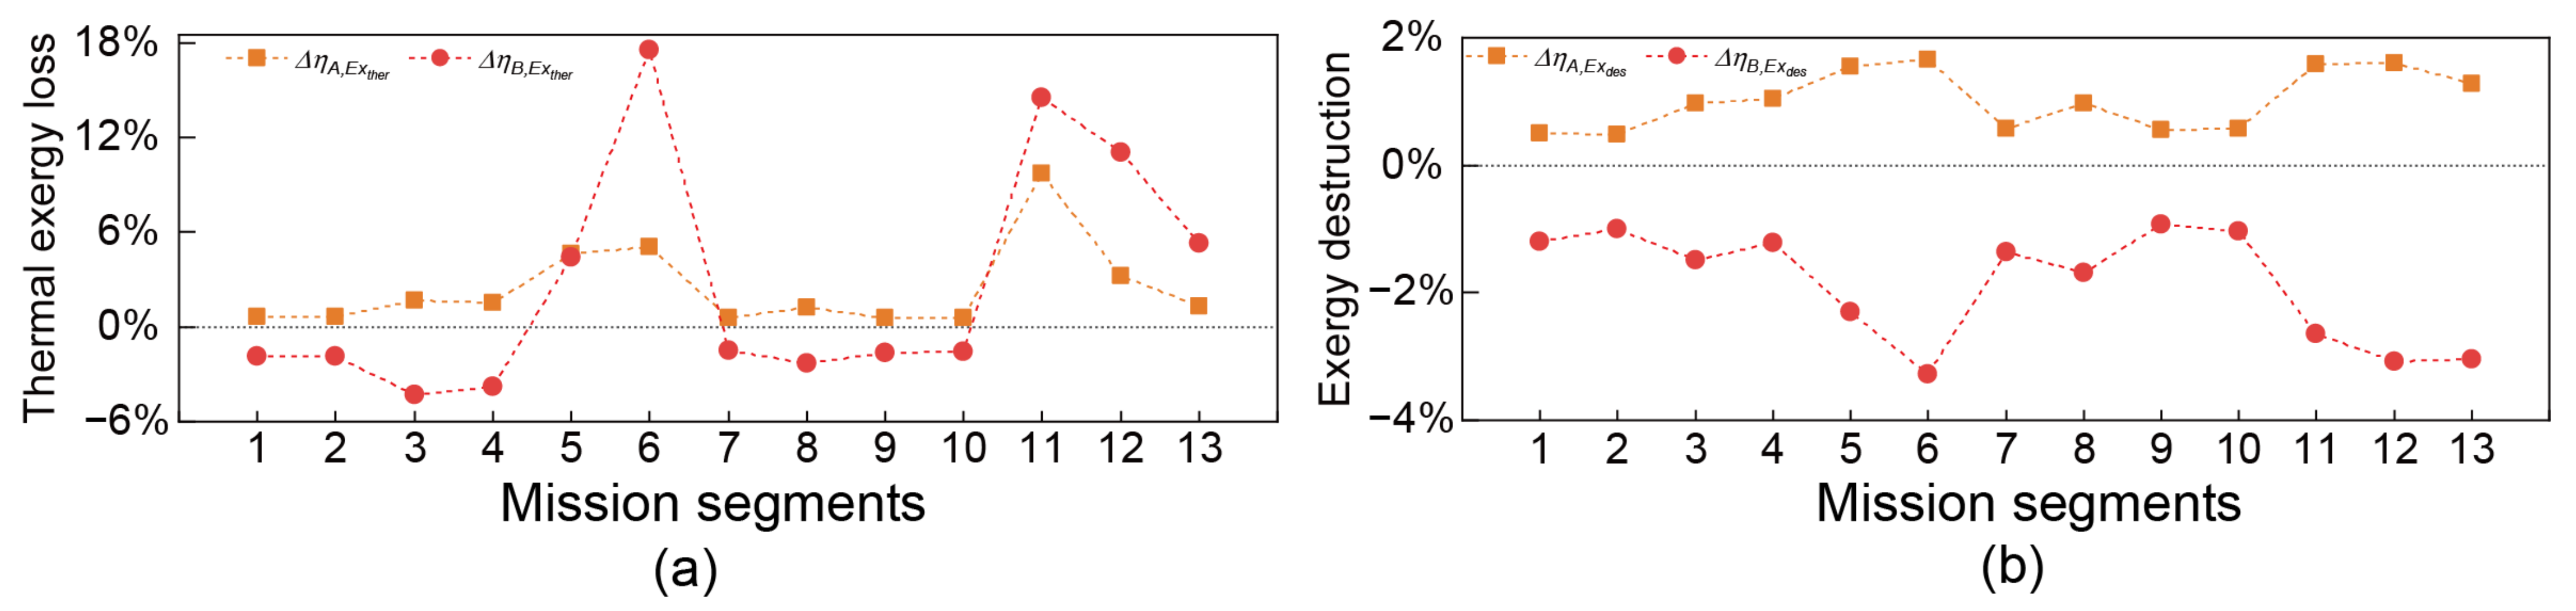
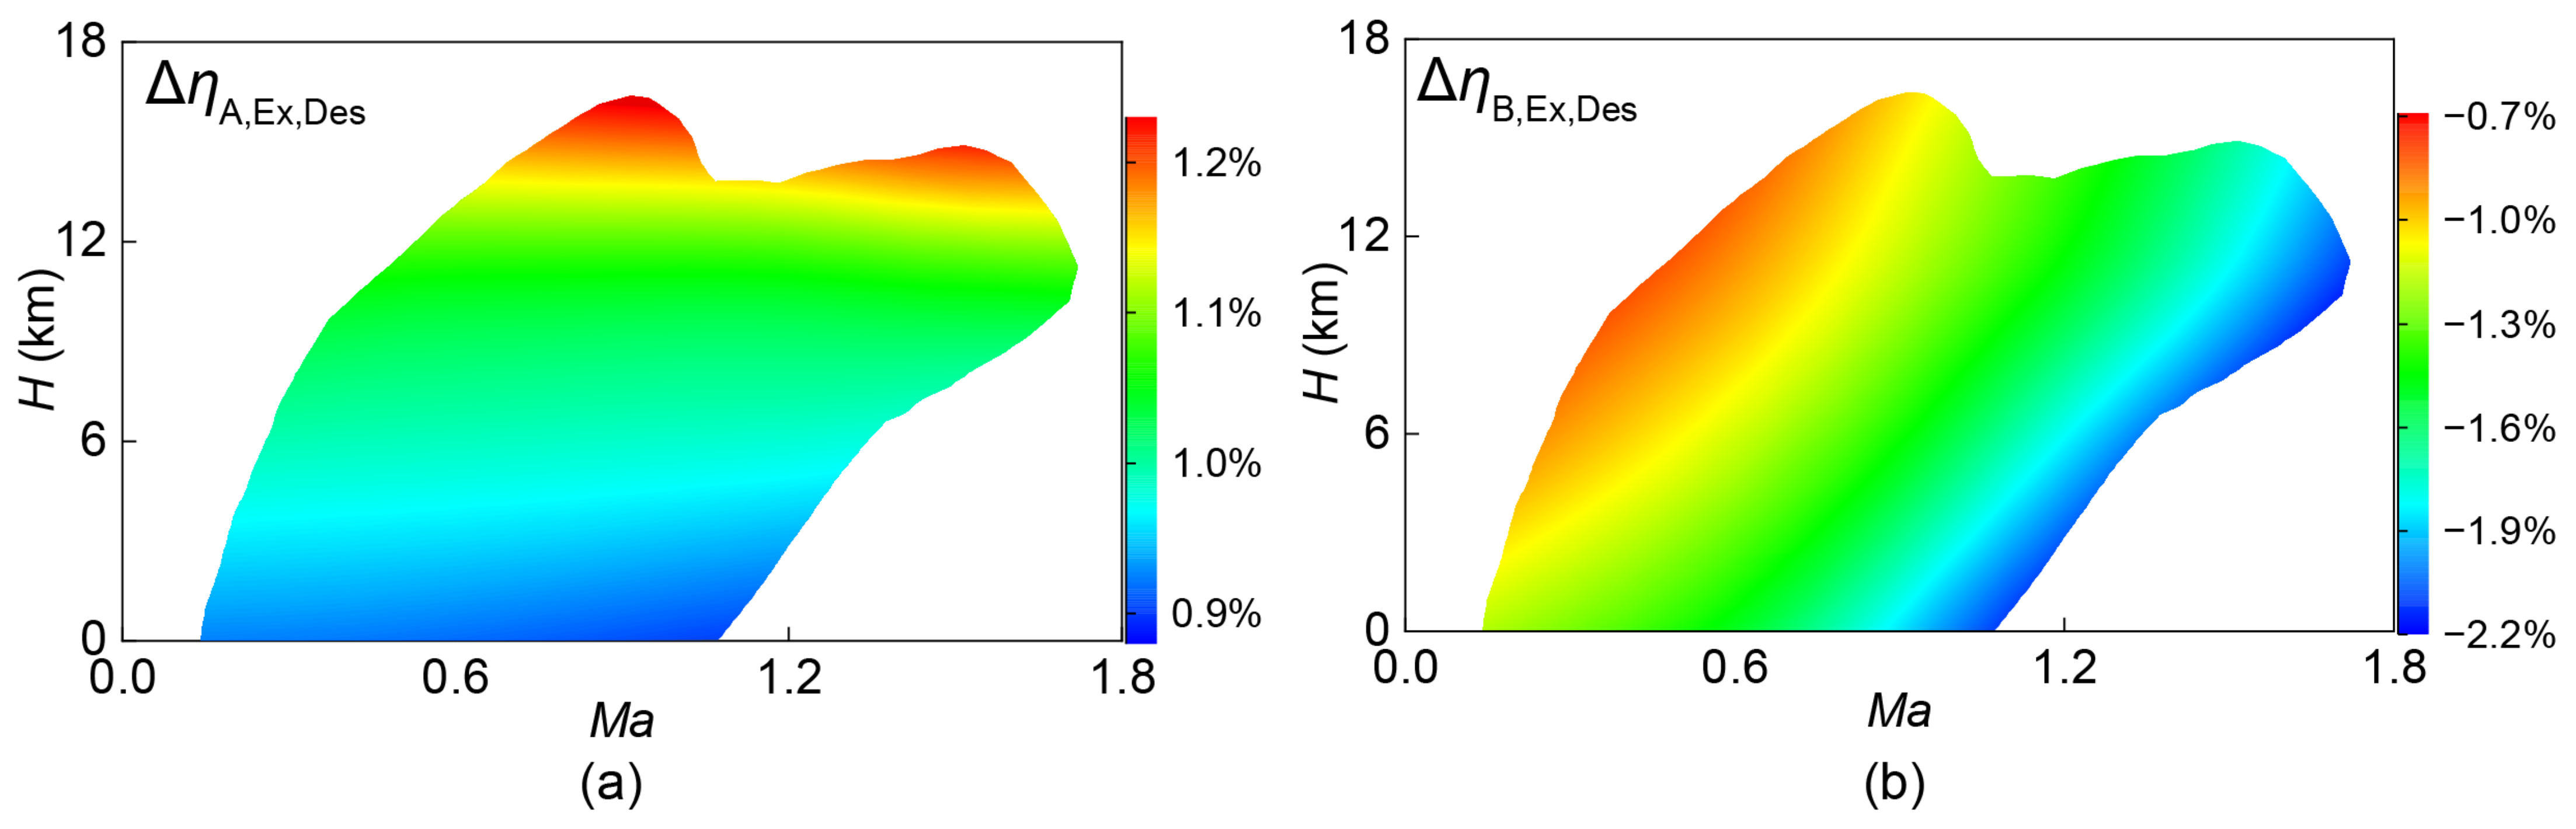
4.3. Effect of CCA Technology on Exergy Indicators Considering Flight Duration
5. Discussion
6. Conclusions
- (1)
- For the scheme using CCA technology without changing cycle parameters, the internal exergy destruction increases by 0.5~2% in high- and low-pressure turbines, the combustion chamber, and the CCA heat exchanger. The above destruction mainly occurred during the additional thermogenic heat transfer and flow friction process. Under the joint action of these destructions, the overall propelling exergy and efficiency of the engine appear to degrade.
- (2)
- For the other scheme applying CCA technology with optimizing cycle parameters, the specific optimization parameters are that the pressure ratio and turbine inlet temperature at the design point can be increased by 24.44% and 2.15%, respectively, under the requirements of the turbine blade wall temperature and the overall propulsion. The exergy destruction reduces about 0.5~2% for the takeoff, climb, cruise, and combat conditions, in which the unavoidable parts reduce by 1~3.5% and avoidable parts increase by 0.05%. Even if the exergy destruction shows a slight rise in the descend and land conditions, the sum of exergy destruction during the full flight mission still reduces by about 1.8%. These effects reflect in the overall performance of the engine, that is, to improve the propelling efficiency and reduce the aviation kerosene consumption.
- (3)
- By comparing the exergy indicators under different flight durations, the diminishing efficiency in descending and landing conditions has little effect on overall performance during the whole flight mission. By contrast, the total avoidable exergy destruction under supersonic/subsonic cruise, combat, and escape conditions is up to 90%, with great potential for improvement. It indicates that the flight duration is a crucial factor in total exergy destruction.
Author Contributions
Funding
Acknowledgments
Conflicts of Interest
Nomenclature
| A | Area |
| Bent | The number of elbows |
| BPR | Bypass ratio |
| C | Drag coefficient |
| cp | Heat capacity |
| D | Drag |
| d | Diameter |
| E | Energy |
| ex | Specific exergy |
| Ex | Exergy |
| f | Ratio of fuel and air flow mass |
| FN | The total thrust |
| FUNC | Function |
| g | Gravitational acceleration |
| Hei | Flight altitude |
| H | Enthalpy |
| h | Specific enthalpy |
| K | Heat transfer coefficient |
| k | Ratio of specific heat |
| L | Length |
| LHV | Low heat value |
| m | Mass flow |
| Ma | Mach number |
| n | Rotating velocity |
| N | Tube rows |
| Nu | Nusselt number |
| p | Pressure |
| Pr | Prandtl number |
| q | Kinetic pressure |
| Q | Heat |
| R | Gas constant |
| Re | Reynold number |
| S | Entropy |
| s | Tube pitch |
| sfc | Specific fuel consumption |
| T | Temperature |
| t | Time |
| v | Velocity |
| W | Power |
| Wei | Fighter weight |
| Greek symbols | |
| γ | Ratio of thrust to weight |
| τ | Time |
| η | Efficiency |
| ξ | fuel exergy grade function |
| δ | The thickness of the wall |
| β | Auxiliary line |
| θ | Correction factor |
| π | The ratio of pressure |
| Subscripts | |
| TO | Take off condition |
| P | Payload |
| PE | Expendable payload |
| PP | Permanent payload |
| F | Fuel |
| E | Empty |
| D | Flighting drag |
| L | Flighting lift |
| i | Flight mission segment |
| t | Total parameter |
| h | Hot side |
| c | Cold side |
| in | Inlet of heat exchanger |
| out | Outlet of heat exchanger |
| W | Wall |
| HEX | Heat exchanger |
| Superscripts | |
| −1 | Inverse function |
| Av | Avoidable |
| Un | Unavoidable |
References
- Balli, O. Exergy modeling for evaluating sustainability level of a high by-pass turbofan engine used on commercial aircrafts. Appl. Therm. Eng. 2017, 123, 138–155. [Google Scholar] [CrossRef]
- Balli, O. Advanced exergy analyses to evaluate the performance of a military aircraft turbojet engine (TJE) with afterburner system: Splitting exergy destruction into unavoidable/avoidable and endogenous/exogenous. Appl. Therm. Eng. 2017, 111, 152–169. [Google Scholar] [CrossRef]
- Roy, S.; Biswas, A.; Das, B.; Reddy, B.V. Flow control of a wind-turbine airfoil with a leading-edge spherical dimple. Int. J. Green Energy 2022, 3, 1–19. [Google Scholar] [CrossRef]
- Ji, Z.; Rokni, M.M.; Qin, J.; Zhang, S.; Dong, P. Energy and configuration management strategy for battery/fuel cell/jet engine hybrid propulsion and power systems on aircraft. Energy Convers. Manag. 2020, 225, 113393. [Google Scholar] [CrossRef]
- Roy, S.; Das, B.; Biswas, A. A comprehensive review of the application of bio-inspired tubercles on the horizontal axis wind turbine blade. Int. J. Environ. Sci. Technol. 2022, 3, 1–28. [Google Scholar] [CrossRef]
- Bruening, G.B.; Chang, W.S. Cooled cooling air systems for turbine thermal management. In Turbo Expo: Power for Land, Sea, and Air, Proceedings of the ASME 1999 International Gas Turbine and Aeroengine Congress and Exhibition, Indianapolis, IN, USA, 7–10 June 1999; American Society of Mechanical Engineers: New York, NY, USA, 1999; p. V003T01A002. [Google Scholar]
- Mucci, A.; Kholi, F.K.; Ha, M.Y.; Min, J.K.; Beecroft, P.; Chetwynd-Chatwin, J. Transient Performance Analysis of an Aero Gas Turbine Cooled Cooling Air Heat Exchanger. J. Eng. Gas Turbines Power 2020, 142, 111014. [Google Scholar] [CrossRef]
- Stepka, F.S. Considerations of Turbine Cooling Systems for Mach 3 Flight; National Aeronautics and Space Administration: Washington, DC, USA, 1968. [Google Scholar]
- Nikolaenko, V.; Filippov, G.; Jashenko, B.Y. The problem of reducing the thermal signature of an aircraft engine. Aerosp. MAI J. 2014, 21, 109–114. [Google Scholar]
- Baltman, E.; Tai, J.C.; Shi, M.; Mavris, D.N. An Investigation of Cooled Cooling Air for a Mach 2.2 Commercial Supersonic Transport. In Proceedings of the AIAA Propulsion and Energy 2021 Forum, Virtual, 9–11 August 2021; p. 3492. [Google Scholar]
- Gray, P.; Kestner, B.; Mavris, D. Parametric Heat Exchanger Design for Next Generation Advanced Vehicle and Propulsion System Analysis. In Proceedings of the 48th AIAA/ASME/SAE/ASEE Joint Propulsion Conference & Exhibit, Atlanta, GA, USA, 30 July–1 August 2012; p. 3920. [Google Scholar]
- Boyle, R.; Jones, S. Effects of Precooling Turbine Cooling Air on Engine Performance. In Proceedings of the ASME Turbo Expo 2009: Power for Land, Sea, and Air, Orlando, FL, USA, 8–12 June 2009; pp. 495–504. [Google Scholar]
- Kaushik, S.; Reddy, V.S.; Tyagi, S. Energy and exergy analyses of thermal power plants: A review. Renew. Sustain. Energy Rev. 2011, 15, 1857–1872. [Google Scholar] [CrossRef]
- Dehghani, M.J. Enhancing energo-exergo-economic performance of Kalina cycle for low-to high-grade waste heat recovery: Design and optimization through deep learning methods. Appl. Therm. Eng. 2021, 195, 117221. [Google Scholar] [CrossRef]
- Nazari, N.; Mousavi, S.; Mirjalili, S. Exergo-economic analysis and multi-objective multi-verse optimization of a solar/biomass-based trigeneration system using externally-fired gas turbine, organic Rankine cycle and absorption refrigeration cycle. Appl. Therm. Eng. 2021, 191, 116889. [Google Scholar] [CrossRef]
- Montazerinejad, H.; Ahmadi, P.; Montazerinejad, Z. Advanced exergy, exergo-economic and exrgo-environmental analyses of a solar based trigeneration energy system. Appl. Therm. Eng. 2019, 152, 666–685. [Google Scholar] [CrossRef]
- Sogut, M.Z. Assessment of small scale turbojet engine considering environmental and thermodynamics performance for flight processes. Energy 2020, 200, 117519. [Google Scholar] [CrossRef]
- Atılgan, R.; Turan, Ö.; Altuntaş, Ö.; Aydın, H.; Synylo, K. Environmental impact assessment of a turboprop engine with the aid of exergy. Energy 2013, 58, 664–671. [Google Scholar] [CrossRef]
- Balli, O.; Caliskan, H. On-design and off-design operation performance assessmentsof an aero turboprop engine used on unmanned aerial vehicles (UAVs) in terms of aviation, thermodynamic, environmental and sustainability perspectives. Energy Convers. Manag. 2021, 243, 114403. [Google Scholar] [CrossRef]
- Aygun, H.; Turan, O. Exergetic sustainability off-design analysis of variable-cycle aero-engine in various bypass modes. Energy 2020, 195, 117008. [Google Scholar] [CrossRef]
- Aygun, H.; Erkara, S.; Turan, O. Comprehensive exergo-sustainability analysis for a next generation aero engine. Energy 2022, 239, 122364. [Google Scholar] [CrossRef]
- Aygun, H.; Caliskan, H. Environmental and enviroeconomic analyses of two different turbofan engine families considering landing and take-off (LTO) cycle and global warming potential (GWP) approach. Energy Convers. Manag. 2021, 248, 114797. [Google Scholar] [CrossRef]
- Aygun, H.; Turan, O. Application of genetic algorithm in exergy and sustainability: A case of aero-gas turbine engine at cruise phase. Energy 2022, 238, 121644. [Google Scholar] [CrossRef]
- Kelly, S.; Tsatsaronis, G.; Morosuk, T. Advanced exergetic analysis: Approaches for splitting the exergy destruction into endogenous and exogenous parts. Energy 2009, 34, 384–391. [Google Scholar] [CrossRef]
- Şöhret, Y.; Açıkkalp, E.; Hepbasli, A.; Karakoc, T.H. Advanced exergy analysis of an aircraft gas turbine engine: Splitting exergy destructions into parts. Energy 2015, 90, 1219–1228. [Google Scholar] [CrossRef]
- Balli, O. Advanced exergy analyses of an aircraft turboprop engine (TPE). Energy 2017, 124, 599–612. [Google Scholar] [CrossRef]
- Zhuang, L.; Xu, G.; Liu, Q.; Li, M.; Dong, B.; Wen, J. Superiority analysis of the cooled cooling air technology for low bypass ratio aero-engine under typical flight mission. Energy Convers. Manag. 2022, 259, 115510. [Google Scholar] [CrossRef]
- Mattingly, J.D. Aircraft Engine Design; AIAA: Reston, VA, USA, 2002. [Google Scholar]
- Sellers, J.F.; Daniele, C.J. DYNGEN: A Program for Calculating Steady-State and Transient Performance of Turbojet and Turbofan Engines; National Aeronautics and Space Administration: Washington, DC, USA, 1975; Volume 7901. [Google Scholar]
- Koen, R.W. GENENG: A Program for Calculating Design and Off-Design Performance for Tuibojet and Turbofan Engine [R]; NASA-TND-6552; NASA: Washington, DC, USA, 1972. [Google Scholar]
- Wilcock, R.; Young, J.; Horlock, J. The effect of turbine blade cooling on the cycle efficiency of gas turbine power cycles. J. Eng. Gas Turbines Power 2005, 127, 109–120. [Google Scholar] [CrossRef]
- Canière, H.; Willockx, A.; Dick, E.; De Paepe, M. Raising cycle efficiency by intercooling in air-cooled gas turbines. Appl. Therm. Eng. 2006, 26, 1780–1787. [Google Scholar] [CrossRef]
- Li, H.; Huang, H.; Xu, G.; Wen, J.; Wu, H. Performance analysis of a novel compact air-air heat exchanger for aircraft gas turbine engine using LMTD method. Appl. Therm. Eng. 2017, 116, 445–455. [Google Scholar] [CrossRef] [Green Version]
- Walsh, P.P.; Fletcher, P. Gas Turbine Performance; John Wiley & Sons: Hoboken, NJ, USA, 2004. [Google Scholar]
- Cengel, Y.A.; Boles, M.A.; Kanoğlu, M. Thermodynamics: An Engineering Approach; McGraw-Hill: New York, NY, USA, 2011; Volume 5. [Google Scholar]
- Miller, B.A. Analysis of Several Methane-Fueled Engine Cycles for Mach 3.0 Flight; NASA-TN-D-4699; NASA Lewis Research Center: Cleveland, OH, USA, 1968. [Google Scholar]


| Location | F-119 Engine | Scheme A | Scheme B |
|---|---|---|---|
| m0 (kg/s) | 122.22 | 122.22 | 122.22 |
| mf (kg/s) | 2.50 | 2.50 | 2.40 |
| mf,ab (kg/s) | - | - | - |
| BPR | 0.3 | 0.3 | 0.3 |
| Pressure of engine at different locations (kPa) | |||
| P0 | 101.33 | 101.33 | 101.33 |
| P1 | 98.29 | 98.29 | 98.29 |
| P2 | 98.29 | 98.29 | 98.29 |
| P13 | 442.28 | 442.28 | 550.40 |
| P21 | 442.28 | 442.28 | 550.40 |
| P3 | 2565.25 | 2565.25 | 3852.78 |
| P31 | 2565.25 | 2565.25 | 3852.78 |
| P4 | 2488.29 | 2488.29 | 3737.20 |
| P41 | 2488.29 | 2488.29 | 3737.20 |
| P42 | 928.56 | 921.06 | 1131.87 |
| P45 | 928.56 | 921.06 | 1131.87 |
| P46 | 928.56 | 921.06 | 1131.87 |
| P47 | 446.79 | 438.59 | 468.64 |
| P5 | 446.79 | 438.59 | 468.64 |
| P16 | 442.28 | 439.28 | 547.81 |
| P6 | 430.31 | 423.80 | 463.23 |
| P7 | 417.40 | 411.09 | 449.34 |
| P9 | 404.88 | 396.81 | 440.31 |
| Temperature of engine at different locations (K) | |||
| T0 | 288.15 | 288.15 | 288.15 |
| T1 | 288.15 | 288.15 | 288.15 |
| T2 | 288.15 | 288.15 | 288.15 |
| T13 | 468.85 | 468.85 | 496.82 |
| T21 | 468.85 | 468.85 | 496.82 |
| T3 | 808.21 | 808.21 | 900.42 |
| T31 | 808.21 | 670.19 | 735.43 |
| T4 | 1860 | 1860 | 1900.00 |
| T41 | 1756.37 | 1743.92 | 1785.65 |
| T42 | 1457.30 | 1444.49 | 1424.18 |
| T45 | 1426.39 | 1408.06 | 1391.44 |
| T46 | 1405.80 | 1387.95 | 1373.42 |
| T47 | 1212.96 | 1194.67 | 1148.28 |
| T5 | 1203.20 | 1185.23 | 1140.77 |
| T16 | 541.45 | 541.45 | 584.47 |
| T6 | 1063.13 | 1048.82 | 1021.79 |
| T7 | 1063.13 | 1048.82 | 1021.79 |
| T9 | 1063.13 | 1048.82 | 1021.79 |
| Total thrust and specific fuel consumption | |||
| Total thrust (KN) | 105.88 | 103.69 | 105.90 |
| Specific fuel consumption (kg·s−1N−1) | 0.0858 | 0.0868 | 0.0826 |
| TW (K) | 1224.5 | 1163.8 | 1218.3 |
| Mission Phases | Mission Description | Engines Condition |
|---|---|---|
| P1-2 | Take off: H = 0 m, LTO = 285 m, MaTO = 0.2 | Military power |
| P2-3 | Acceleration 1: H = 0 m, Ma from 0.2 to 0.8 | Military power |
| P3-4 | Climb 1: H from 0 to 5500 m, Ma = 0.8 | Military power |
| P4-5 | Climb 2: H from 5500 to 11,000 m, Ma = 0.9 | Military power |
| P5-6 | Subsonic cruise 1: H = 11,000 m, Ma = 0.9, τsub,1 = 30 min | - |
| P6-7 | Descend 1: H = 9144 m, Ma = 0.9 | Idle power |
| P7-8 | Acceleration 2: Ma from 0.9 to 1.5 | Maximum power |
| P8-9 | Supersonic penetration: H = 9144 m, Ma = 1.5, τsup = 5 min | Military power |
| P9-10 | Combat air patrol: H = 9144 m, Ma = 1.5, n = 5 g, τcom = 2 min | Maximum power |
| P10-11 | Escape dash: H = 11,500 m Ma = 1.65, τes = 20 s | Military power |
| P11-12 | Subsonic cruise 2: H = 11,000 m, Ma = 0.9, τsub,2 = 30 min | - |
| P12-13 | Descend 2: H = 6000 m, Ma = 0.6 | Idle power |
| P13-14 | Land: H = 0 m, Ma = 0, Lland = 300 m | Idle power |
| Components | Governing Equations |
|---|---|
| INTAKE | |
| FAN | For the design point, the pressure ratio and efficiency are given, and for the off-design point, the pressure ratio and efficiency are the functions of rotational velocity and βFAN |
| HPC | Considering the inter-stage bleed air, the HPC model is divided into two parts: The pressure ratio before bleeding air is πHPC,1, and the other one is πHPC,2 |
| CC | |
| HPT | The HPT model is comprised of three processes: constant-pressure mixture of gas and cooling air in HPT stator, adiabatic expansion, and mixture in HPT rotor HPT rotor expansion: |
| LPT | The model of LPT could refer to HPT |
| MIXER | |
| AB | The model of AB is similar to CC |
| NOZZLE | Total thrust: |
| CCAHEX | Detail heat transfer and flow drop equations are presented in Ref. [33] |
| Component | Actual Case | Unavoidable Case | |
|---|---|---|---|
| Design Point | Off-Design Point | ||
| INTAKE | σINTAKE = 0.97 | Calculated from aircraft-engine thermodynamic model | σINTAKE = 0.99 |
| FAN | ηFAN = 0.87 | ηFAN = 0.905 | |
| HPC | ηHPC = 0.86 | ηHPC = 0.872 | |
| HEX | Δp = 3% | Δp = 1% | |
| CC | ηCC = 0.99, Δp = 3% | ηCC = 0.999, Δp = 1% | |
| HPT | ηHPT = 0.86 | ηHPT = 0.86 | |
| LPT | ηLPT = 0.86 | ηLPT = 0.86 | |
| MIXER | Δp = 3% | Δp = 1% | |
| AB | ηAB = 0.95, Δp = 3% | ηAB = 0.98, Δp = 1% | |
| NOZZLE | Δp = 3% | Δp = 1% | |
| Energy Analysis Method | Exergy Analysis Method | |
|---|---|---|
| Input terms | ||
| Output terms | ||
| Loss terms | ||
| Destruction terms | Disabled |
| State No. | Fluid Type | Energy Rate (kW) | Exergy Rate (kW) | ||||
|---|---|---|---|---|---|---|---|
| F-119 | Scheme A | Scheme B | F-119 | Scheme A | Scheme B | ||
| 0 | Air | 0 | 0 | 0 | 0 | 0 | 0 |
| 2 | Air | 0 | 0 | 0 | −307.9 | −307.9 | −307.9 |
| 13 | Air | 17,182.3 | 17,182.3 | 19,879.9 | 15,314.3 | 15,314.3 | 18,102.3 |
| 21 | Air | 5154.7 | 5154.7 | 5964.0 | 4594.3 | 4594.3 | 5430.7 |
| 31 | Air | 40,301.7 | 40,301.7 | 47,909.5 | 37,308.3 | 37,308.3 | 44,846.7 |
| 32 | Kerosene | 105,438.6 | 105,438.6 | 101,450.5 | 111,933.6 | 111,933.6 | 107,699.8 |
| 4 | Gas | 145,740.3 | 145,740.3 | 149,359.9 | 118,095.8 | 118,095.8 | 123,752.4 |
| 45 | Gas | 120,033.9 | 117,924.1 | 115,712.3 | 88,747.7 | 87,006.6 | 86,824.1 |
| 5 | Gas | 99,349.1 | 97,239.3 | 91,816.7 | 66,724.5 | 64,979.7 | 61,459.7 |
| 16 | Gas | 5154.7 | 5154.7 | 8529.1 | 7264.4 | 5482.8 | 6615.0 |
| 6 | Gas | 106,613.5 | 104,503.8 | 100,345.8 | 69,879.6 | 68,191.6 | 66,127.7 |
| 7 | Gas | 106,613.5 | 104,503.8 | 100,345.8 | 69,725.7 | 68,037.7 | 65,973.9 |
| 9 | Gas | 106,613.5 | 104,503.8 | 100,345.8 | 69,571.9 | 67,883.9 | 65,820.1 |
Publisher’s Note: MDPI stays neutral with regard to jurisdictional claims in published maps and institutional affiliations. |
© 2022 by the authors. Licensee MDPI, Basel, Switzerland. This article is an open access article distributed under the terms and conditions of the Creative Commons Attribution (CC BY) license (https://creativecommons.org/licenses/by/4.0/).
Share and Cite
Zhuang, L.; Xu, G.; Dong, B.; Liu, Q.; Li, M.; Wen, J. Exergetic Effects of Cooled Cooling Air Technology on the Turbofan Engine during a Typical Mission. Energies 2022, 15, 4946. https://doi.org/10.3390/en15144946
Zhuang L, Xu G, Dong B, Liu Q, Li M, Wen J. Exergetic Effects of Cooled Cooling Air Technology on the Turbofan Engine during a Typical Mission. Energies. 2022; 15(14):4946. https://doi.org/10.3390/en15144946
Chicago/Turabian StyleZhuang, Laihe, Guoqiang Xu, Bensi Dong, Qihang Liu, Mengchen Li, and Jie Wen. 2022. "Exergetic Effects of Cooled Cooling Air Technology on the Turbofan Engine during a Typical Mission" Energies 15, no. 14: 4946. https://doi.org/10.3390/en15144946
APA StyleZhuang, L., Xu, G., Dong, B., Liu, Q., Li, M., & Wen, J. (2022). Exergetic Effects of Cooled Cooling Air Technology on the Turbofan Engine during a Typical Mission. Energies, 15(14), 4946. https://doi.org/10.3390/en15144946