Article

Assessment of Hydrogen and Volatile Fatty Acid Production from Fruit and Vegetable Waste: A Case Study of Mediterranean Markets

by
Ester Scotto di Perta
1,2,*,
Alessandra Cesaro
2,
Stefania Pindozzi
1,3,
Luigi Frunzo
4,
Giovanni Esposito
2,* and
Stefano Papirio
2
1
Department of Agricultural Sciences, University of Naples Federico II, 80055 Portici, Italy
2
Department of Civil, Architectural and Environmental Engineering, University of Naples Federico II, 80125 Naples, Italy
3
BAT Center-Interuniversity Center for Studies on Bioinspired Agro-Environmental Technology, University of Naples Federico II, 80055 Portici, Italy
4
Department of Mathematics and Applications “Renato Caccioppoli”, University of Naples Federico II, Via Cintia, 80126 Naples, Italy
*
Authors to whom correspondence should be addressed.
Energies 2022, 15(14), 5032; https://doi.org/10.3390/en15145032
Submission received: 9 June 2022 / Revised: 8 July 2022 / Accepted: 8 July 2022 / Published: 10 July 2022
(This article belongs to the Section A5: Hydrogen Energy)

Abstract

:
This study investigates the dark fermentation of fruit and vegetable waste under mesophilic conditions (30–34 °C), as a valorization route for H2 and volatile fatty acids production, simulating the open market waste composition over the year in two Mediterranean countries. Specifically, the study focuses on the effect of the (i) seasonal variability, (ii) initial pH, and (iii) substrate/inoculum ratio on the yields and composition of the main end products. Concerning the seasonal variation, the summer and spring mixtures led to +16.8 and +21.7% higher H2 production than the winter/autumn mixture, respectively. Further investigation on the least productive substrate (winter/autumn) led to 193.0 ± 7.4 NmL of H2 g VS−1 at a pH of 5.5 and a substrate/inoculum of 1. With the same substrate, at a pH of 7.5, the highest acetic acid yield of 7.0 mmol/g VS was observed, with acetic acid corresponding to 78.2% of the total acids. Whereas a substrate/inoculum of 3 resulted in the lowest H2 yield, amounting to 111.2 ± 7.6 NmL of H2 g VS−1, due to a decrease of the pH to 4.8, which likely caused an inhibitory effect by undissociated acids. This study demonstrates that dark fermentation can be a valuable strategy to efficiently manage such leftovers, rather than landfilling or improperly treating them.

1. Introduction

Fruit and vegetable waste (FVW) is an abundant mixture made up of edible and non-edible leftovers deriving from wholesale market activities, which are widespread in the Mediterranean area for both economic and social aspects [1]. Specifically, some Mediterranean countries characterized by recent demographic development intensified the production of organic waste. As an example, FVW and kitchen waste account for about 50–65% of 2,825,000 (2018) and 3,330,000 (2020) tons in Tunisia and Jordan, respectively [1]. It was estimated in 2011 [2] that approximately 1728 million tons of FVW were produced per year worldwide, against 1.3 billion tons per year of food waste [3]. This waste is produced in the ultimate step of the food supply chain, relating to the unsold fresh products of the open market [4].
In this context, new regulated circular practices for the management of such putrescible waste are needed, with the aim to concomitantly control environmental pollution and promote different waste valorization schemes [5].
Due to the high content of water and easily biodegradable material, mainly simple carbohydrates [6], FVW is a favorable substrate for anaerobic processes aimed to produce biofuels and high-value molecules [7]. However, Morales-Polo et al. [8] showed that the incomplete development of anaerobic digestion, as well as low methane content, were due to the presence of carbohydrates such as lignocellulose, encouraging investigation of other routes of valorization. Among the main anaerobic processes used for treating different wastes [9], dark fermentation allows the simultaneous production of hydrogen (H2), volatile fatty acids (VFAs), and ethanol [10]. H2 is a good substitute for fossil fuels. Indeed, from H2 combustion, a great quantity of energy is released (122 kJ/g H2) without any CO2 production. VFAs and ethanol can be converted into methane or used for biodiesel production, or alternatively employed in bioplastic production [11].
Recently, an increasing interest has been given to the valorization of FVW through dark fermentation [12] for H2 and VFA production, as confirmed by the increasing number of peer-reviewed papers on this topic (Figure S1). However, the main parameters affecting the dark fermentation of FVW, including pH, temperature, and the substrate/inoculum (S/I) ratio [13] have only been scarcely investigated [6]. Moreover, the waste composition has not always been specified, and dissimilar results are often reported. An initial pH correction has been observed to be crucial to divert the conversion of chemical oxygen demand (COD) to either H2 or VFA production [14]. Dwivedi et al. [6] showed an increasing H2 production from FVW when raising the pH, with an optimal pH range of 7.0–7.5. Tsigkou et al. [11] found the highest H2 production at a pH of 6.0 for homogenized FVW from a supermarket. On the other hand, as indicated by Zheng et al. [15], pH influences the end product composition and the rates of the hydrolysis and acidification stages, depending on the main prevailing biochemical pathways occurring (i.e., ethanol-, mixed acid-, propionic acid-, or the butyric acid-type).
In this context, the physical–chemical FVW characteristics, highly dependent on the local waste composition and seasonal variability [4,5,16], are a relevant aspect barely investigated to better evaluate how a substrate is inclined to anaerobic degradation. Indeed, the substrate composition affects H2 yield and production rate [17]. Moreover, as suggested by Lee et al. [18], the type of substrate determines the most favorable pH value for producing a specific VFA. Thus, further investigations on seasonal variability need to be performed, also as useful information for the operation of industrial-scale plants over a calendar year.
This study investigates, for the first time, the H2 yield and VFA composition and production from the dark fermentation of the typical FVW collected over a year from the open markets located in Amman (Jordan) and Sfax (Tunisia). For this purpose, three sets of batch tests were carried out under mesophilic conditions (30–34 °C) and different process parameters combinations, in order to assess the effect of the (i) FVW seasonal variability, (ii) initial pH, and (iii) S/I ratio on the yields and composition of the main dark fermentation products. Moreover, experimental cumulative H2 yield, VFA production, and kinetic parameters were used to identify the possible valorization routes of FVW via dark fermentation.

2. Materials and Methods

2.1. Substrate Preparation

After an appropriate survey, three waste compositions were found to match the typical FVW mixture produced in the wholesale markets of Amman (Jordan) and Sfax (Tunisia) over the winter–autumn, spring, and summer seasons. Particularly, all FVW compositions are characterized by the typical Mediterranean vegetables and fruit, wherein fruit makes up 36, 43, and 53% of the winter–autumn, spring, and summer wastes, respectively. The detailed FVW compositions used in this study are provided in the Supplementary Materials (Table S1). The leftover materials, collected from supermarkets situated in Naples (Campania region, Italy), were reduced into small pieces with a blender and sieved through a 5 mm sieve prior to being stored in plastic bags at −20 °C, as suggested by Holliger et al. [19].
The chopping and sieving operations of FVW are shown in the Supplementary Materials (Figure S2).

2.2. Source and Pretreatment of the Inoculum

The inoculum was a sewage sludge obtained from the municipal wastewater plant of Cuma (Campania region, Italy, 40°52′21.8″ N 14°03′44.9″ E). After the collection, the sewage sludge was pre-incubated under mesophilic conditions (34 °C) for 50 days, with the aim to continue the degradation of the remaining biodegradable organic matter and eliminate the endogenous biogas production [20]. Before each trial, the inoculum was thermally pretreated at 105 °C for 4 h according to Ghimire et al. [13], in order to avoid methanogenic activity and enhance the spore-forming fermentative bacteria (e.g., Clostridium spp.), leading to the H2 and VFA production [21]. Clostridia have been considered the leading H2 producers, even though some of them can convert H2 and CO2 to acetate [17]. Table 1 reports the inoculum characteristics.

2.3. Set-Up of the Batch Biochemical Hydrogen Potential Tests

Three sets of batch biochemical hydrogen potential (BHP) experiments, according to the experimental design of Ghimire et al. [21], were carried out using 500 mL GL 45 glass bottles (Schott Duran, Wertheim, Germany), filled with 150 mL of inoculum, substrate, and water till reaching 250 mL. Mesophilic conditions (30–34 °C) were maintained by means of a hot water bath [22]. The monitoring period generally varied from 4 to 6 days, depending on the duration of H2 production. Table 2 summarizes the experimental conditions used in the three batch sets.
Set 1 was conducted by varying the seasonal FVW composition (i.e., using all three FVW mixtures individually) with an S/I of 1 and not adjusting the initial pH. Experimental results of set 1 addressed the further investigations of sets 2 and 3, aiming at identifying the possible valorization routes of the least-H2-producing substrate (winter–autumn substrate) via dark fermentation. Set 2 was performed under seven different initial pH conditions: 5.5, 6.0, 6.5, 7.0, 7.5, 8.0, and a not-adjusted pH. Before starting the tests, the pH in each bottle was adjusted to the desired initial value using 1 M of HCl and 1 M of NaOH solutions. Set 3 was carried out using an S/I ratio of 1, 2, and 3. The initial pH was not adjusted.

2.4. Analytical Methods

The hydrogen produced was measured daily for the whole test duration using a volumetric displacement method, as described by Esposito et al. [22]. The H2 yield was evaluated as the ratio between the final cumulative H2 production, normalized at 0 °C and 1 atm (N mL), and the amount of substrate added at the beginning of the test expressed in terms of volatile solids (VS). To evaluate the H2 percentage in the biogas produced, the gas composition was monitored every day using a Star 3400 gas chromatograph (Varian, Palo Alto, CA, USA).
Standard Methods [23] were considered for measuring TS and VS content, tCOD and sCOD, total ammonia nitrogen (TAN), and total alkalinity (TA). The total and soluble carbohydrate contents were measured according to Dubois et al. [24]. The total COD and carbohydrate contents in the three substrates were determined by using the solid dilution approach described by Noguerol-Arias et al. [25] on a wet basis. Liquid samples were collected every day from each bottle for pH and VFA determinations. The pH was measured with a pH/ION 340i pH meter (WTW, Germany). After centrifugation for 10 min at 14,500 rpm and 0.22 μm membrane filtration, VFAs were analyzed using high-performance liquid chromatography (HPLC) by means of a UVD 340U HPLC system (Dionex, Sunnyvale, CA, USA), equipped with a diode array detector and a Metrosep organic acid column 250/7.8 (Metrohm, Herisau, Switzerland). A water solution with 1% H2SO4 was used as a mobile phase at a flow rate of 0.7 mL/min.
The acidification process was quantified by evaluating the VFAs yield, expressed as the daily produced VFA (mmol) per gram of substrate added (as VS) at the beginning of the experiments [26]. Lactic acid and ethanol yields were also expressed as a mmol per gram of substrate added (as VS). Moreover, the main end-product concentration was expressed as the concentration of the acetic acid equivalent (g HAc/L), by dividing the VFA molecular mass and multiplying the acetic acid molecular mass.

2.5. Kinetic Modeling and Statistical Analysis

In order to compare the results among the different batch experiments performed in this study, the kinetic parameters of fermentative H2 production were evaluated using three different models: the modified Gompertz model [27] (Equation (1)), the first-order kinetic [28] (Equation (2)), and the modified Logistic model [29] (Equation (3)):
H = P   · e { e [ R m · e P   ·   ( λ t ) + 1 ] } ,
H = P · [ 1 e (   k hyd · t ) ]
H = P 1 + e [ 4 R m · ( λ t ) P + 2 ]
where H is the cumulative H2 production, P is the maximum H2 production (mL H2/g VS), Rm is the maximum H2 production rate (mL H2/h), λ is the lag phase duration (h), t is the time, and khyd is the hydrolysis rate constant (1/h). In addition, t95, the time to reach 95% of the maximum H2 yield, was also calculated, using Equation (4):
t 95 = P R m · e ( 1 ln ( ln 0.95 ) ) + λ ,
where t95 is a useful parameter to determine the H2 production rate and allows a comparison between the kinetics obtained under different experimental conditions [9,19].
The cumulative H2 production curves were fitted with the model by means of the IBM SPSS Statistics V. 26 software, with an associated 95% confidence limit. An analysis of variance (ANOVA) was used to test the significance of the estimated parameters.
Finally, a residual sum of squares (RSS) (Equation (5)), root mean squared error (RMSE) (Equation (6)), and determination coefficient (R2) (Equation (7)) were used to test and choose the most appropriate models fitting the experimental data [30].
RSS = i = 1 N ( y prd , i y Act , i ) 2
RMSE = 1 N i = 1 N ( y prd , i y Act , i ) 2
R 2 = 1 i = 1 N ( y prd , i y Act , i ) 2 i = 1 N ( y prd , i y m ) 2
where yprd,i and yAct,i are the predicted and real values of H2 production, ym is the average value of real H2 production, and N is the total number of estimates.

3. Results and Discussion

3.1. Physical–Chemical Characteristics of the Fruit and Vegetable Waste

Table 3 summarizes the physical–chemical characteristics of the three FVW mixtures used in this study. As also indicated by Tsigkou et al. [11], FVW is characterized by a high moisture content (higher than 90% in all seasons) and a percentage of VS over TS of more than 88%. The annual mean VS content accounts for 89.60 g/kg, which is similar to 87.40 g/kg reported by Edwiges et al. [2], based on an average marketplace composition over a one-year period. Particularly, fruit represented 36, 43, and 53% of the winter–autumn, spring, and summer wastes (on a wet basis), respectively (Table S1). Different VS contents have been reported in other studies: 77.20 [31], 120.00 [15], 141.00 [32], and 101.03 g/kg [11]. The average tCOD content found in this study was 1076.60 g COD/kg VS, while the total carbohydrates content was 813.77 g/kg VS. As for previous parameters, different values are reported in the literature: 2098.72 [31], 750.00 [15], 1114.89 [32], and 1020.00 g COD/kg VS [11]. The total carbohydrate content of 638.72 g/kg VS was reported by Tsigkou et al. [11]. These findings highlight the great variability of this kind of substrate, due to different FVW compositions and sources, confirming the importance of studies targeting substrate composition.
Concerning the season characteristics (Table 3), the winter–autumn substrate resulted in the highest tCOD and total carbohydrates content, but also the lowest ratios between sCOD and tCOD (i.e., 47%) and soluble and total carbohydrates (i.e., 58%), likely indicating a not prompt availability to the bacterial conversion. On the other hand, the summer substrate was characterized by the highest concentration of soluble components, which accounted for 91% of the total carbohydrates and 88% of the tCOD. The main difference among the mixtures used is likely related to a different solubility of the substrates [4], expressed as sCOD/tCOD (%), which gives information on the presence of easily biodegradable COD. The summer FVW mixture resulted in the highest (87.96%) percentage of easily biodegradable matter, probably due to the higher content of fruits. A lower sCOD/tCOD (24.09%) for laboratory-prepared residues from vegetable and fruit wholesale markets was reported by Morales-Polo et al. [16], who demonstrated the variability of substrates, whose composition is due to factors such as level of sale, consumer inclination, and season [8].

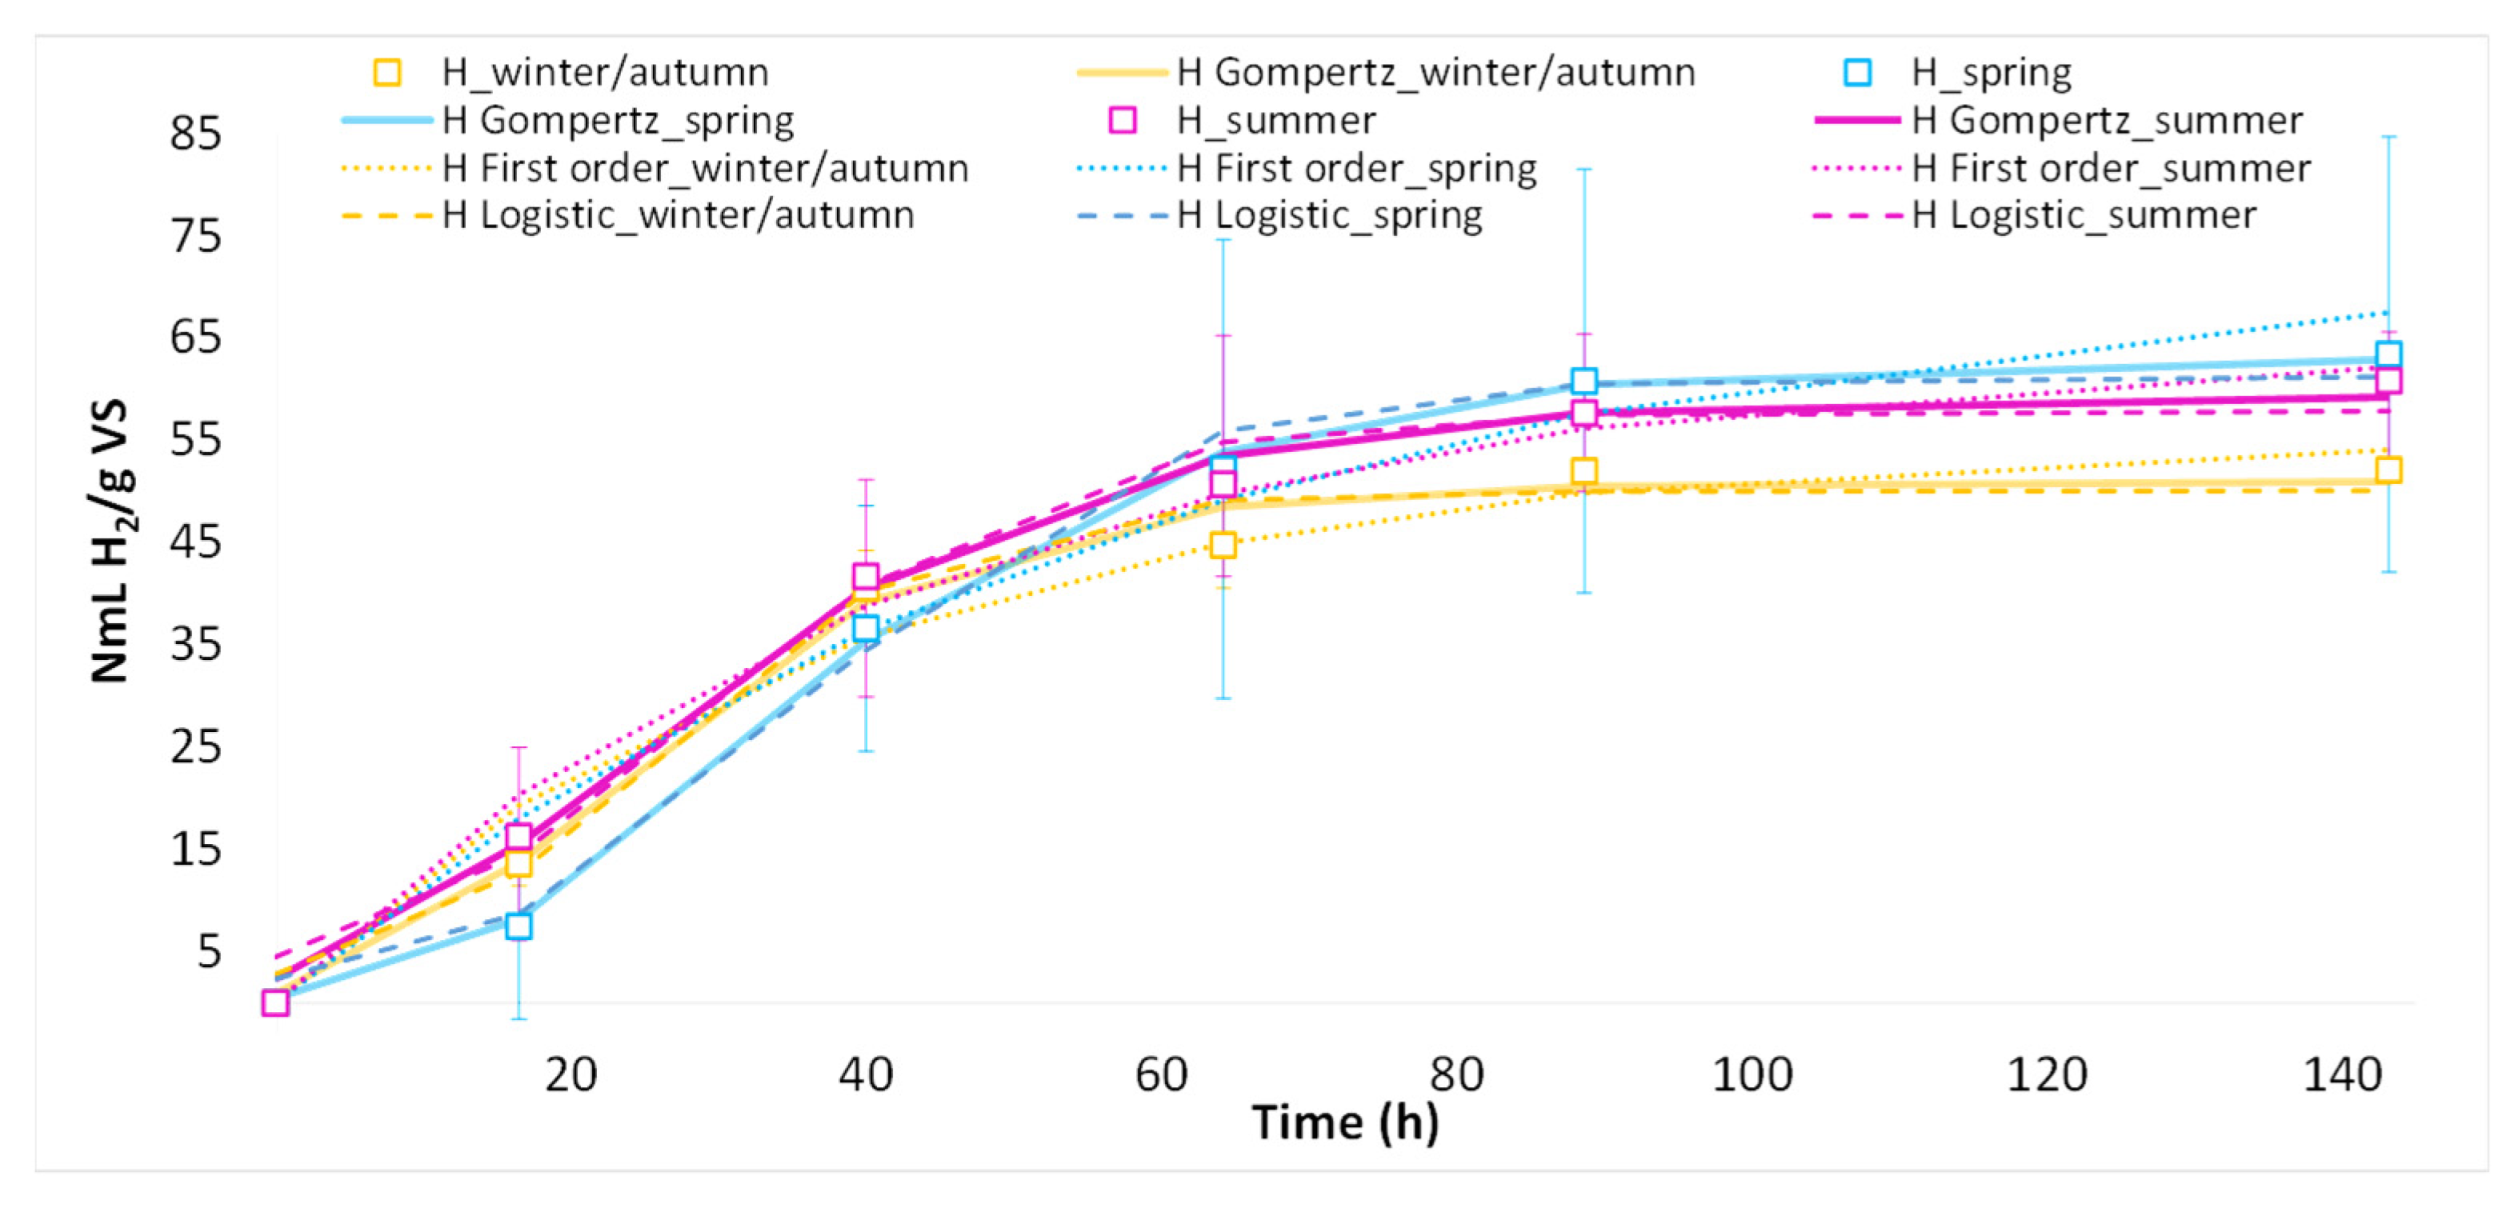
3.2. Effect of Seasonal Variation on H2 Yield and VFA

Comparing the fermentation of the three FVW seasonal compositions, similar specific H2 yields were observed. Particularly, the summer and spring FVW compositions resulted in a 16.8 and 21.7% higher specific H2 production compared to that obtained with the winter/autumn mixture, respectively, which was 52.1 ± 0.5 NmL of H2/g VS (Figure 1).
RMSE and R2 were used to evaluate the outcomes of model fitting (Table 4), showing that the Gompertz model minimizes the errors for all seasons and with an R2 > 0.99.
As reported in the Supplementary Materials (Table S2), kinetically, the three different substrates entailed H2 production rates ranging between 1.2 and 1.3 mL/h, as indicated by the modified Gompertz model used to fit the experimental H2 production and the lag time differed among the substrates used. Specifically, the highest lag time (11.2 h) was associated with the spring substrate, while the summer FVW mixture resulted in the lowest lag time (3.3 h). This outcome agrees with the higher soluble carbohydrates content (i.e., 727.79 ± 58.51 mg/g VS) and sCOD/tCOD (87.96%) observed in the summer mixture, indicating a higher substrate bioavailability and biodegradability potential. Moreover, a slightly lower hydrolysis rate constant (Table S2) was found in the case of winter/autumn substrate, which confirms the lowest sCOD/tCOD value of 46.75%.
As a confirmation, the slightly higher productions of acetic and butyric acid were obtained with the summer FVW mixture, which accounts for 11.62 and 1.46 mmol/g VS, respectively (Figure 2). Similar values of propionic acid were observed for all substrates. A total of 1.5 mmol/g VS of ethanol was produced from the fermentation of the winter/autumn substrate. This presence can explain the lower H2 production observed for the winter mixture from 64 h onwards. As also suggested by Ghimire et al. [17], the metabolic pathway leading to the production of ethanol hinders the substrate conversion towards H2 production. Nonetheless, the overall VFA and lactic acid concentrations for all substrates were found to be similar (3.2–3.5 g Hac/L). Based on these results, it is possible to suppose that changing process parameters, such as pH and S/I ratio, would have a similar effect on all substrates since differences among seasons in terms of main products were not considerably relevant. For this reason, in the following tests, the only winter–autumn substrate has been considered.
The pH profiles during the tests are shown in Supplementary Materials (Figure S3).

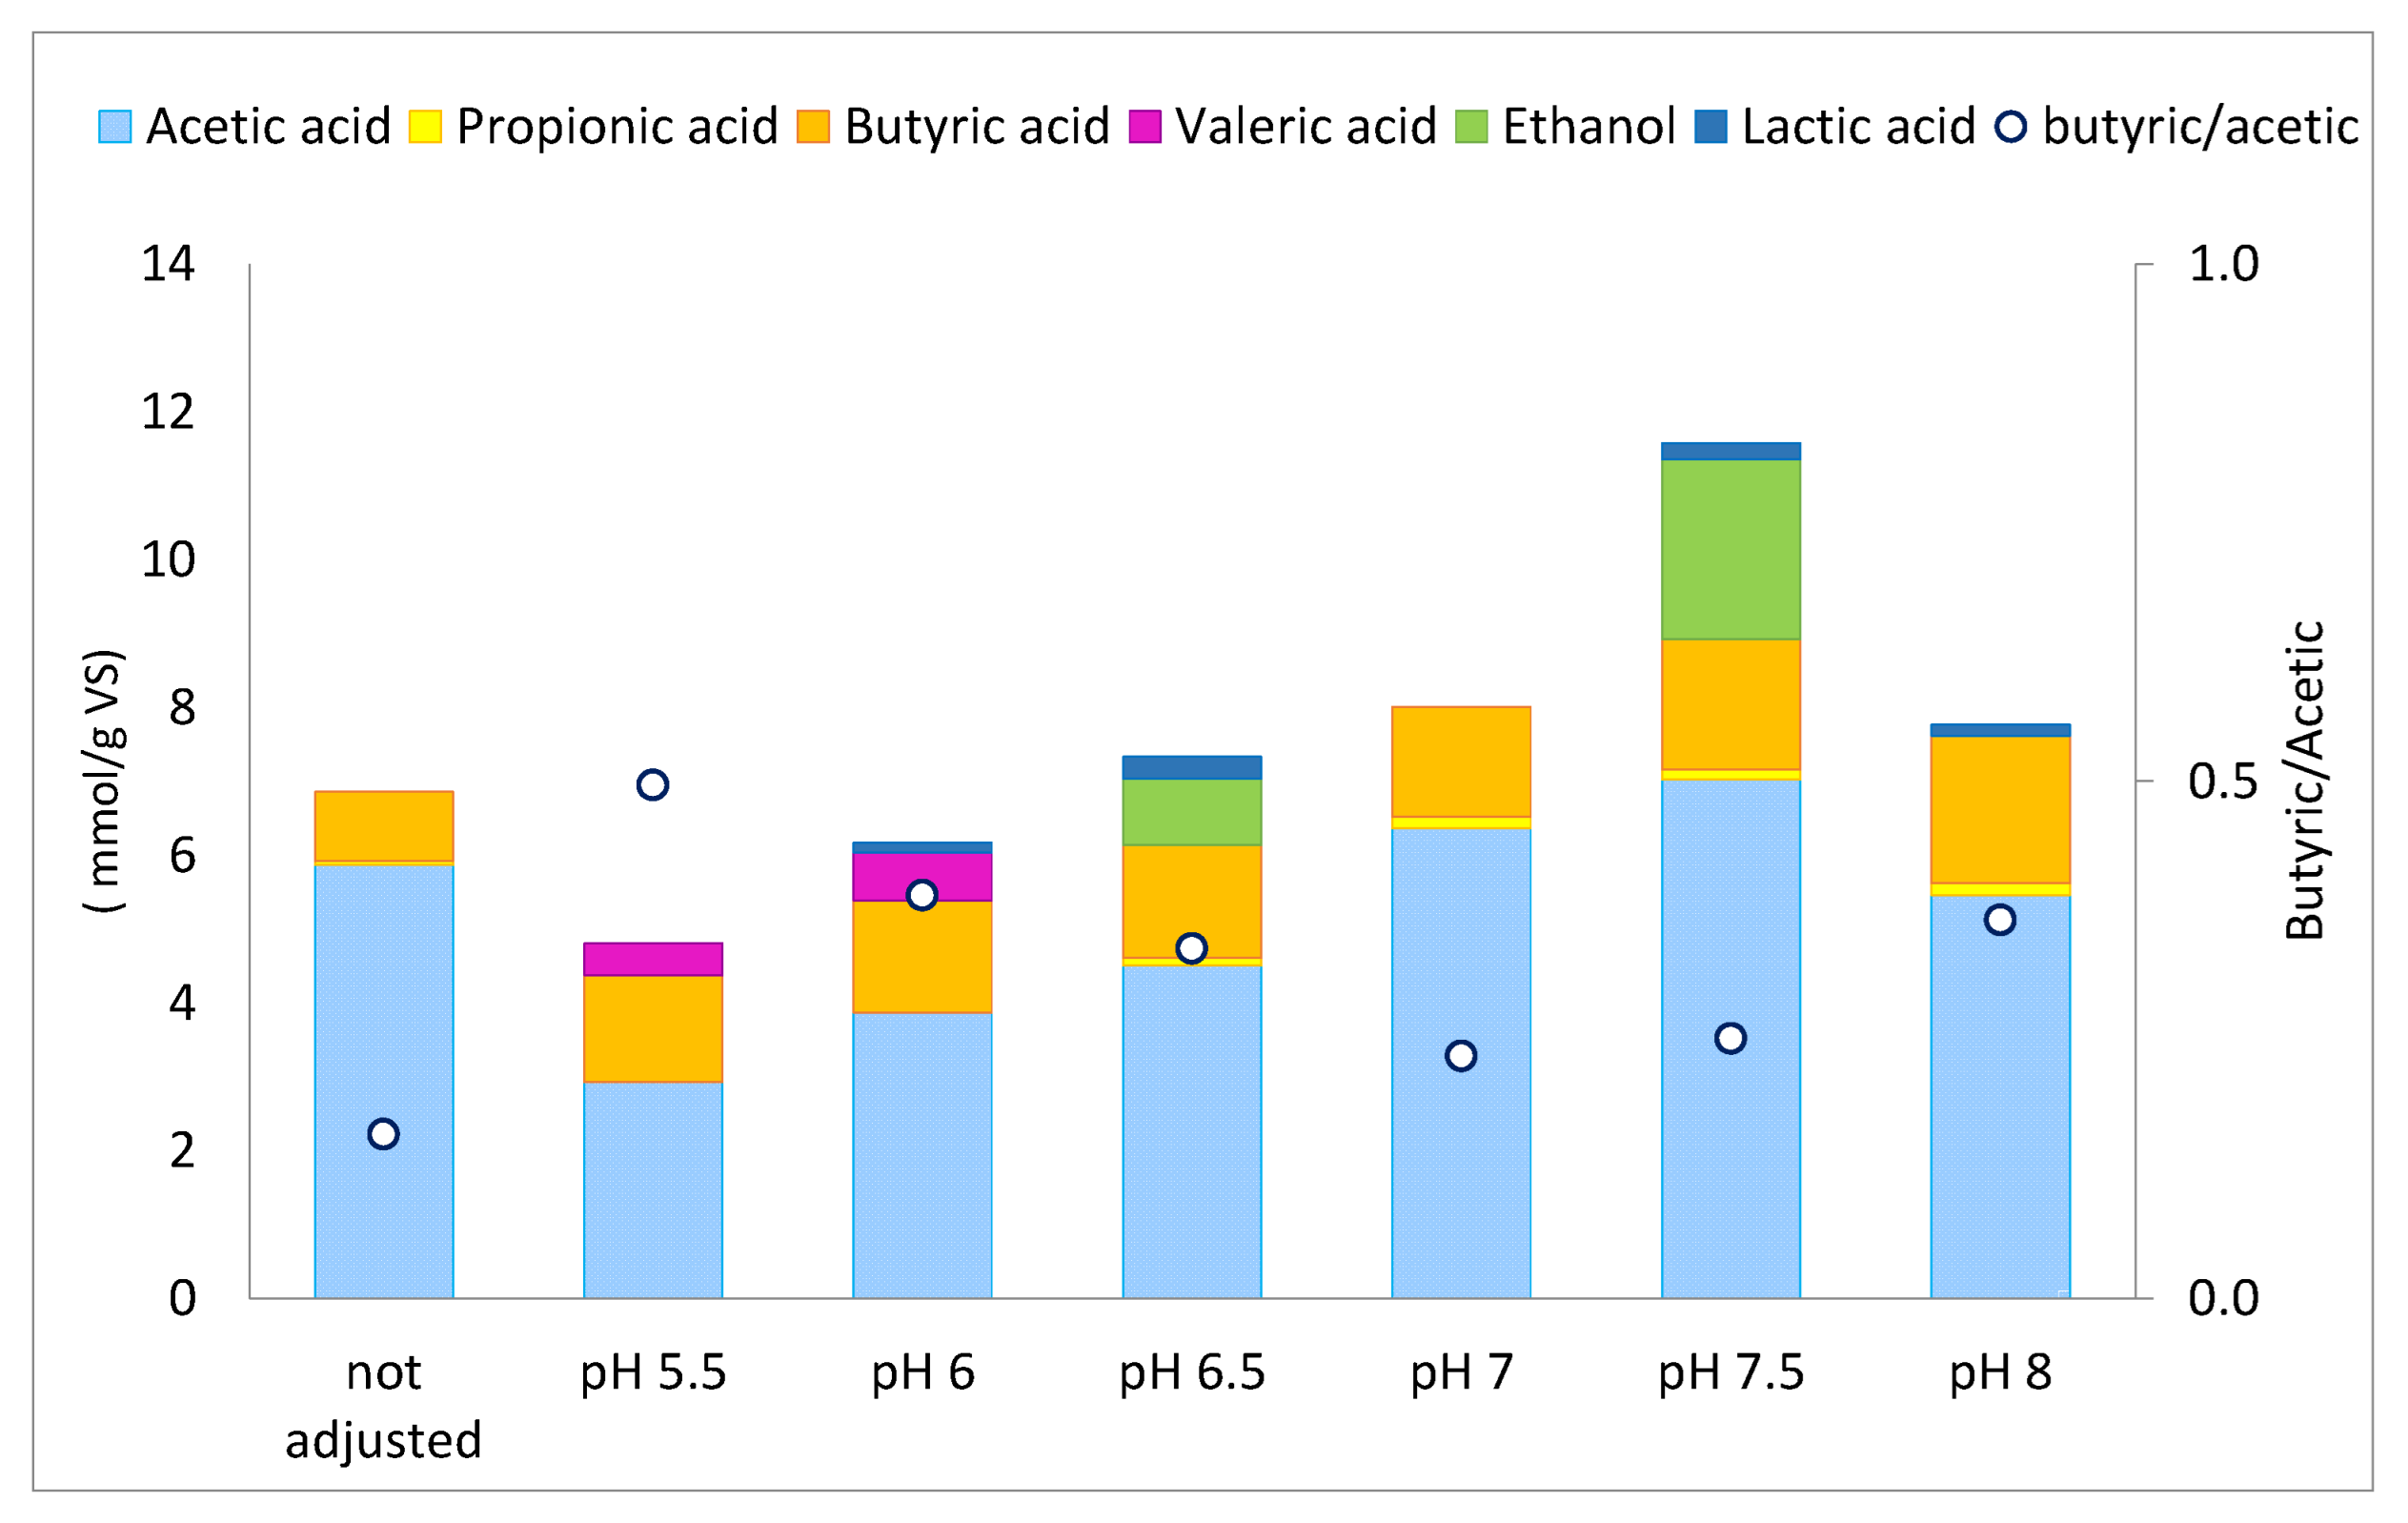
3.3. Effect of Initial pH on H2 Yield and VFA Production and Composition

The experimental cumulative H2 production and the three fitting models (i.e., modified Gompertz model, first-order, and modified Logistic model) curves obtained at different initial pH conditions are shown in Figure 3. The highest H2 yield of 193.0 ± 7.4 NmL of H2/g VS was achieved at a pH of 5.5, followed by the H2 yields (i.e., 174.3 ± 29.2, 158.9 ± 12.4, 115.1 ± 24.5, and 100.5 ± 10.1 NmL of H2/g VS) obtained at pH values of 6.0, 6.5, 7.5, and 8.0, respectively. The lowest final cumulative H2 productions of 97.8 ± 25.7 and 86.7 ± 4.8 NmL of H2/g VS were found in the conditions of not-adjusted pH and at an initial pH of 7.0, respectively.
Hence, the results show how the initial pH considerably affected the cumulative H2 production, as also reported in other previous studies [6,17,33]. Ghimire et al. [17] showed that H2 was the preferred metabolic product at a lower pH. In contrast to Dwivedi et al. [6], a pH of 7.0 proved here to be less suitable for H2 production from FVW, probably due to the H2 consumption by homoacetogens, which led to a higher acetic acid production (Figure 4).
Based on the values of RMSE and R2 (Table 5) of the models investigated, it is possible to observe that the Gompertz model described well the conditions of pH 5 and not adjusted pH. On the other hand, the first order kinetics model provided a good fit to cumulative H2 production under the remaining conditions. Results are in a good agreement with Tena et al. [30], who found that the modified Gompertz model was not always the best model describing the evolution of hydrogen production.
As indicated by the parameters of the modified Gompertz model and first-order kinetics, reported in Supplementary Materials (Table S3), the use of an initial pH of 5.5 led to the highest lag time (9.6 h) and the lowest hydrolysis rate constant (0.04 h−1), suggesting that the bacteria needed a longer time to adapt to a pH of 5.5, but also the highest H2 production rate and final H2 yield. On the other hand, a pH of 7.0 resulted in the lowest H2 production rate and final yield. The shortest time required to achieve 95% of the maximum H2 yield (lower than 24 h) was obtained at a pH of 7.5. Generally, all t95 values were within 2 days, confirming the high FVW biodegradability and the fast kinetics.
Figure 4 illustrates the total VFA specific production, VFA composition, and the butyric/acetic (B/A) ratio under the different initial pH conditions. The B/A ratio is a good indicator of the occurrence of the H2-producing metabolism, as suggested by Ghimire et al. [13]. Indeed, the predominance of the butyric–acetic pathway was observed at a pH of 5.5, corresponding to the highest H2 production. On the contrary, the lower B/A ratio observed at higher pH values indicates a lower predominance of the H2-producing metabolism. The lower H2 production associated with the higher acetic acid concentration (i.e., at a pH of 7) might also suggest the occurrence of homoacetogenic activity. Methane was not detected in the biogas at any time.
As observed for H2, the different initial pH conditions affected the total VFA concentration and composition [18]. The highest conversion of the substrate to VFAs and lactic acid (i.e., 9.2 mmol/g VS) was obtained at a pH of 7.5, while the lowest value (i.e., 4.9 mmol/g VS) was obtained at a pH of 5.5. Indeed, as indicated by Guo et al. [34], the concentration of the metabolic products can be affected by the homoacetogenic activity, which is responsible for acetate formation to the detriment of H2. Moreover, at a lower pH, the acetic acid yield was the lowest, amounting to 2.9 and 3.9 mmol/g VS at a pH of 5.5 and 6.0, respectively. The presence of ethanol at a pH of 6.5 and 7.5 explains the lower H2 yield obtained, as the pathway of ethanol–acetate halves the stoichiometric H2 production [17], which entails 4 mol of H2 for a mole of glucose along the acetate pathway. At a pH of 7.5, the highest acetic acid yield of 7.0 mmol/g VS, corresponding to a concentration of 4.0 g/L, was observed. These results are in good agreement with Tsigkou [11], who observed an increase in VFA concentration for a high pH, during the dark fermentation of homogenized FVW. Conversely to this study, acetic acid concentrations accounted for 12.2 and 11.9 g/L at pH values of 6.5 and 7.5, respectively, due to the higher initial substrate VS concentration of 29.3 g VS/L, compared to the 10.0 g VS/L of this study (Table 2).
A decreasing trend in the pH was observed during the trial, because of the consumption of alkalinity during the hydrolysis and fermentation stages [35]. The final pH value was approximately 5.0 under all conditions, likely due to the low buffer capacity of the inoculum (i.e., 1625 mg CaCO3/l). The most remarkable pH decrease was observed for the conditions at a higher initial pH, which also corresponded to the highest VFA and lactic acid concentrations observed (i.e., 4.8–5.2 g HAc/L). The pH profiles during the tests are shown in the Supplementary Materials (Figure S4).

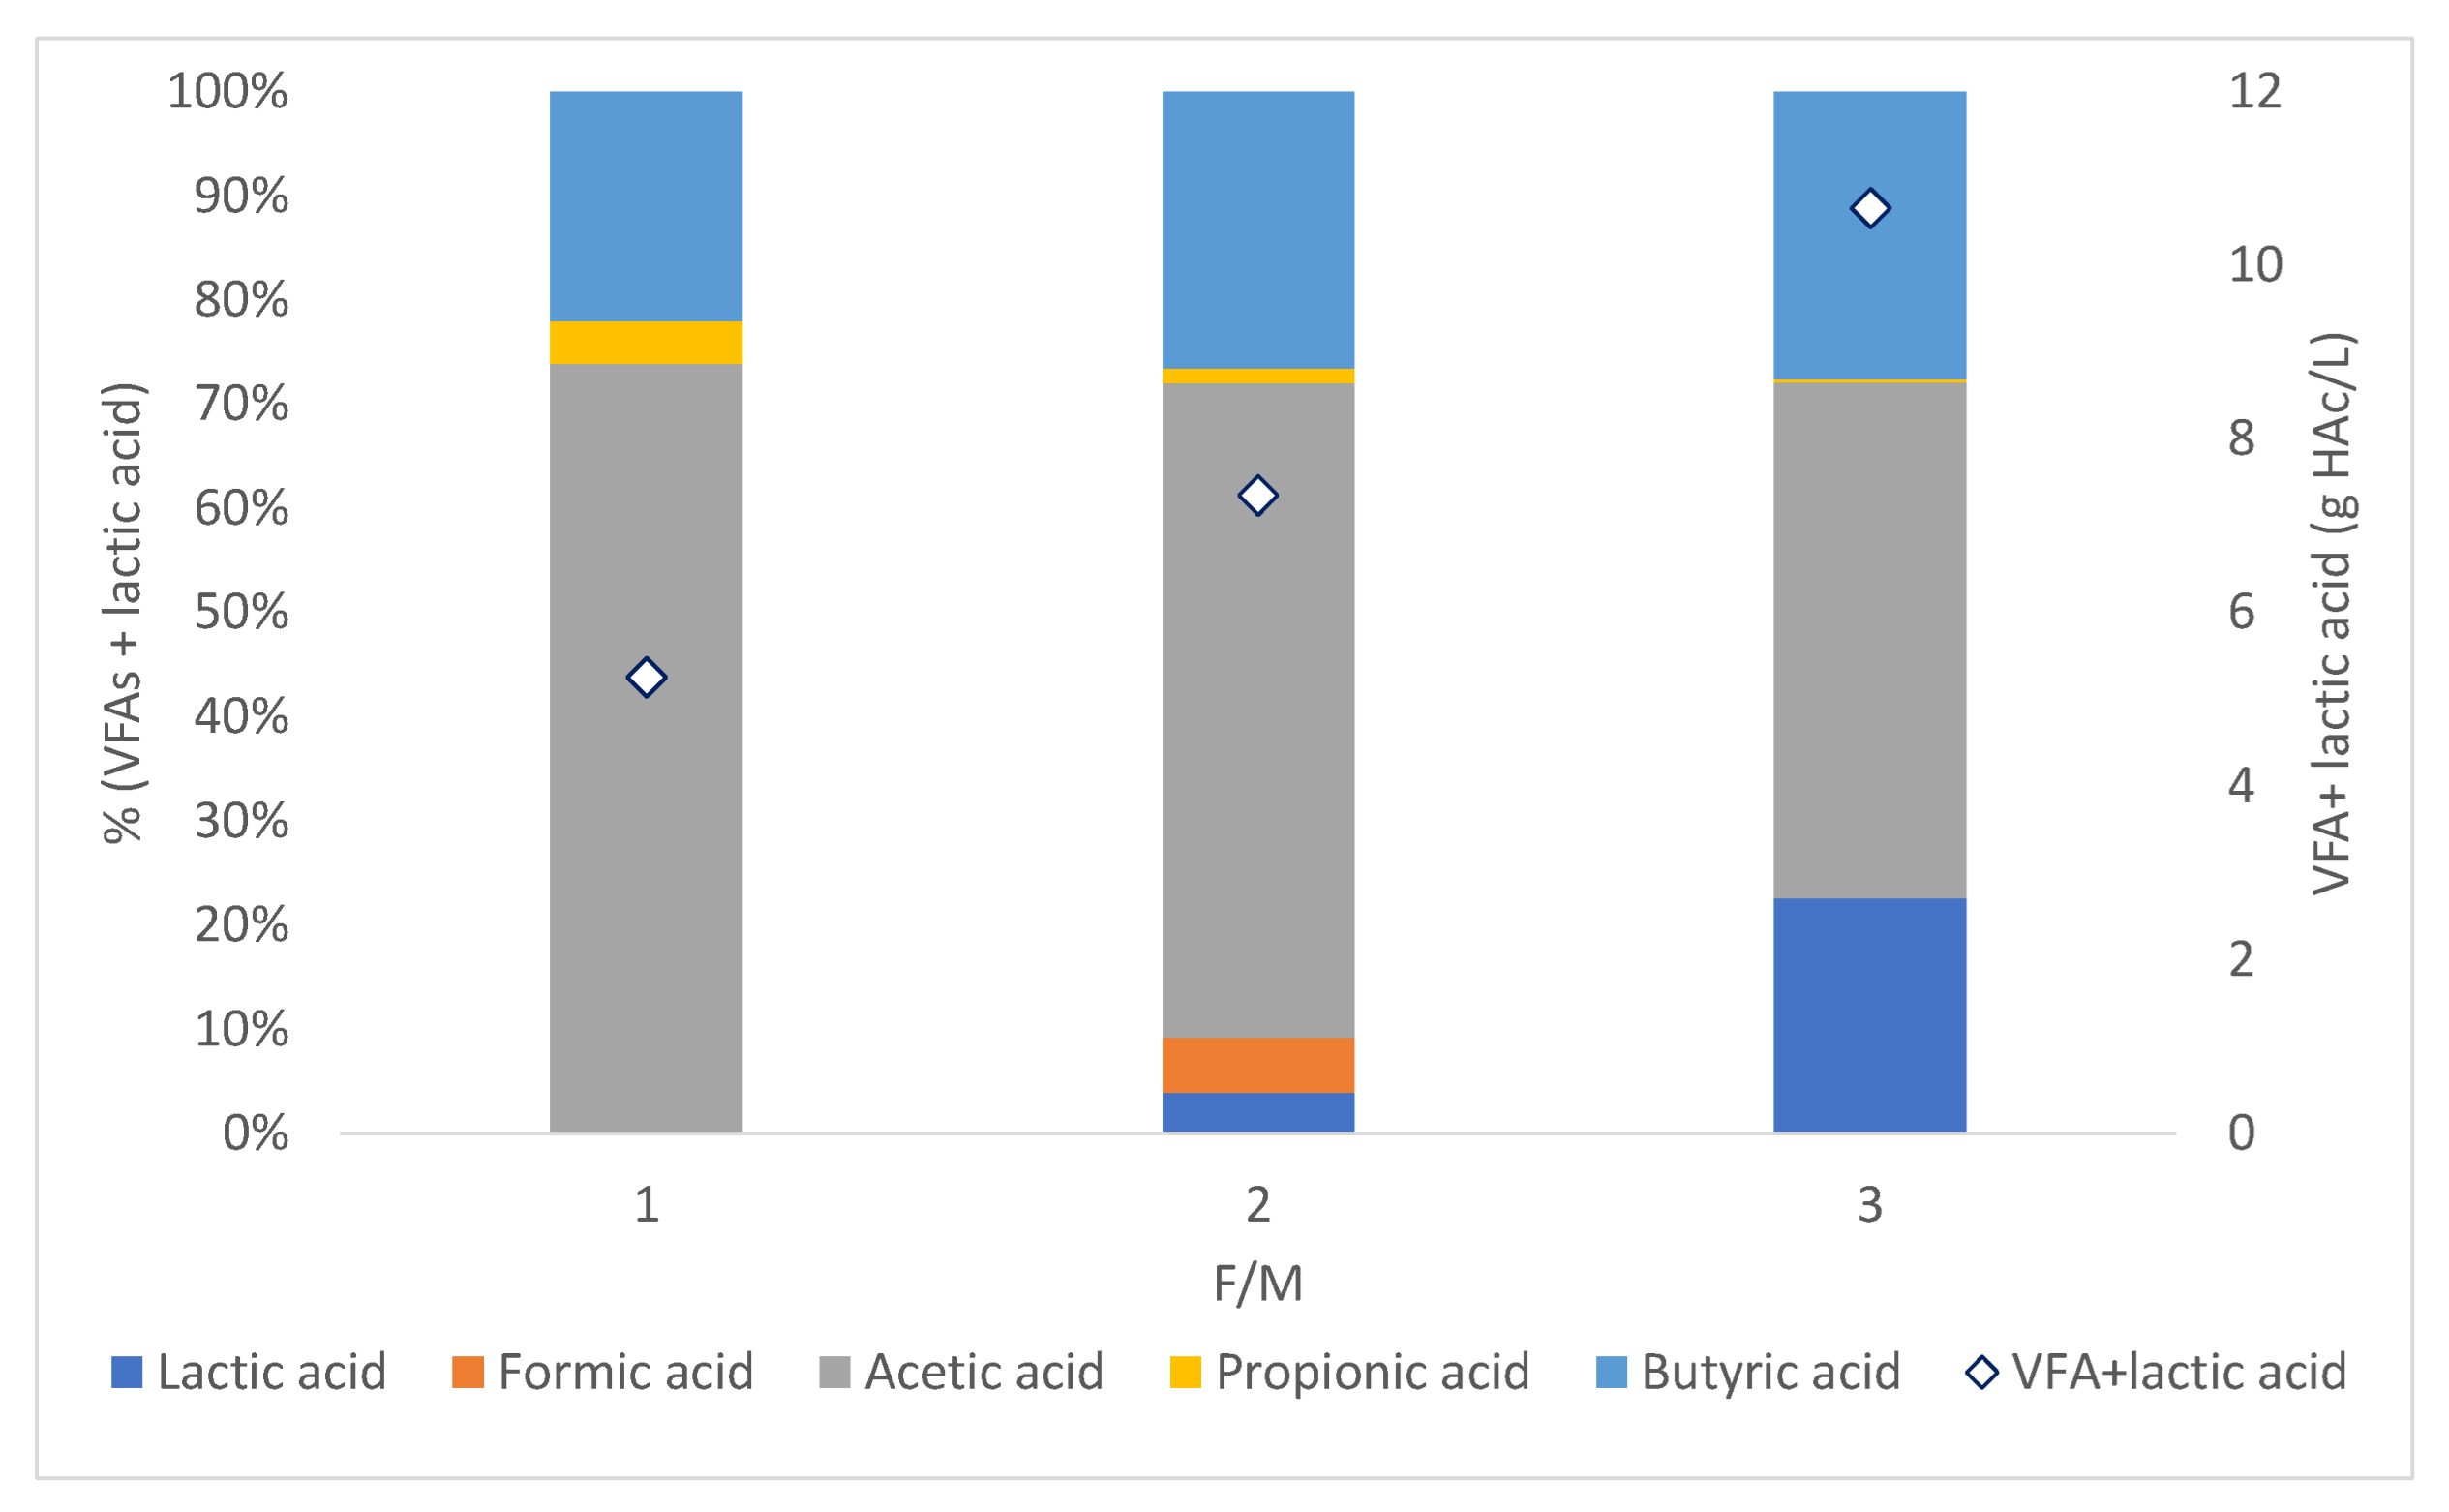
3.4. Effect of the S/I Ratio on H2 Yield and Volatile Fatty Acids Production

The third set of tests was carried out by varying the S/I ratio. The cumulative H2 production evolution and the three fitting models (i.e., modified Gompertz model, first-order, and modified Logistic model) curves are shown in Figure 5.
RMSE and R2 were used to evaluate the outcomes of model fitting (Table 6), showing that the Gompertz model minimizes the errors and maximizes the R2 in two cases (S/I = 2 and 3). Conversely, the first-order kinetic describes well the S/I = 1 condition, showing a faster hydrolysis phase (Table S4).
An S/I ratio equal to 1 and 2 resulted in H2 yields of 151.7 and 146.7 NmL of H2/g VS, respectively, which were higher than 111.2 NmL of H2/g VS obtained with an S/I ratio of 3. These data are broadly consistent with a previous study [6], which observed that an S/I ratio of 1, among 4 different S/I ratios, maximized the H2 yield by 1.1, 1.6, and 3.4 times, compared to S/I ratios of 0.5, 1.5, and 2, respectively.
In this study, an excess of the substrate affected the cumulative H2 production and the rate of the process. The parameters of the modified Gompertz model are reported in the Supplementary Materials (Table S4). Indeed, the highest R (5.8 mL/h) is associated with an S/I ratio of 1, and twice folds the rate achieved at an S/I ratio of 3. Under this condition, a longer lag phase was observed, meaning that the bacteria needed more time to adapt to a substrate overload. A possible explanation is related to the pH evolution, which was considerably influenced by the S/I ratio used. The pH ranged from 7.79 to 5.27, 7.13 to 4.93, and 6.59 to 4.62, with an S/I ratio of 1, 2, and 3, respectively, indicating that the highest H2 production was obtained under the S/I condition that did not lead to an excessive pH drop. Namely, when pH decreases below 4.8, the organic matter bioconversion into H2 is severely inhibited, likely due to the high presence of acids in their undissociated form [36,37].
The data obtained relative to H2 yield and pH are in good agreement with Pan et al. [38], who reported that lower pH values were observed in reactors operated with higher S/I ratios during the anaerobic fermentation of food waste under mesophilic conditions. Moreover, the highest H2 production was achieved when using an S/I of 6, which allowed maintenance of an optimal pH (5.7) for the H2-producing pathway. The higher S/I ratio entailing the highest H2 production compared to that observed in this study is likely due to the different organic substrate, which was presumably less easy to degrade and inclined to acidification in the study of Pan et al. [38].
Figure 6 shows the total VFA + lactic acid concentration (expressed as mg HAc/L) and the percentage (%) of each end-product over the total concentration (calculated on an equivalent acetic acid basis) in the fermentate obtained from the dark fermentation of the winter/autumn fruit and vegetable waste mixture under the three different S/I conditions investigated. As it is possible to observe, the use of different S/I conditions also affected the VFA speciation, as also reported by Pastor-Poquet et al. [39]. Acetic acid was predominant with all S/I ratios, corresponding to 74, 63, and 50% of soluble products (i.e., VFA and lactic acid), respectively. The highest acetic acid yield of 6.49 mmol/g VS was observed with an S/I ratio of 1. Although not a VFA, the lactic acid concentration was higher at increasing S/I ratios, reaching 23% of the total soluble end-products with an S/I ratio of 3 [26]. Also in this case, the occurrence of different pH values associated with the S/I ratios used seems to be responsible for the different total VFA concentrations and speciations, which are related to different metabolic pathways [38]. The highest total VFA and lactic acid concentration of 10.7 g of HAc/L was achieved with an S/I ratio of 3, reflecting the major decrease of pH (i.e., from 6.59 to 4.62) observed under this condition and the highest VS content (Table 2). Nonetheless, the S/I ratio of 3 corresponded also to the lowest VFA yield, which is 2.9 and 1.6 mmol/g VS for acetic and butyric acid, respectively. These findings, together, with the lowest H2 yield and the highest t95 (i.e., 63.3 h) associated with an S/I ratio of 3, suggest a reduced conversion of the substrate (both in terms of H2 and VFA) due to a ‘shock load’ inhibition [13]. This aspect is strictly dependent on the substrate/inoculum characteristics, which determine the final pH. Ghimire et al. [13] reported a reduced H2 yield and a low final pH (4.5 ± 0.1), caused by a lower food waste conversion observed at a pH of 5.0 and an S/I of 1.5. The pH profiles during the tests are shown in the Supplementary Materials (Figure S5).

4. Conclusions

The dark fermentation of three FVW mixtures, reflecting the seasonal variation throughout a calendar year, indicated that the winter/autumn substrate led to the lower H2 yield (52.1 ± 0.5 NmL H2/g VS), which was 17.8 and 14.6% lower than those obtained with the spring and summer waste compositions, respectively. The fermentation of the winter/autumn mixture also led to ethanol formation, which can explain the lower H2 yield compared to the other seasons. The following experiments, aiming at valorizing the least-H2-producing substrate (winter/autumn mixture) via dark fermentation, showed that the highest H2 yield (i.e., 193.0 ± 7.4 NmL of H2/g VS) can be obtained using an initial pH of 5.5 and an S/I ratio of 1. The highest production of VFAs, mainly made up of acetate, occurred at an initial pH of 7.5. Further research is needed to validate these findings on a higher scale, and using continuous flow operated reactors.

Supplementary Materials

The following supporting information can be downloaded at https://www.mdpi.com/article/10.3390/en15145032/s1. Figure S1: Number of peer-reviewed publications on FVW dark fermentation published in the last years; Table S1: Fruit and vegetable waste compositions representative of the average market waste mixtures produced in Amman (Jordan) and Sfax (Tunisia); Figure S2: (a) Fruit and vegetable chopping, (b) sieving at a particle size of 5 mm, and (c) different seasonal FVW composition; Table S2: Parameters obtained by fitting the models for different seasons; Figure S3: pH trends during the dark fermentation of fruit and vegetable waste under the three different substrate mixtures investigated; Table S3: Parameters of the models obtained by fitting the experimental specific H2 production data obtained at seven different initial pH levels; Figure S4: pH trends during the dark fermentation of the winter/autumn fruit and vegetable waste mixture under the seven different initial pH conditions investigated; Table S4: Parameters of the models obtained by fitting the experimental data obtained at three different substrate/inoculum ratios; Figure S5: pH trends during the dark fermentation of the winter/autumn fruit and vegetable waste mixture under the three different S/I conditions investigated.

Author Contributions

Conceptualization, E.S.d.P., A.C., L.F. and S.P. (Stefano Papirio); methodology, E.S.d.P., A.C. and S.P. (Stefano Papirio); investigation, E.S.d.P.; data curation, E.S.d.P. and S.P. (Stefania Pindozzi); writing—original draft preparation, E.S.d.P.; writing—review and editing, E.S.d.P., A.C., S.P. (Stefania Pindozzi), G.E. and S.P. (Stefano Papirio); project administration, S.P. (Stefano Papirio) and G.E.; funding acquisition, S.P. (Stefano Papirio), G.E. and L.F. All authors have read and agreed to the published version of the manuscript.

Funding

This research was funded by the ENI CBC MED 2014–2020 program, grant number A_B.4.2_0058, with the project “Employing circular economy approach for OFMSW management within the Mediterranean countries–CEOMED”. The former Italian Ministry of Education, University and Research (MIUR) provided financial support for Alessandra Cesaro’s position as Assistant Professor in the frame of the research project “Dipartimenti di Eccellenza” at the Department of Civil, Architectural and Environmental Engineering-CUPE65D18000820006.

Institutional Review Board Statement

Not applicable.

Informed Consent Statement

Not applicable.

Data Availability Statement

Not applicable.

Acknowledgments

The authors acknowledge the contribution of Dino Ponticorvo and Rosetta Lamboglia in maintaining the experimental activities and performing the analytical procedures.

Conflicts of Interest

The authors declare no conflict of interest.

List of Acronyms

FVWfruit and vegetable waste
VFAsvolatile fatty acids
S/Isubstrate/inoculum
TStotal solids
VSvolatile solids
tCODtotal chemical oxygen demand
sCODsoluble chemical oxygen demand
TANtotal ammonia nitrogen
TAtotal alkalinity
B/Abutyric/acetic ratio
R2determination coefficient
RMSEroot mean squared error
RSSresidual sum of squares
wbwet basis

References

  1. Papirio, S.; Trujillo-Reyes, Á.; Scotto Di Perta, Ε.; Kalogiannis, A.; Kassab, G.; Khoufi, S.; Sayadi, S.; Frunzo, L.; Esposito, G.; Fermoso, F.G.; et al. Exploring the Biochemical Methane Potential of Wholesale Market Waste from Jordan and Tunisia for a Future Scale-Up of Anaerobic Digestion in Amman and Sfax. Waste Biomass Valorization 2022, 1, 1–11. [Google Scholar] [CrossRef]
  2. Edwiges, T.; Frare, L.; Mayer, B.; Lins, L.; Mi Triolo, J.; Flotats, X.; de Mendonça Costa, M.S.S. Influence of Chemical Composition on Biochemical Methane Potential of Fruit and Vegetable Waste. Waste Manag. 2018, 71, 618–625. [Google Scholar] [CrossRef] [PubMed] [Green Version]
  3. Bräutigam, K.R.; Jörissen, J.; Priefer, C. The Extent of Food Waste Generation across EU-27: Different Calculation Methods and the Reliability of Their Results. Waste Manag. Res. 2014, 32, 683–694. [Google Scholar] [CrossRef] [PubMed]
  4. Morales-Polo, C.; del MarCledera-Castro, M.; Hueso-Kortekaas, K.; Revuelta-Aramburu, M. Anaerobic Digestion in Wastewater Reactors of Separated Organic Fractions from Wholesale Markets Waste. Compositional and Batch Characterization. Energy and Environmental Feasibility. Sci. Total Environ. 2020, 726, 138567. [Google Scholar] [CrossRef] [PubMed]
  5. Chatterjee, B.; Mazumder, D. New Approach of Characterizing Fruit and Vegetable Waste (FVW) to Ascertain Its Biological Stabilization via Two-Stage Anaerobic Digestion (AD). Biomass Bioenergy 2020, 139, 105594. [Google Scholar] [CrossRef]
  6. Dwivedi, A.H.; Gedam, V.V.; Kumar, M.S. Sustainable Hydrogen Production from Fruit and Vegetable Waste (FVW) Using Mixed Anaerobic Cultures via Dark Fermentation: Kinetic Aspects Graphic Abstract Keywords Hydrogen (h 2) Fruit and Vegetable Waste (FVW) Waste Management Dark Fermentation. Int. J. Energy Environ. Eng. 2020, 11, 341–349. [Google Scholar] [CrossRef]
  7. Ravi, P.P.; Lindner, J.; Oechsner, H.; Lemmer, A. Effects of Target PH-Value on Organic Acids and Methane Production in Two-Stage Anaerobic Digestion of Vegetable Waste. Bioresour. Technol. 2018, 247, 96–102. [Google Scholar] [CrossRef]
  8. Morales-Polo, C.; del MarCledera-Castro, M.; Soria, B.Y.M. Biogas Production from Vegetable and Fruit Markets Waste—Compositional and Batch Characterizations. Sustainability 2019, 11, 6790. [Google Scholar] [CrossRef] [Green Version]
  9. Scotto di Perta, E.; Cervelli, E.; Pironti di Campagna, M.; Pindozzi, S. From Biogas to Biomethane: Techno-Economic Analysis of an Anaerobic Digestion Power Plant in a Cattle/Buffalo Farm in Central Italy. J. Agric. Eng. 2019, 50, 127–133. [Google Scholar] [CrossRef]
  10. Moscariello, C.; Matassa, S.; Pirozzi, F.; Esposito, G.; Papirio, S. Valorisation of Industrial Hemp (Cannabis sativa L.) Biomass Residues through Acidogenic Fermentation and Co-Fermentation for Volatile Fatty Acids Production. Bioresour. Technol. 2022, 355, 127289. [Google Scholar] [CrossRef] [PubMed]
  11. Tsigkou, K.; Tsafrakidou, P.; Athanasopoulou, S.; Zafiri, C.; Kornaros, M. Effect of PH on the Anaerobic Fermentation of Fruit/Vegetables and Disposable Nappies Hydrolysate for Bio-Hydrogen Production. Waste Biomass Valorization 2020, 11, 539–551. [Google Scholar] [CrossRef]
  12. Sabater, C.; Ruiz, L.; Delgado, S.; Ruas-Madiedo, P.; Margolles, A. Valorization of Vegetable Food Waste and By-Products Through Fermentation Processes. Front. Microbiol. 2020, 11, 2604. [Google Scholar] [CrossRef] [PubMed]
  13. Ghimire, A.; Sposito, F.; Frunzo, L.; Trably, E.; Escudié, R.; Pirozzi, F.; Lens, P.N.L.; Esposito, G. Effects of Operational Parameters on Dark Fermentative Hydrogen Production from Biodegradable Complex Waste Biomass. Waste Manag. 2016, 50, 55–64. [Google Scholar] [CrossRef]
  14. Guo, X.M.; Trably, E.; Latrille, E.; Carrre, H.; Steyer, J.P. Hydrogen Production from Agricultural Waste by Dark Fermentation: A Review. Int. J. Hydrog. Energy 2010, 35, 10660–10673. [Google Scholar] [CrossRef]
  15. Zheng, M.; Zheng, M.; Wu, Y.; Ma, H.; Wang, K. Effect of PH on Types of Acidogenic Fermentation of Fruit and Vegetable Wastes. Biotechnol. Bioprocess Eng. 2015, 20, 298–303. [Google Scholar] [CrossRef]
  16. Morales-Polo, C.; del MarCledera-Castro, M.; Revuelta-Aramburu, M.; Hueso-Kortekaas, K. Enhancing Energy Recovery in Form of Biogas, from Vegetable and Fruit Wholesale Markets By-Products and Wastes, with Pretreatments. Plants 2021, 10, 1298. [Google Scholar] [CrossRef]
  17. Ghimire, A.; Frunzo, L.; Pirozzi, F.; Trably, E.; Escudie, R.; Lens, P.N.L.; Esposito, G. A Review on Dark Fermentative Biohydrogen Production from Organic Biomass: Process Parameters and Use of by-Products. Appl. Energy 2015, 144, 73–95. [Google Scholar] [CrossRef]
  18. Lee, W.S.; Chua, A.S.M.; Yeoh, H.K.; Ngoh, G.C. A Review of the Production and Applications of Waste-Derived Volatile Fatty Acids. Chem. Eng. J. 2014, 235, 83–99. [Google Scholar] [CrossRef]
  19. Holliger, C.; Astals, S.; de Laclos, H.F.; Hafner, S.D.; Koch, K.; Weinrich, S. Towards a Standardization of Biomethane Potential Tests: A Commentary. Water Sci. Technol. 2021, 83, 247–250. [Google Scholar] [CrossRef]
  20. Angelidaki, I.; Alves, M.; Bolzonella, D.; Borzacconi, L.; Campos, J.L.; Guwy, A.J.; Kalyuzhnyi, S.; Jenicek, P.; Van Lier, J.B.; Angelidaki, A.I. Defining the Biomethane Potential (BMP) of Solid Organic Wastes and Energy Crops: A Proposed Protocol for Batch Assays. Water Sci. Technol. 2009, 59, 927–934. [Google Scholar] [CrossRef] [Green Version]
  21. Ghimire, A.; Valentino, S.; Frunzo, L.; Trably, E.; Escudié, R.; Pirozzi, F.; Lens, P.N.L.; Esposito, G. Biohydrogen Production from Food Waste by Coupling Semi-Continuous Dark-Photofermentation and Residue Post-Treatment to Anaerobic Digestion: A Synergy for Energy Recovery. Int. J. Hydrog. Energy 2015, 40, 16045–16055. [Google Scholar] [CrossRef]
  22. Esposito, G. Bio-Methane Potential Tests To Measure The Biogas Production From The Digestion and Co-Digestion of Complex Organic Substrates. Open Environ. Eng. J. 2012, 5, 1–8. [Google Scholar] [CrossRef]
  23. Apha, A. Standard Methods for the Examination of Water and Wastewater; American Public Health Association/American Water Works Association/Water Environment Federation, Ed.; American Public Health Association: Washington, DC, USA, 2005; Volume 21. [Google Scholar]
  24. Dubois, M.; Gilles, K.A.; Hamilton, J.K.; Rebers, P.A.; Smith, F. Colorimetric Method for Determination of Sugars and Related Substances. Anal. Chem. 1956, 28, 350–356. [Google Scholar] [CrossRef]
  25. Noguerol-Arias, J.; Rodríguez-Abalde, A.; Romero-Merino, E.; Flotats, X. Determination of Chemical Oxygen Demand in Heterogeneous Solid or Semisolid Samples Using a Novel Method Combining Solid Dilutions as a Preparation Step Followed by Optimized Closed Reflux and Colorimetric Measurement. Anal. Chem. 2012, 84, 5548–5555. [Google Scholar] [CrossRef]
  26. Wainaina, S.; Awasthi, M.K.; Horváth, I.S.; Taherzadeh, M.J. Anaerobic Digestion of Food Waste to Volatile Fatty Acids and Hydrogen at High Organic Loading Rates in Immersed Membrane Bioreactors. Renew. Energy 2020, 152, 1140–1148. [Google Scholar] [CrossRef]
  27. Cappai, G.; De Gioannis, G.; Friargiu, M.; Massi, E.; Muntoni, A.; Polettini, A.; Pomi, R.; Spiga, D. An Experimental Study on Fermentative H2 Production from Food Waste as Affected by PH. Waste Manag. 2014, 34, 1510–1519. [Google Scholar] [CrossRef]
  28. Boshagh, F.; Rostami, K.; van Niel, E.W.J. Application of Kinetic Models in Dark Fermentative Hydrogen Production–A Critical Review. Int. J. Hydrog. Energy 2022, 47, 21952–21968. [Google Scholar] [CrossRef]
  29. Wang, J.; Wan, W. Kinetic Models for Fermentative Hydrogen Production: A Review. Int. J. Hydrog. Energy 2009, 34, 3313–3323. [Google Scholar] [CrossRef]
  30. Tena, M.; Luque, B.; Perez, M.; Solera, R. Enhanced Hydrogen Production from Sewage Sludge by Cofermentation with Wine Vinasse. Int. J. Hydrog. Energy 2020, 45, 15977–15984. [Google Scholar] [CrossRef]
  31. Bouallagui, H.; Lahdheb, H.; Ben Romdan, E.; Rachdi, B.; Hamdi, M. Improvement of Fruit and Vegetable Waste Anaerobic Digestion Performance and Stability with Co-Substrates Addition. J. Environ. Manag. 2009, 90, 1844–1849. [Google Scholar] [CrossRef]
  32. Yu, J.; Huang, Z.; Wu, P.; Zhao, M.; Miao, H.; Liu, C.; Ruan, W. Performance and Microbial Characterization of Two-Stage Caproate Fermentation from Fruit and Vegetable Waste via Anaerobic Microbial Consortia. Bioresour. Technol. 2019, 284, 398–405. [Google Scholar] [CrossRef]
  33. Sadeghifar, T.; Lama, G.F.C.; Sihag, P.; Bayram, A.; Kisi, O. Wave Height Predictions in Complex Sea Flows through Soft-Computing Models: Case Study of Persian Gulf. Ocean Eng. 2022, 245, 110467. [Google Scholar] [CrossRef]
  34. Guo, X.M.; Trably, E.; Latrille, E.; Carrere, H.; Steyer, J.P. Predictive and Explicative Models of Fermentative Hydrogen Production from Solid Organic Waste: Role of Butyrate and Lactate Pathways. Int. J. Hydrog. Energy 2014, 39, 7476–7485. [Google Scholar] [CrossRef]
  35. Ariunbaatar, J.; Scotto Di Perta, E.; Panico, A.; Frunzo, L.; Esposito, G.; Lens, P.N.L.; Pirozzi, F. Effect of Ammoniacal Nitrogen on One-Stage and Two-Stage Anaerobic Digestion of Food Waste. Waste Manag. 2015, 38, 388–398. [Google Scholar] [CrossRef] [PubMed]
  36. Valdez-Vazquez, I.; Poggi-Varaldo, H.M. Hydrogen Production by Fermentative Consortia. Renew. Sustain. Energy Rev. 2009, 13, 1000–1013. [Google Scholar] [CrossRef]
  37. Dreschke, G.; Papirio, S.; Sisinni, D.M.G.; Lens, P.N.L.; Esposito, G. Effect of Feed Glucose and Acetic Acid on Continuous Biohydrogen Production by Thermotoga Neapolitana. Bioresour. Technol. 2019, 273, 416–424. [Google Scholar] [CrossRef]
  38. Pan, J.; Zhang, R.; El-Mashad, H.M.; Sun, H.; Ying, Y. Effect of Food to Microorganism Ratio on Biohydrogen Production from Food Waste via Anaerobic Fermentation. Int. J. Hydrog. Energy 2008, 33, 6968–6975. [Google Scholar] [CrossRef]
  39. Pastor-Poquet, V.; Papirio, S.; Trably, E.; Rintala, J.; Escudié, R.; Esposito, G. High-Solids Anaerobic Digestion Requires a Trade-off between Total Solids, Inoculum-to-Substrate Ratio and Ammonia Inhibition. Int. J. Environ. Sci. Technol. 2019, 16, 7011–7024. [Google Scholar] [CrossRef]
Figure 1. Cumulative H2 production, modified Gompertz, the first-order, and the modified Logistic model using the three different fruit and vegetable waste mixtures; one per season were considered.
Energies 15 05032 g001
Figure 2. The yield of each end-product in the fermentate obtained from the dark fermentation of the winter/autumn, spring, and summer fruit and vegetable waste mixtures.
Energies 15 05032 g002
Figure 3. Cumulative H2 production and three fitting models (i.e., modified Gompertz model, first-order, and modified Logistic model) curves under seven different initial pH conditions during the dark fermentation of a winter/autumn composition of fruit and vegetable waste.
Energies 15 05032 g003
Figure 4. VFA, lactic acid, ethanol yield, composition, and butyric/acetic (B/A) ratio after dark fermentation of the winter/autumn fruit and vegetable waste mixture under the seven different initial pH conditions investigated.
Energies 15 05032 g004
Figure 5. Cumulative H2 production, modified Gompertz model, the first-order, and the modified Logistic model at different substrate/inoculum (S/I) ratios from the dark fermentation of the winter/autumn fruit and vegetable waste mixture.
Energies 15 05032 g005
Figure 6. Total VFA + lactic acid concentration (mg HAc/L) and percentage after the dark fermentation of the winter/autumn fruit and vegetable waste mixture under the three different S/I conditions investigated.
Energies 15 05032 g006
Table 1. Characteristics of the thermally pretreated digested sewage sludge used as an inoculum in the dark fermentation tests.
ParameterInoculum
TS [g/L]25.29
VS [g/L]16.58
tCOD [mg O2/L]23,800
sCOD [mg O2/L]4607
N-NH₄⁺ [mg/L]331
Alkalinity [mg CaCO3/L]1039
pH8.5
Table 2. Experimental conditions in terms of substrate season, initial pH, and substrate/inoculum (S/I) ratio used in the biochemical hydrogen potential tests.
TestAimSubstrateInitial pHS/I
(g VS/g VS)
Initial Substrate Concentration
(g VS/L)
Mixture Concentration
(g VS/L)
Set 1Effect of seasonal variationwinter–autumn, spring, summerNot adjusted (9.2)1510
Set 2Effect of initial pHwinter–autumnNot adjusted (7.8), 5.5, 6.0, 6.5, 7.0, 7.5 and 8.011020
Set 3Effect of S/I ratiowinter–autumnNot adjusted (7.8, 7.1, 6.6)1, 2, 310, 20, 3020, 30, 40
Table 3. Physical–chemical characteristics of the winter-autumn, spring and summer fruit and vegetable waste compositions used in this study.
ParameterWinter–AutumnSpringSummer
Moisture (%)90.28 ± 0.1490.07 ± 0.3390.52 ± 0.49
TS [g/kgwb]97.19 ± 1.3799.29 ± 3.2894.77 ± 4.90
VS [g/kgwb]88.71 ± 1.7391.99 ± 3.2388.10 ± 4.83
tCOD [g/kg VS]1294.10 ± 214.69951.76 ± 176.80983.96 ± 4.01
sCOD [g/kg VS]604.97 ± 37.20679.42 ± 30.75865.49 ± 12.04
sCOD/tCOD (%)46.75%71.39%87.96%
Total carbohydrates [g/kg VS]916.64 ± 87.68719.97 ± 89.41804.71 ± 38.86
Soluble carbohydrates [g/kg VS]529.19 ± 3.69559.41 ± 25.69727.79 ± 58.51
Table 4. Statistical analysis of the three compared models describing H2 production of three different fruit and vegetable waste mixtures.
ModelWinter/AutumnSpringSummer
R2RSSRMSER2RSSRMSER2RSSRMSE
Gompertz0.9920.011.831.005.340.940.9917.291.70
First order kinetic0.9763.193.250.96148.484.970.9930.012.24
Modified Logistic model0.9836.072.450.9930.422.250.9849.892.88
Table 5. Statistical analysis of the three compared models describing H2 production with seven different initial pH conditions.
ModelpH5.5pH6pH6.5pH7pH7.5pH8Not Adjusted
R2RSSRMSER2RSSRMSER2RSSRMSER2RSSRMSER2RSSRMSER2RSSRMSER2RSSRMSE
Gompertz0.98483.568.980.99135.014.741.0072.683.480.94303.857.120.9950.762.910.98128.294.621.0032.782.34
First-order kinetic0.961277.3514.591.0047.242.811.009.971.290.97150.115.000.9946.872.791.0023.001.960.9994.813.98
Modified Logistic model0.98518.459.300.98399.688.160.99232.526.230.91424.138.410.9976.393.570.96242.196.350.9948.092.83
Table 6. Statistical analysis of the three compared models describing H2 production with different substrate/inoculum (S/I) ratios.
ModelS/I = 1S/I = 2S/I = 3
R2RSSRMSER2RSSRMSER2RSSRMSE
Gompertz0.98304.177.121.0045.232.751.000.960.40
First-order kinetic1.0056.873.080.99186.775.580.95557.519.64
Modified Logistic model0.98450.788.670.99196.215.721.0021.211.88
Publisher’s Note: MDPI stays neutral with regard to jurisdictional claims in published maps and institutional affiliations.

