Article

A Detailed Analysis of the H.B. Robinson-2 Reactor Pressure Vessel Dosimetry Benchmark

1
Institut de Radioprotection et de Sûreté Nucléaire (IRSN), PSN-RES/SNC/LN, F-92260 Fontenay-aux-Roses, France
2
Commissariat à l’Énergie Atomique et aux Énergies Alternatives (CEA), Institut de Recherche sur les Lois Fondamentales de l’Univers, Université Paris Saclay, F-91191 Gif-sur-Yvette, France
*
Author to whom correspondence should be addressed.
Energies 2022, 15(14), 5098; https://doi.org/10.3390/en15145098
Submission received: 28 May 2022 / Revised: 24 June 2022 / Accepted: 27 June 2022 / Published: 12 July 2022
(This article belongs to the Special Issue Advanced Numerical Modelling Techniques for Nuclear Reactors)

Abstract

:
The operation of many nuclear pressurized water reactors is being extended beyond their design lifetime limit. From the perspective of possible further lifetime extension, safety requirements are a priority. Therefore, the quantification of the neutron irradiation embrittlement of the reactor pressure vessel (RPV) is an important issue, as this is a guiding parameter that influences the reactor lifetime. In this context, the Institut de Radioprotection et de Sûreté Nucléaire developed a calculation scheme for the analysis of RPV aging under neutron irradiation, named VACS (vessel aging calculation scheme). VACS couples a deterministic approach (CASMO5 and SIMULATE5) to evaluate the full-core fission neutron source term and a Monte Carlo modeling (MCNP6) approach to model the neutron attenuation from the core to sites of interest (RPV, surveillance capsules, etc.). To ensure the reliability of aging predictions, this paper describes a detailed analysis of the neutron H.B. Robinson-2 reactor pressure vessel dosimetry benchmark. The results indicate that VACS shows satisfactory accuracy when the ENDF-B/VII.1 or JEFF-3.3 nuclear data libraries are used in the attenuation calculation. However, the use of ENDF-B/VIII.0 leads to significantly worse results.

1. Introduction

The lifespan of many nuclear pressurized water reactors (PWRs) is being extended beyond their design lifetime. With the prospect of further lifetime extensions, meeting safety requirements is a priority. In particular, the characterization of the structural integrity of the reactor pressure vessel (RPV) is an important issue. Indeed, under the operation of a PWR, the RPV is bombarded by neutrons from fission reactions occurring in the reactor core. These incident neutrons (especially fast neutrons, i.e., those with energies above 1 MeV [1]) induce numerous atomic displacements in the RPV material, causing the mechanical properties of the RPV to gradually deteriorate. To monitor this embrittlement, surveillance programs have been implemented for the majority of RPVs around the world [2,3,4,5]. These surveillance programs include the so-called capsules, which contain vessel material specimens as well as dosimeters. The capsules are usually attached to the core barrel or the thermal neutron shield, in order to increase their exposure to neutron fluxes with regard to the RPV. Thus, the material specimens age faster than the RPV inner wall. Mechanical tests are performed on the specimens, which are withdrawn regularly, and the acquired data, in conjunction with the data provided by the dosimeters, allow an empirical correlation to be established between the accumulated fast neutron fluence and the deterioration of the mechanical properties of the material. The neutron fluence in the vessel is based on a simulation, and determining the precision of this simulation is the aim of this study.
In this context, efforts have been made at the Institut de Radioprotection et de Sûreté Nucléaire (IRSN) to develop a versatile, best-estimate calculation scheme for the analysis of RPV embrittlement under neutron irradiation [6], named VACS (vessel aging calculation scheme). The methodology relies on a two-step approach, coupling deterministic and Monte Carlo calculations. The first step estimates the full-core fission neutron source term and the second step considers the transport of neutrons from the core to the RPV, using the fission neutron distribution determined in the previous step. Throughout the construction of the methodology, several studies were conducted to minimize the inherent methodological biases [6,7,8,9] and to pave the way towards the quantification of the global uncertainty in its predictions [9,10]. In order to validate the numerical predictions using experimental dosimeter data from ex-core locations, a detailed analysis of the H.B. Robinson-2 (HBR-2) RPV dosimetry benchmark [11] was conducted. This benchmark was chosen because it includes measurements performed for an operating PWR using in-vessel (capsule location) and ex-vessel (reactor cavity) dosimeters. This feature is of major interest because it allows the accuracy of aging predictions to be characterized, not only for in-vessel applications but also, to some extent, for ex-vessel ones. In addition, the HBR-2 benchmark provides a fission neutron source term which is intended to be directly used to validate the accuracy of the neutron attenuation calculation only (second step). However, the data provided were used to analyze the accuracy of both steps of the calculation scheme (fission neutron source term and attenuation) and thus to provide a complete validation.
The H.B. Robinson-2 Reactor and the data provided in the benchmark are presented in Section 2. Section 3 highlights the modeling and the methods used to calculate the fission neutron source term and model the attenuation of these neutrons at the sites of interest. Section 4 presents and discusses the results obtained at each step of the analysis. Finally, conclusions are drawn in Section 5.

2. The H.B. Robinson-2 Reactor Pressure Vessel Dosimetry Benchmark

The H.B. Robinson-2 (HBR-2) neutron dosimetry benchmark [11] from the SINBAD database [12] is widely used in the scientific community for the validation of calculation schemes designed to predict vessel aging, as shown in [13,14,15,16]. It features in-vessel (surveillance capsule) and ex-vessel (reactor cavity) dosimetry data acquired during the 9th cycle of the H.B. Robinson-2 reactor.

2.1. Description of the H.B. Robinson-2 Reactor

The H.B. Robinson-2 reactor is a 2300 MWth PWR designed by Westinghouse and owned by the Carolina Power and Light Company. The reactor is located near Hartsville in South Carolina, United States. Its operation began in March 1971.
The reactor core is loaded with 157 UOX assemblies, initially enriched to 2.9% of 235 U. The assemblies contain 204 fuel rods plus 21 guide tubes that serve as inserts for control rods. Fuel-rod and guide-tube claddings are made of Zircaloy. A visualization of the geometry of a fuel assembly is given in Figure 1. The reactor core is surrounded by the baffle, the moderator bypass region, the core barrel, a first moderator downcomer region, the thermal neutron shield, a second moderator downcomer region, the RPV, the reactor cavity and the biological shield. These elements can be found in Figure 2, which is taken from [14] and presents a simplified view of an eighth of the reactor.
On the one hand, the dimensions of the majority of the components at or above assembly scale (assembly, baffle, barrel, thermal neutron shield, RPV, etc.) are provided in the benchmark data [11]. On the other hand, the dimensions of some components below the assembly scale (fuel pins, guide tubes, etc.) are not specified in [11] but can be found in [17]. Descriptions of the materials constituting the main elements of the reactor (fuel, baffle, cladding, thermal neutron shield, vessel, etc.) are also provided in the benchmark data [11].
The HBR-2 reactor has four groups of black control banks and one bank of shutdown rods. The insertion layout of these banks can be found in [17]. However, no information could be found in the literature on the insertion sequence of these control rods during core power variations.
The reactor is equipped with several sets of dosimeters, whose locations are marked by crosses in Figure 2. A first set of dosimeters is placed in a surveillance program capsule attached to the thermal neutron shield (azimuth 20°; 191.15 cm from the reactor left). These dosimeters are inserted in holes drilled in the left of the capsule. A second set of dosimeters is placed in a cavity behind the vessel (azimuth 0°; 238.02 cm from the reactor left). Cavity dosimeters are held by an aluminum 6061 holder, which is supported by stainless steel gradient wires mounted vertically in the gap between the insulation and the biological shield (see [11]). Both sets of dosimeters were inserted into the reactor at the beginning of its 9th irradiation cycle. Specific activities were measured at the end of this cycle, for the two dosimeter locations and for the six types of dosimeters inserted: 237 Np(n,f) 137 Cs, 238 U(n,f) 137 Cs, 58 Ni(n,p) 58 Co, 54 Fe(n,p) 54 Mn, 46 Ti(n,p) 46 Sc and 63 Cu(n, α ) 60 Co). Only specific activities in the equatorial plane of the reactor (0 cm axial position) are detailed in [11]. These experimental data (M) constitute the reference values to which the calculated values (C) must be compared in order to validate the numerical predictions of a calculation scheme. The provided specific activities are detailed in Table 1 [11]. However, it is worth mentioning that the authors in [11] do not provide uncertainty values for these experimental data.
To help the reader better understand the following results, Figure 3 shows the activation cross sections for the six types of dosimeters considered, processed at 600K using the NJOY2016 code [18] with ENDF files taken from the JEFF-3.3 data library [19]. Figure 3 shows that all dosimeters are sensitive to fast neutrons (i.e., those with energies above 1 MeV), making them highly relevant for assessing the reliability of vessel aging assessments (given that fast neutrons are the primary contributors to radiation damage [6]). Finally, it is interesting to note that 58 Ni(n,p), 54 Fe(n,p), 46 Ti(n,p) and 63 Cu(n, α ) represent reactions with a strong energy threshold.

2.2. Description of Cycle No. 9 of the H.B. Robinson-2 Reactor

The data provided in [11] allow a partial reconstruction of the course of the 9th irradiation cycle of the HBR-2 reactor to be performed. The initial burn-up distribution of assemblies is not perfectly symmetrical. However, such slight asymmetries are expected in a real reactor, since fuel assemblies are loaded in different areas of the core depending on the number of irradiation cycles they have undergone. Nevertheless, not all assemblies with the same number of irradiation cycles have experienced exactly the same history, which induces asymmetries in the initial assembly burn-up distribution.
After its loading, the reactor was in operation between 21 August 1982 and 26 January 1984 [15]. The power history of the HBR-2 reactor over this time period is provided in [11]. From this data, it is possible to know that the HBR-2 reactor did not operate at nominal power during cycle no. 9, but operated for most of the time at 80% of its nominal power (NP) and experienced numerous power drops. The average power of the reactor over the cycle was equal to 75.2% NP, which corresponds to roughly 1729.6 MWth. At such power levels, it is very likely that the control rods were partially inserted during the cycle. However, in the absence of information on the insertion sequence of the control-rod banks, it is not possible to reconstruct the average insertion position of each rod bank over cycle no. 9.
Other data included in the benchmark [11] give the average power distribution of the reactor over cycle no. 9. This power distribution is provided at the assembly level for the entire core and at the fuel-pin level for the upper right quarter. Axially, a single power distribution with 12 divisions distributed over the active height of the reactor is provided. The latter is equal to the average of the axial power distributions of the two outermost rows of assemblies. The authors of [11] specify that the assembly-level cycle-averaged power distribution was calculated using the assembly burn-up distributions at the beginning and end of cycle no. 9, taking into account the uranium content of each assembly. However, no further details are provided on how these burn-up distributions were obtained. In the absence of additional information, it can be assumed here that the burn-up distributions were evaluated by combining experimental data and neutronics calculations.
In addition, [11] provides the cycle-average fuel-pin power distribution, which was obtained by performing a weighted average of the pin powers given at eight steps during cycle no. 9 (147, 417, 1632, 3363, 5257, 7595, 9293 and 10,379 MWd/t). In the same way as before, no further details are provided on the evaluation of these radial pin power distributions, and it is reasonable to assume here that these distributions were evaluated by means of neutronics calculations. The analysis of the provided data lead to notice that the power values of several fuel pins in assemblies J15, K15, L15, N13, J12, R11, R10, M09 and R09 are very low compared to the power values of neighboring fuel pins (the assembly positions are presented in Figure 7 of Section 4.1). It was found in Version 21 of the Final Safety Analysis Report for the HBR-2 reactor [17] that, at some point, integral burnable absorber rods were thought to be used in the reactor. These rods were composed of gadolinia (Gd 2 O 3 ) in various concentrations in UO 2 , and the goal was to control the peaking and to reduce the critical boron at the beginning of the cycle. Although there is no mention of the presence of any absorber fuel rods in the benchmark data [11], it seems plausible that the absorber rods were present in the core during the experimental campaign, and this could explain the observed lower power values of the above-mentioned fuel pins. Nevertheless, due to the lack of a more detailed description, no gadolinia-bearing fuel pins were modeled using VACS (Section 3.1.3).
It should also be mentioned that, apart from the reactor dimensions, no uncertainty estimates are provided in [11] for the specific activity measurements or the reactor power distributions. Therefore, the provided power distributions will not be considered here as an absolute reference but rather as a point of comparison, to put into perspective the fission neutron source term calculated using VACS.

3. Modeling and Methods

In order to validate VACS, specific activity estimations for dosimeters placed at the monitoring capsule and in the cavity were performed. In addition, a second methodology that performed the same analysis using the assumptions and data provided in [11] was employed for comparative purposes. Thus, in this section, these two methods are described, as well as the models developed to perform the study.

3.1. Evaluation of the Fission Neutron Source Term

As outlined previously, the first step of the decoupled calculations aims at evaluating the fission neutron source term, which describes the spatial and energy distributions of fission neutrons in the reactor. The fission neutron source term can be evaluated by means of numerical calculations or from experimental power distributions measured in the reactor.
In this analysis, two approaches were used to assess the fission neutron source term:
  • The α approach: the fission neutron source term was evaluated using only the data provided in the benchmark (no additional calculations were made). This first approach aims to follow as closely as possible the assumptions recommended in [11]. It will be used to put into perspective the results obtained using VACS.
  • The β approach: the fission neutron source term was evaluated using VACS, which couples the CASMO5 [20] and SIMULATE5 [21] codes to perform the fission neutron source term assessment.
The following sections provide a description of the α and β approaches. Prior to that, a reminder of the typical approximations made in decoupled calculation schemes is given.

3.1.1. Typical Approximations in Decoupled Approaches

As well as the angular dependency, the number of fission neutrons emitted per second at a time t, per unit volume around a point r in space and per unit energy around an energy E , can be defined as:
S r , E , t = i E R f , i r , E , t · ν i E · χ i E E · d E
where, for an isotope i, R f , i is the fission rate (cm 3 · s 1 · eV 1 ), ν i is the number of neutrons emitted per fission (n), χ i is the fission spectrum (eV 1 ), E is the energy of the neutron inducing the fission (eV) and E is the energy of the emitted neutron (eV).
By identifying the space–energy-dependent fission neutron emission rate of isotope i F i ( E ) = R f , i ( E ) ν i ( E ) in Equation (1), it can be rewritten according to Equation (2):
S r , E , t = i E F i E · χ i E E · d E
where F i is the fission neutron emission rate ( n · cm 3 · s 1 · eV 1 ), χ i is the fission spectrum (eV 1 ), E is the energy of the neutron inducing the fission (eV) and E is the energy of the emitted neutron (eV). F represents the spatial distribution of fission neutrons, whereas χ describes the energetic distribution of these neutrons.
However, two-step calculation schemes such as those used in this article usually perform spatial, energy and isotopic averaging approximations [7], leading to fission neutron source terms of the form of Equation (3).
S M 1 ( E , t ) = F M 1 ( t ) · χ M 2 ( E , t )
where, for a medium M 1 and a medium M 2 (which may or may not be the same), F M 1 is the space–energy-integrated fission neutron emission rate ( n · s 1 ), χ M 2 is the average fission spectrum and E is the energy of the emitted neutron (eV). For example, M 1 and M 2 can represent a fuel pin, a fuel assembly, the entire reactor core, etc.
Equations (2) and (3) imply that F is integrated over all incident neutron energies and every fissile isotope, as well as spatially integrated over the medium M 1 . In the same manner, χ is averaged over the medium M 2 and is also considered to be integrated over all incident neutron energies. The two media M 1 and M 2 are introduced here because the spatial dependence of F is more pronounced than that of χ . Therefore, it is common to use a spatial discretization with a larger mesh for χ than for F.
Since approaches α and β are performed in two steps, their fission neutron source terms follow the formalism of Equation (3). However, both methodologies make additional approximations when evaluating the spatial distribution of fission neutrons (F) and their energy distribution ( χ ). These particularities are described in the following sections.

3.1.2. The α Approach: Use of the Data Provided in the Benchmark

In this first approach, the fission neutron source term is defined to be as close as possible to the data and recommendations given in [11], which leads to the following description of the cycle-averaged fission neutron source term:
S p ( E ) ¯ = F p ¯ · χ c o r e ( E ) ¯ P t h , p ¯ · C f , b e n c h · χ b e n c h ( E )
where, for a fuel pin p, F p ¯ is the cycle-averaged, space–energy-integrated, fission neutron emission rate ( n · s 1 ), χ c o r e ¯ is the cycle-averaged fission spectrum of the reactor core, P t h , p ¯ is the cycle-averaged pin power (MWth), C f , b e n c h is the power-to-emitted-neutrons conversion factor ( n · s 1 · MW 1 ), χ b e n c h ( E ) is the fission spectrum (eV 1 ) and E is the energy of the emitted neutron (eV).
Equation (4) implies that the spatial distribution of fission neutrons is approximated by assuming that fission neutrons are distributed in the reactor in a power-like manner. This means that this approach makes the assumption that the same number of neutrons are emitted per fission in each fuel pin of the reactor. The impact of this hypothesis is therefore of increasing importance as heterogeneities between fuel-pin compositions increase (since 239 Pu fission reactions emit on average more neutrons than 235 U fission reactions). For cycle no. 9 of the HBR-2 reactor, this assumption is likely to underestimate the number of neutrons emitted in depleted assemblies (such as S08, S09, S10, etc.), which contain on average more 239 Pu than other loaded assemblies. In contrast, this hypothesis implies that the fission neutron emission rates of fresh assemblies (such as R06, R07, R08, R09, etc.) are likely to be overestimated (for the opposite reason to the case outlined in the previous sentence). Additionally, the α approach assumes that the recoverable energy per fission is equal for every fission reaction occurring in the reactor. The impact of this hypothesis on the fission neutron distribution is expected to be less important than the previous one, since both 235 U and 239 Pu fission reactions emit energies of about 200 MeV (on average).
As explained in Section 2.2, [11] provides the cycle-averaged pin power distribution of the HBR-2 reactor. Axially, a single distribution was defined for the whole reactor, including 12 divisions distributed over the active height. This distribution is equal to the average of the axial distributions of the assemblies of the two outermost rows. Then, the three-dimensional pin powers were converted into fission neutron emission rates by multiplying them with the power-to-emitted-neutrons conversion factor C f , b e n c h . The value of this parameter considered in approach α was taken directly from [11], which provides a value of 8.175 · 10 16 n · s 1 · MW 1 . This value was evaluated by I. Remec and F.B.K Kam in 1997, using the DOTSOR code [22] and considering a burn-up equal to 28.596 GWd/t. This burn-up corresponds to the average exposure over cycle no. 9 of the assemblies labeled S08, S09 and S10.
Moreover, the α approach considers a single fission spectrum for the entire reactor core. This fission spectrum is equal to the average of the fission spectra of 235 U and 239 Pu, as recommended in [11]. The isotopic fission spectra are approximated here by Watt spectra, using the a and b coefficients indicated in Table 2 (see Section 3.1.3).
Finally, the fission neutron source term was converted into a spatial and energetic source description for an MCNP6 [23] model in which the neutron transport was simulated from the core to the vessel (see Section 3.2). In practice, the spatial distribution of fission neutrons given to MCNP6 is normalized, so that the sum of fission neutron emissions in the reactor core is equal to 1. Therefore, the MCNP6 tally outputs are given per source neutron and are post-processed following the methodology described in Section 3.3, to obtain the dosimeter specific activities.

3.1.3. The β Approach: Use of VACS

In this second approach, the fission neutron source term averaged over the 9th cycle of the HBR-2 reactor was computed using VACS. A detailed description of this methodology can be found in [6], and in this section we only recall the main principles of the calculation scheme. In addition, this section details the few approximations not present in the methodology as described in [6] that had to be made in order to carry out the analysis of the HBR-2 benchmark.
  • Main Principles of VACS
The data flow diagram in Figure 4 represents the different steps of VACS and shows the codes and data used. The calculation steps are sequential and are not automatic. Dedicated scripts are used to prepare parts of the MCNP6 [23] input file, based on the outputs of the SIMULATE5 [21] calculation.
In VACS, the cycle-averaged fission neutron source term is described by Equation (5).
S p ( E ) ¯ = F p ¯ · χ a ( E ) ¯ i R f , i , a ¯ · ν i · X p ¯ · χ a ( E ) ¯
where, for an isotope i and a fuel pin p within a fuel assembly a, F p ¯ is the cycle-averaged, space–energy-integrated fission neutron emission rate ( n · s 1 ), R f , i , a ¯ is the cycle-averaged, space–energy-integrated fission rate over assembly a s 1 , ν i is the average number of neutrons emitted per fission (n), χ a is the average fission spectrum of fuel assembly a (eV 1 ), E is the energy of the emitted neutron (eV) and X p is the pin power reconstruction factor.
Here, the spatial dependency of the fission neutron source term ( R f · ν product) is evaluated by means of core-following calculations performed using a deterministic approach, coupling the CASMO5 [20] and SIMULATE5 codes. The CASMO5 code is used to generate the fuel-assembly homogenized 8-group macroscopic cross-section data. Then, the SIMULATE5 code uses these data as a multi-parametric database (since the energy-group cross sections depend on moderator density, boron concentration, etc.) to compute the full-core fission neutron source term.
On the CASMO5 side, the 2D stationary transport equation (the axial dimension being considered as infinite) is solved for assemblies in an infinite lattice, using a 586-group data library based on the ENDF/B-VII.1 nuclear data [24]. Firstly, the collision probability ( P i j ) method [25] is used with 586 energy groups, on a coarse spatial mesh. Secondly, the method of characteristics (MOC) [25] is used on a refined spatial mesh with 19 energy groups for UOX assemblies and 35 energy groups for MOX assemblies. On the SIMULATE5 side, the diffusion equation is solved for 8 energy groups on 4 radial nodes and 20 axial divisions in each assembly. SIMULATE5 evaluates the total fission neutron emission rate distribution ( F a ( t ) = i R f , i , a ( t ) · ν i ) in the reactor core, at an assembly scale, at multiple burn-up steps throughout the reactor cycle. Then, fuel-pin-level fission neutron emission rate distributions are reconstructed from the assembly level using the 3D form factors of the pin power reconstruction of the SIMULATE5 X p ( t ) [26]. These are multiplicative coefficients that specify how the power of an assembly is distributed among the different pins. In this study, 26 burn-up steps scattered along the cycle were modeled.
Then, the pin-scale fission neutron emission distributions calculated by following the above methodology are used to compute the cycle-averaged fission neutron distribution within the reactor, according to Equation (6).
X ¯ = n = 0 N 1 X n · b u n + 1 b u n b u N
where, for a burn-up step n and a total number of burn-up steps N, X is the quantity to be averaged and b u is the reactor core exposure. Equation (6) means that the quantity X computed at the final burn-up step (N) is not used in the cycle-averaging process. In this study, N was equal to 26.
In the same manner, Equation (6) is used to compute the cycle-averaged, assembly-scale fission neutron emission rates R f , i , a ¯ from the SIMULATE5 data. These are used to compute the cycle-averaged fission neutron spectrum of each fuel assembly χ a ¯ , according to Equation (7).
χ a ( E ) ¯ = i R f , i , a ¯ · ν i · χ i ( E ) i R f , i , a ¯ · ν i
where, for an isotope i and a fuel assembly a, R f , i , a ¯ is the cycle-averaged, space–energy-integrated, fission rate s 1 , ν i is the average number of neutrons emitted per fission (n), χ i is the fission spectrum (eV 1 ) and E is the energy of the emitted neutron (eV).
In Equation (7), the fission neutron spectrum of each isotope is weighted by the probability that a neutron originates from the fission of a particular isotope. Here, only 235 U, 238 U, 239 Pu and 241 Pu are accounted for in the fission spectrum reconstruction. The fission spectra of these four isotopes are pre-evaluated on the basis of either a Watt spectrum or a Maxwell spectrum, using the a and b spectrum coefficients indicated in Table 2. The fission spectrum was compared against the Monte Carlo eigenvalue calculations in [7], and no significant discrepancies were found in the fast neutron fluence assessments at the RPV. It should be mentioned that the use of the Maxwell or Watt spectrum to model isotopic fission spectra is an approximation to the use of experimental spectra. This modeling point may be improved in future versions of VACS.
Finally, the fission neutron source term is automatically converted by a linking tool into a spatial and energetic source description for an MCNP6 model where the neutron transport is performed from the core to the vessel. The spatial representation is treated by using 20 axial divisions in each fuel pin (instead of the 200 used in the original VACS [6]). This approximation was made because it reduces the calculation time of the attenuation calculation (Section 3.2) by a factor of 10, from approximately 1,050,000 min.cpu to 105,000 min.cpu. The authors believe that this simplification of the modeling does not induce a significant bias in the assessments of the dosimeters’ specific activities, since a mesh size of 20 divisions can already be considered as relatively fine. Regarding the energy, the fission neutron spectra of each assembly are described over 2000 energy bins distributed logarithmically between 10 4 MeV and 20 MeV.
In the same way as for approach α , the spatial distribution of fission neutrons provided to MCNP6 is, in practice, normalized so that the sum of fission neutron emissions in the reactor core is equal to 1. Therefore, the MCNP6 tally ouputs are given per source neutron and are post-processed following the methodology described in Section 3.3, to obtain the dosimeter specific activities.
  • Study-Specific Modeling Approximation
One asset of VACS is its ability to take into account the effects related to the history (power variations, control-rod insertions, etc.) of each reactor [6]. This capability is important, because it was shown in [8] that not taking into account the history of the reactor (i.e., modeling a reactor operating continuously at nominal power) can induce a significant deviation in the estimates of RPV aging. However, in order to accurately model the reactor core power variations, it is mandatory to have a detailed description of the control-rod composition, the insertion map of the various rod banks in the reactor and their insertion sequences.
In the case of the HBR-2 reactor, the authors could not find any public data about the insertion sequence of the control-rod banks as a function of the reactor power level. Therefore, the reactor was modeled as operating at full power with all control-rod banks fully extracted. Considering the study detailed in [8], this approximation could bias the dosimeter activity estimates by up to about 8%. However, this value must be considered with caution, as it was obtained with control-rod management that was probably very different from that used in the HBR-2 reactor. Indeed, the control-rod type and the insertion map of the different banks given in [8] (which correspond to those used in several French 900 MW e PWRs) significantly differ from the data found for the HBR-2 reactor in [17]. It is therefore only possible to say here that this assumption could lead to a non-negligible bias in the evaluations of the specific activities of the dosimeters.
Based on this assumption, the end of the cycle was automatically determined by SIMULATE5 by seeking for the point in time at which the critical boron concentration equaled 0 ppm. This process resulted in an estimated cycle length equal to 10.258 GWd/t. This value is 3.5% lower than the value given in the benchmark data [11], which seems reasonable given the approximations made regarding the reactor operation.

3.2. Modeling Fission Neutron Attenuation from the Core to Sites of Interest

The second step of the calculation deals with the transport of fission neutrons from the core to sites of interest (i.e., the dosimeters located at the monitoring program capsules or in the cavity), using the fission neutron distribution determined in the previous step. To perform this step, a MCNP6 fixed source calculation [27] was performed using a model developed on the basis of the “HBRHE81” MCNP5 input file, available on the SINBAD database, which was initially provided by P. Ortego (Shielding Engineering and Analysis, Spain).
The following sections describe the reactor model as provided in the “HBRHE81” input file and highlight the modifications made by the authors. The model developed in this process was used to perform fixed source calculations using the fission neutron source terms generated using the α and β approaches. The MCNP6 fixed source calculation allows the evaluation of the per source neutron isotopic reaction rates in the dosimeters, which are then post-processed to obtain the specific activities.

3.2.1. Reactor Geometry

The reactor geometry described in the “HBRHE81” input file was used without modification. It describes one eighth of the HBR-2 reactor with reflection boundary conditions on the surfaces acting as symmetry cuts. Figure 5 displays a radial cut of the model in the equatorial plane (i.e., the axial position 0 cm). Similarly, Figure 6 presents an axial cut of the model in the 20° azimuthal plane (i.e., the plane in which the capsules are lefted).
The reactor core is described at a pin level, with assemblies described according to the geometry presented in Figure 1. (In Figure 5 and Figure 6, the reactor core appears in black due to graphical artifacts resulting from the very large number of surfaces to be displayed in this area.) The inside of the guide tubes is filled with borated water, in order to model the reactor as operating with all control rods fully extracted. The boron concentration in the moderator here was adjusted to match 500 ppm (which is the recommended value in the benchmark data [11]). Moreover, in the “HBRHE81” input file, all the fuel rods are composed of fresh uranium oxide (UO 2 ) enriched to 2.9% by mass of 235 U. Although the impact of this approximation on the dosimeter activity estimates is expected to be small (see [10]), it was decided to adjust this fuel composition in order to take into account the burn-up of the fuel in the isotopic vector. The fuel composition was taken here from [28], in which an ORIGEN-6.1 [29] evolution calculation was performed to compute the isotopic vector of the spent fuel for a burn-up equal to 27.4 GWd/t. This fuel exposure corresponds to the average of the cycle-averaged burn-up of assemblies S09 and S10. These assemblies were selected because they are located in the core periphery and are therefore strong contributors to the dosimeters’ specific activities (especially in the cavity).
In the “HBRHE81” input file, the moderator density is homogeneously equal to 0.766 g·cm 3 in the reactor core. This density corresponds to a temperature of about 280 °C under the pressure conditions of cycle no. 9 (approximately 155 bar). In the same manner, the moderator density is homogeneously equal to 0.776 g·cm 3 (∼273 °C) in the moderator bypass region (between the baffle and the barrel, see Figure 2) and to 0.787 g·cm 3 (∼267 °C) in the downcomer regions (see Figure 2). These values correspond to those recommended in the benchmark [11] and have not been modified.
In the surveillance capsule, A533B steel plates (equivalent to the RPV steel) are placed at the 28 cm, 0 cm and +28 cm axial positions (three plates per axial location). These plates are coated with a thin layer of gadolinium and mounted on a stainless steel (SS-304) support (see Figure 5). Each steel plate is 15 cm high and approximately 1 cm thick. In the “HBRHE81” input file, the total width of the surveillance capsule (including its support) is approximately equal to 5°. This value is not consistent with the data provided in [11], where a total width of 2.13° is specified. Nevertheless, it seems reasonable to consider here that this modeling discrepancy has only a small impact on the assessment of the dosimeter specific activities compared to the overall uncertainty of such assessments. As an illustration, the ± 1 σ uncertainty in the estimates of the HBR-2 dosimeter specific activities was quantified as equal to approximately 15% in [13]. Therefore, the monitoring capsule modeling was not modified when performing the validation study. For the geometry cell associated with the cavity dosimeter, the modeling provided in the “HBRHE81” input file was not modified. The cavity is located just behind the RPV insulation and contains air (see Figure 5). The cell measures 10 cm in width and 76 cm in height, with a thickness of 1.1 cm. The air volume is surrounded by a thin layer of cadmium, which is also surrounded by a thin layer of aluminum (each about 0.05 cm thick).
Finally, all the nuclear data used to model neutron transport in the “HBRHE81” input file were considered at 300 K. In the present study, the MCNP input file was modified so that the cross sections used for the transport calculation were considered:
  • At 900 K in the fuel;
  • At 600 K in the moderator;
  • At 600 K in all regions between the reactor core and the vessel (including the RPV);
  • At 300 K in all regions outside the vessel.
For the α approach (Section 3.1.2), only the ENDF/B-VII.1 library [24] was used to model neutron attenuation. For the β approach (Section 3.1.2) the following nuclear data libraries were used: ENDF/B-VII.1, ENDF/B-VIII.0 [30] and JEFF-3.3 [19]. All cross sections used were processed using the NJOY2016 code [18].

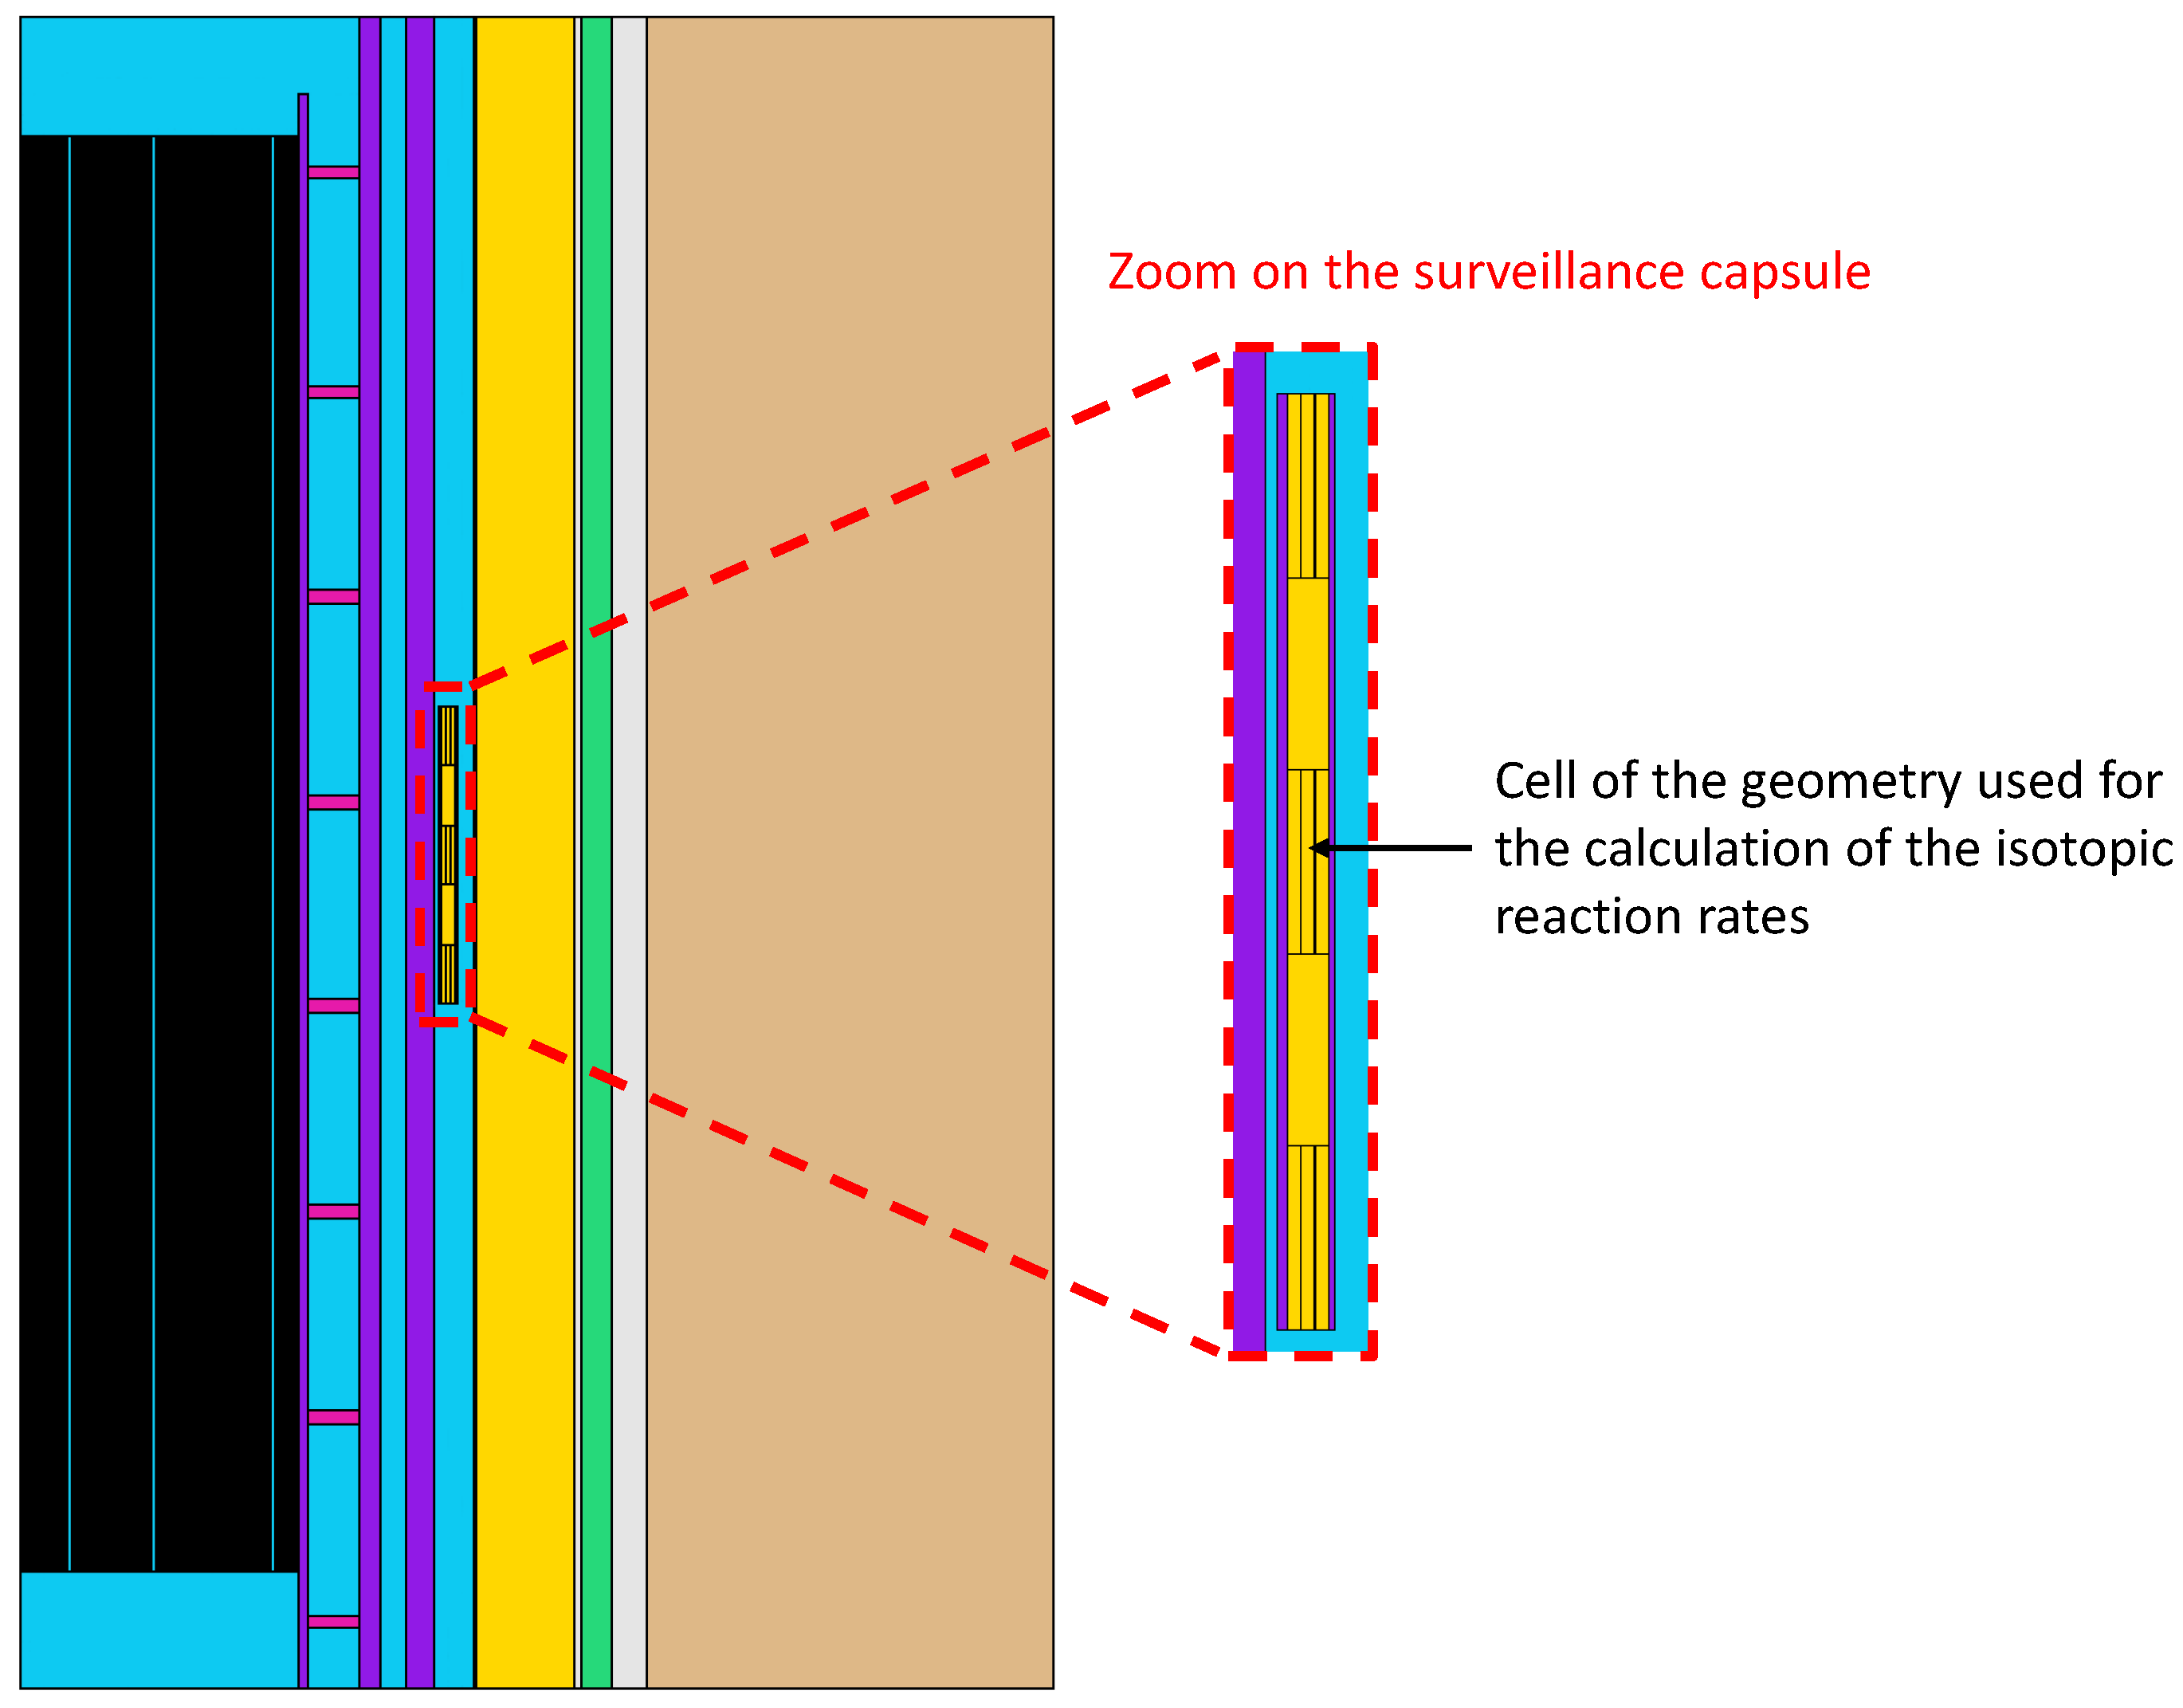
3.2.2. Modeling of the Dosimeters

The dosimeters located in the surveillance capsule and in the cavity are not “physically” modeled in the MCNP6 model. Therefore, the isotopic reaction rates (which are used to compute the specific activities) were evaluated in the central steel plates of the surveillance capsules as well as in the geometry cell corresponding to the cavity (see Figure 5). The two considered cells were axially located in the equatorial plane (Z = 0 cm), since the experimental activities (see Table 1) are provided only for this axial plane. The isotopic reaction rates are evaluated from the average neutron fluxes in these cells. For this purpose, the “F4” MCNP6 cell flux tallies [27] are combined with the “FM” cards [27], which are used to multiply the evaluated neutron flux by the cross sections of the reactions of interest. The dosimeter composition is not explicitly given in the SINBAD database. However, a fictitious material (the term “fictitious material” refers here to a material which is not used in the definition of the geometry) representative of the dosimeter composition was defined in the “HBRHE81” input. This material can therefore be associated with the “FM” cards in order to calculate the isotopic reaction rates. The composition of this material is shown in Table 3. However, it is important to note that this dosimeter composition could not be found elsewhere in the benchmark data. Regarding the dosimetry cross sections, the following libraries were tested to calculate the reaction rates:
  • The nuclear data library used to model the neutron transport (ENDF/B-VII.1, ENDF/B-VIII.0 or JEFF-3.3);
  • The IRDFF-II (International Reactor Dosimetry and Fusion File) library [31].

3.2.3. Variance Reduction and Simulation Parameters

To improve the calculation efficiency of the MCNP6 fixed source calculation, the weight-window variance reduction method [27] was used. The weight-window parameters were optimized for 47 neutron energy bins covering the range [ 10 5 eV–17.3 MeV]. This evaluation was performed using the ADVANTG-3.2 tool [32], which uses the deterministic code DENOVO [33]. A set of optimized weight windows for both dosimeter locations (capsule and cavity) and for all reactions was generated using the forward-weighted CADIS method [34]. Finally, an MCNP6 attenuation calculation was performed for each of the nuclear data library combinations in the studied approach (e.g., the β approach with the ENDF/B-VII.1 library). In each fixed source calculation, 8 · 10 9 neutron histories were simulated, leading to a statistical uncertainty σ of about 0.2–2% in the reaction rate estimates.

3.3. Post-Processing of MCNP6 Tally Outputs

As explained previously, the fission neutron source term provided and used in the MCNP6 attenuation calculation was normalized so that the sum of fission neutron emissions in the reactor core was equal to 1. Therefore, the MCNP6 calculation provides an estimate of the dosimeter reaction rates R c , k in units of reaction · sourceneutron 1 · atom 1 . In order to obtain R c , k in units of reaction · s 1 · atom 1 , the results for the MCNP6 tallies must be post-processed according to Equation (8).
R c , k = P t h , c o r e ¯ · C f · T c , k 8
where, for a reaction c and a dosimeter location k, T c , k is the MCNP6 tally output ( reaction · neutron 1 · atom 1 ), P t h , c o r e ¯ is the average thermal power of the reactor core in cycle no. 9 (which is approximately equal to 1730 MWth) and C f is the power-to-emitted-neutrons conversion factor ( neutrons · s 1 · MW 1 ). The factor 1/8 is added to account for the fact that only one eighth of the reactor is modeled in the MCNP6 attenuation calculation.
On the one hand, for the α approach (Section 3.1.2), the C f coefficient value was taken from the study performed by I. Remec and F.B.K Kam [11], in which a value of 8.175 · 10 16 neutrons · s 1 · MW 1 is specified. As explained before, this value was evaluated using the DOTSOR code [22] for a burn-up equal to 28.596 GWj/t, which corresponds to the average exposure of the S08, S09 and S10 assemblies in cycle no. 9. On the other hand, for the β approach (Section 3.1.3), the C f coefficient was evaluated according to Equation (9), using the cycle-averaged data calculated by SIMULATE5.
C f = a i R f , i , a · ν i ¯ P t h , S 5 ¯
where, for an isotope i and an assembly a, R f , i , a · ν i ¯ is the cycle-averaged fission neutron production ( neutrons · s 1 ) and P t h , S 5 ¯ is the average thermal power of the reactor over the cycle modeled with SIMULATE5 (2300 MWth = reactor nominal power).
Equation (9) led to an estimate of C f equal to 7.93302 · 10 16 neutrons · s 1 · MW 1 . This value is slightly lower than the one given by I. Remec and F.B.K Kam. This observation is consistent with the observations made in [13], suggesting that the estimate of C f evaluated by I. Remec and F.B.K Kam is an overestimate of the actual C f value. Finally, the C f coefficient evaluated using Equation (9) was used to post-process the results of the MCNP6 attenuation calculation for the β approach.
Once the reaction rates R c , k are evaluated, the dosimeter specific activities A k (in units of Bq · mg 1 ) are deduced from R c , k , according to Equation (10).
A c , k = f c , k · R c , k
where, for a reaction c and a dosimeter location k, f c , k is the reaction rate for a specific activity conversion factor ( atom · mg 1 ) and R c , k is the reaction rate ( reaction · s 1 · atom 1 ). The values of f c , k used in this study were taken from [15] and are summarized in Table 4.
Finally, the calculated specific activities were directly compared to the experimental data using the C/E ratio, defined by Equation (11).
C / E = A c a l c A e x p
where A c a l c is the activity calculated with the α or β approaches ( Bq · mg 1 ) and A e x p is the experimental specific activity provided in the benchmark data ( Bq · mg 1 , see Table 1).
The C/E ratios are the quantities that measure the accuracy of the calculation scheme. C/E ratios close to 1 indicate accurate modeling. The further away from 1 the C/E ratios are, the more the modeling quality can be questioned.

4. Results

4.1. Spatial Distribution of Fission Neutrons

First, the spatial distribution of fission neutrons obtained with the β method was compared to that reconstructed from the data provided in the benchmark ( α approach). Figure 7 shows the relative differences between the two approaches.
Figure 7. Relative differences (%) between the cycle-averaged fission neutron distributions evaluated with the α and β approaches ( β α α ). Differences are presented at the assembly scale (top) and at the fuel-pin scale (bottom). For pin-scale differences, only values less than or equal to 20% are displayed, for viewing convenience.
Energies 15 05098 g007
At the assembly scale, the observed differences are mostly below 3% (in absolute value) in the left of the core and tend to increase up to 8.76% for peripheral assemblies. A significant asymmetry in the relative differences can be observed between the left and right sides of the core. This behavior originates from the cycle-average powers provided by [11], which are asymmetrical between the left and right sides of the core. This observation suggests that there is a power tilt in the reactor core, which cannot therefore be reproduced with the β approach. At the pin scale, the differences are relatively homogeneous within the assemblies located in the core left, with some local increases (in absolute value) at the junctions between two assemblies with significantly different burn-up values (thus with differing 239 Pu contents). In contrast, a strong increase in the relative differences is observed for the outermost rows of pins, for which the β approach systematically overestimates the fission neutron production rates compared to the α approach. These overestimates reach 200% for some fuel pins (not shown in Figure 7 for viewing convenience) and can be explained by the fact that the pin powers provided in [11] for these fuel pins are very low.
It is also interesting to note that the β approach overestimates the fission neutron production rates in the S08, R08, R09, S09, R10 and S10 assemblies, which are the main contributors to the neutron flux in the cavity. In contrast, the fission neutron production rates in the other assemblies contributing to the neutron flux in the capsules (e.g., R12, P13, N14, etc.) tend to be underestimated by the β approach compared to the α approach. Considering these results, it is likely that the β approach will lead to higher specific activity predictions in the cavity than the α approach. Moreover, only a small variation in the predictions of the capsule specific activities is expected when switching from the α to the β approach, due to compensation effects (e.g., the fission neutron production rate of assembly S10 is overestimated while that of assembly R12 is underestimated).
Overall, it is likely that most of the differences explained above result from model differences between the α approach and the β approach, as follows:
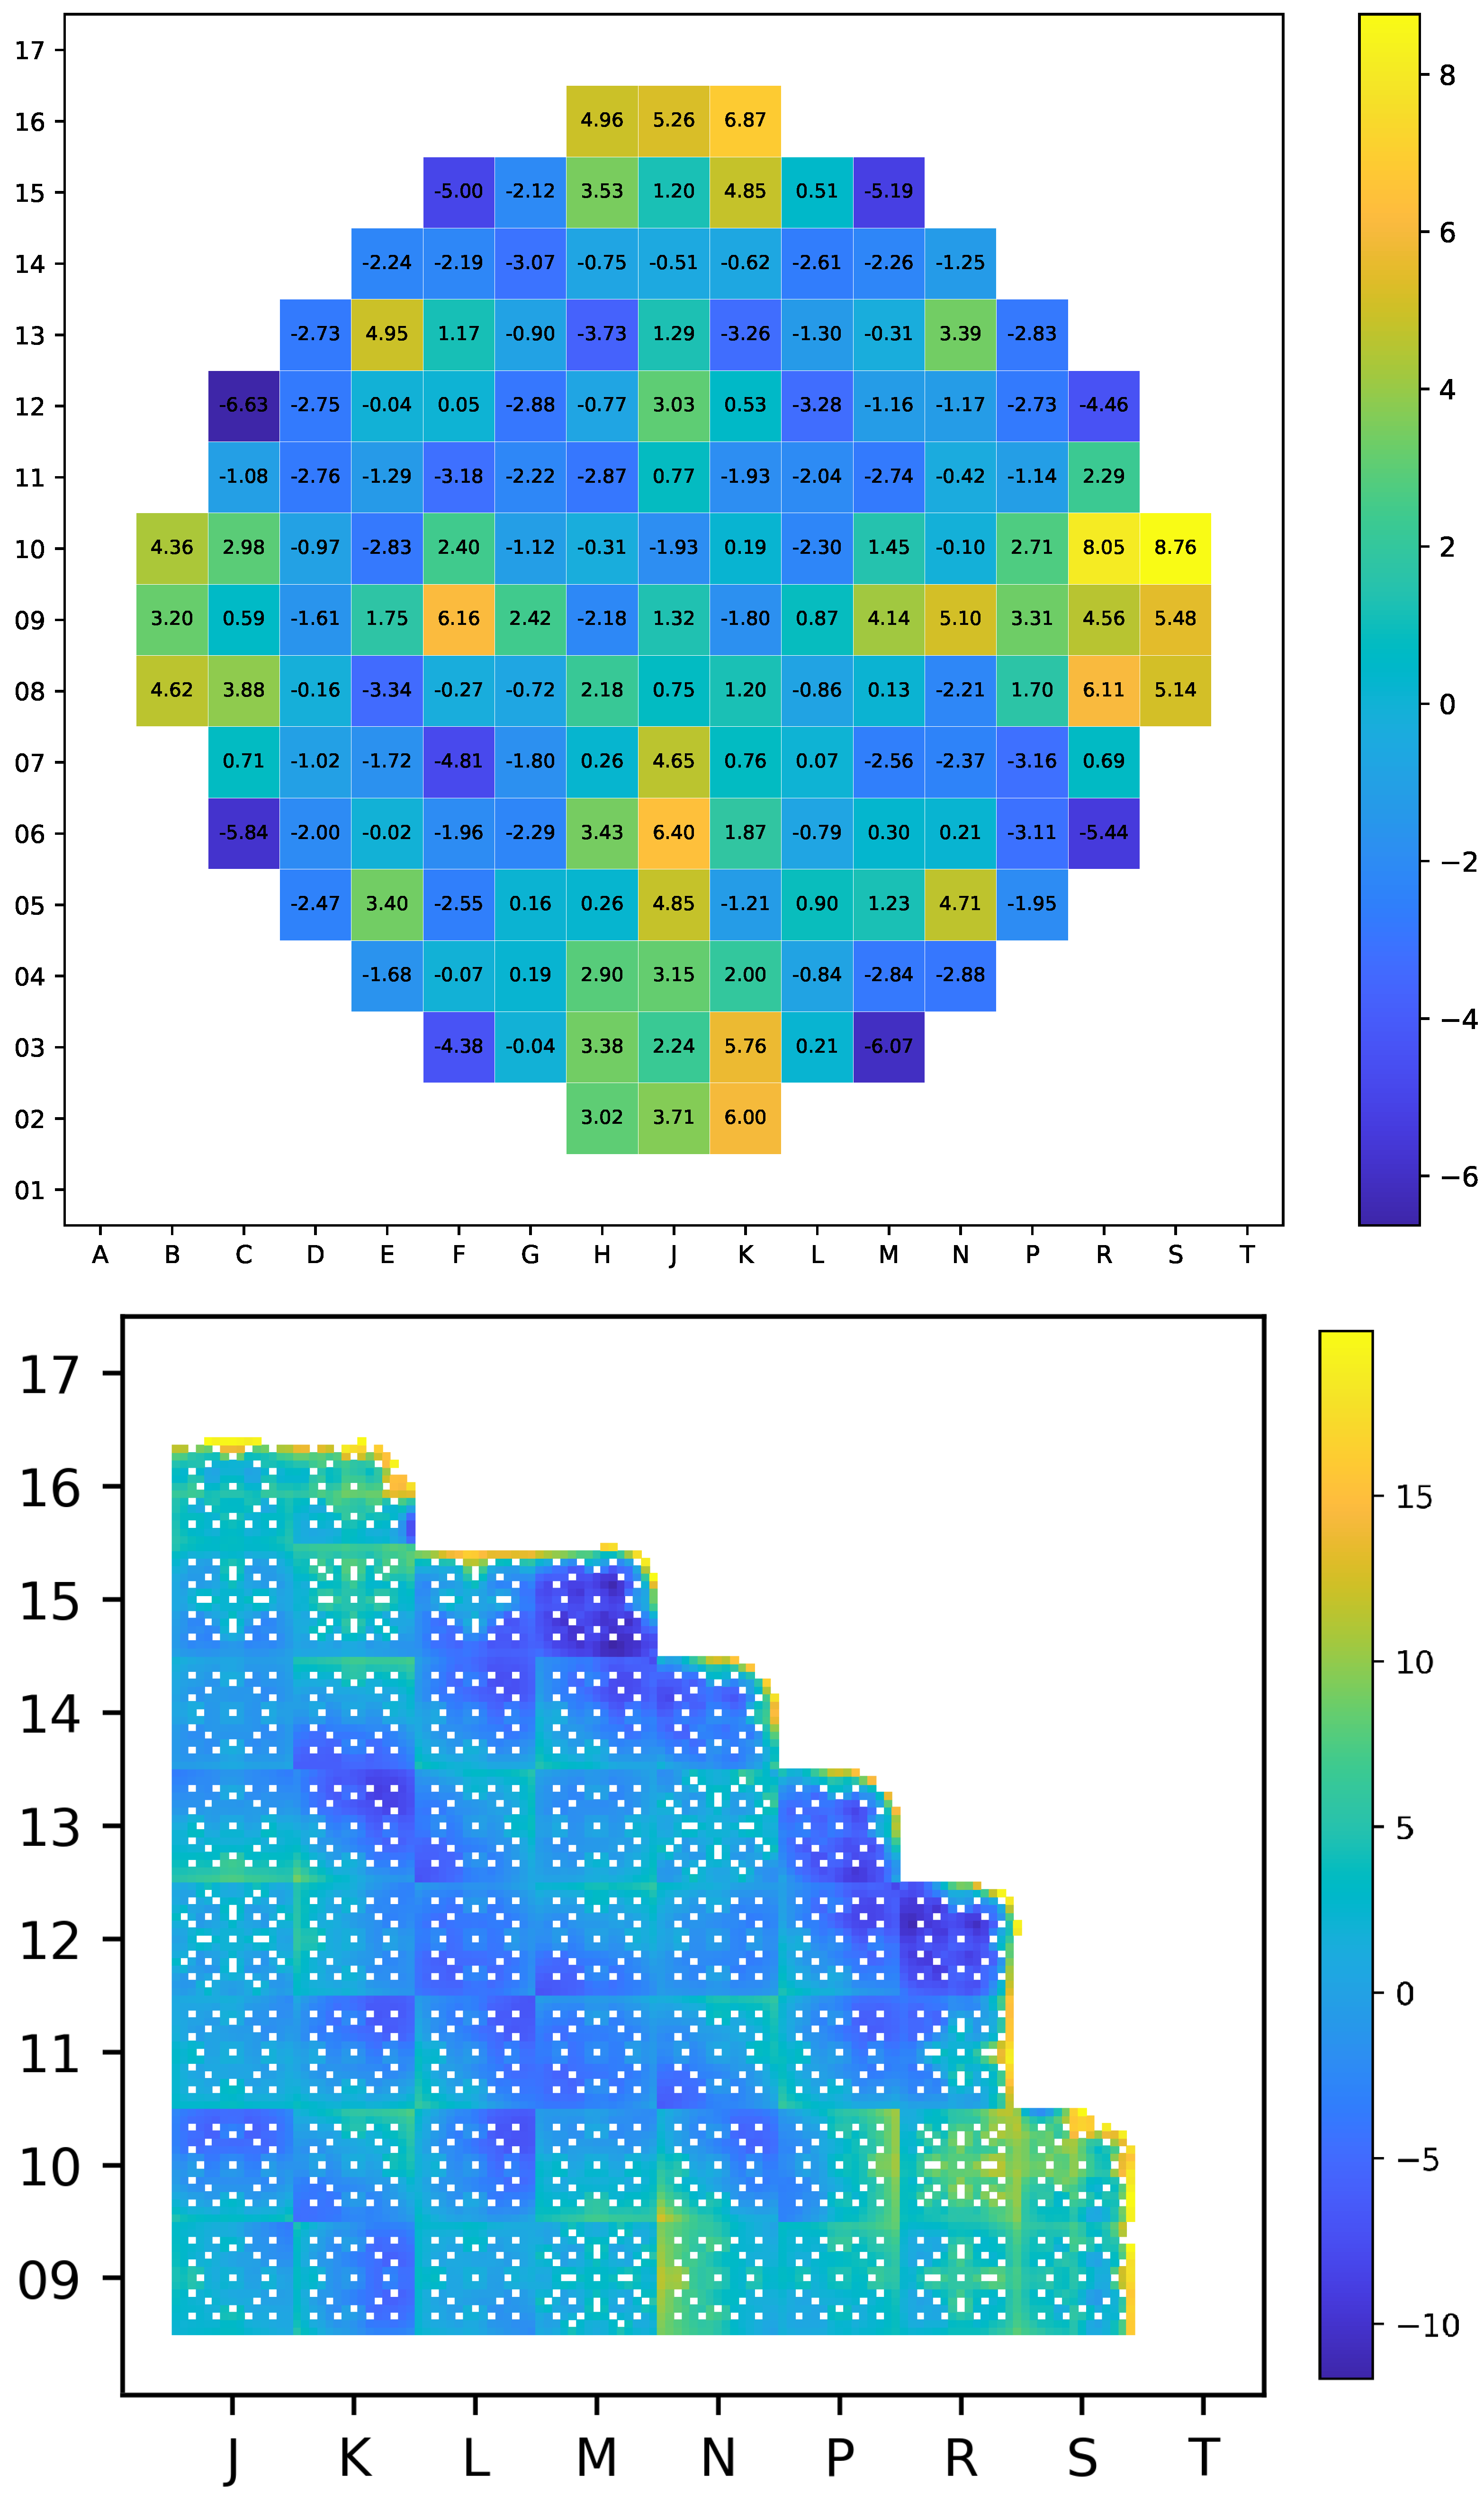
  • The methodology employed to evaluate the fission neutron source term in the β approach uses the SIMULATE5 code which is based on the diffusion approximation. In comparison, the cycle-averaged power distribution provided in [11] was evaluated from burn-up distributions that were probably obtained by combining experimental data and neutronics calculations.
  • The fission neutrons are distributed in the same way as the thermal power in the α approach. In contrast, the β approach computes the spatial distribution of source neutrons using the fission neutron production rates (product R f · ν ), which is a more accurate approach in the context of a reactor containing assemblies with various exposures.
  • In the β approach, the reactor core was modeled as operating at nominal power. However, the power history of the reactor was probably taken into account in the α approach.
  • Assemblies R09, R10 and R11 are among those that were likely to contain gadolinium-bearing fuel rods, which were not modeled in the β approach. Nevertheless, the trends observed here are consistent with the fact that these assemblies could contain gadolinia-bearing fuel rods.
  • The nuclear data library used in the β approach to evaluate the fission neutron source term (based on ENDF/B-VII.1) probably differs from the one used in the α approach.
At this point in the paper, it is not possible to discuss the quality of the two fission neutron source terms. Such an analysis will be performed in Section 4.3, which discusses the C/E obtained with both approaches.

4.2. Dosimeter Reaction Rates

Reaction rates were calculated using the average fission neutron distribution in cycle no. 9, evaluated using the α or β approaches. Post-processing of the MCNP6 tally outputs was performed as described in Section 3.3. The obtained results are presented in Table 5 for the capsules and in Table 6 for the cavity. In order to have a point of comparison, these tables also summarize the reaction rates calculated in 1997 by I. Remec and F.B.K Kam [11], using the two-dimensional transport code DORT [35] and the nuclear data library BUGLE-96 [36]. Putting Table 5 and Table 6 side by side, it can be seen that the standard deviation of the MCNP6 tallies are systematically lower in the cavity than in the capsule. This behavior is due to the parameterization of the weight windows generated by the ADVANTG-3.2 code, which was more successful for neutron histories heading toward the cavity than for those heading toward the surveillance capsule. In general, the obtained standard deviations for the reaction rate estimates were inferior or equal to 1%. However, they were slightly more pronounced for the 46 Ti(n,p) and 63 Cu(n, α ) reactions, for which they reached 1.65% and 2.21%, respectively (in the cavity). This behavior is induced by the fact that these reactions have an energy threshold of the order of 4 MeV (see Figure 3). Indeed, the number of high-energy neutrons in the surveillance capsule and in the cavity is rather low compared to the population of low-energy neutrons.
Table 6 shows that the reaction rates obtained in the monitoring capsules with the β approach are globally similar to those obtained with the α approach (with equivalent nuclear data libraries). In contrast, Table 6 highlights that the reaction rates obtained with the β approach in the cavity are systematically higher than those obtained with the α approach. These results are consistent with what was expected from analyzing the differences between the fission neutron source terms of the two approaches (see Section 4.1). Moreover, the results obtained with the ENDF/B-VII.1 and JEFF-3.3 libraries are globally consistent. In contrast, the reaction rates obtained with ENDF/B-VIII.0 are largely lower than those obtained with the other libraries. This trend is not improved by using the IRDFF-II library to evaluate reaction rates. These observations therefore indicate that the modeling of neutron transport from the core to the sites of interest is significantly different with the ENDF/B-VIII.0 library compared to the other libraries. These tendencies were also observed in a more extended study of ex-core dosimeter validations [37]. Finally, the reaction rates obtained in the surveillance capsule with the ENDF/B-VII.1 and JEFF-3.3 libraries are, on average, slightly lower than those obtained by I. Remec and F.B.K Kam. Conversely, the reaction rates evaluated with the ENDF/B-VII.1 and JEFF-3.3 libraries are slightly higher than those calculated by I. Remec and F.B.K Kam. Given that the specific activity predictions of I. Remec and F.B.K Kam tend to be inferior to the experimental values [11], an improvement in the C/E in the cavity and a slight degradation in the C/E in the surveillance capsule can be expected.

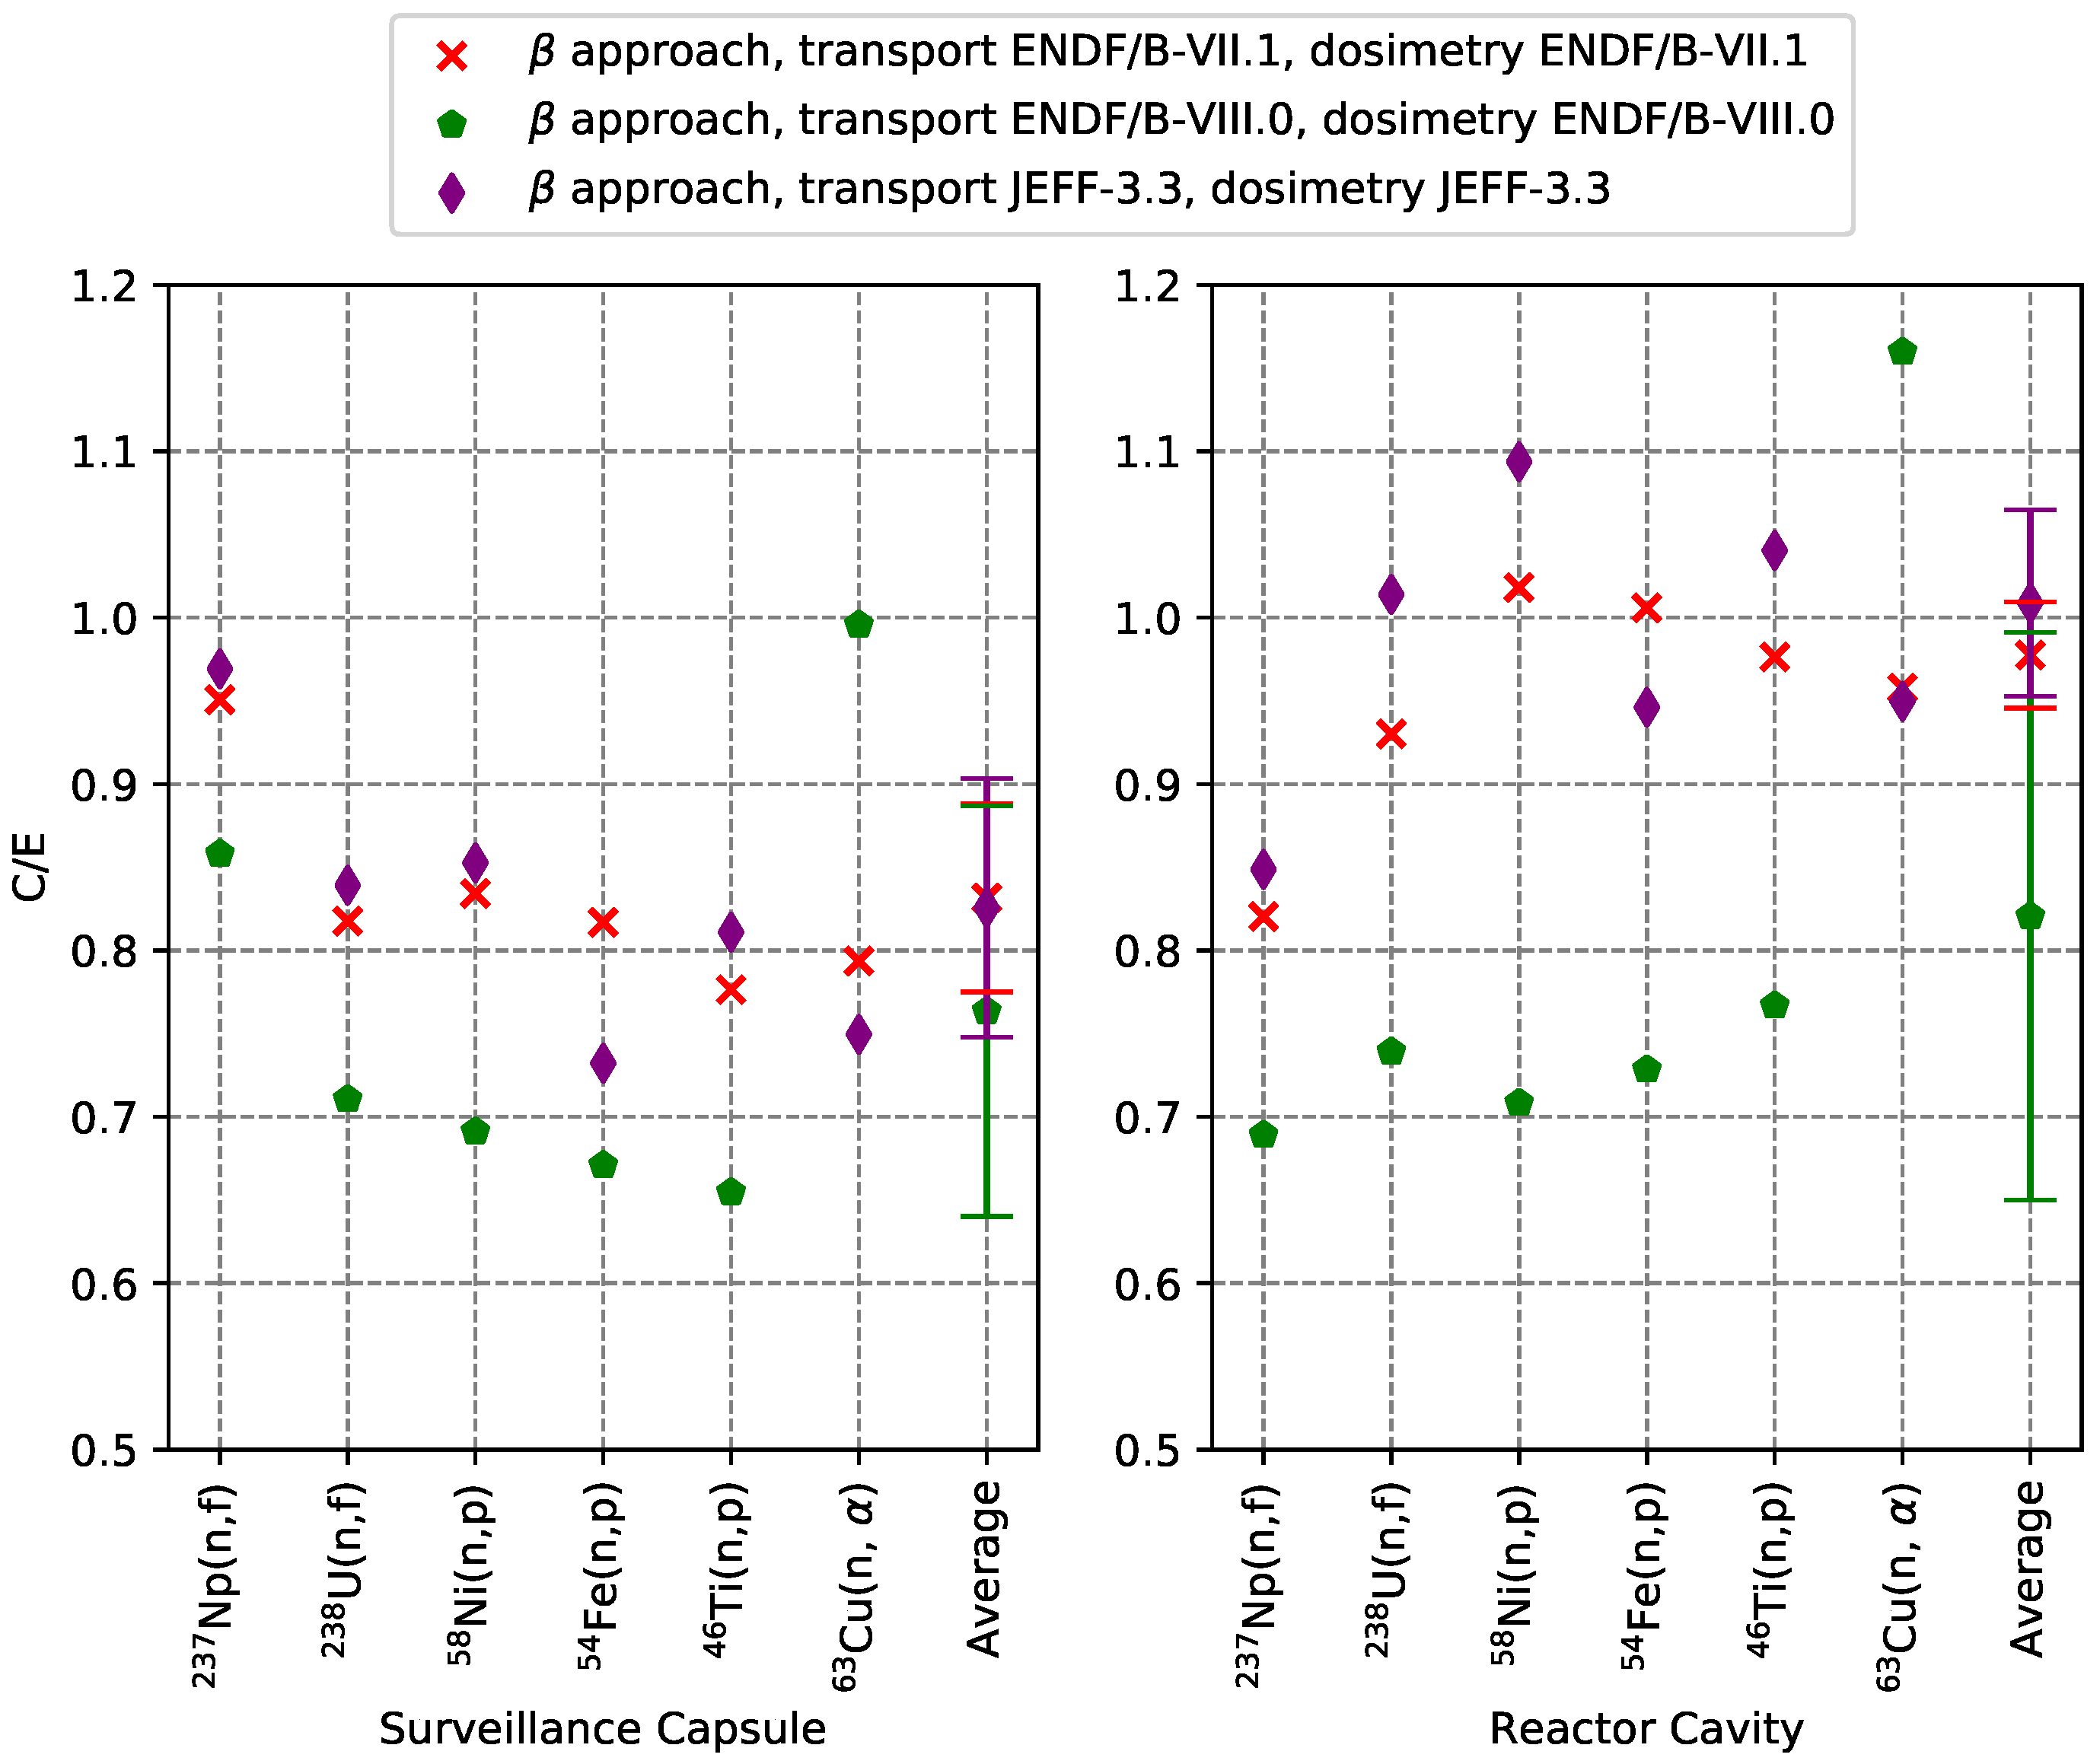
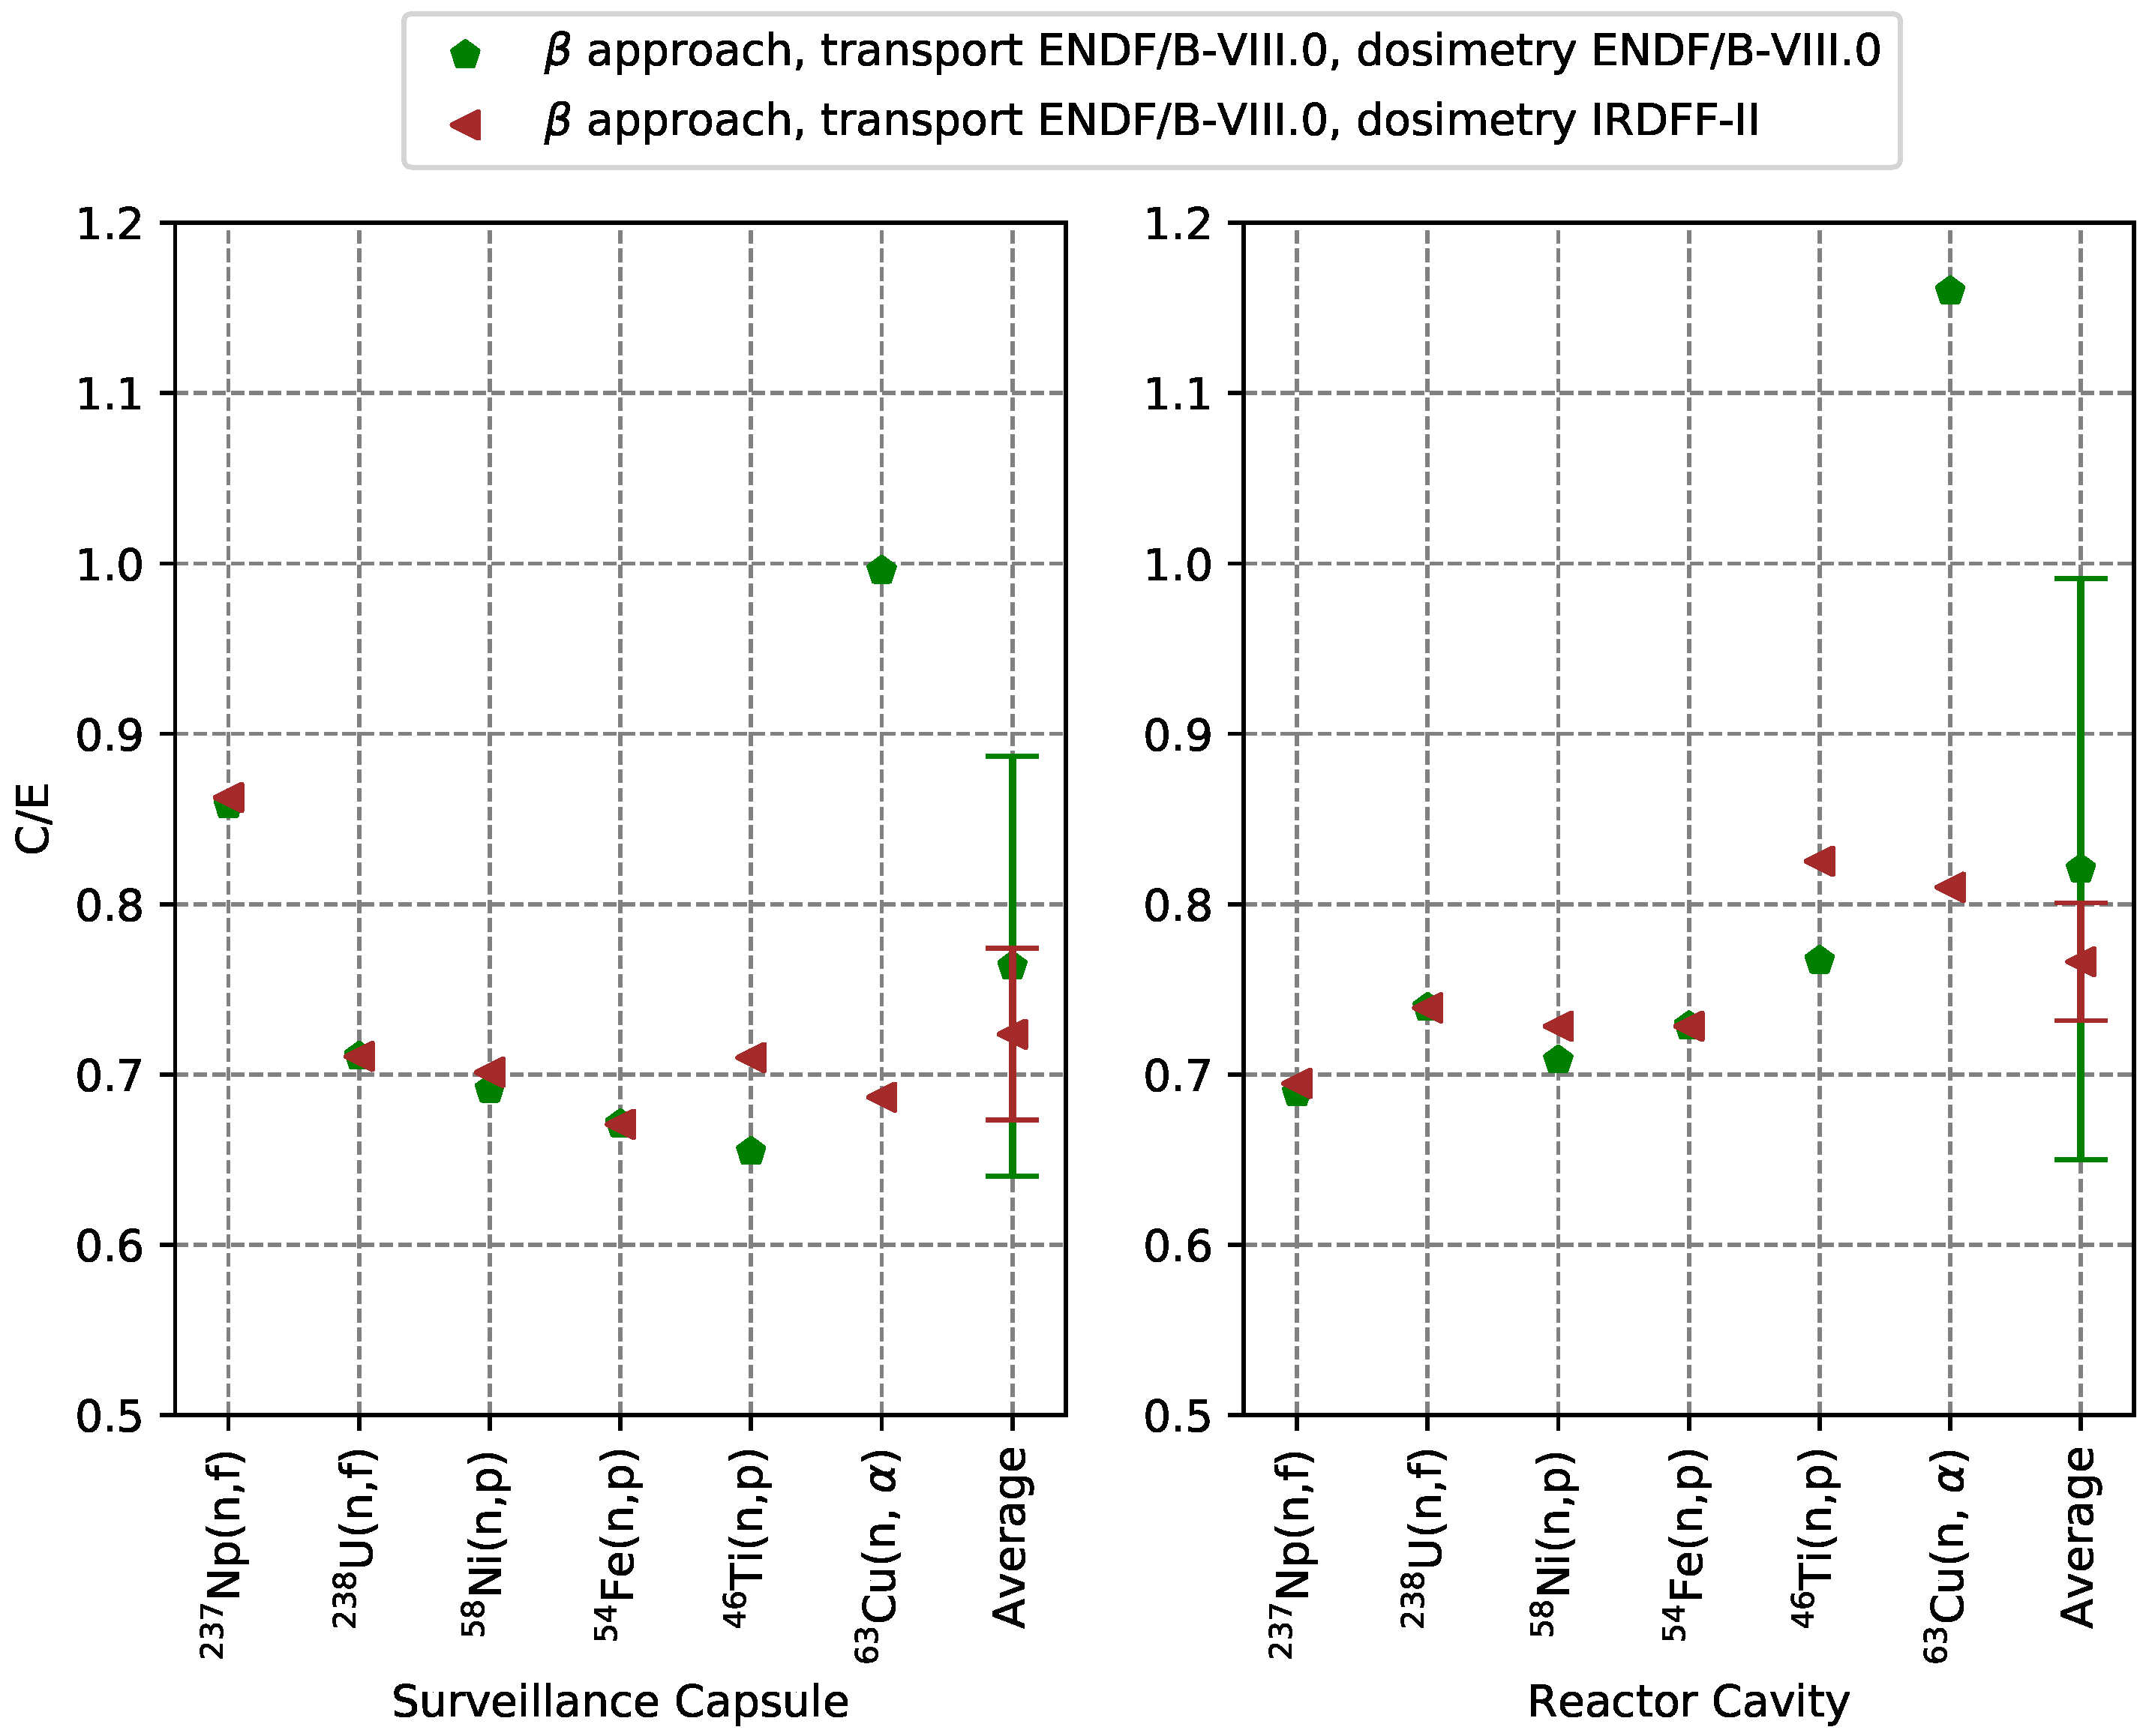
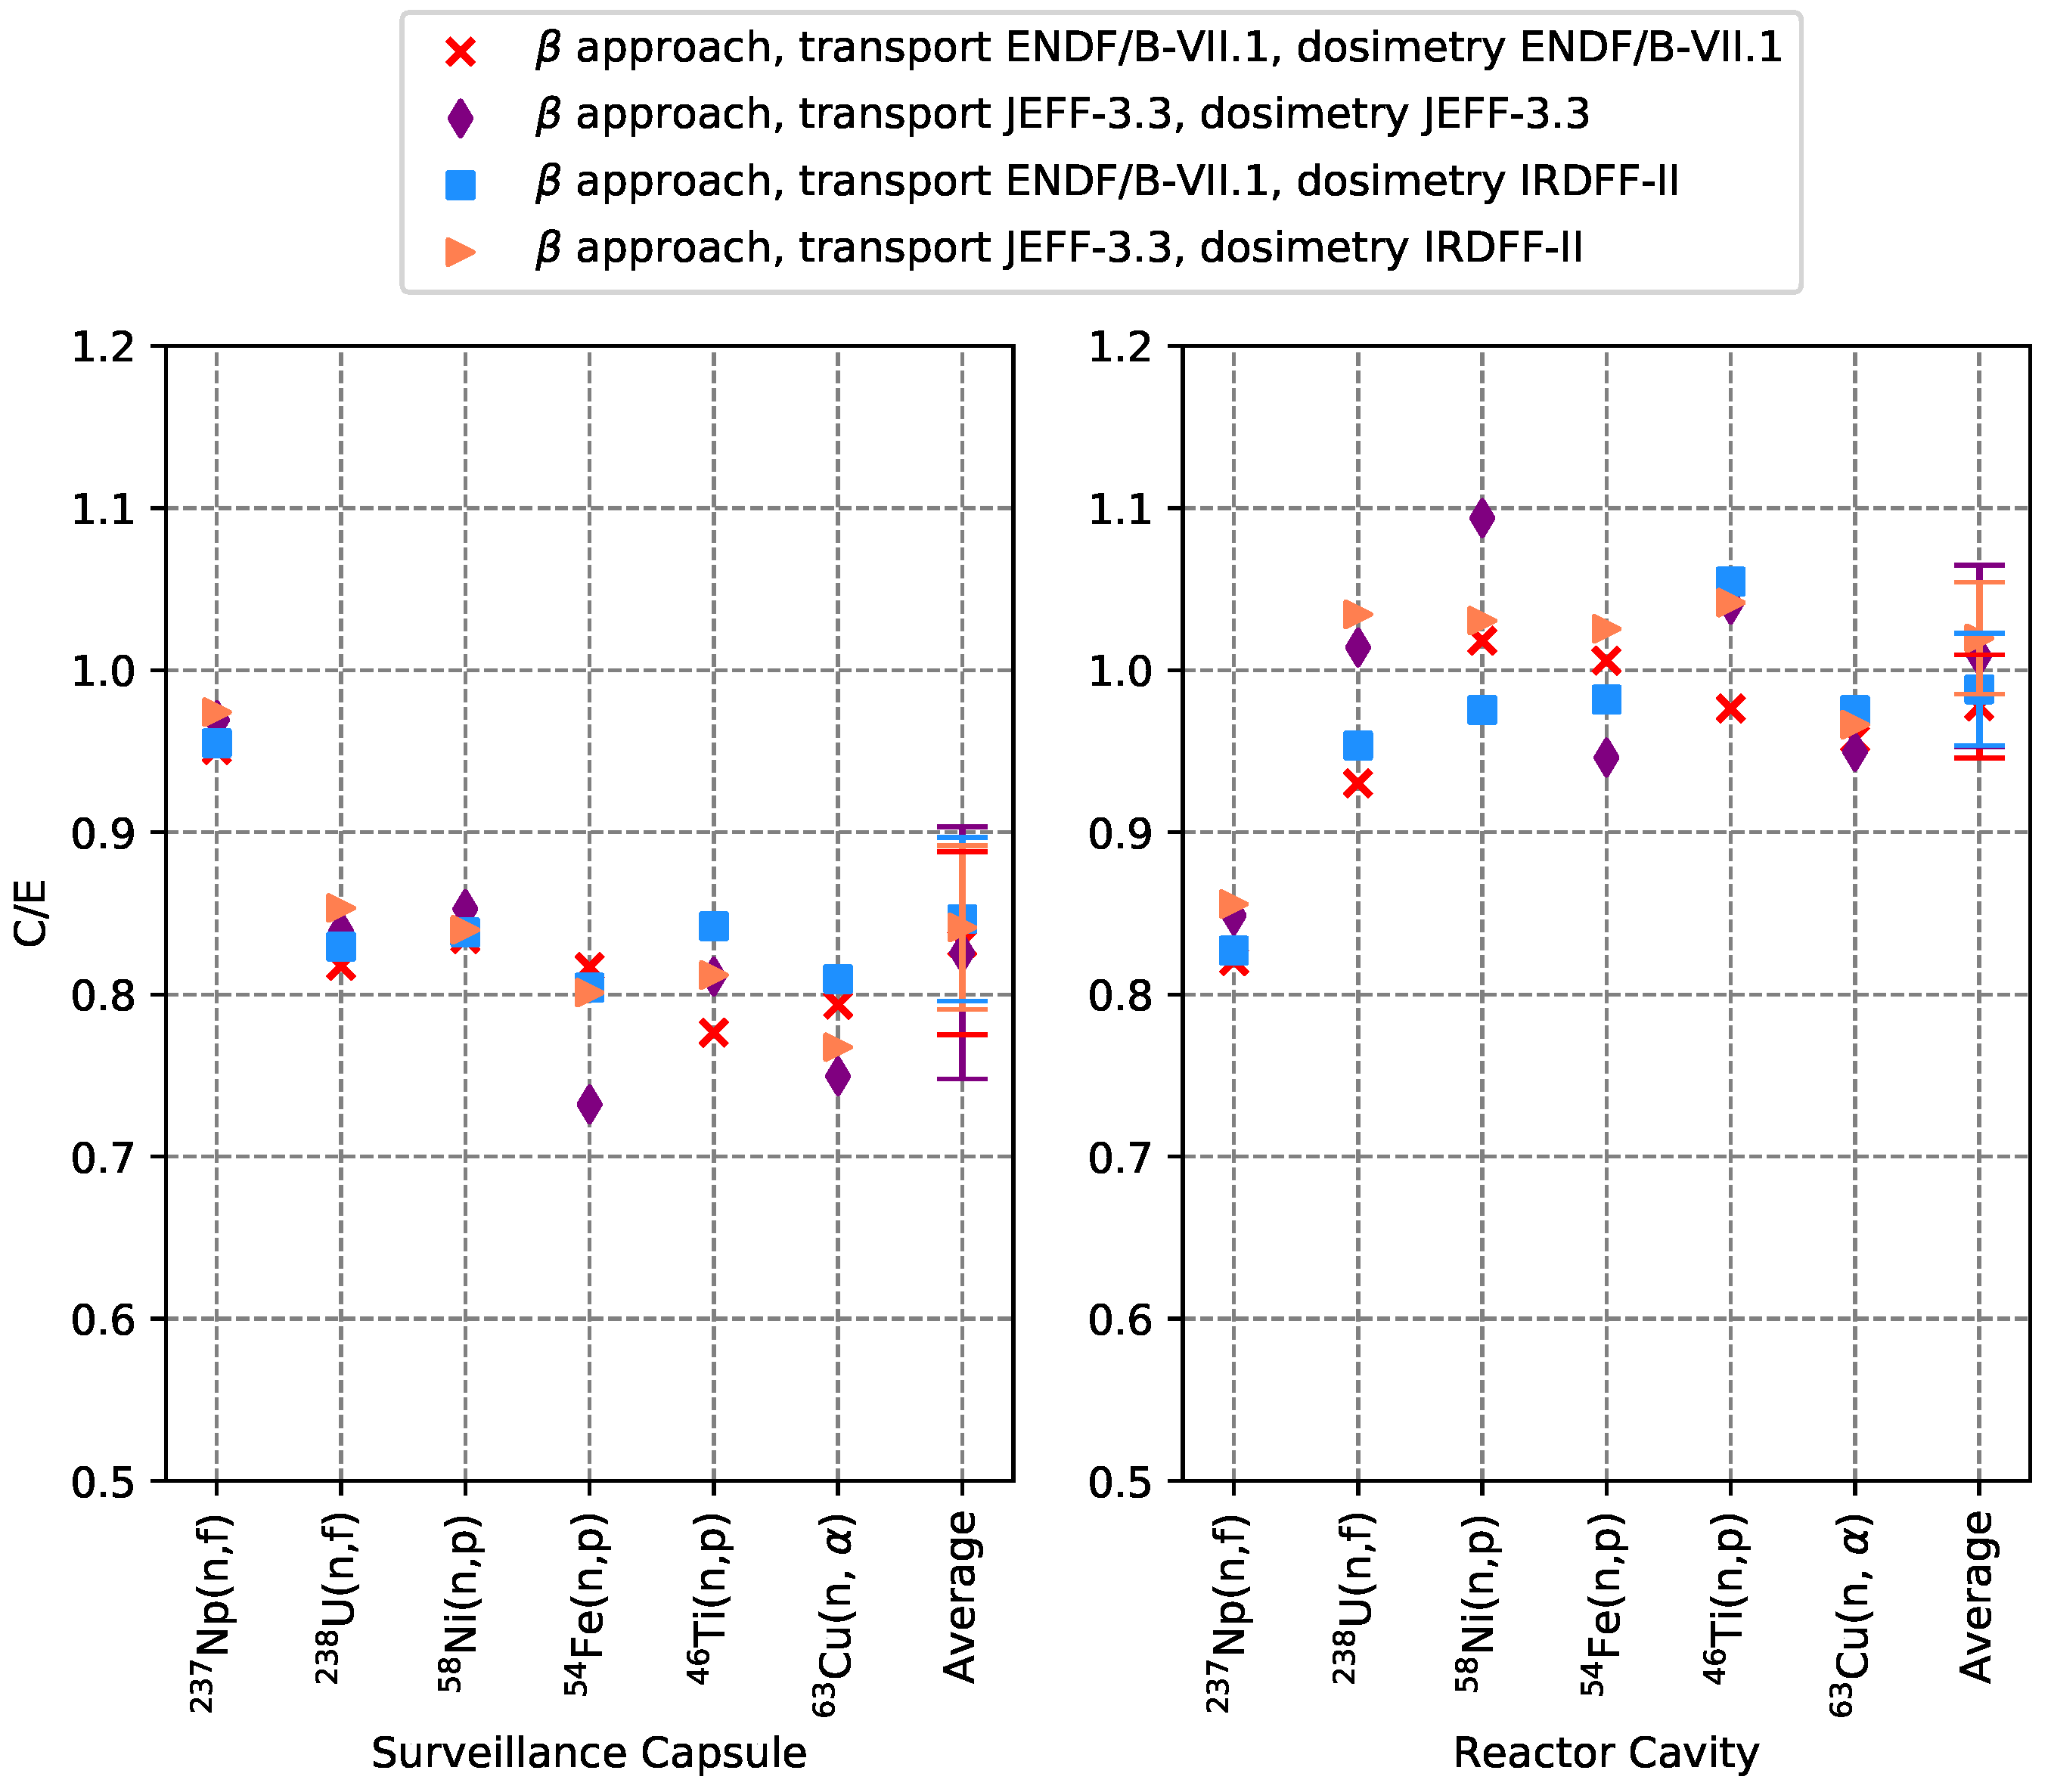
4.3. Dosimeter Specific Activities

The specific activities of dosimeters and the associated C/E ratios were calculated from the reaction rates, as described in Section 3.3. Figure 8 presents the results obtained using the α and β approaches with the ENDF/B-VII.1 nuclear data library. In the same way as before, the results obtained by I. Remec and F.B.K Kam are shown here in order to provide a point of comparison.
In Figure 8 (and in those following), we chose not to represent the statistical uncertainties of the C/E values, as these were not significant. Only the standard deviation of the average C/E is shown, which is significantly greater than the statistical uncertainty of the Monte Carlo calculations. Nevertheless, it is still worth mentioning that the uncertainty propagation work done by R. Pittarello et al. in [13] showed that, in the case of the HBR-2 benchmark, the ±1 σ uncertainty in the specific activity assessments can be of the order of 15%.
For the surveillance capsule, the C/E ratios obtained with the α and β approaches are relatively similar and remain above 0.8 overall. The average C/E value is, in both cases, approximately equal to 0.84. The left side of Figure 8 also shows that the C/E values obtained for the surveillance capsule are globally worse than those obtained by I. Remec and F.B.K Kam. For the reactor cavity, the C/E values obtained with the α and β approaches are mostly higher than 0.9, except for the 237 Np(n,f) reaction, where the C/E coefficient is significantly lower. Similar observations were made in [13,14,15] regarding the 237 Np(n,f) reaction in the cavity. Therefore, it is reasonable to consider here that there is a measurement error in this experimental value. Thus, the specific activity of 237 Np(n,f) was not taken into account in the calculation of the average C/E value in the cavity (in Figure 8 and in those following). Considering these results, it seems that the α and β approaches improve the specific activity predictions in the cavity compared to those in the study of I. Remec and F.B.K Kam. The average C/E ratios obtained in the cavity with the α and β approaches are about 0.94 and 0.98, respectively. Therefore, it also seems that the β model is slightly more accurate than the α model. Nevertheless, it remains important to point out that the discussion on the quality of the various models must be tempered, given the uncertainties inherent in such C/E evaluations ( ± 1 σ = 15 % according to [13]) and the standard deviation of the calculated average C/E values.
Overall, the results obtained with VACS (the β approach) are consistent with those of [13], where it was demonstrated that a fine analysis of the HBR-2 benchmark using the MCNP code induced, compared to the work of I. Remec and F.B.K Kam, a degradation of the activation predictions in the capsules and an improvement of those in the cavity. However, as mentioned in [13], although the C/E values obtained by I. Remec and F.B.K Kam are closer to the experimental values in the cavity [11], the quality of these results is at least partially fortuitous, i.e., it is not guaranteed that such good results would be obtained for another configuration.
In order to put into perspective the C/E ratios obtained with the β approach and the ENDF/B-VII.1 library, Figure 9 presents these results together with those obtained with the β approach and the ENDF/B-VIII.0 and JEFF-3.3 libraries. This figure shows a good consistency between the results obtained with the JEFF-3.3 library and those obtained with the ENDF/B-VII.1 library. In contrast, the C/E ratios evaluated with the ENDF/B-VIII.0 library are largely degraded in comparison with the other tested nuclear data libraries. It is also possible to note that the C/E ratio obtained with ENDF/B-VIII.0 for the 63 Cu(n, α ) specific activity is very different from those evaluated for the other specific activities. This observation suggests that there is also an anomaly in the ENDF/B-VIII.0 63 Cu(n, α ) cross section. In order to confirm this last statement, Figure 10 presents the obtained C/E values using the ENDF/B-VIII.0 library to model neutron transport and the IRDFF-II library for dosimetry.
This figure shows that using the IRDFF-II dosimeter cross sections does not significantly improve the C/E ratio obtained, when using the ENDF/B-VIII.0 library to model neutron attenuation from the core to the sites of interest. The only significant difference observed here is for the 63 Cu(n, α ) reaction, whose C/E value regains consistency with the other reactions using the IRDFF-II library (which was not the case with ENDF/B-VIII.0). Therefore, these results suggest that the ENDF/B-VIII.0 library does not allow accurate modeling of the neutron transport from the core to the sites of interest (the capsule and the cavity) to be performed and that an anomaly exists in the 63 Cu(n, α ) cross section in this library. In contrast, the C/E ratios obtained with the ENDF/B-VII.1 and JEFF-3.3 libraries are consistent with those obtained using IRDFF-II for the dosimetry step, as shown in Figure 11.
In summary, the predictions of the specific activities of the dosimeters obtained using VACS ( β approach) can be considered satisfactory, considering the uncertainties in the C/E assessments (about 15% according to [13]). Moreover, the consistency between the results obtained here and those of [13,14,15] also reinforces the confidence in the vessel aging predictions using VACS. Nevertheless, the correction of some assumptions made in this study could result in an improvement in the C/E predictions:
  • In the β approach, the fission neutron source term was evaluated considering a reactor operating at nominal power. However, it was shown in [8] that predictions of vessel aging are sensitive to the history of the reactor. Therefore, consideration of the reactor power history (and associated control-rod insertions) in the evaluation of the fission neutron source term could improve the C/E predictions.
  • As explained in Section 2.2, it is likely that gadolinia-bearing fuel pins were used during cycle no. 9, and these were not modeled in the β approach. Modeling these gadolinia-bearing fuel pins could result in an improvement in the C/E predictions.
  • In the MCNP6 model, the moderator density gradients in the reactor core and in the moderator bypass zones were not modeled. However, in [6], the authors indicate that such assumptions can lead to a significant bias in vessel aging predictions. Therefore, modeling the moderator density gradients could improve the accuracy of C/E estimates.
  • The surveillance capsule modeling could be reworked to better match the data provided in [11], which could also lead to a very slight improvement in the obtained results.
It is worth mentioning that these approximations are not usually made in VACS [6,9]. In particular, the reactor history is usually taken into account in the fission neutron source term assessment. Moreover, a fine description of the moderator density gradients in each assembly, as calculated by SIMULATE5, is usually added in the MCNP6 fixed source calculation, and the moderator density in the bypass is usually fixed as the average of those of the outermost row of assemblies. This description of the moderator density gradient was added after the publication of [6], and the impact of this change on aging assessments can be found in [9].

5. Conclusions

Reactor lifetime extension motivates the development of precise and accurate simulation tools for vessel aging assessments and in-depth analysis of the parameters that may influence this aging (fuel management variability, core power history, etc.). Recently, a calculation scheme dedicated to the analysis of PWR vessel aging was developed, named VACS (vessel aging calculation scheme). VACS couples a deterministic approach (CASMO5 and SIMULATE5 codes) to evaluate the full-core fission neutron source term with Monte Carlo modeling (MCNP6 code) to perform the neutron attenuation from the core to sites of interest. This article featured an in-depth analysis of the H.B. Robinson-2 reactor pressure vessel dosimetry benchmark, constituting a first step towards a complete validation of VACS. The relative qualities of several nuclear data libraries (ENDF-B/VII.1, ENDF-B/VIII.0 and JEFF-3.3) for modeling the neutron attenuation from the core to the capsules and cavity were also studied.
The H.B. Robinson-2 dosimetry benchmark was intended to be used to validate the attenuation of the neutron flux only, which corresponds to the second step of the VACS approach. Nevertheless, information was gathered to use this benchmark to validate both steps, including the fission distribution inside the core. Thus, this work provides some recommendations regarding information that is still missing for performing a precise validation of the core calculation. The authors expect that with some additional information on the core management, the worth of this benchmark will be extended.
The results obtained in the frame of the current study indicated a satisfactory accuracy for the specific activity predictions obtained with VACS and the ENDF-B/VII.1 or JEFF-3.3 nuclear data libraries in the attenuation calculation. Indeed, in these cases, the final calculation/experiment (C/E) ratios remained mostly within 20% of unity in the capsules and were close to unity in the cavity. These results are satisfactory, given the global uncertainty remaining in such evaluations (±1 σ ≃ 15% [13]). In contrast, the results showed that using the ENDF/B-VIII.0 nuclear data library to model fission neutron attenuation from the core to the capsule or the cavity resulted in a systematic underestimation of the dosimeter specific activities of about 30%. This has also been reported in other studies [37]. Moreover, an anomaly was observed in the 63 Cu(n, α ) cross section in the ENDF-B/VIII.0 library.
Although the validation work described in this paper indicates a satisfactory performance for VACS, it is not sufficient to make a definitive statement on the general accuracy of the methodology.

Author Contributions

Conceptualization, R.V., M.B., J.T. and E.D.; methodology, R.V. and M.B.; software, R.V. and J.T.; formal analysis, R.V.; validation, M.B., J.T. and E.D.; writing—original draft preparation, R.V.; writing—review and editing, M.B., J.T. and E.D.; supervision, M.B., J.T. and E.D.; project administration, M.B. All authors have read and agreed to the published version of the manuscript.

Funding

This research received no external funding.

Institutional Review Board Statement

Not applicable.

Informed Consent Statement

Not applicable.

Data Availability Statement

Not applicable.

Acknowledgments

The authors would like to thank L. Leal from the Institut de Radioprotection et de Sûreté Nucléaire (IRSN) for fruitful discussions on the sensitivity of the results to nuclear data libraries.

Conflicts of Interest

The authors declare no conflict of interest.

Abbreviations

The following abbreviations are used in this manuscript:
HBR-2H.B. Robinson-2
IRSNInstitut de Radioprotection et de Sûreté Nucléaire
PWRPressurized Water Reactor
RPVReactor Pressure Vessel
VACSVessel Aging Calculation Scheme developed at IRSN

References

  1. Pichon, C.; Brillaud, C.; Deydie, D.; Alberman, A.; Soulat, P. Chapter Neutron Spectrum Effect and Damage Analysis on Pressure Vessel Steel Irradiation Behaviour; ASTM International: West Conshohocken, PA, USA, 2000; pp. 87–97. [Google Scholar]
  2. Wagner, J.C.; Haghighat, A.; Petrovic, B.G. Monte Carlo Transport Calculations and Analysis for Reactor Pressure Vessel Neutron Fluence. Nucl. Technol. 1996, 114, 373–398. [Google Scholar] [CrossRef]
  3. Vasiliev, A.; Ferroukhi, H.; Zimmermann, M.A.; Chawla, R. Development of a CASMO-4/SIMULATE-3/MCNPX calculation scheme for PWR fast neutron fluence analysis and validation against RPV scraping test data. Ann. Nucl. Energy 2007, 34, 615–627. [Google Scholar] [CrossRef]
  4. Matsushita, K.; Kurosawa, M. Neutron fluence analyses around the reactor pressure vessel of BWR using MCNP with a heterogeneous and homogeneous mixed core model. Prog. Nucl. Sci. Technol. 2014, 4, 463–466. [Google Scholar] [CrossRef]
  5. Bourganel, S.; Petit, O.; Diop, C. Three-Dimensional Particle Transport Using Green’s Functions in TRIPOLI-4 Monte Carlo Code: Application to PWR Neutron Fluence and Ex-Core Response Studies. Nucl. Technol. 2013, 184, 29. [Google Scholar] [CrossRef]
  6. Vuiart, R.; Brovchenko, M.; Taforeau, J.; Jaiswal, V.; Dumonteil, E. A Versatile Methodology for Reactor Pressure Vessel Aging Assessments. Nucl. Sci. Eng. 2022, 196, 455–477. [Google Scholar] [CrossRef]
  7. Vuiart, R.; Console Camprini, P.; Burn, K.; Brovchenko, M.; Taforeau, J.; Dumonteil, E. Impact of Fission Spectrum Modeling on Aging Estimations of Pressurized Water Reactor Vessels. Trans. Am. Nucl. Soc. 2021, 125, 1106–1109. [Google Scholar] [CrossRef]
  8. Vuiart, R.; Brovchenko, M.; Taforeau, J. Impact of core power variations on the fast neutron flux incident on pressurized water reactor vessels. In Proceedings of the 2019 International Congress on Advances in Nuclear Power Plants (ICAPP 2019), Juan-les-Pins, France, 12–15 May 2019. [Google Scholar]
  9. Vuiart, R. Analyse du Vieillissement Sous Irradiation Neutronique des Cuves des Réacteurs Nucléaires à eau sous Pression. Ph.D. Thesis, Université Paris-Saclay, Fontenay-aux-Roses, France, 2021. [Google Scholar]
  10. Benedet, B.; Vuiart, R.; Taforeau, J.; Brovchenko, M. Sensitivity of Pressurized Water Reactors Vessels Aging to Fuel Composition. Trans. Am. Nucl. Soc. 2021, 125, 1110–1113. [Google Scholar] [CrossRef]
  11. Remec, I.; Kam, F. H.B. Robinson-2 Pressure Vessel Benchmark; NUREF/CR-6453, ORNL/TM-13204; Oak Ridge National Laboratory: Oak Ridge, TN, USA, 1997. [Google Scholar]
  12. Kodeli, I.; Sartori, E. SINBAD–Radiation shielding benchmark experiments. Ann. Nucl. Energy 2021, 159, 108254. [Google Scholar] [CrossRef]
  13. Pittarello, R.; Vasiliev, A.; Ferroukhi, H.; Chawla, R. Refined Monte Carlo analysis of the H.B. Robinson-2 reactor pressure vessel dosimetry benchmark. Ann. Nucl. Energy 2011, 38, 1842–1851. [Google Scholar] [CrossRef]
  14. Vasiliev, A.; Ferroukhi, H.; Kolbe, E. Performance of a Monte-Carlo solution for the H.B. Robinson-2 Pressure Vessel Dosimetry Benchmark. Ann. Nucl. Energy 2010, 37, 1404–1410. [Google Scholar] [CrossRef]
  15. Orsi, R. H.B. Robinson-2 pressure vessel dosimetry benchmark: Deterministic three-dimensional analysis with the TORT transport code. Nucl. Eng. Technol. 2019, 52, 448–455. [Google Scholar] [CrossRef]
  16. Bourganel, S.; Raskiniteb, I.; Soldevilac, M. Analysis of the H.B. ROBINSON-2 reactor pressure vessel dosimetry benchmark using TRIPOLI-4 Monte Carlo code. Prog. Nucl. Sci. Technol. 2014, 4, 312–316. [Google Scholar] [CrossRef]
  17. HBR-2-Updated Final Safety Analysis Report-CHAPTER 4, Carolina Power & Light Document, Hosted by NRC, Washington D.C. Revision No. 21. Available online: https://www.nrc.gov/docs/ML1729/ML17298A851.pdf.
  18. Macfarlane, R.; Muir, D.; Boicourt, R.M.; Kahler, A.C., III; Conlin, J.L. The NJOY Nuclear Data Processing System, Version 2016; Technical Report for Los Alamos National Lab. (LANL): Los Alamos, NM, USA, 2017. [Google Scholar] [CrossRef] [Green Version]
  19. Plompen, A.J.; Cabellos, O.; De Saint, J.C.; Fleming, M.; Algora, A.; Angelone, M.; Archier, P.; Bauge, E.; Bersillon, O.; Blokhin, A.; et al. The joint evaluated fission and fusion nuclear data library, JEFF-3.3. Eur. Phys. J. 2020, 56, 181. [Google Scholar] [CrossRef]
  20. Rhodes, J.; Hykes, J.; Ferrer, R. CASMO5 a Fuel Assembly Burnup Program User’s Manual; Studsvik Scandpower Inc.: Idaho Falls, ID, USA, 2017; Rev. 12. [Google Scholar]
  21. Bahadir, T.; Lindahl, S. Studsvik’s next generation nodal code SIMULATE-5. In Proceedings of the Advances in Nuclear Fuel Management IV (ANFM 2009), Hilton Head Island, SC, USA, 12–15 April 2009. [Google Scholar]
  22. Williams, M.L. DOTSOR: A Module in the LEPRICON Computer Code System for Representing the Neutron Source Distribution in LWR Cores; EPRI Research Project: 1399-1 Interim Report, RSIC Peripheral Shielding Routine Collection PSR-277; EPRI: Washington, DC, USA, 1985. [Google Scholar]
  23. Goorley, T.; James, M.; Booth, T.; Brown, F.; Bull, J.; Cox, L.; Durkee, J.; Elson, J.; Fensin, M.; Forster, R.; et al. Initial MCNP6 Release Overview - MCNP6 Version 1.0. Nucl. Technol. 2013, 164. [Google Scholar] [CrossRef]
  24. Chadwick, M.; Herman, M.; Obložinský, P.; Dunn, M.E.; Danon, Y.; Kahler, A.C.; Smith, D.L.; Pritychenko, B.; Arbanas, G.; Arcilla, R.; et al. ENDF/B-VII.1 Nuclear Data for Science and Technology: Cross Sections, Covariances, Fission Product Yields and Decay Data. Nucl. Data Sheets 2011, 112, 2887–2996. [Google Scholar] [CrossRef]
  25. Hébert, A. Applied Reactor Physics. In Presses Internationales Polytechnique; Worldcat: Montréal, QC, Canada, 2009; ISBN 978-2-553-01436-9. [Google Scholar]
  26. Bahadir, T.; Lindahl, S.; Scandpower, S. SIMULATE-4 Pin Power Calculation. In Proceedings of the PHYSOR-2006 American Nuclear Society’s Topical Meeting on Reactor Physics: Organized and Hosted by the Canadian Nuclear Society, Vancouver, BC, Canada, 10–14 September 2006. [Google Scholar]
  27. Initial MCNP6 Release Overview. Nucl. Technol. 2012, 180, 298–315. [CrossRef]
  28. Fonte, L. Modélisation et Analyse du Benchmark SINBAD du Réacteur H.B. Robinson-2; AERGON, Internal IRSN Report: Fontenay-aux-Roses, France, 2021. [Google Scholar]
  29. Skutnik, S. ORIGEN-Based Nuclear Fuel Inventory Module for Fuel Cycle- Assessment Final Project Report; Department of Nuclear Engineering, University of Tennessee-Knoxville: Knoxville, TN, USA, 2017. [Google Scholar]
  30. Brown, D.; Chadwick, M.; Capote, R.; Kahler, A.; Trkov, A.; Herman, M.; Sonzogni, A.; Danon, Y.; Carlson, A.; Dunn, M.; et al. ENDF/B-VIII.0: The 8th Major Release of the Nuclear Reaction Data Library with CIELO-project Cross Sections, New Standards and Thermal Scattering Data. Nucl. Data Sheets 2018, 148, 1–142. [Google Scholar] [CrossRef]
  31. Trkov, A.; Griffin, P.; Simakov, S.; Greenwood, L.; Zolotarev, K.; Capote, R.; Aldama, D.; Chechev, V.; Destouches, C.; Kahler, A.; et al. IRDFF-II: ANew Neutron Metrology Library. Nucl. Data Sheets 2020, 163, 1–108. [Google Scholar] [CrossRef]
  32. Mosher, S.; Johnson, S.; Bevill, A.; Ibrahim, A.; Daily, C.; Evans, T.; Wagner, J.; Johnson, J.; Grove, R. ADVANTG—An Automated Variance Reduction Parameter Generator, Rev. 1; Oak Ridge National Lab. (ORNL): Oak Ridge, TN, USA, 2015. [Google Scholar]
  33. Evans, T.; Stafford, A.; Slaybaugh, R.; Clarno, K. DENOVO: A New Three-Dimensional Parallel Discrete Ordinates Code in SCALE. Nucl. Technol. 2010, 171, 171–200. [Google Scholar] [CrossRef]
  34. Wagner, J.; Haghighat, A. Automated Variance Reduction of Monte Carlo Shielding Calculations Using the Discrete Ordinates Adjoint Function. Nucl. Sci. Eng. 1998, 128, 186–208. [Google Scholar] [CrossRef]
  35. Rhoades, W.; Childs, R. The DORT Two-Dimensional Discrete Ordinates Transport Code. Nucl. Sci. Eng. 1988, 99, 88–89. [Google Scholar] [CrossRef]
  36. White, J.; Ingersoll, D.; Skater, C.; Roussin, R. BUGLE-96: A Revised Multigroup cross Section Library for LWR Applications based On ENDF/B-VI Release 3. In Proceedings of the ANS Radiation Protection & Shielding Topical Meeting, Falmouth, MA, USA, 21–25 April 1996. [Google Scholar]
  37. Fischer, A. Benchmarking of ENDF/B-VIII.0 Cross Sections for LWR Ex-Core Transport Applications. In Proceedings of the PHYSOR 2022, Pittsburgh, PA, USA, 15–20 May 2022. [Google Scholar]
Figure 1. Radial cut of a UOX fuel assembly from the H.B. Robinson-2 reactor. Fuel rods are shown in green.
Energies 15 05098 g001
Figure 2. Schematic radial cut of an octant of the H.B. Robinson-2 (taken from [14]).
Energies 15 05098 g002
Figure 3. Activation cross sections taken from the JEFF-3.3 library and processed at 600 K.
Energies 15 05098 g003
Figure 4. Flowchart of the different codes and steps used in VACS.
Energies 15 05098 g004
Figure 5. Radial cut of the MCNP6 modeling of the H.B. Robinson-2 reactor.
Energies 15 05098 g005
Figure 6. Axial cut of the MCNP6 modeling of the H.B. Robinson-2 reactor.
Energies 15 05098 g006
Figure 8. C/E ratios obtained with the α and β approaches using the ENDF/B-VII.1 nuclear data library. The results obtained by I. Remec and F.B.K. Kam [11] are shown for comparison. The 237 Np(n,f) specific activity is not taken into account in the calculation of the average C/E value in the cavity.
Energies 15 05098 g008
Figure 9. C/E ratios obtained with the β approach using the ENDF/B-VII.1, ENDF/B-VIII.0 and JEFF-3.3 nuclear data libraries. The 237 Np(n,f) specific activity is not taken into account in the calculation of the average C/E value in the cavity.
Energies 15 05098 g009
Figure 10. C/E ratios obtained with the β approach using the ENDF/B-VIII.0 library for transport and the ENDF/B-VIII.0 or IRDFF-II library for dosimetry. The 237 Np(n,f) specific activity is not taken into account in the calculation of the average C/E value in the cavity.
Energies 15 05098 g010
Figure 11. The C/E ratios obtained with the β approach and various combinations of nuclear data libraries. The 237 Np(n,f) specific activity is not taken into account in the calculation of the average C/E value in the cavity.
Energies 15 05098 g011
Table 1. Specific activities measured in the equatorial plane, at the end of cycle no. 9, for the dosimeters placed in the capsule of the surveillance program and in the cavity of the H.B. Robinson-2 reactor [11].
Dosimeter Location
Dosimeter TypeCapsuleReactor Cavity
Specific activities
(Bq/mg)
237 Np(n,f) 137 Cs3.671 · 10 + 2 2.236 · 10 + 1
238 U(n,f) 137 Cs5.345 · 10 + 1 8.513 · 10 1
58 Ni(n,p) 58 Co1.786 · 10 + 4 1.959 · 10 + 2
54 Fe(n,p) 54 Mn9.342 · 10 + 2 8.711 · 10 + 0
46 Ti(n,p) 46 Sc3.500 · 10 + 2 3.310 · 10 + 0
63 Cu(n, α ) 60 Co2.646 · 10 + 1 2.645 · 10 1
Table 2. Data for fission neutron spectrum modeling.
NuclideIncident Neutron EnergyFission Spectrum Typea (MeV)b (MeV 1 )
235 UThermalWatt0.9882.249
238 U2.6 MeVWatt0.9203.121
239 PuThermalWatt0.9662.842
241 PuThermalMaxwell1.3597-
Table 3. Dosimeter composition as defined in the “HBRHE81” input file [11].
IsotopeAtomic Density ( Atom · Barn 1 · cm 1 )
54 Fe5.13 · 10 3
63 Cu5.88 · 10 2
58 Ni6.26 · 10 2
46 Ti4.707 · 10 3
237 Np5.081 · 10 2
238 U4.75 · 10 2
Table 4. Reaction rates for a specific activity conversion factor, taken from [15].
Dosimeter Location
ReactionSurveillance CapsuleReactor Cavity
f c , k
( atom · mg 1 )
237 Np(n,f) 137 Cs 3.082 · 10 15 3.085 · 10 15
238 U(n,f) 137 Cs 2.0950 · 10 15 2.952 · 10 15
58 Ni(n,p) 58 Co 3.576 · 10 18 3.844 · 10 18
54 Fe(n,p) 54 Mn 2.494 · 10 17 2.558 · 10 17
46 Ti(n,p) 46 Sc 5.364 · 10 17 5.737 · 10 17
63 Cu(n, α ) 60 Co 6.697 · 10 17 6.726 · 10 17
Table 5. Reaction rates obtained in the surveillance capsule. Values in parentheses indicate the standard deviations of MCNP6 tally responses (in units of %).
Surveillance Capsule Reaction Rates (Reactions · s 1 · atom 1 )
MethodologyNuclear Data—
Attenuation
Nuclear Data—
Dosimetry
237 Np(n,f) 238 U(n,f) 58 Ni(n,p) 54 Fe(n,p) 46 Ti(n,p) 63 Cu(n, α )
Remec and Kam–DORT [11]BUGLE-961.06 · 10 13 1.54 · 10 14 4.74 · 10 15 3.51 · 10 15 5.62 · 10 16 3.57 · 10 17
α approach and MCNP6ENDF/B-VII.1ENDF/B-VII.11.07 · 10 13
(0.55)
1.37 · 10 14
(0.68)
4.12 · 10 15
(0.87)
3.04 · 10 15
(0.94)
5.04 · 10 16
(1.41)
2.96 · 10 17
(1.85)
IRDFF-II1.07 · 10 13
(0.55)
1.39 · 10 14
(0.67)
4.15 · 10 15
(0.90)
3.00 · 10 15
(0.97)
5.47 · 10 16
(1.40)
3.02 · 10 17
(1.84)
β approach and MCNP6ENDF/B-VII.1ENDF/B-VII.11.04 · 10 13
(0.58)
1.41 · 10 14
(0.72)
4.17 · 10 15
(0.93)
3.06 · 10 15
(0.99)
5.07 · 10 16
(1.54)
3.06 · 10 17
(2.05)
IRDFF-II1.11 · 10 13
(0.58)
1.43 · 10 14
(0.72)
4.19 · 10 15
(0.95)
3.01 · 10 15
(1.02)
5.49 · 10 16
(1.53)
3.19 · 10 17
(2.05)
ENDF/B-VIII.0ENDF/B-VIII.09.97 · 10 14
(0.61)
1.22 · 10 14
(0.76)
3.45 · 10 15
(1.03)
2.51 · 10 15
(1.09)
4.27 · 10 16
(1.65)
3.84 · 10 17
(2.21)
IRDFF-II1.00 · 10 13
(0.62)
1.22 · 10 14
(0.76)
3.50 · 10 15
(1.02)
2.51 · 10 15
(1.09)
4.63 · 10 16
(1.64)
2.65 · 10 17
(2.18)
JEFF-3.3JEFF-3.31.13 · 10 13
(0.57)
1.44 · 10 14
(0.71)
4.26 · 10 15
(0.92)
2.74 · 10 15
(1.02)
5.29 · 10 16
(1.53)
2.89 · 10 17
(2.06)
IRDFF-II1.13 · 10 13
(0.58)
1.47 · 10 14
(0.71)
4.19 · 10 15
(0.94)
3.00 · 10 15
(1.02)
5.30 · 10 16
(1.53)
2.96 · 10 17
(2.03)
Table 6. Reaction rates obtained in the reactor cavity. Values in parentheses indicate the standard deviations of MCNP6 tally responses (in units of %).
Cavity reaction rates (reactions · s 1 · atom 1 )
MethodologyNuclear Data—
Attenuation
Nuclear Data—
Dosimetry
237 Np(n,f) 238 U(n,f) 58 Ni(n,p) 54 Fe(n,p) 46 Ti(n,p) 63 Cu(n, α )
Remec and Kam–DORT [11]BUGLE-964.13 · 10 15 2.11 · 10 16 4.79 · 10 17 3.23 · 10 17 5.16 · 10 18 3.63 · 10 19
α approach and MCNP6ENDF/B-VII.1ENDF/B-VII.15.28 · 10 15
(0.21)
2.28 · 10 16
(0.39)
5.00 · 10 17
(0.55)
3.32 · 10 17
(0.64)
5.560 · 10 18
(1.04)
3.63 · 10 19
(1.34)
IRDFF-II5.32 · 10 15
(0.21)
2.34 · 10 16
(0.39)
4.80 · 10 17
(0.59)
3.25 · 10 17
(0.67)
6.00 · 10 18
(1.04)
3.69 · 10 19
(1.33)
β approach and MCNP6ENDF/B-VII.1ENDF/B-VII.15.65 · 10 15
(0.22)
2.41 · 10 16
(0.41)
5.19 · 10 17
(0.58)
3.43 · 10 17
(0.68)
5.63 · 10 18
(1.10)
3.67 · 10 19
(1.40)
IRDFF-II5.70 · 10 15
(0.22)
2.48 · 10 16
(0.21)
4.97 · 10 17
(0.62)
3.34 · 10 17
(0.71)
6.08 · 10 18
(1.09)
3.74 · 10 19
(1.40)
ENDF/B-VIII.0ENDF/B-VIII.04.75 · 10 15
(0.23)
1.92 · 10 16
(0.46)
3.61 · 10 17
(0.72)
2.48 · 10 17
(0.81)
4.43 · 10 18
(1.27)
4.45 · 10 19
(1.59)
IRDFF-II4.78 · 10 15
(0.23)
1.92 · 10 16
(0.46)
3.71 · 10 17
(0.70)
2.48 · 10 17
(0.81)
4.76 · 10 18
(1.27)
3.11 · 10 19
(1.58)
JEFF-3.3JEFF-3.35.85 · 10 15
(0.22)
2.63 · 10 16
(0.40)
5.57 · 10 17
(0.55)
3.22 · 10 17
(0.67)
6.00 · 10 18
(1.11)
3.64 · 10 19
(1.45)
IRDFF-II5.89 · 10 15
(0.22)
2.69 · 10 16
(0.40)
5.25 · 10 17
(0.59)
3.49 · 10 17
(0.68)
6.01 · 10 18
(1.11)
3.71 · 10 19
(1.43)
Publisher’s Note: MDPI stays neutral with regard to jurisdictional claims in published maps and institutional affiliations.

