Article

Numerical Simulation of Multi-Nozzle Droplet Evaporation Characteristics for Desulfurization Wastewater

1
School of Energy and Power Engineering, Lanzhou University of Technology, Lanzhou 730050, China
2
Key Laboratory of Condition Monitoring and Control for Power Plant Equipment, North China Electric Power University, Ministry of Education, Beijing 102206, China
*
Authors to whom correspondence should be addressed.
Energies 2022, 15(14), 5180; https://doi.org/10.3390/en15145180
Submission received: 23 June 2022 / Revised: 11 July 2022 / Accepted: 15 July 2022 / Published: 17 July 2022

Abstract

:
Spraying flue gas desulfurization wastewater into flue ducts is an emerging technology that is receiving extensive attention in thermal power plants. In order to study the evaporative performance of wastewater-atomizing droplets under variable working conditions, a combined Euler–Lagrange model was developed to demonstrate the thermal behavior of FGD wastewater spray evaporation in flue gas. The effects of several control factors under various operating conditions were numerically determined and validated against experimental data. Due to the complicated parameters and various other conditions, a least-square support vector machine (LSSVM) model relying on numerical results was used to anticipate the evaporation rate of the droplets. We prove that the LSSVM model has high prediction accuracy for the evaporation rate at different cross-sections of flue under a different operating situation. The conclusion is that for the sake of improving the quality of evaporation, the spacing between two adjacent nozzles should be increased while increasing the flow rate. However, using a higher flue gas temperature, higher initial temperature and smaller diameter of droplets can shorten the time and distance of complete evaporation. In summary, this research analysis can be used effectively to determine the design of the FGD wastewater flue gas evaporative process in thermal power plants.

1. Introduction

In order to reduce SO2 emissions and abate environmental pollution during the coal-fired power generation process, the majority of coal-fired power plant flue gas desulfurization systems use limestone–gypsum wet flue gas desulfurization (WFGD) [1]. Limestone–gypsum wet flue gas desulfurization (WFGD) uses limestone as an absorbent to capture SO2 in the flue gas and produces gypsum as a byproduct [2]. Although FGD can improve the level of coal-fired power plant pollution emissions significantly, this process regularly discharges a certain amount of flue gas desulfurization (FGD) wastewater with high pollution levels and special water qualities.
A process that involves FGD wastewater being sprayed into the flue in the flue duct and evaporated is one of the economically feasible technical ways to achieve zero discharge of FGD wastewater for power plants [3,4,5]. In this process, complete evaporation must be ensured by absorbing flue gas residual heat at a specified distance.
Over recent decades, numerous studies have been published regarding the performance of spray evaporation. Deng et al. [6,7,8,9,10] studied the optimization of parameters such as nozzle position, droplet spraying direction, droplet size and flue gas temperature. Kim et al. [11] studied FGD wastewater atomized droplet evaporation under different environmental pressure. Gradinger and Bouuloueho [12] proposed a zero-dimensional droplet evaporation model for spray evaporation in 1998. Godsave [13] established a pure gas phase model to solve the problem of calculating the mass flow rate during the stable evaporation of droplets. Sazhin et al. [14] developed a new model for droplet evaporation sprayed into high-pressure gas. Ranz and Marshall [15,16] proposed a classic empirical equation for convective heat transfer on the surface of a droplet. Tseng et al. [17] researched the effect of high-temperature gas radiation on droplet evaporation. Sureshkumar et al. [18,19] pointed out that most of the scholars’ research lacks a dynamic model with a high degree of fitting with the actual project. Sayaka et al. [20] proposed an approach for estimating the evaporation rate of a droplet group using the thermal efficiency and the Nusselt number. Esteban D. Gonzalez-Juez et al. [21] found that their atomization model enhanced the accuracy of the droplet mass production and droplet diameter distribution. Haiming Yu et al. [22] developed a multiscale method for the sake of investigating the atomization characteristics of nozzles. Nikita et al. [23] introduced several techniques for combined atomization. Fu et al. [24] developed a method based on vacuum spray flash evaporation. A. Sarmadian et al. [25] devised a temperature control approach using evaporative spray cooling of vibrating surfaces in the nucleate boiling region and verified it experimentally.
However, little research has been conducted on developing mathematical models to study the evaporation quality of FGD water. Moreover, due to the high nonlinearity and various other characteristics of the FGD wastewater atomized droplet evaporation process, nozzle arrangement and operation optimization are difficult to formulate in different situations. Since it is unrealistic to measure the evaporation rate of FGD wastewater droplets and take all factors into account at the same time, it is necessary to find a method that can predict and optimize the spray evaporation process.
The least-square support vector machine (LSSVM) relied on the structural risk minimization principle and has good robustness and generalization. Nevertheless, it has rarely been taken into consideration to anticipate the droplet evaporation rate in flue gas. In the present study, a mathematical model is developed to calculate the thermo-fluid behavior of FGD wastewater in flue gas during the evaporation process. A LSSVM droplet evaporation prediction model is developed, and an improved nozzle optimal layout scheme is proposed.
In this paper, the Eulerian mathematical method is used to solve the Navier–Stokes Reynolds equation and the Lagrangian mathematical method is used to calculate the flow and evaporation characteristics of the droplets. Some parameters related to spray evaporation, such as initial diameter, velocity, temperature of atomized droplets, temperature of flue gas, spray full cone angle of nozzles and spray direction of nozzles, are analyzed. Based on the numerical simulation results, an LSSVM is developed to efficiently predict the droplets evaporation rate sprayed from double nozzles. Both numerical simulations and predictions can guide the arrangement of nozzles and technology optimization in a 300 MW power plant.

2. Mathematical Model and Numerical Approach
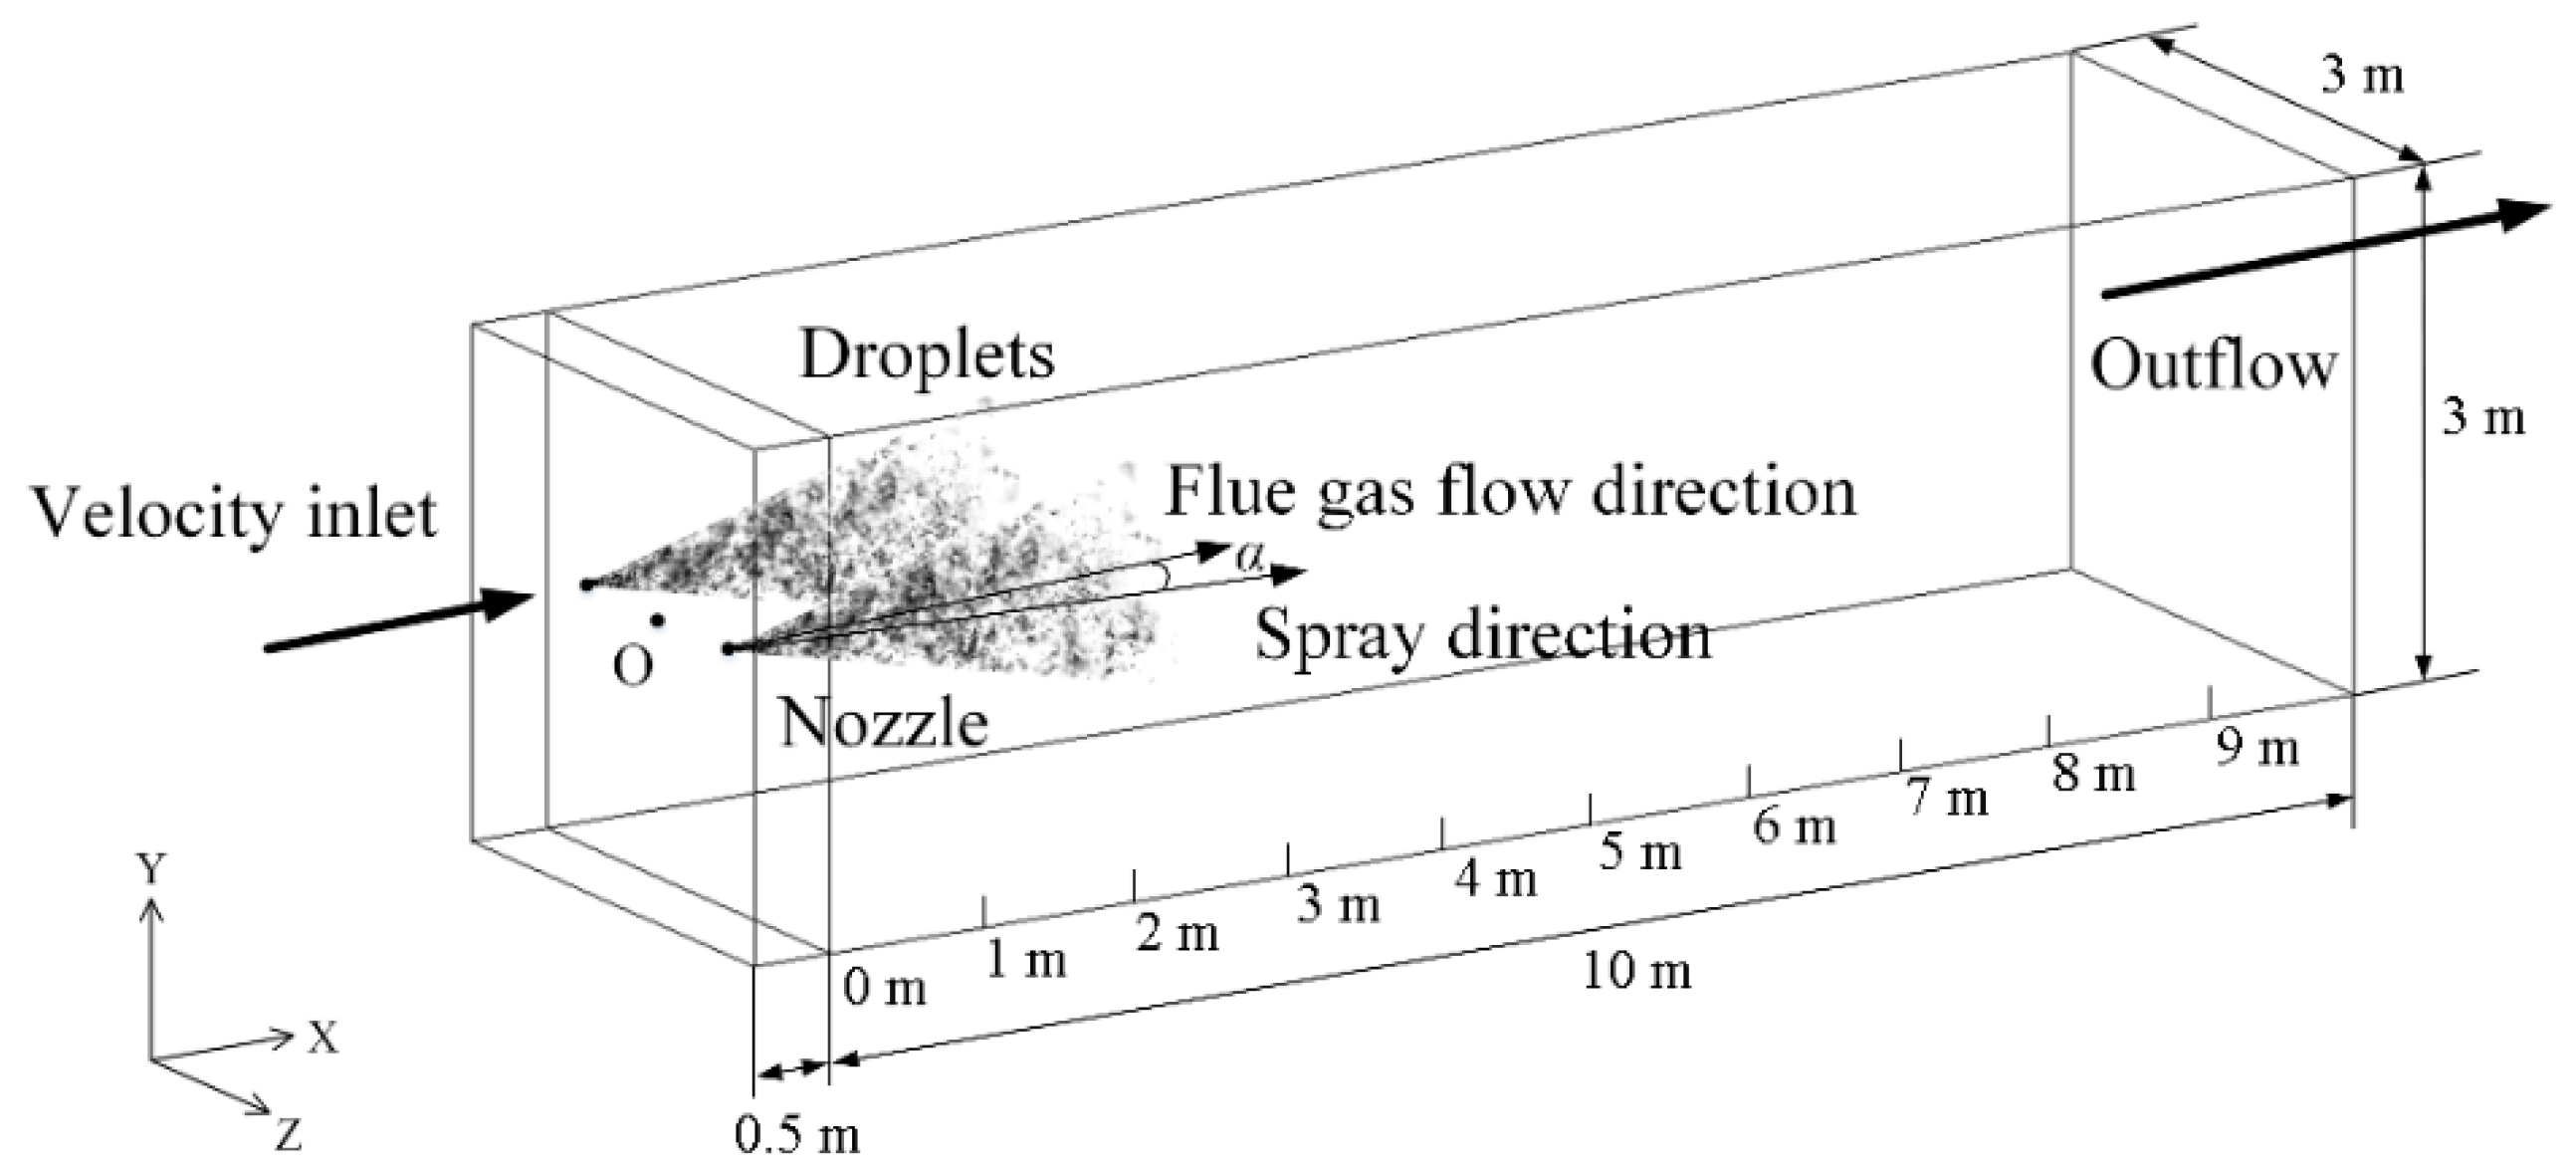
2.1. Physical Model

In this paper, a three-dimensional duct model with a channel size of 10 m in length and a rectangular cross-section of 3 × 3 m2 is established. As we can see in Figure 1, the origin O of the body coordinate system is located at the center of the cross-section at 0.5 m from the entrance of the channel. Two solid cone-shaped nozzles are set as the injection source on both sides of the origin O of the body coordinate system along the positive and negative directions of the z-axis, and there is a certain installation distance between the two nozzles.

2.2. Governing Equations

The mathematical models are used to describe the evaporation process of FGD wastewater atomized droplets including two parts: the flow heat transfer of continuous phase flue gas and the flow evaporation of discrete phase droplets. The heat transfer of continuous phase turbulence is described by the Euler method, and the movement and evaporation of discrete phase droplets are characterized through the Lagrange method. Related content has been studied by scholars [4].

2.2.1. Continuous Phase (Flue Gas)

The influence of the atomized droplet group on the flue gas flow needs to be considered when FGD wastewater atomized droplets with a large amount are sprayed into the flue gas. It can be achieved by introducing droplet mass, momentum and energy source terms into the corresponding continuous phase governing equations. In this paper, the time-averaged Navier–Stokes conservation equation and the standard k-ε model are used to describe the turbulent flow and heat transfer of flue gas, and the influence of droplet evaporation source terms is considered [25].
x i ( ρ u i ) = S m
x j ( ρ u i u j ) = x j [ μ e f f ( u i x j + u j x i ) 2 3 μ e f f δ i j ( u k x k ) ] p x i + ρ g i + S mo
x j ( ρ u i E ) = p u i x i + x i ( k e f f T f x i + u j ( τ i j ) e f f ) x i ( i = 1 n h i J i ) + S e
x i ( ρ u i Y i ) = J i . i x i + S m
Here, Jj′,I is the diffusion flux of species j′, and the parameters Sm, Smo and Se represent the mass, momentum and energy sources of the atomized droplets, respectively.

2.2.2. Discrete Phase (Water Droplets)

FGD wastewater quickly disintegrates into a group of atomized droplets after being sprayed from the nozzle. A saturated air–steam layer forms on the droplet surface when droplets come into contact with unsaturated flue gas and heat, and mass transfer will take place if there is a temperature difference between the droplets and the flue gas. In this paper, the evaporation process of the atomized droplet group is simplified as follows:
(1)
The droplets are uniformly spherical during the entire evaporation process;
(2)
The latent heat of vaporization, specific heat capacity, surface tension and other parameters of the droplet change with the temperature of the droplet;
(3)
We ignore the effect of radiative heat transfer on droplet evaporation;
(4)
We ignore the influence of droplet internal circulation and internal thermal resistance on droplet evaporation.
It can be considered that the heat and mass transfer mechanism in the droplet group evaporation process is consistent with the single droplet evaporation mechanism, and assuming that droplet internal thermal resistance is zero, the rate of energy absorption by each droplet in the droplet group can be described by the energy equation of the single droplet [26]:
m d c p d T d d t = h c A d ( T f T d ) d m d d t L h
where Lh is the water latent heat for vaporization and Tf is the flue gas temperature. hc is the convective heat transfer coefficient. hc can be obtained through the Ranz–Marshall empirical correlation [26]:
N u = h c d d k f = ln ( 1 + B T ) B T ( 2 + 0.6 R e d 0.5 P r 0.33 )
where Nu and Pr are the Nusselt number and Prandtl number of flue gas, respectively. Red is the droplet Reynolds number based on the relative velocity and the droplet diameter. BT is the thermal Spalding number, and Bm is the mass Spalding number, both of which can be written as [27]:
B T = B m = Y j , s Y j , f 1 Y j , s
where Yj′,s is the vapor mass fraction of component j′ on the droplet surface, and Yj′,f is the vapor mass fraction of component j′ in the surrounding flue gas. dmd/dt is the mass flow rate of the droplet transferred to the flue gas by evaporation, which indicates the evaporation rate of droplets and can be expressed as [26]:
d m d d t = k c A d ρ f ln ( 1 + B m )
where ρf is the density of the flue gas, and kc is the mass transfer coefficient, which can be obtained by the empirical Sherwood correlation [14,26]:
S h = k c d d D m = 2.0 + 0.6 R e d 1 / 2 S c 1 / 3
where Sh is the mass transfer Sherwood number, Sc is the Schmidt number and Dm is the vapor diffusion coefficient.
The Lagrangian method tracks the discrete phase droplets moving in the flue gas by integrating the momentum equations that meet Newton’s Second Law and considering the influences of some relevant forces on the evaporation of droplets. Due to the assumption that all droplets have individual characteristics and uniform spherical shapes, the changes in movement velocities or directions of droplets in the flue gas are caused by drag and gravity, and the influence of other forces on droplet flow conditions is negligible. Under this assumption, the motion equation of a single droplet can be described as [28]:
d u d d t = F D ( u f u d ) + g ( ρ d ρ f ) ρ d
where uf is flue gas velocity, ud is droplet velocity, F D ( u f u d ) and is the drag force per unit mass of droplet, which can be expressed as [29]:
F D = 18 μ ρ d d d 2 C D R e d 24
where CD is the drag coefficient. According to a range of Reynolds numbers, CD can be expressed as [30]:
C D = { 0.424 R e > 1000 24 R e ( 1 + 1 6 R e 2 / 3 ) R e 1000
The generation or dissipation of turbulent vortices in the continuous phase will cause the diffusion of droplet movement. In this paper, a random orbit model is used to predict the spray of FGD wastewater droplets in the flue gas. The model predicts and determines the turbulent diffusion and motion trajectories of droplets by combining the instantaneous flue gas velocity with the trajectory equation of each droplet in discrete time steps through a random tracking method. The trajectory equation of the droplet is determined as follows:
d x d t = u d
where x is the droplet position.
Combined with (10), the abovementioned droplet trajectory equation can be converted into the following general form:
d u d d t = 1 τ d ( u f u d ) + a
where a is the acceleration of the droplet caused by all forces except drag. The Eulerian implicit discretization numerical method is used to solve (14) to give:
u d n + 1 u d n Δ t = 1 τ d ( u f * u d * ) + a n
where u f * is the mean velocity of flue gas, and u d * is the mean velocity of a droplet. The mean velocity can be obtained for n iterations, as follows:
u d * = 1 2 ( u d n + u d n + 1 )
u f = 1 2 ( u f n + u f n + 1 )
u f n + 1 = u f n + Δ t u d n u f n
The velocity of the droplet at the new position n+1 is:
x d n + 1 = x d n + 1 2 Δ t ( u d n + u d n + 1 )
The aerodynamic breaking process of a droplet depends on its Weber number. In this paper, spraying atomized droplet simulation has a low Weber number range. The Taylor analogy breakup model is used for the aerodynamic breaking process of a droplet [31]. Droplets transform and break up under the effect of flue gas drag, and the damping forced governing equation is:
F D k x d d d x d t = m d d 2 x d t 2
where x is the displacement between the actual droplet’s equatorial position and the spherical droplet’s equatorial position; other coefficients can be obtained by Taylor’s analogy:
F D m d = C F ρ f u 2 ρ d r
k m d = C k σ ρ d r 3
d d m d = C d μ d ρ d r 2
where r is the radius of the undeformed droplet; σ is the surface tension of the droplet; and CF, Ck and Cd are all dimensionless constants.
We assume that when the north and south poles of the droplet coincide at the central equator, the droplet breaks up, leading to the critical condition:
x > C b r
where Cb is a constant with a value of 0.5.
The O’Rourke algorithm is utilized to obtain the probability, frequency and result of droplet collision and coalescence. The model is based on the concept of collision volume and is suitable for the collisions of low-Weber number droplets. It is assumed that only droplets in the same continuous phase calculation grid unit can collide, and the frequency of droplet collisions is much shorter than the time step. The probability distribution of the number of droplet collisions follows the Poisson distribution:
P ( n ) = e n ¯ n ¯ n n !
where n is the number of collisions between larger droplets and other smaller droplets. The collision type of the droplet only considers coalescence and rebound, and the critical offset for judging the collision result is:
b crit = ( r 1 + r 2 ) min ( 1.0 , 2.4 f W e )
where r1 is the radius of larger droplets, r2 is the radius of other smaller droplets and f is a function of r1/r2.
When the condition b < bcrit is satisfied, the result of droplet collision is aggregation, otherwise, it is rebound.
According to the momentum conservation, the droplet velocity after collision is:
u 1 = m 1 u 1 + m 2 u 2 m 1 + m 2 + m 2 ( u 1 u 2 ) m 1 + m 2 ( b b crit r 1 + r 2 b crit )
where m1 and u1 are the mass and velocity before the collision of larger droplets and m2 and u2 are the mass and velocity before the collision of other smaller droplets, respectively.

2.3. Boundary Condition

For the boundary conditions of the two-nozzle spraying flue model established in this paper, the acceleration of gravity is set to a value of 9.81 m/s2 in the negative direction of the y-axis. The inlet boundary condition of the flue gas is the “velocity inlet” condition. The outlet boundary conditions are “outflow” conditions and the outlet pressure is atmospheric pressure. All calculation domain sidewalls are defined as adiabatic walls. The sidewalls of all calculation domains are set as no-slip velocity boundary conditions. Both the inlet and outlet boundary conditions of the droplets are set to “escape” conditions. The boundary condition of the droplets impacting the rectangular cross-section channel physical model calculation domain side wall is the “trap” condition. The nozzle type is set as solid cone, the nozzle radius is 0.02 m, and each nozzle has the same spraying flow rate.

2.4. Meshing and Mesh Independence Test

GAMBIT is used to mesh the physical model. Nozzle spraying area and FGD wastewater atomized droplet motion area are modeled elaborately to simulate the flow characteristics such as momentum change and heat and mass exchange in the interaction between the flue gas and the droplets. Hexahedral mesh is applied to mesh the physical model due to the uniformity of flue duct flow field. This method has both high calculation accuracy and speed. Figure 2 shows the structure of partial mesh in calculation domain.
In the case of dual-nozzle spraying with a flue gas temperature of 403.15 K and a single-nozzle spray flow of 30 L/h, the droplet evaporation rate at the cross-section of the flue x = 3 m is selected as a comparison parameter. The amount of mesh is 0.64, 1.01, 1.26, 2.51, 3.14, 4.18 and 5.01 million and mesh size is between 0.01 and 0.1 m. The result is shown in Figure 3. It can be seen in Figure 3 that the evaporation rate is steady within the scope of 1.26 million and 4.18 million. In order to conserve the numerical simulation accuracy and save computational resources, the mesh number is 2.51 million and the mesh sizes of the spraying area and mesh encryption area are 0.1 m and 0.02 m, respectively. The numbers of cells in the x, y and z directions are 1006, 50 and 50, respectively.

2.5. Numerical Calculation

In this paper, the flow and evaporation characteristics of spray droplets in flue gas are studied by using the commercial computational fluid dynamics CFD software Fluent 15.0. The evaporation of atomized droplets of FGD wastewater is studied in a Euler/Lagrange coordinate system. Continuous-phase turbulent flow field can be calculated by standard k-ε turbulence model. The SIMPLE algorithm is used to calculate the pressure and velocity coupling in a staggered grid. Continuous-phase governing equations can be solved through separate solver and first-order upwind implicit scheme. After the calculation converges to obtain a stable continuous phase flue gas field, the discrete phase atomized droplet group is added for calculation. The continuous-phase flow field is calculated in 10 steps per iteration, in which the spraying source spray particles are set to perform one discrete-phase iterative calculation.
For the numerical simulation of the flow and evaporation characteristics of the two-nozzle spray droplets in the flue gas, an unsteady tracking method is used to analyze the process of droplet breakage, collision and coalescence during evaporation in this paper. The time step of the droplet was set at 0.001 s, and the starting and ending time intervals of the calculation were set at 10 s. In this paper, the governing equations are calculated by second-order upwind method with second-order accuracy.

2.6. Experimental Verification

Figure 4 shows the numerical simulation compared to the experiment results [16] about the single droplet evaporation of double-nozzle spray model. As Figure 4 shows, the simulation results and the experimental results demonstrate the same trend, with the diameter of a single droplet suspended in still dry air gradually decreasing over time. The maximum relative error between the numerical simulation results and the experimental results does not exceed 9.8%. It is worth noting that the consistency between the two shows that the numerical simulation calculations in this paper have reasonable reliability.

3. Least Square Support Vector Machine (LSSVM) Prediction Model

Based on numerical simulation research on the vaporization characteristics of sprayed droplets, the multi-input multi-output (MIMO) droplet evaporation LSSVM prediction model was established so that nozzle selection and arrangement can be better achieved.
The data in the numerical simulation study are divided into training data and test data. Before training the prediction model, it is necessary to perform linear normalization preprocessing on the input data according to (28):
x i = x i x i , min x i , max x i , min
where xi is the input of the i-th training sample and x i is the training sample data after the normalization transformation. The transformed data takes a value between 0 and 1. The training sample input data constitutes the model:
Y = f ( X ) = W φ ( X ) + b = [ ω 1 T φ ( X ) + b 1 ω n T φ ( X ) + b n ]
where φ ( ) :   R m R m h is a nonlinear function that maps the input training sample data, W is the weight matrix of the high-dimensional feature space, Y = [ Y 1 , Y 2 , , Y l ] T , W = [ ω 1 , ω 2 , , ω n ] T , ω j = [ ω j 1 , ω j 2 , , ω j m ] T , b = [ b 1 , b 2 , , b n ] T and   j = 1 , 2 , , n . The objective optimization function of the MIMO-LSSVM algorithm can be expressed as:
min J ( W , e ) = 1 2 W 2 + 1 2 γ i = 1 n j = 1 l e i j 2
s .   t . Y i j = ω i T φ ( X j ) + b i + e i j , i = 1 , 2 , , n ; j = 1 , 2 , , l
where J ( W , e ) is the structural risk, γ is the regularization parameter that controls the degree of penalty of the regression function fitting error, eij is the forecast error and bi is deviation value. The Lagrangian method is used to solve (30) and (31):
L ( W , b , e , α ) = J ( W , e ) + i = 1 n j = 1 l α i j [ Y i j ω i T φ ( X j ) + b i + e i j ] = 1 2 i = 1 n j = 1 m ( ω i j ω i j ) + 1 2 γ i = 1 n j = 1 l e i j 2 + i = 1 n j = 1 l α i j [ Y i j ω i T φ ( Y j ) + b i + e i j ]
This is optimized by:
L ω i = 0 ,   L b i = 0 ,   L e i j = 0 ,   L α i j = 0
The result is expressed as:
ω i = j = 1 l α i j y i φ T ( X i ) ,   j = 1 l α i j = 0
α i j = γ e i j ,   Y i j ω i T φ ( X j ) + b i + e i j = 0 ,   i = 1 , 2 , , N
where α i = [ α i 1 , α i 2 , , α i l ] ,   i = 1 , 2 , , n ,   j = 1 , 2 , , l ;   and K p i = φ T ( X p ) φ ( X i ) = φ ( X p ) ,   φ ( X i ) .
In this paper, an adequate Gauss radial basis function (RBF) that satisfies the Mercer condition is used as the kernel function and is expressed as:
K ( X i , X j ) = exp ( X i X j 2 2 σ 2 )
The optimizing problem in (32) can be transformed to solve the linear equations set as:
Y i j = [ K 1 j , K 2 j , , K l j ] [ α i 1 α i l ] + b i + α i j γ
From (35) and (37), we can calculate that:
[ 0 I T I K p i + γ 1 I 1 ] [ b A ] = [ 0 l × n Y ]
where A = [ α 11 , , α n 2 , , α 1 l , α n l ] , I 1 = [ 1 , , 1 ] T ,   I 1 R n × 1 , I = [ 1 1 1 1 ] and I R n l × n .
The least squares method is used to obtain the regression coefficient αij and the deviation bi at the input data xi of each training sample. The nonlinear MIMO droplet evaporation prediction model could be expressed as:
Y ( X ) = j = 1 l α i j K ( X , X j ) + b i ,   i = 1 , 2 , , n
where αi is the support vector coefficient of the corresponding sample (xi,yi).

4. Results and Analysis

This study conducts numerical simulations on the evaporation of droplets using the control variate method. The evaporation rate of droplets at various distances along the duct is studied under different inlet flue gas temperatures.

4.1. Physical Parameters and Evaluation Indexes of Flue Gas and Liquid Droplets

Flue gas after leaving the air preheater but before entering the dust collector in the tail flue of a 300 MW coal-fired generator is used as the research object, and the flue gas is considered an ideal gas and usually consists of water vapor, oxygen and nitrogen. Among them, the mass fractions of the components are ω O 2 = 0.05 , ω CO 2 = 0 . 13 , ω H 2 O = 0 . 11 and ω N 2 = 0 . 71 . The actual operating conditions of a boiler in a thermal power plant are selected as the simulation research conditions, where the flue gas temperature is Tf = 403.15 K and the flue gas velocity is uf = 9 m/s. Table 1 shows the thermophysical properties of the flue gas at standard atmospheric pressure. The temperature of the FGD wastewater sprayed into the flue is Td = 323.15 K, the pH value is about 8.0, the concentration of calcium ions is 800 mg/L, magnesium ion is 17,000 mg/L, chloride ion is 12,000–15,000 mg/L and the total solid content is about 0.80%. Table 2 shows the thermophysical property parameters of the desulfurization wastewater under standard atmospheric pressure.
It is assumed that the diameter of the droplet group sprayed by the nozzles obeys the Rosin–Rammler distribution [32]. Table 3 shows the diameter range and mass fraction distribution relationship of the four droplet groups measured by the laser particle sizer in the experiment.
Y d = e ( d d / d ¯ d ) n
Here, d ¯ d is the average diameter (median diameter) of the droplet and n is the Rosin–Rammler distribution index.
By fitting the data in Table 3 into the Rosin–Rammler distribution exponential equation, the droplet diameter dd can be obtained through the fitting polynomial when Y d = e 1 0.368 . The average diameter and distribution index corresponding to the four groups of atomized droplets are 24.79 μm and 1.27708, 45.08 μm and 2.38151, 64.05 μm and 3.23307 and 84.84 μm and 3.55871, respectively.
For the particle size distribution of the atomized droplet group in the flue gas field, the Sauter mean diameter (SMD) is selected as the evaluation index of the spray evaporation performance to describe the liquid behavior during the evaporation process.

4.2. Overview of Wastewater Droplet Evaporation in Flue Duct

It can be seen from Figure 5 that in the flue gas temperature field, the temperature of the flue gas in the center area of the nozzle spray is low, and the flue gas temperature gradually increases on both sides.
In can be seen in Figure 6 that the droplets are sprayed from nozzles with the highest velocities, and then the velocities decreased rapidly along the direction of flue gas flow. The reason could be that atomized droplets with a relatively small size have low inertia, leading to a droplet velocity reduction to flue gas velocity rapidly and are entrained by flue gas until completely evaporate.
As we can see from Figure 7, the droplet concentration gradually decreases as the evaporation distance increases. For a flue with a length of 10 m, the spray droplets of FGD wastewater under the studied conditions can completely evaporate, which can prevent residual droplets from colliding with other droplets and adhering to tail flue ducts, leading to the corrosion of downstream equipment.

4.3. Effect of Influence Factors

4.3.1. Initial Temperature of Atomized Droplet Groups

The spraying flow rate of a single nozzle is Ln = 30 L/h; the initial velocity of the droplet is ud = 15 m/s; the droplet size (which follows the Rosin–Rammler distribution where the initial average diameter is dd = 45.08 μm); the flue gas velocity is uf = 9 m/s; the inlet flue gas temperature is Tf = 403.15 K; the spray full cone angle at β = 30° and the spray direction parallel to the flue gas flow direction are compared and analyzed.
It can be seen from Figure 8a that the droplets with a high initial temperature require a shorter distance for complete evaporation. The reason could be that the droplets with a high initial temperature have low surface tension and viscosity, which can increase the tangential force and radial force of the liquid film that is sprayed out of the nozzle. Finally, the second deformation of droplets takes place, and better atomization effects are achieved. At the same time, the droplets with a high initial temperature absorb less heat for complete evaporation, leading to a high vaporization rate. Figure 8b shows that when the inlet flue gas temperature is constant, the average diameter D32 of the droplets at different flue gas velocities reduces slightly at first along the flue gas flow direction before increasing and then decreasing once more. The reason could be that the effects of droplet surface tension and viscosity are dominant in the initial atomization period. In the interim period, the droplets are entrained by flue gas and collisions take place between droplets and flue gas, leading to a decrease in the droplet diameter. In the final period, the droplets absorb flue gas waste heat and evaporate completely.

4.3.2. Temperature of Flue Gas

The spraying flow rate of a single nozzle is Ln = 30 L/h; the initial velocity of a droplet is ud = 15 m/s; the initial temperature of a droplet is Td = 323.15 K; the droplet size (which follows the Rosin–Rammler distribution where the initial average diameter is dd = 45.08 μm); the spray full cone angle at β = 30° and the spray direction parallel to the flue gas flow direction are compared and analyzed.
It can be seen from Figure 9a that a higher inlet flue gas temperature improves the rate of droplet evaporation, shortening the time and distance of complete evaporation. This is because flue gas with a higher inlet temperature has a larger temperature difference between itself and the droplets, and energy exchange due to molecular collisions are thus more intense, contributing to the droplets’ rapid evaporation. Figure 9b shows that when the inlet flue gas temperature is constant, the average diameter D32 of the droplets at different flue gas velocities reduces slightly first along the flue gas flow direction, then increases and then decreases once more. The reason could be that in the initial period of evaporation, droplets with a high Weber number deform and break after the collision, decreasing the D32. Then, the droplets are entrained by the flue gas due to the droplet velocities’ reduction, collisions and coalescence of droplets happening and leading to an increase in the D32. In the end, the droplets absorb the heat and completely evaporate within 10 m.

4.3.3. Spraying Flow Rate of Nozzle

The initial velocity of the droplets ud = 15 m/s; the initial temperature of the droplets Td = 323.15 K; the droplet size (which follows the Rosin–Rammler distribution where the initial average diameter is dd = 45.08 μm); the temperature of the inlet flue gas Tf = 403.15 K; the velocity of the flue gas uf = 9 m/s; the spray full cone angle at β = 30° and the spray direction parallel to the flue gas flow direction are compared and analyzed.
It can be seen from Figure 10a that when the inlet flue gas temperature is constant, as the injection flow rate increases the evaporation speed of the atomized droplet group decreases, and the evaporation quality deteriorates. This is because the number of droplets required to evaporate increases with an increase in the spraying flow rate, and a large number of droplets have not completely diffused during movement to sufficiently make contact with the flue gas, leading to incompletely exchanging heat with the flue gas. As Figure 10b shows that when the inlet flue gas temperature is constant, the D32 of the droplets at different flue gas velocities reduces slightly first along the flue gas flow direction, then increases and then decreases once more. The reason is the same as that given for the same phenomenon in Section 4.3.2.

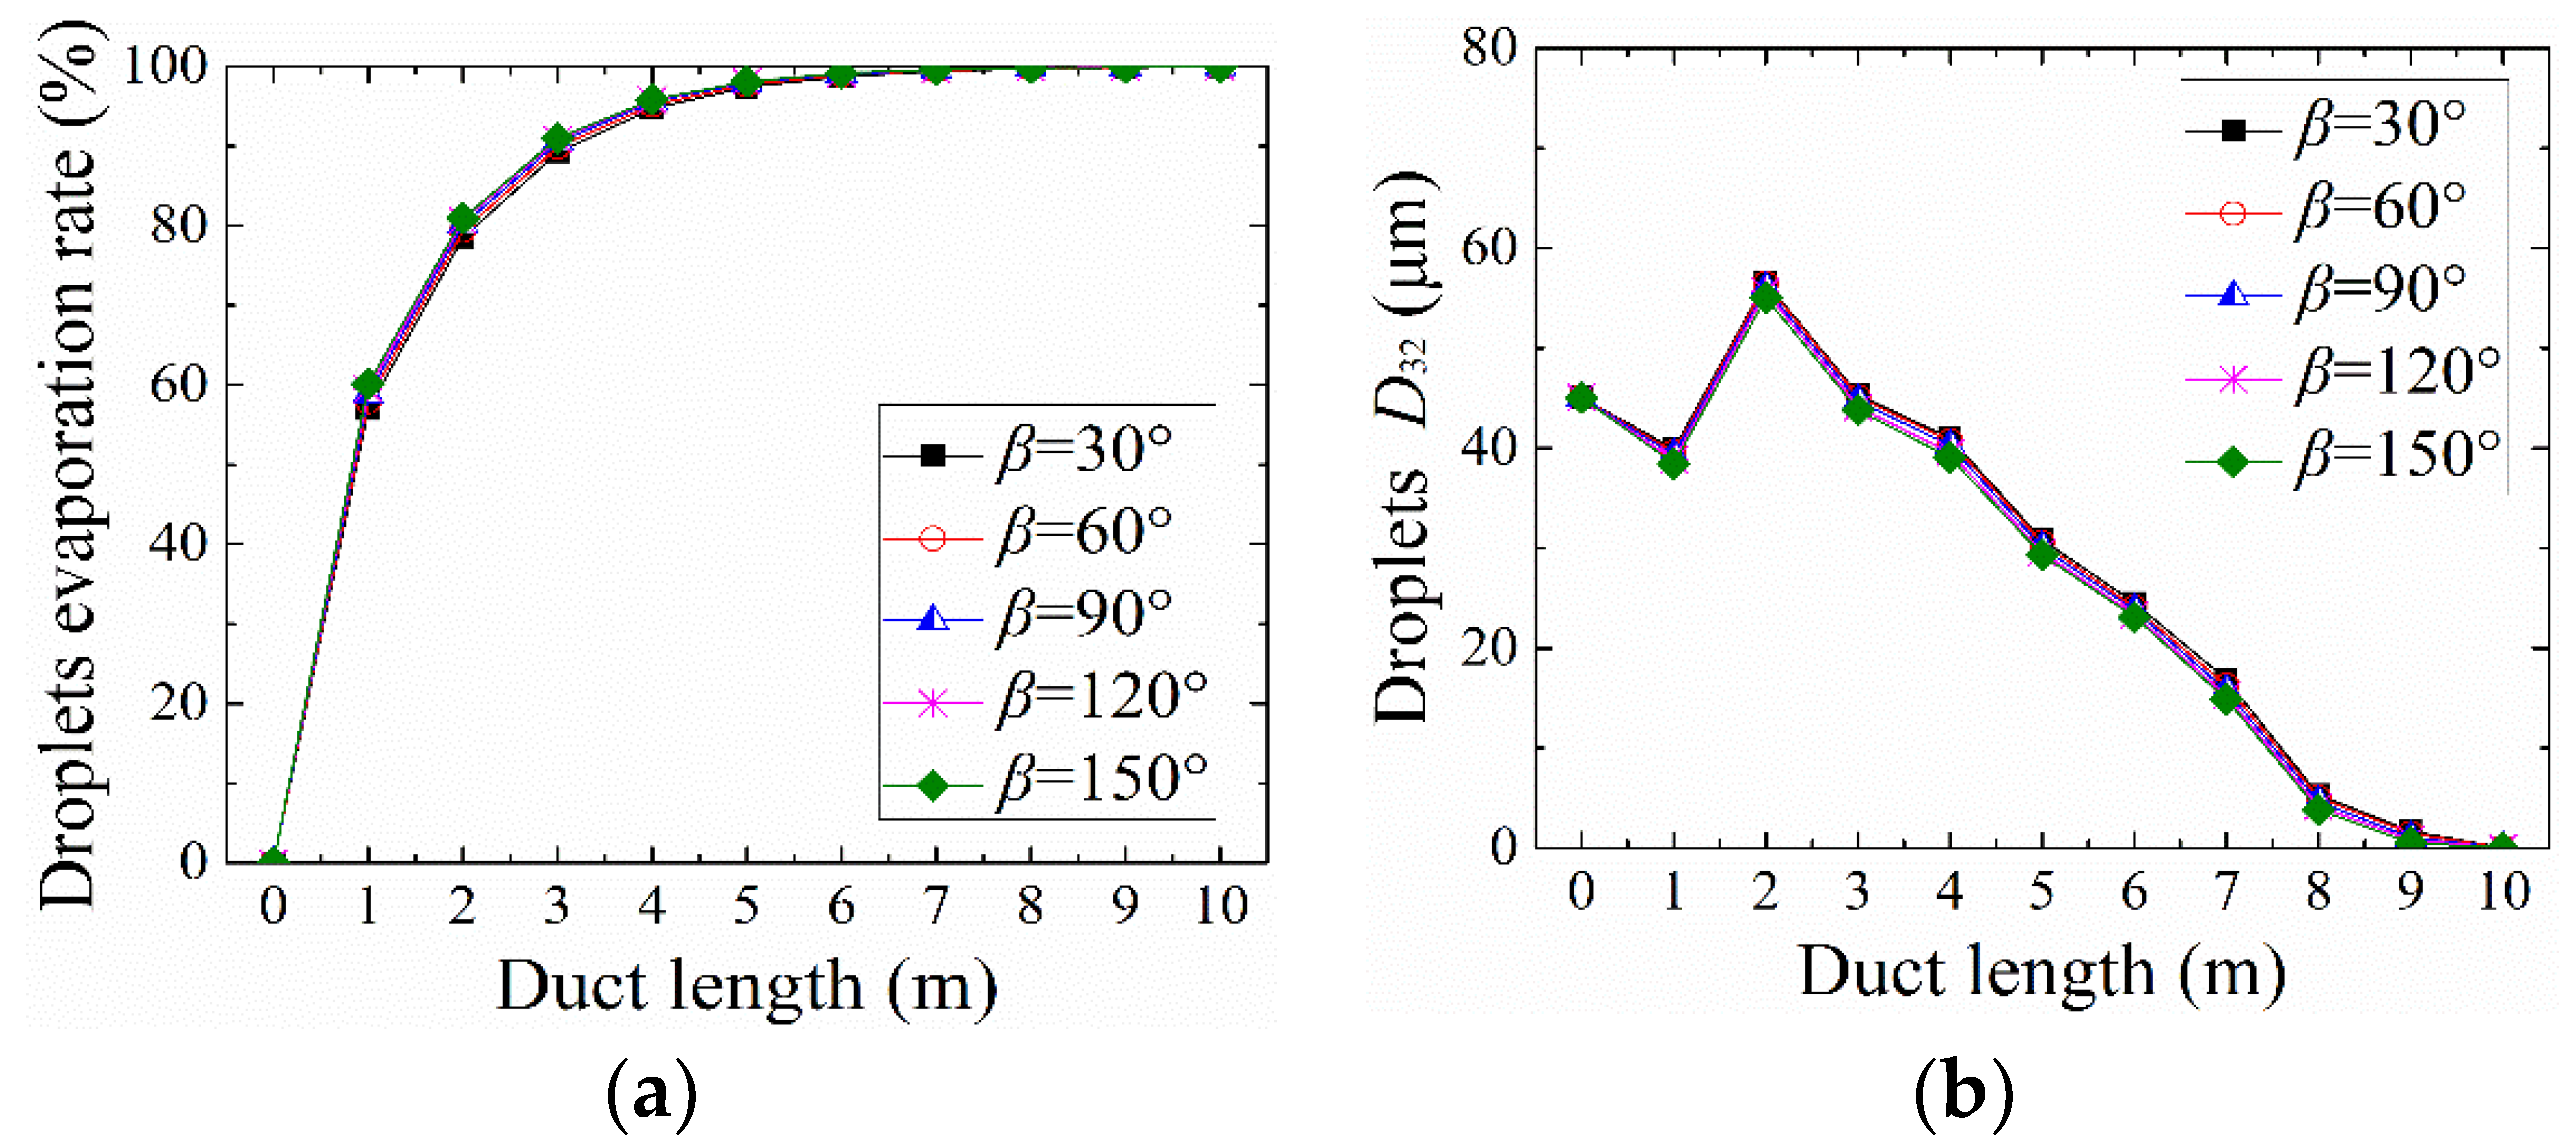
4.3.4. Spray Full Cone Angle

The spraying flow rate of a single nozzle Ln = 30 L/h; the initial velocity of the droplets ud = 15 m/s; the initial temperature of the droplets Td = 323.15 K; the droplet size (which follows the Rosin–Rammler distribution where the initial average diameter is dd = 45.08 μm); the temperature of the inlet flue gas Tf = 403.15 K; the velocity of the flue gas uf = 9 m/s and the spray direction parallel to the flue gas flow direction are compared and analyzed.
It can be seen in Figure 11a that as the spray full cone angle increases, the droplet evaporation rate tends to increase, but is not prominent. This is because the growth in the spray full cone angle is conducive to the formation of a larger spray cone surface, which can diffuse the droplets in the flue gas sufficiently. Figure 11b shows that when the inlet flue gas temperature is constant, the average diameter D32 of the droplets at different flue gas velocities reduces slightly first along the flue gas flow direction, then increases and then decreases once more. The reason is the same as that given for the same phenomenon in Section 4.3.2.

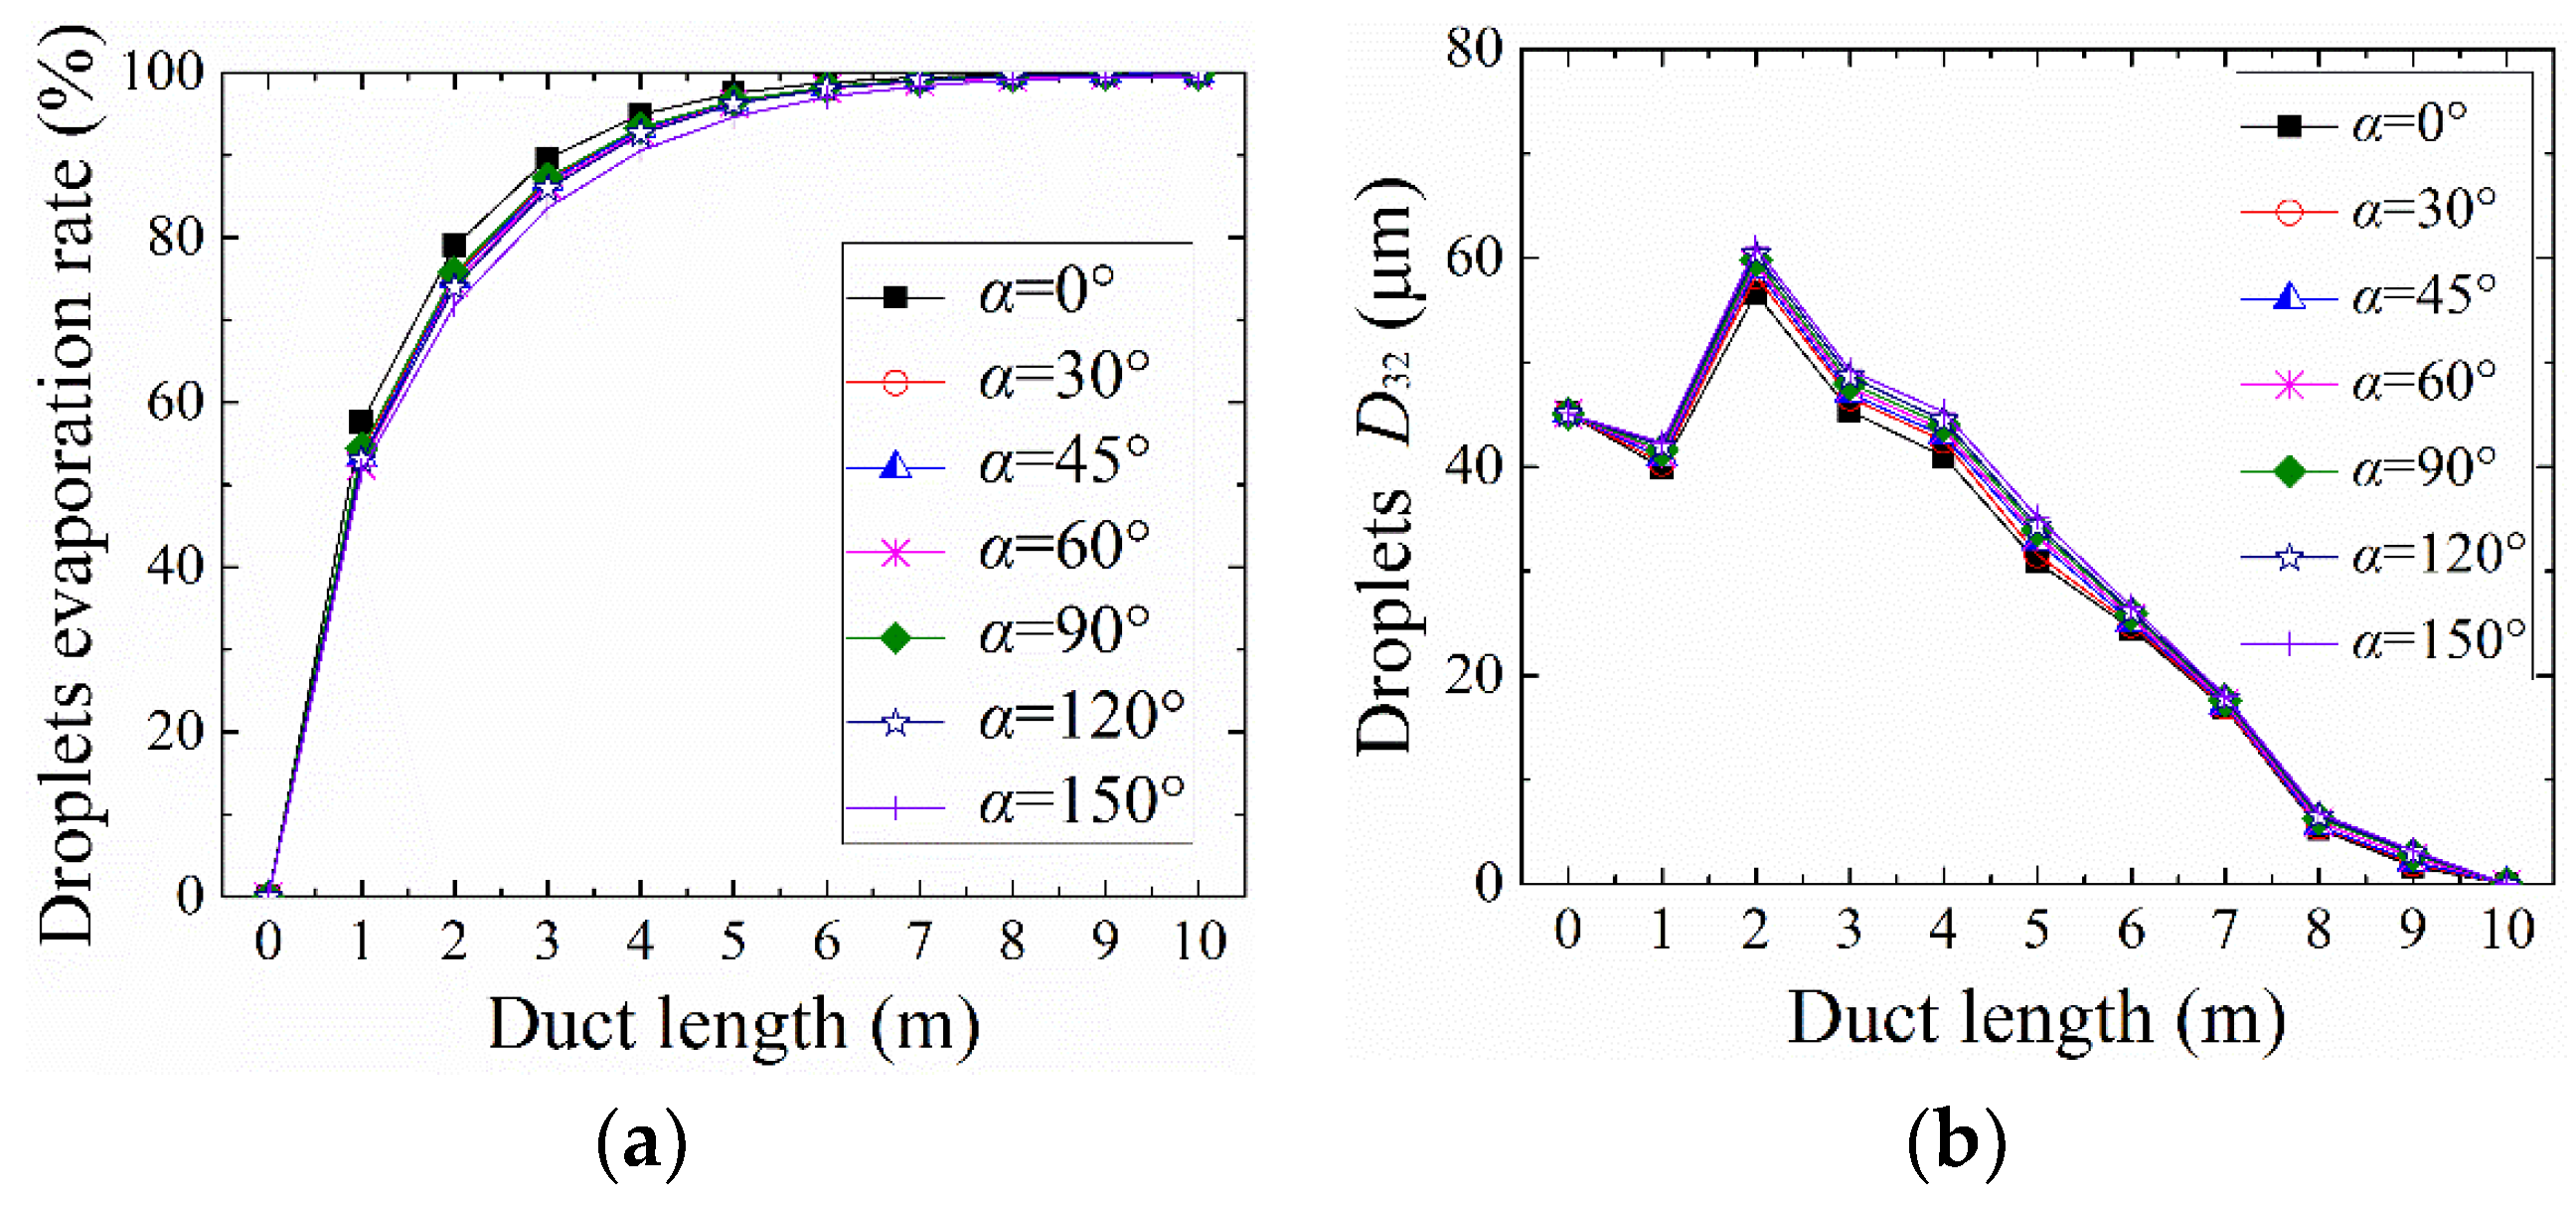
4.3.5. Spray Direction of Nozzles

The spraying flow rate of a single nozzle Ln = 30 L/h; the initial velocity of the droplets ud = 15 m/s; the initial temperature of the droplets Td = 323.15 K; the droplet size (which follows the Rosin–Rammler distribution where the initial average diameter is dd = 45.08 μm); the temperature of the inlet flue gas Tf = 403.15 K; the velocity of the flue gas uf = 9 m/s and the spray full cone angle at β = 30° are compared and analyzed.
It can be seen from Figure 12a that the droplet evaporation rate is at its fastest when the nozzle spray direction is parallel to the flue gas flow direction. A vaporization process with a smaller angle between the spraying direction and the flue gas flow direction could improve the evaporation effect of the droplets. Although a certain angle between the droplet initial velocity direction and the flue gas flow direction could enhance the convective motion between the droplets and the flue gas, the spatial distribution of droplet movement diffusion is determined by the nozzle spraying direction. Droplets with larger spraying angles result in lower diffusion in the initial spraying period, which makes heat absorption uneven and increases the heat exchange time between the droplets and the flue gas, leading to worse evaporation quality. Figure 12b shows that when the inlet flue gas temperature is constant, the average diameter D32 of the droplets at different flue gas velocities reduces slightly first along the flue gas flow direction, then increases and then decreases once more. The reason is the same as that given for the same phenomenon in Section 4.3.2.
If the working conditions under the spray directions of the nozzles can be α = 0°, 45°, 90° and 150°, it can be seen from Figure 13 that with an increase in the spraying angle, the diffusion of the atomized droplet group in the flue gas becomes worse, and the interference overlap of the two nozzles increment in terms of the affected area. The evaporation rate declines with a decrease in the angle between the spraying direction and the flue gas flow direction due to insufficient contact and heat exchange between the droplets and the flue gas.

4.4. Multi-Input Multi-Output (MIMO) Droplet Evaporation LSSVM Prediction Model

In this section, a multi-input multi-output (MIMO) droplet evaporation LSSVM prediction model is proposed based on the conditions and parameters studied in numerical simulations related to the flow and evaporation characteristics of droplets sprayed by double-nozzle into the flue ducts (Section 4.3) to predict the droplet evaporation rate of different cross sections in the flue duct during the evaporation process in order to finally determine the nozzle selection and optimized arrangement for engineering applications.
The initial temperature of atomized droplets, the temperature of the flue gas, the spray full cone nozzle angle, the spray direction of the nozzle and the distance of the flue duct evaporation are selected as input variables and the spray flow rate of the nozzle, the droplet evaporation rate and the diameters of atomized droplets are selected as output variables to verify the feasibility and effectiveness of the MIMO droplet evaporation LSSVM prediction model. A total of 2000 numerical data are used as sample data in the prediction model, of which 1400 are used as the training data and 600 are used as the test data.
Firstly, 1400 training data are imported into the droplet evaporation LSSVM prediction model to begin rolling training to verify the obtained relevant parameters of the droplet evaporation prediction model in order to balance the training accuracy and generalization ability. The optimized parameters are set to γ = 15,000 and σ = 0.01 to make sure the prediction root-mean-square error is as small as possible. Then, the output prediction calculation proceeds according to the conditions and technological parameters of the 600 test data, and the process output is obtained. The results are shown in Figure 14.
It can be seen from Figure 14a that the prediction value obtained from the droplet evaporation LSSVM prediction model fits well with the true value. It can be applied to accurately predict the evaporation rates under different conditions in different cross sections of the flue duct via numerical simulation.
Figure 14 shows that the maximal relative error between the prediction value and the true value does not exceed 8.6%, the average relative error is 1.9304% and the root-mean-square error is 1.5177%.

4.5. Optimization of Engineering Example

The entire unit of a power plant adopts coal-fired units. The whole installed capacity is 600 MW (2 × 300 MW). The limestone–gypsum WFGD process is utilized in the whole power plant. A certain amount of FGD wastewater is produced in the productive process, and the FGD wastewater output of a single 300 MW unit is 8 m3/h. The wastewater treatment technological process is shown in Figure 15.
In view of the existing treatment defects of a 300 MW coal-fired generator set in a southern power plant, an optimized project plan is proposed. The treatment of FGD wastewater is combined with boiler flue gas waste heat utilization technology to form an efficient, low-cost wastewater treatment process route, which is shown in Figure 16.
In order to arrange the most nozzles for FGD wastewater treatment under actual operating conditions and to increase the disposing quantity of the FGD wastewater at the same time, the design flow rate of a single atomized nozzle is Ln = 60 L/h, the range of the spray full cone angle is β = 30–90°, the spray direction is parallel to the direction of the flue gas flow (α = 0°) and the initial velocity of the droplet is ud = 10 m/s. Additionally, it is necessary to ensure that the initial mean diameter of the droplets is dd = 45.08 μm. The distance between two adjacent nozzles is set at dopt = 0.1 m. The installation distance between the nozzle and the flue duct horizontal wall is Aopt = 0.9 m. The installation distance between the nozzle and the flue duct vertical wall is Bopt = 0.7 m. The optimized arrangement of nozzles is shown in Figure 17.
A numerical simulation is conducted to verify the feasibility of the improved nozzle layout scheme proposed above. A quarter of a flue is selected as a physical model. Atomized nozzles are arranged along the rectangular section. A total of 23 nozzles are arranged along the horizontal direction and 21 nozzles are arranged along the vertical direction.
As Figure 18 shows that the flue gas temperature is lower in the spraying center area of the nozzle than in the adjacent area. The reason could be that droplets sprayed by nozzles are distributed as a circular cone. High concentrations in the spraying center area with high evaporation leads to a significant decrease in flue gas temperature in the center area of the flue duct. With the FGD wastewater droplets evaporating gradually, the distribution of the flue gas tends to be uniform. The temperature of the flue gas rebounds gradually with an increase in the distance of evaporation. The minimum temperature value in the flue is 397.1 K, and the flue gas temperature drop did not exceed 6.1 °C, leading to lower flue gas temperature fluctuations, meaning that it is higher than the acid dew point. This feature can protect the flue equipment from corrosion.
Figure 19 shows the droplet concentration clouds at different cross sections along the evaporation distance. As can be seen from Figure 18, atomized droplets diffuse gradually and evaporate rapidly, increasing the vaporization distance and decreasing the droplet concentration. For a flue with a length of 10 m, the optimized nozzle arrangement scheme can achieve the complete evaporation of the droplets, which can prevent the residual droplets from colliding and sticking to the equipment downstream of the tail flue, which can cause corrosion and abrasion.

5. Conclusions

(1)
A shorter installation distance between two adjacent nozzles leads to a lower evaporation rate of droplets. Droplets with higher initial temperatures require a shorter time and distance for complete evaporation. On the other hand, a higher flue gas temperature makes atomized droplets evaporate faster. Properly increasing the flue gas velocity can improve the evaporation quality of the atomized droplets.
(2)
A multi-nozzle arrangement with a small flow rate can improve the evaporation quality of the atomized droplets; when the spray direction of the nozzle is parallel to the flow direction of the flue gas, the evaporation mass flow rate of the atomized droplet group can be maximized.
(3)
A LSSVM droplet evaporation prediction model is established, which can be used for the time series prediction of the droplet evaporation rate with high prediction accuracy.
(4)
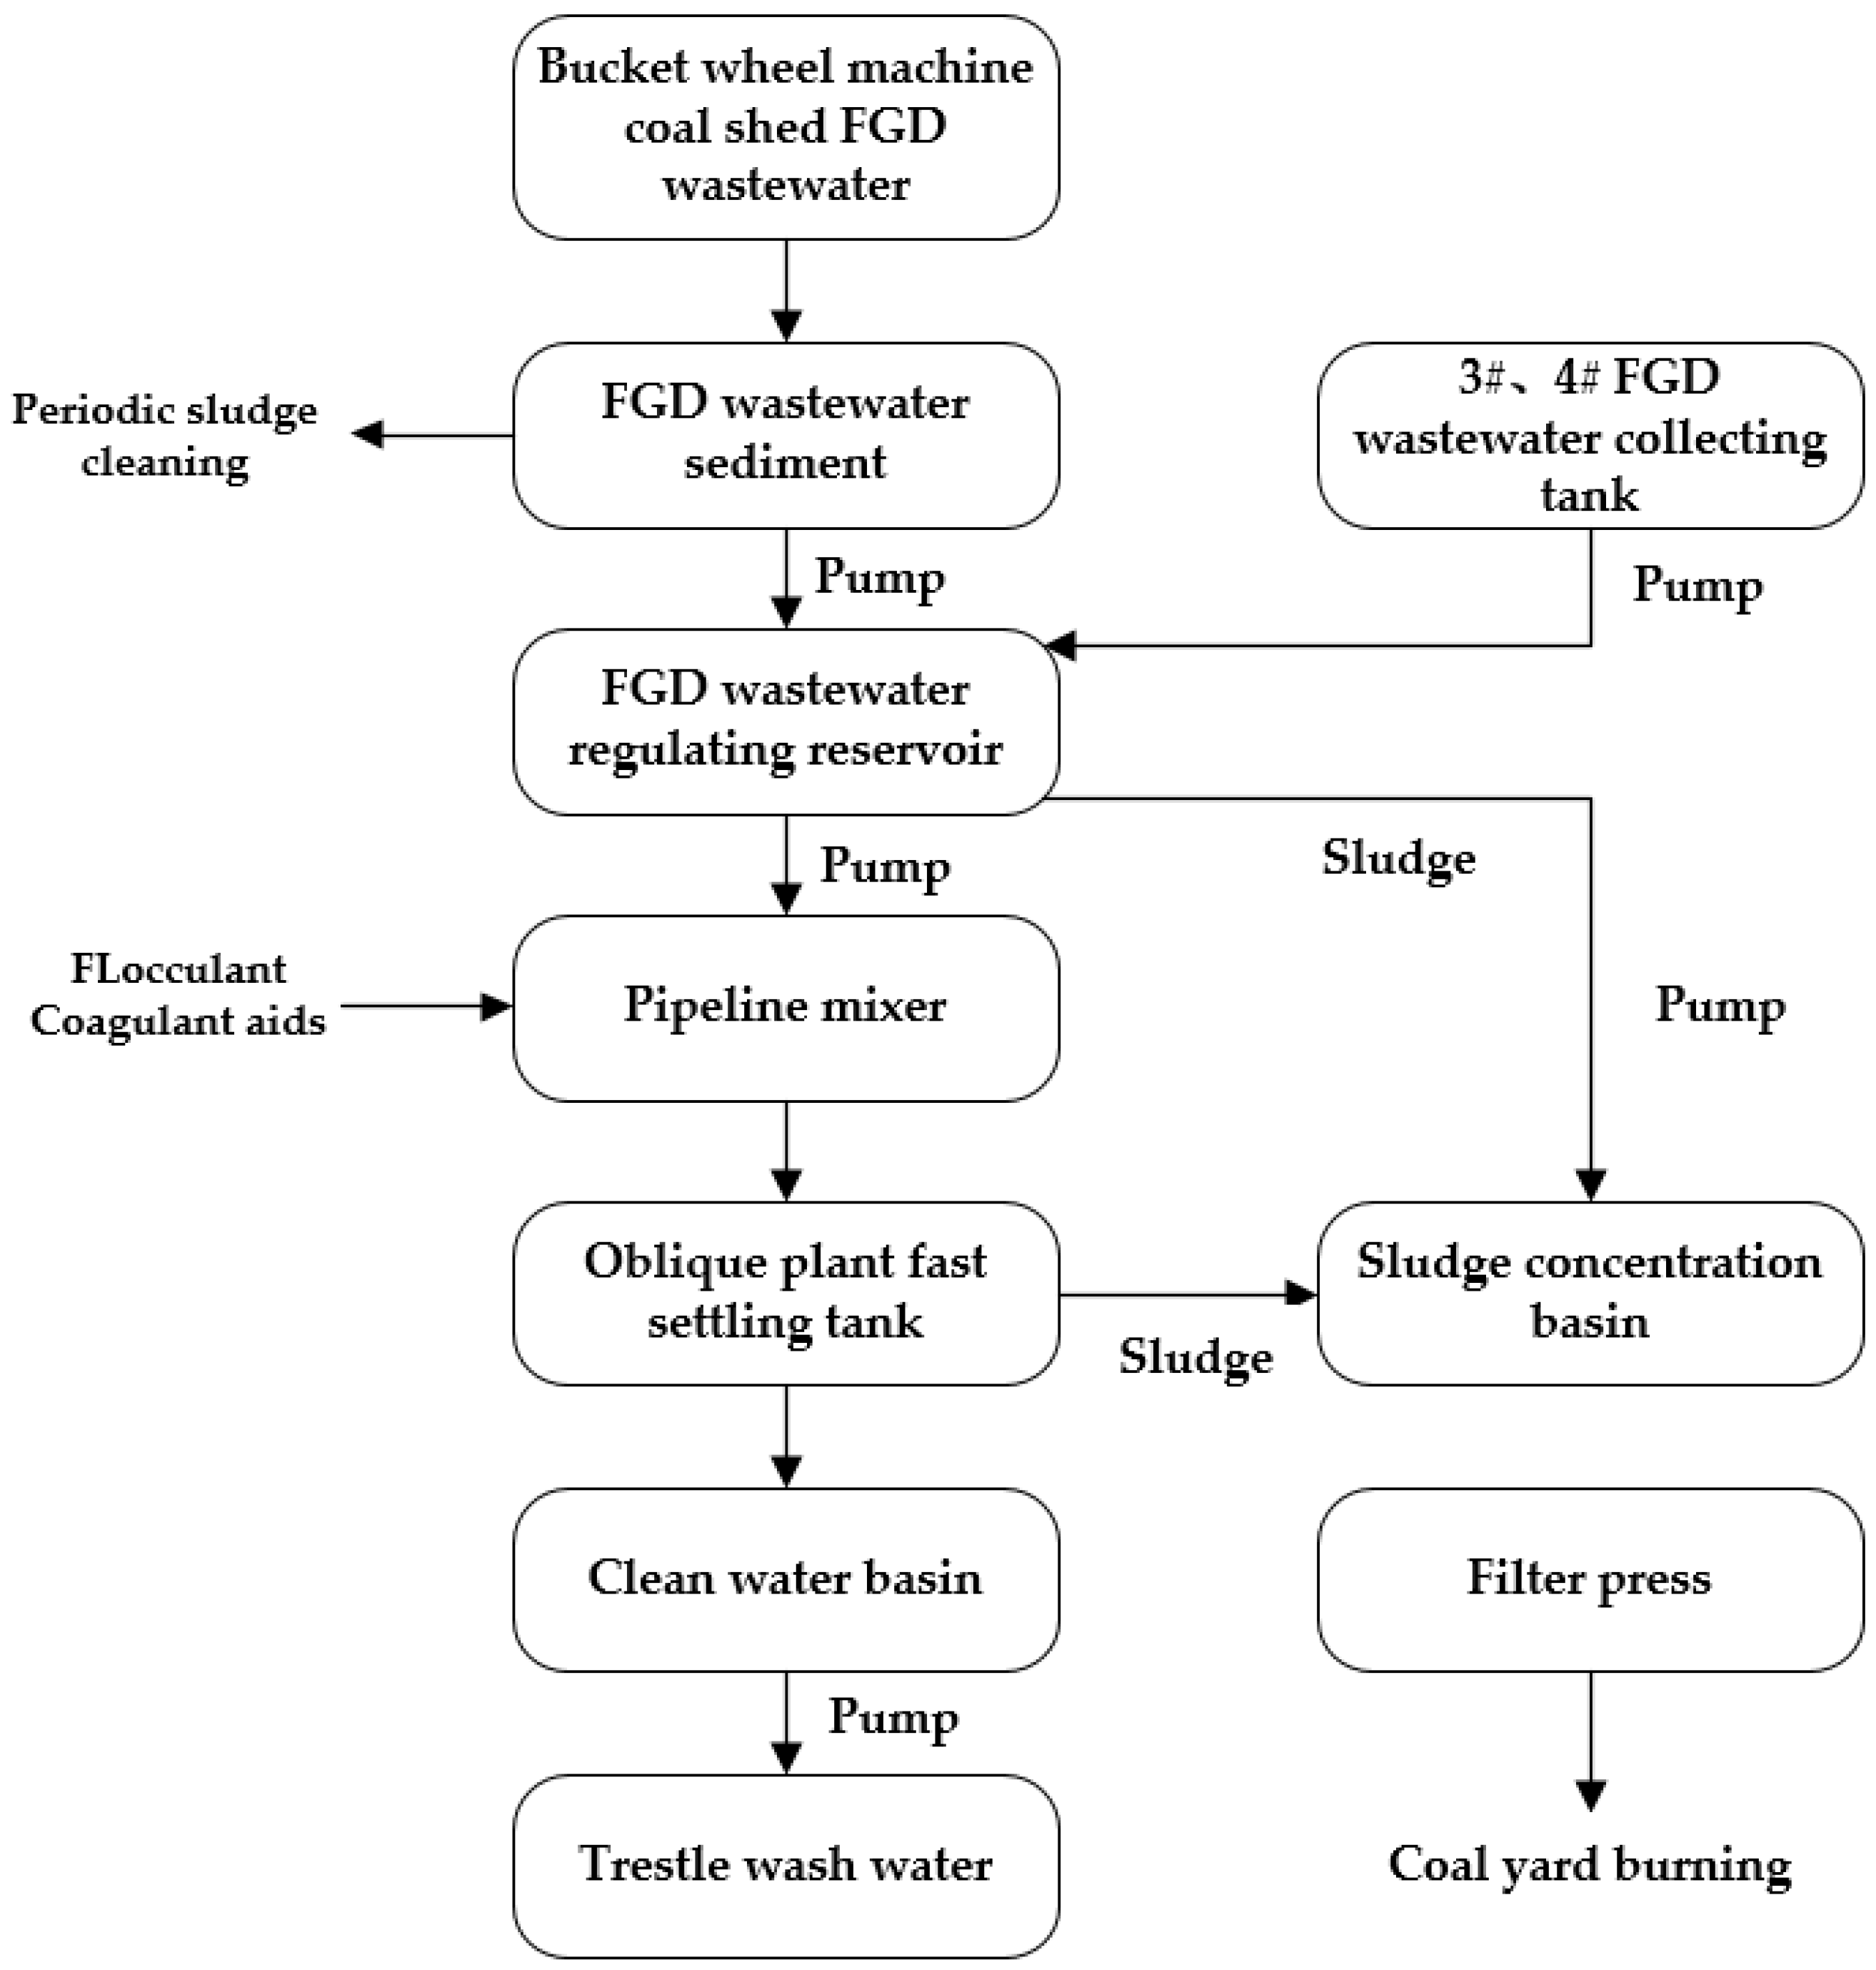
An optimization plan for evaporation treatment technology for FGD wastewater sprayed into a flue is proposed. Through numerical simulations, it is verified that the abovementioned optimized treatment process and nozzle layout scheme can meet the actual engineering requirements.
(5)
This research can not only provide a theoretical foundation for the process design and performance control of FGD wastewater flue gas evaporation in power plants but can also aid with nozzle selection and management of FGD wastewater spray evaporation systems under actual operating conditions in power plants.

Author Contributions

Investigation, X.G. and J.W.; data curation, X.G. and J.W.; visualization, X.G. and Y.Z.; Writing—original draft preparation, X.G.; project administration, X.D.; funding acquisition, J.W. and X.D.; resources, S.F.; supervision, S.L. All authors have read and agreed to the published version of the manuscript.

Funding

This research was funded by the Key Program of the National Natural Science Foundation of China, grant number 52130607, the Science and Technology Program of Gansu Province, grant number 20JR10RA195 and 21JR7RA262 and the Key Laboratory of Fluid Machinery and Systems (Gansu Province) Lanzhou University of Technology, grant number KMFS2018-05.

Conflicts of Interest

The authors declare no conflict of interest.

References

  1. Koralegedara, N.H.; Pinto, P.X.; Dionysiou, D.D.; Al-Abed, S.R. Recent advances in flue gas desulfurization gypsum processes and applications—A review. J. Environ. Manag. 2019, 251, 109572. [Google Scholar] [CrossRef]
  2. Yao, X.; Zhang, M.; Deng, B.; Yang, X.; Yang, H. Primary Research of a New Zero-Liquid-Discharge Technology of Wet Flue Gas Desulfurization Wastewater by Low-Rank Heat from Flue Gas. Energies 2021, 14, 4259. [Google Scholar] [CrossRef]
  3. Muhammad, Y.; Lee, W. Zero-liquid discharge (ZLD) technology for resource recovery from wastewater: A review. Sci. Total Environ. 2019, 681, 551–563. [Google Scholar] [CrossRef] [PubMed]
  4. Feng, S.; Xiao, L.; Ge, Z.; Yang, L.; Du, X.; Wu, H. Parameter analysis of atomized droplets sprayed evaporation in flue gas flow. Int. J. Heat Mass Transf. 2019, 129, 936–952. [Google Scholar] [CrossRef]
  5. Ashgriz, N. Handbook of Atomization and Sprays; Springer: New York, NY, USA, 2011. [Google Scholar]
  6. Deng, J.-J.; Pan, L.-M.; Chen, D.-Q.; Dong, Y.-Q.; Wang, C.-M.; Liu, H.; Kang, M.-Q. Numerical simulation and field test study of desulfurization wastewater evaporation treatment through flue gas. Water Sci. Technol. 2014, 70, 1285–1291. [Google Scholar] [CrossRef]
  7. Hou, Y.; Tao, Y.; Huai, X.; Guo, Z. Numerical characterization of multi-nozzle spray cooling. Appl. Therm. Eng. 2012, 39, 163–170. [Google Scholar] [CrossRef]
  8. Lupo, G.; Gruber, A.; Brandt, L.; Duwig, C. Direct numerical simulation of spray droplet evaporation in hot turbulent channel flow. Int. J. Heat Mass Transf. 2020, 160, 120184. [Google Scholar] [CrossRef]
  9. Markadeh, R.S.; Arabkhalaj, A.; Ghassemi, H.; Azimi, A. Droplet evaporation under spray-like conditions. Int. J. Heat Mass Transf. 2020, 148, 119049. [Google Scholar] [CrossRef]
  10. Tissot, J.; Boulet, P.; Trinquet, F.; Fournaison, L.; Macchi-Tejeda, H. Air cooling by evaporating droplets in the upward flow of a condenser. Int. J. Therm. Sci. 2011, 50, 2122–2131. [Google Scholar] [CrossRef]
  11. Kim, H.; Sung, N. The effect of ambient pressure on the evaporation of a single droplet and a spray. Combust. Flame 2003, 135, 261–270. [Google Scholar] [CrossRef]
  12. Gradinger, T.; Boulouchos, K. A zero-dimensional model for spray droplet vaporization at high pressures and temperatures. Int. J. Heat Mass Transf. 1998, 41, 2947–2959. [Google Scholar] [CrossRef]
  13. Godsave, G. Studies of the combustion of drops in a fuel spray—The burning of single drops of fuel. Symp. Combust. 1953, 4, 818–830. [Google Scholar] [CrossRef]
  14. Sazhin, S.; Shishkova, I.; Kryukov, A.; Levashov, V.; Heikal, M. Evaporation of droplets into a background gas: Kinetic modelling. Int. J. Heat Mass Transf. 2007, 50, 2675–2691. [Google Scholar] [CrossRef]
  15. Ranz, W.E.; Marshall, W.R. Evaporation from drops—Part 1. Chem. Eng. Prog. 1952, 48, 141–148. [Google Scholar]
  16. Ranz, W.E.; Marshall, W.R. Evaporation from drops—Part 2. Chem. Eng. Prog. 1952, 48, 173–180. [Google Scholar]
  17. Tseng, C.; Viskanta, R. Enhancement of water droplet evaporation by radiation absorption. Fire Saf. J. 2006, 41, 236–247. [Google Scholar] [CrossRef]
  18. Sureshkumar, R.; Kale, S.R.; Dhar, P.L. Heat and mass transfer processes between a water spray and ambient air—I. Experimental data. Appl. Therm. Eng. 2008, 28, 349–360. [Google Scholar] [CrossRef]
  19. Sureshkumar, R.; Kale, S.R.; Dhar, P.L. Heat and mass transfer processes between a water spray and ambient air—II. Simulations. Appl. Therm. Eng. 2008, 28, 361–371. [Google Scholar] [CrossRef]
  20. Okada, S.; Ohsaki, S.; Nakamura, H.; Watano, S. Estimation of evaporation rate of water droplet group in spray drying process. Chem. Eng. Sci. 2020, 227, 115938. [Google Scholar] [CrossRef]
  21. Gonzalez-Juez, E.D.; Kerstein, A.R. Multiscale modeling of turbulent atomization: Droplet-size sampling. Int. J. Multiph. Flow 2020, 128, 103268. [Google Scholar] [CrossRef]
  22. Yu, H.; Jin, Y.C.; Cheng, W.; Yang, X.; Peng, X.; Xie, Y. Multiscale simulation of atomization process and droplet particles diffusion of pressure-swirl nozzle. Powder Technol. 2021, 379, 127–143. [Google Scholar] [CrossRef]
  23. Shlegel, N.; Strizhak, P.; Tarlet, D.; Bellettre, J. Comparing the integral characteristics of secondary droplet atomization under different situations. Int. Commun. Heat Mass Transf. 2019, 108, 104329. [Google Scholar] [CrossRef]
  24. Fu, H.; Zhao, R.; Long, W.; Cheng, W. Study on cooling performance of rapid cooling system based on vacuum spray flash evaporation. Appl. Therm. Eng. 2021, 201, 117751. [Google Scholar] [CrossRef]
  25. Sarmadian, A.; Dunne, J.; Jose, J.T.; Long, C.; Pirault, J.-P. Temperature control of vibrating heat-generating hardware using spray evaporative cooling in the nucleate boiling region. Appl. Therm. Eng. 2021, 200, 117710. [Google Scholar] [CrossRef]
  26. Sazhin, S.S. Advanced models of fuel droplet heating and evaporation. Prog. Energy Combust. Sci. 2006, 32, 162–214. [Google Scholar] [CrossRef]
  27. Brown, B. Evaporation and droplet growth in gaseous media. Cryogenics 1960, 1, 55. [Google Scholar] [CrossRef]
  28. Jen, T.-C.; Li, L.; Cui, W.; Chen, Q.; Zhang, X. Numerical investigations on cold gas dynamic spray process with nano- and microsize particles. Int. J. Heat Mass Transf. 2005, 48, 4384–4396. [Google Scholar] [CrossRef]
  29. Chen, W.; Chong, D.; Yan, J.-J.; Dong, S.-C.; Liu, J.-P. Numerical Investigation of Two-Phase Flow in Natural Gas Ejector. Heat Transf. Eng. 2014, 35, 738–745. [Google Scholar] [CrossRef]
  30. Liu, A.B.; Mather, D.; Reitz, R.D. Modeling the Effects of Drop Drag and Breakup on Fuel Sprays. Tech. Paper 1993, 298, 83–95. [Google Scholar]
  31. O’Rourke, P.; Amsden, A. The TAB Method for Numerical Calculation fof Spray Droplet Breakup. Sae Paper 1987, 12. [Google Scholar] [CrossRef] [Green Version]
  32. Rosin, P.; Rammler, E. The Laws Governing the Fineness of Powdered Coal. J. Inst. Fuel 1933, 7, 29–36. [Google Scholar]
Figure 1. Physical model structure of the flue duct with two nozzles.
Energies 15 05180 g001
Figure 2. Structure diagram of double-nozzle spraying physical model partial mesh.
Energies 15 05180 g002
Figure 3. Effect of mesh number in double-nozzle spraying model on droplet evaporation rate.
Energies 15 05180 g003
Figure 4. Schematic diagram comparing the experimental and simulation results of the two-nozzle spraying model.
Energies 15 05180 g004
Figure 5. Temperature field of gas during wastewater droplet evaporation under two-nozzle and three-nozzle spraying conditions.
Energies 15 05180 g005
Figure 6. Cloud diagram of the droplet velocity distribution under the two-nozzle spraying condition.
Energies 15 05180 g006
Figure 7. Droplet concentration field under two-nozzle and three-nozzle spraying conditions.
Energies 15 05180 g007
Figure 8. Droplet evaporation quality and diameter along the duct under different initial temperatures. (a) Evaporation quality of droplets with different initial temperatures. (b) The changes in the D32 of droplets along the flue with different initial temperatures.
Energies 15 05180 g008
Figure 9. Droplet evaporation quality and diameter along the duct under different nozzle spraying flow rates. (a) Evaporation quality of droplets under different velocities of flue gas. (b) The changes in the D32 of droplets along the flue with different velocities of flue gas.
Energies 15 05180 g009
Figure 10. Droplet evaporation quality and diameter along the duct under different spraying flow rates of the nozzle. (a) Evaporation quality of droplets under different velocities of flue gas; (b) The changes in the D32 of droplets along the flue with different velocities of flue gas.
Energies 15 05180 g010
Figure 11. Droplet evaporation quality and diameter change of droplets under different spray full cone nozzle angles. (a) Evaporation quality of droplets under different spray full cone nozzle angles. (b) The changes in the D32 of droplets under different spray full cone nozzle angles.
Energies 15 05180 g011
Figure 12. Droplet evaporation quality and diameter change of the droplets under different nozzle spray directions. (a) Evaporation quality of droplets under different nozzle spray directions; (b) The changes in the D32 of droplets along the flue under different nozzle spray directions.
Energies 15 05180 g012
Figure 13. Flue gas temperature field at different cross sections under different spray directions. (a) α = 0°; (b) α = 45°; (c) α = 90°; (d) α = 150°.
Energies 15 05180 g013aEnergies 15 05180 g013b
Figure 14. Accuracy analysis of the MIMO-LSSVM prediction model. (a) Fitting condition of true value and prediction value. (b) Relative error.
Energies 15 05180 g014
Figure 15. Flow chart of FGD wastewater treatment in a 300 MW coal-fired generator in a power plant.
Energies 15 05180 g015
Figure 16. Flow chart of FGD wastewater sprayed into flue evaporation treatment technology.
Energies 15 05180 g016
Figure 17. Schematic diagram of optimized nozzles arrangement.
Energies 15 05180 g017
Figure 18. Temperature cloud of flue gas flow field.
Energies 15 05180 g018
Figure 19. Droplet concentration clouds at different cross sections along the evaporation distance.
Energies 15 05180 g019
Table 1. Thermophysical parameters of flue gas under standard atmospheric pressure.
Physical Parameter
Unit
Temperature
(T, K)
Density
(ρ, kg/m3)
Specific Heat
(cp,kJ/(kg·K))
Thermal
Conductivity
(λ, W/(m·K))
Flue gas403.150.88941.07673.394 × 10−2
Table 2. Thermophysical parameters of desulfurization wastewater under standard atmospheric pressure.
Physical Parameter
Unit
Temperature
(T, K)
Density
(ρ, kg/m3)
Specific Heat
((cp,kJ/(kg·K)))
Thermal
Conductivity
(λ, W/(m·K))
Wastewater323.1510744.17464.8
Table 3. Four types of droplet group diameter range and mass fraction distribution.
Size Range of Diameter dd
(μm)
Proportion of Mass Fraction
First Second Third Fourth
0–200.520.120.050.03
20–400.350.400.150.04
40–600.060.350.350.12
60–800.040.080.350.36
80–1000.030.050.100.45
Publisher’s Note: MDPI stays neutral with regard to jurisdictional claims in published maps and institutional affiliations.

