Abstract
This study is about multicriteria decision aiding (MCDA) for the green airports program of the Moroccan Airport Authority ONDA. The goal of the program is to develop significant amounts of renewable power at airports. In particular, ONDA wants to select airports at which large solar and wind power parks should be built. Multiple criteria, including economy, technical feasibility, and environmental concerns, must be considered simultaneously. In this study, we apply Stochastic Multicriteria Acceptability Analysis (SMAA) for ranking the candidates to be developed into green airports. The analysis is conducted in phases with different sets of criteria. This study is the first application of MCDA for developing large-scale renewable energy production at airports. As a theoretical novelty, the pairwise winning indices of SMAA are used to form stochastic partial and complete rankings of the alternatives. Based on the results, two alternatives obtain the best and second-best rank in every model, and one alternative is always last, while the ranks of the remaining alternatives vary depending on the set of criteria.
1. Introduction
The Kingdom of Morocco is committed to meeting future challenges for sustainable development. The National Sustainable Development Strategy of Morocco lists the following seven challenges [1]:
- Consolidating the governance of sustainable development;
- Succeeding in the transition towards a green economy;
- Improving the management and development of natural resources and strengthening biodiversity conservation;
- Accelerating the implementation of the national climate change policy;
- Giving particular attention to sensitive areas;
- Promoting human development and reducing social and territorial inequalities;
- Promoting a culture of sustainable development.
During recent years, Morocco has strengthened its efforts towards sustainable development by increasing shares of renewable energy and, for example, setting up the world’s largest concentrated solar power plant of more than 2500 hectares [2]. Situated at Noor Ouarzazate, the gateway to the Sahara Desert, the whole complex provides 580 megawatts, saving the planet from over 760,000 tonnes of carbon emissions yearly. Additionally, numerous wind farms are connected to the electricity grid. Morocco has a target of sourcing 52% of its electrical energy from renewable sources by 2030, and plans to build 2000 MW of wind power and 2000 MW of solar power plants by 2025 [3]. Morocco is committed to covering 72% of their energy needs with renewable sources by 2035. Morocco is well on track to hit its target, as 35% of its energy is already renewable.
In the 2018 and 2019 Climate Change Performance Index, Morocco was ranked second after Sweden and ahead of Lithuania [4]. The score was awarded based on 14 criteria in 4 categories, including greenhouse gas (GHG) emissions, renewable energy production, energy consumption, and climate policy [5].
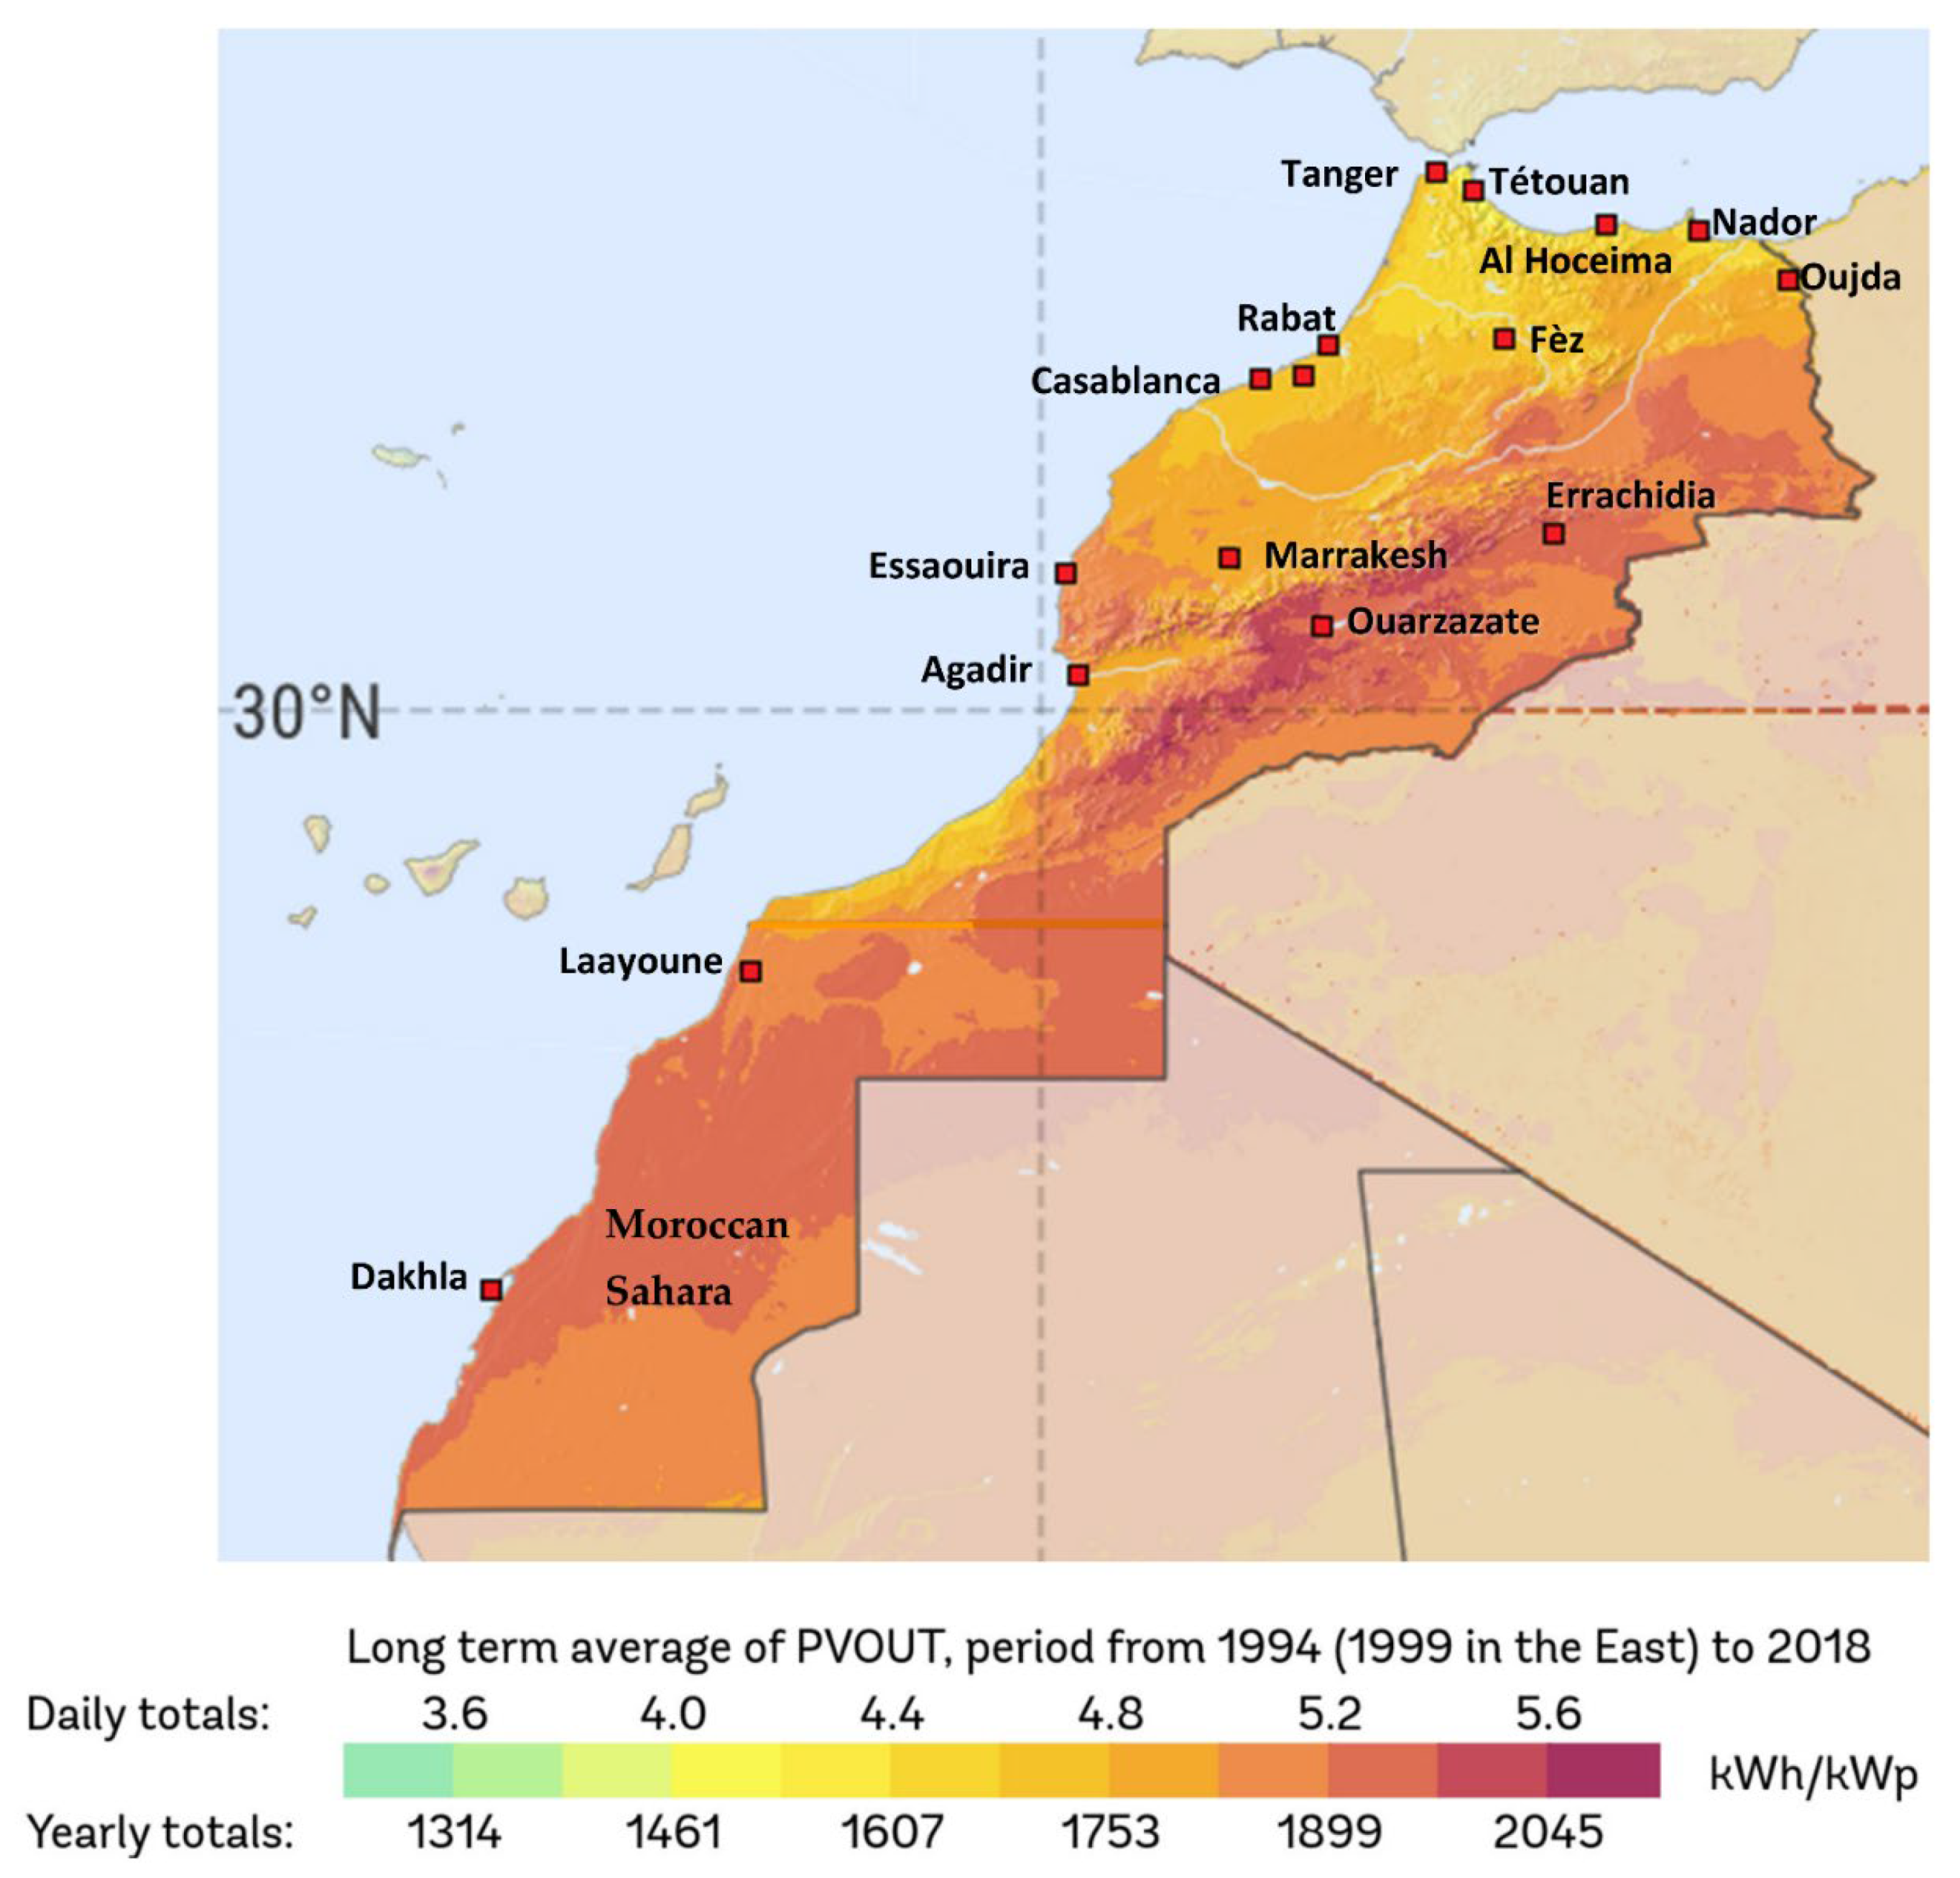
The Moroccan Airport Authority (ONDA) introduced the ‘green airports’ program in 2004, with the aim of making solar power a source of energy for airports. In 2008, the program was extended to include wind power. Starting from 2011, Moroccan airports have been supplied by three different sources of energy: solar power, wind power, and conventional electricity from the national grid. The plan is to substantially increase the solar and wind power production in the vicinity of selected airports so that they can be developed towards sustainable airports. Figure 1 illustrates the solar radiation at the airports of Morocco that are considered in this study. The different colours correspond to specific photovoltaic power outputs (PVOUTs) defined as photovoltaic energy production (kWh) per peak power (kWp). The table below the figure shows the daily and yearly totals of PVOUT.

Figure 1.
Solar atlas map of Morocco for 2020 by World Bank [6] augmented with selected Moroccan airports. PVOUT = specific photovoltaic power output. kWp = kW peak.
In general, green airports should meet several sustainability criteria. Many different criteria and criteria hierarchies for evaluating sustainable airports have been proposed in the literature [7,8,9,10]. As an example, Ferrulli [11] divides the criteria for sustainable airports into the following seven categories (with several subcriteria under each category):
- Noise abatement;
- Emission reduction and air quality;
- Energy use;
- Water use;
- Waste management and materials;
- Water pollution reduction;
- Biodiversity preservation and land use.
This study focuses on the renewable energy-related aspects of sustainable airport development in Morocco. The goal is to determine how to best increase renewable energy production near Moroccan airports. In particular, the decision problem is selecting which airports ONDA should build solar and wind power plants at and estimating how large they should be. Decision makers (DMs) of ONDA must consider, in addition to environmental impacts, other factors such as commercial and financial advantages, technical feasibility, local potential for renewable energy production, and various political factors. This leads into a multicriteria decision aiding (MCDA) problem, where the goal is to identify the most suitable locations and to rank the airports based on suitability.
Some past applications of MCDA methods for sustainable airport-related studies exist. Lee et al. [12] applied the DEMATEL method with the Analytic Network Process for selecting green airport fleet management. Kumar et al. [13] applied the VIKOR multicriteria method for evaluating five Indian airports on several sustainability criteria. Wu and Qi [14] applied the cross-efficiency model of DEA (Data Envelopment Analysis) to evaluate the economic and ecological impacts of subsidies for small- and medium-sized airports in China. Kucukvar et al. [15] benchmarked the sustainability performance of 30 major airports worldwide using DEA. Kaya and Erginel [16] applied the fuzzy SWARA (Stepwise Weight Assessment Ratio Analysis) multicriteria method for the sustainable development of Esenboga airport in Turkey. Nikoloudis et al. [17] applied a blend of three types of multicriteria approaches, the additive value function, Promethee II, and Electre III to compare five different investment proposals for the sustainable development of Athens’ Hellinikon airport area. Broniewicz and Ogrodnik [18] evaluated MCDA methods applied in the field of sustainable transport. None of the earlier MCDA applications have focused on developing renewable energy production at airports.
MCDA methods have also been applied more widely on regional renewable energy analyses. For example, Pinto et al. [19] applied Stochastic Multicriteria Acceptability Analysis (SMAA) for comparing carbon-neutral district-heating technologies in Torino, Italy. Bandaru et al. [20] developed a multicriteria framework to evaluate the feasibility of solar energy projects. Vagiona [21] compared four MCDA methods (AHP, TOPSIS, VIKOR, PROMETHEE II) for ranking solar farm locations in Greece. Tsagkari et al. [22] proposed a comprehensive multicriteria framework to assess local energy sustainability indicators with two islands as cases. Alhammad et al. [23] applied a combination of GIS and AHP to determine the suitability of different areas for solar power in Saudi Arabia.
The novelty of this study is that it is the first application of MCDA for developing large-scale renewable energy production at airports. In this study, we apply the SMAA method [24]. As a theoretical novelty, SMAA is extended within this study to form stochastic partial and complete ranking for alternatives.
The choice of the MCDA method for an application is critical because different methods may give different solutions to the problem [21,25,26,27]. Most important is that the MCDA method suits the characteristics of the decision problem in terms of the problem setting, decision model, data needs, and interaction characteristics. Cinelli et al. [28] have developed a comprehensive taxonomy and expert system for recommending MCDA methods for particular problems based on 156 characteristics. At the time of writing, their system covers 205 different methods.
The SMAA method is chosen for this application because it supports the flexible modelling of different kinds of inaccurate, uncertain, imprecise, or partially missing information through probability distribution. More importantly, SMAA can be used even without a priori preference information, which was not available in this study. For the accuracy of the SMAA method, see Tervonen and Lahdelma [29]. The development of SMAA was originally conducted during several real-life environmental and public decision processes. SMAA has been widely applied for various governmental, social, political, healthcare, business, financial management, and environmental decision problems. SMAA has also been applied successfully for centralizing cargo at an airport hub in Morocco [30]. For other real-life applications of SMAA, see the surveys by Tervonen and Figueira [31], Lahdelma and Salminen [32], and Pelissari et al. [33]. Pelissari et al. analyse a total of 118 SMAA articles within the years 1998 to 2017.
This paper is organized as follows. Section 2 briefly describes the SMAA multicriteria decision analysis method and develops a new methodology for ranking based on pairwise winning indices. Section 3 defines the decision problem. Section 4 presents the multicriteria analysis results. Section 5 contains the discussion, and Section 6 outlines the conclusions.
2. SMAA—Multicriteria Analysis Method
Stochastic Multicriteria Acceptability Analysis (SMAA) is a family of decision support methods for evaluating different alternatives in terms of multiple non-commensurate criteria. Here, we consider the basic variant of SMAA, which is based on a utility or value function [34], [24]. SMAA can be used in different problem settings: for identifying the best alternative(s), for ranking the alternatives, or for classifying the alternatives into predefined ordered categories. Here, we consider the problem setting of identifying the best alternatives or ranking the alternatives. As a theoretical novelty, we introduce methods for producing partial and complete rankings of the alternatives based on transitive and intransitive pairwise winning index relations in Section 2.2.
2.1. Basic SMAA Method
The alternatives and their criteria measurements form a matrix [xij], where i is the index for the alternative and j is the index for the criterion. A real-valued utility or value function u(xi,w) combines criteria measurements with decision makers’ (DMs’) subjective weights wj to compute an overall utility value ui describing how good alternative i is. Commonly, the utility function is scaled so that the best (ideal) value is 1 and the worst value is 0. The additive utility function is often used, but in principle any shape is possible [35]. The additive utility/value function computes the overall utility as a weighted average of the partial utilities of alternatives:
ui = u(xi,w) = ∑j wj uj(xij).
Here, the partial utility functions uj(xij) map the criteria measurements to the interval [0, 1], where 1 is the best value. The weights are normalized so that they are non-negative, and their sum is 1. This means that the set of feasible weights is defined as
W = {w|wj ≥ 0 and ∑j wj = 1}.
SMAA has been developed for problems where criteria measurements and weights can be imprecise or uncertain. Uncertain data are treated with Monte Carlo simulation in SMAA. Uncertain criteria measurements are represented by stochastic variables [xij] with joint density function fX(x). Similarly, imprecisely known weights are represented by a weight distribution with joint density function fW(w).
In SMAA, ordinal criteria where only a ranking of the alternatives from best = 1 to worst rank is provided are treated by simulating different consistent mappings between ordinal criteria information and the corresponding cardinal values. For example, if alternative A is better than B, which is better than C with respect some criterion j, SMAA assigns them partial utilities uA,j = 1, uC,j = 0, and randomly generated uB,j ∈ (0, 1) following a uniform distribution. See [29,36] for details.
SMAA computes various descriptive measures for the alternatives. Principal SMAA measures are:
- The acceptability indexai. This describes how widely an alternative can be accepted as being best (most preferred). It is computed as the share of different (stochastic) weights that make the alternative xi most preferred. In the group decision making context, we can think of the applied weight distribution to represent the preferences of different DMs (and possible other stakeholders). With this interpretation, the acceptability index can be interpreted as the share of DMs that prefer alternative xi. Inefficient alternatives are never most preferred, which is indicated by the zero acceptability index;
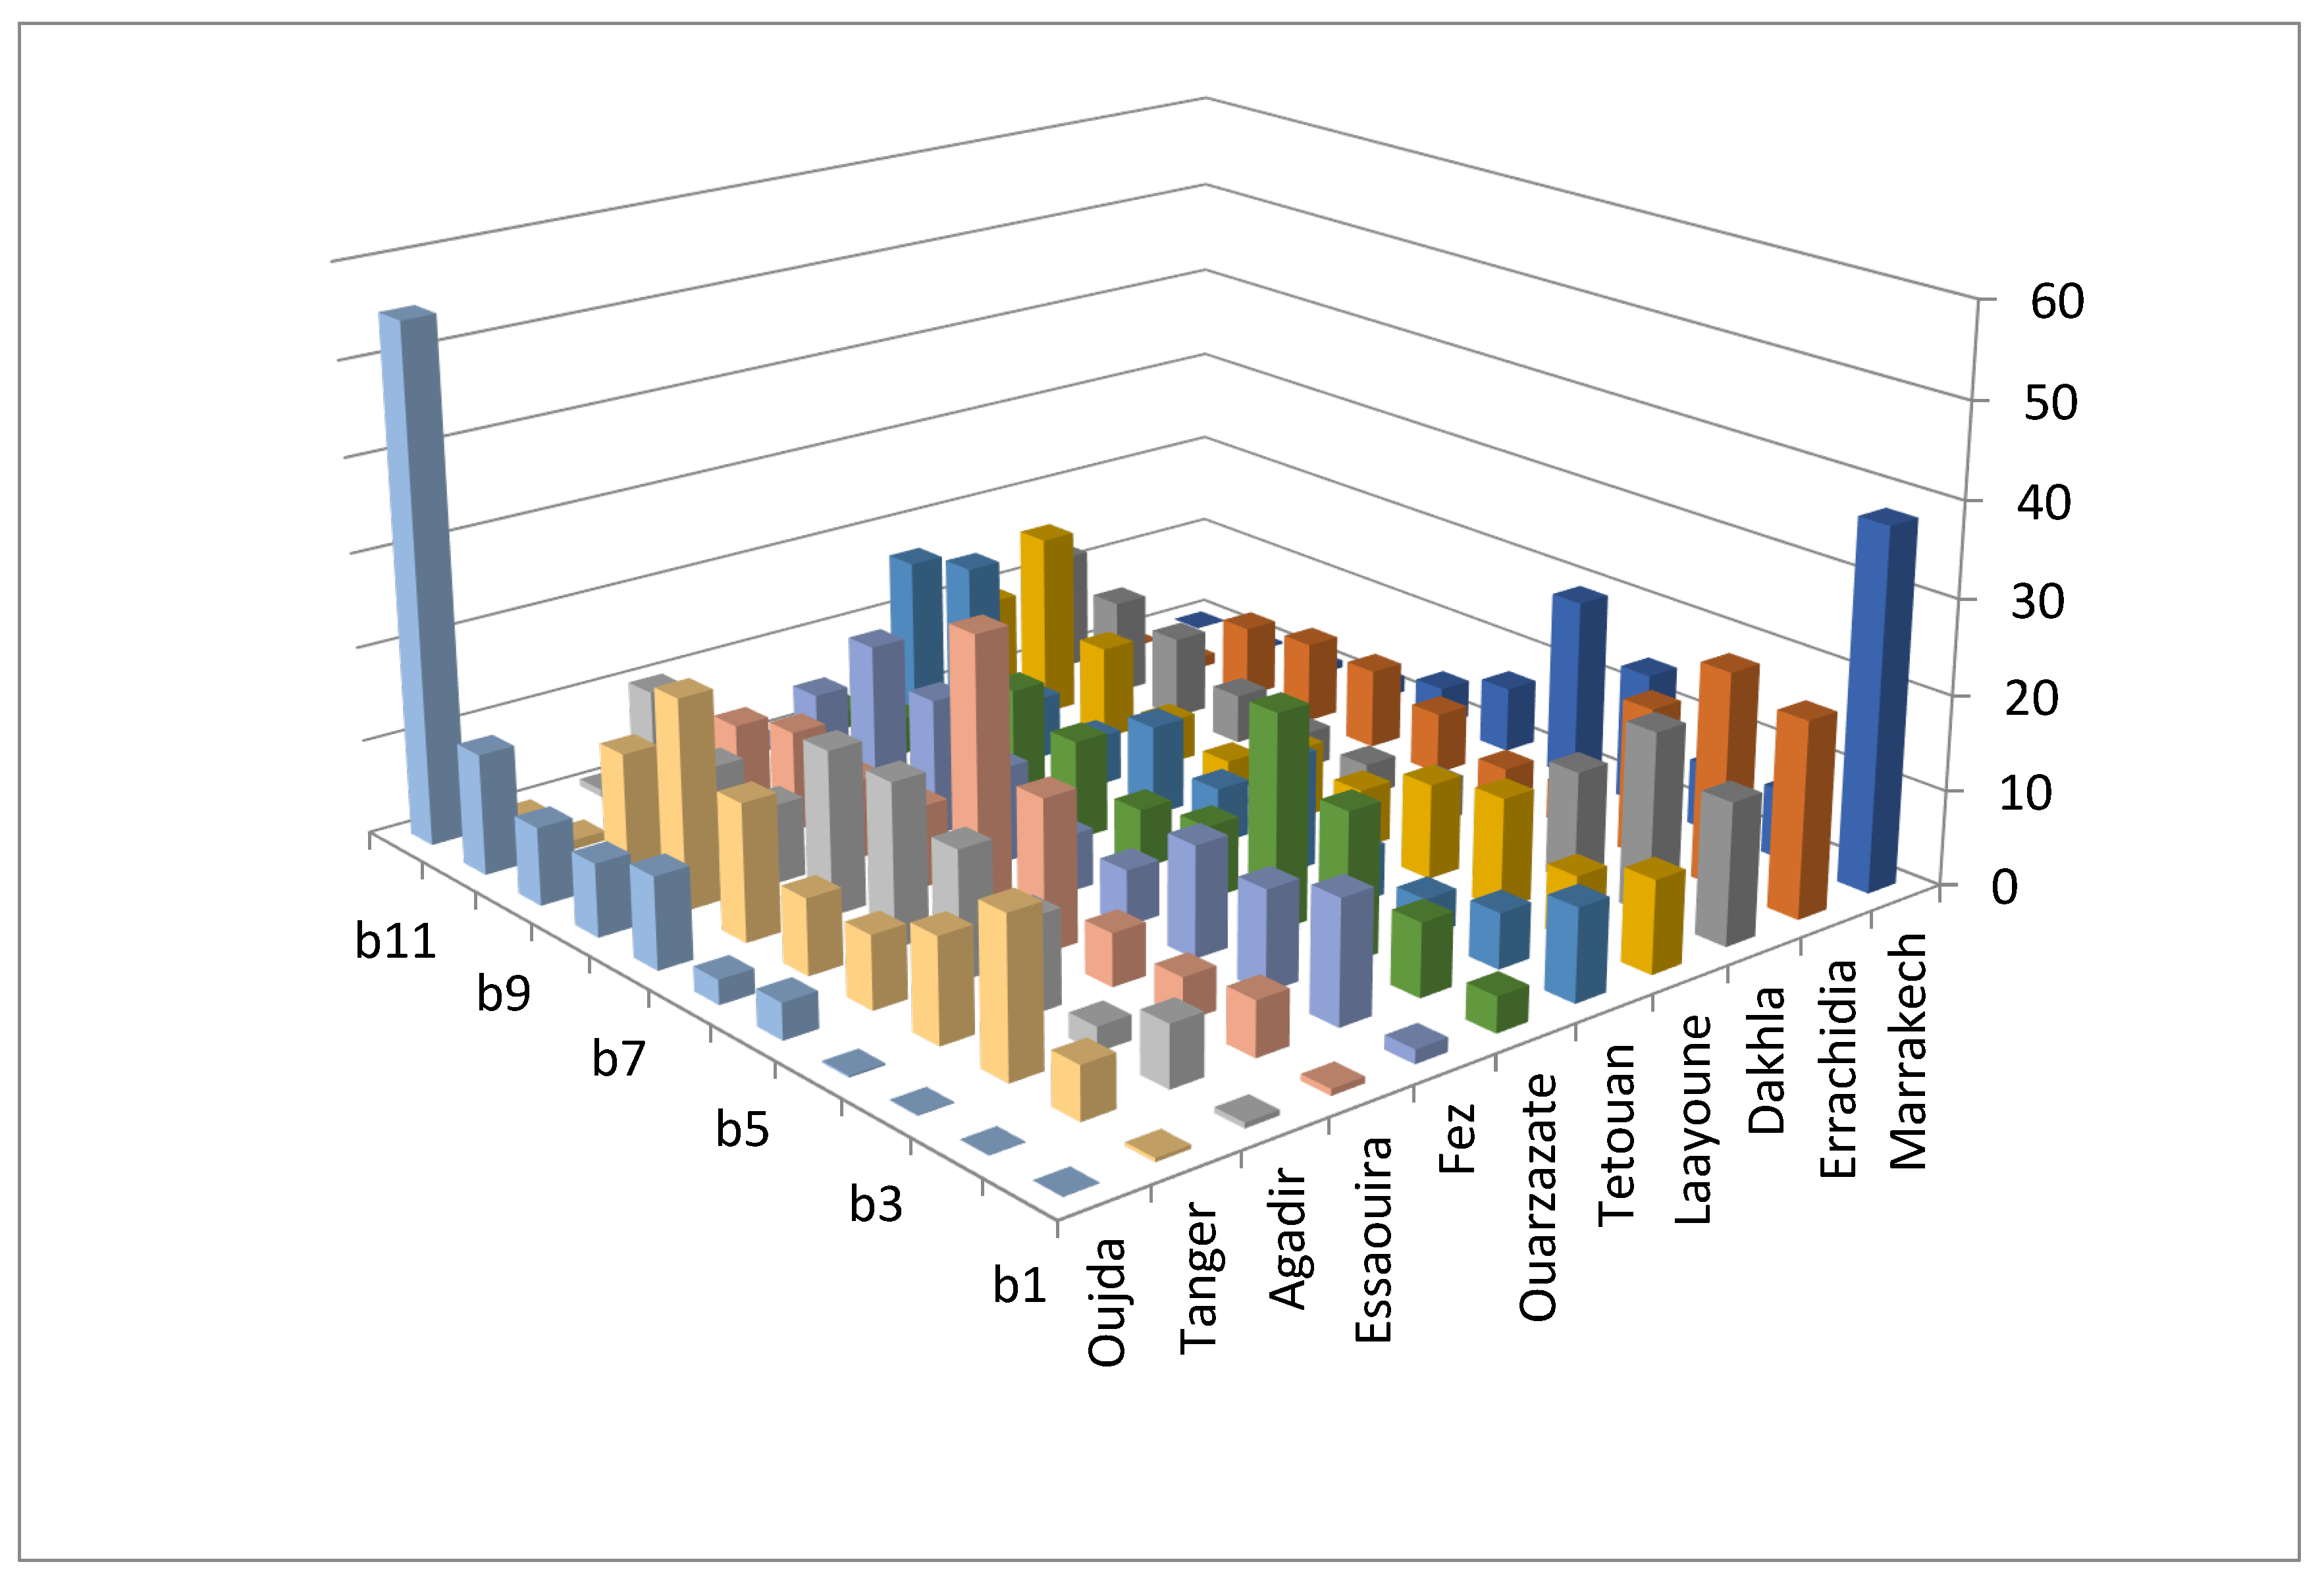
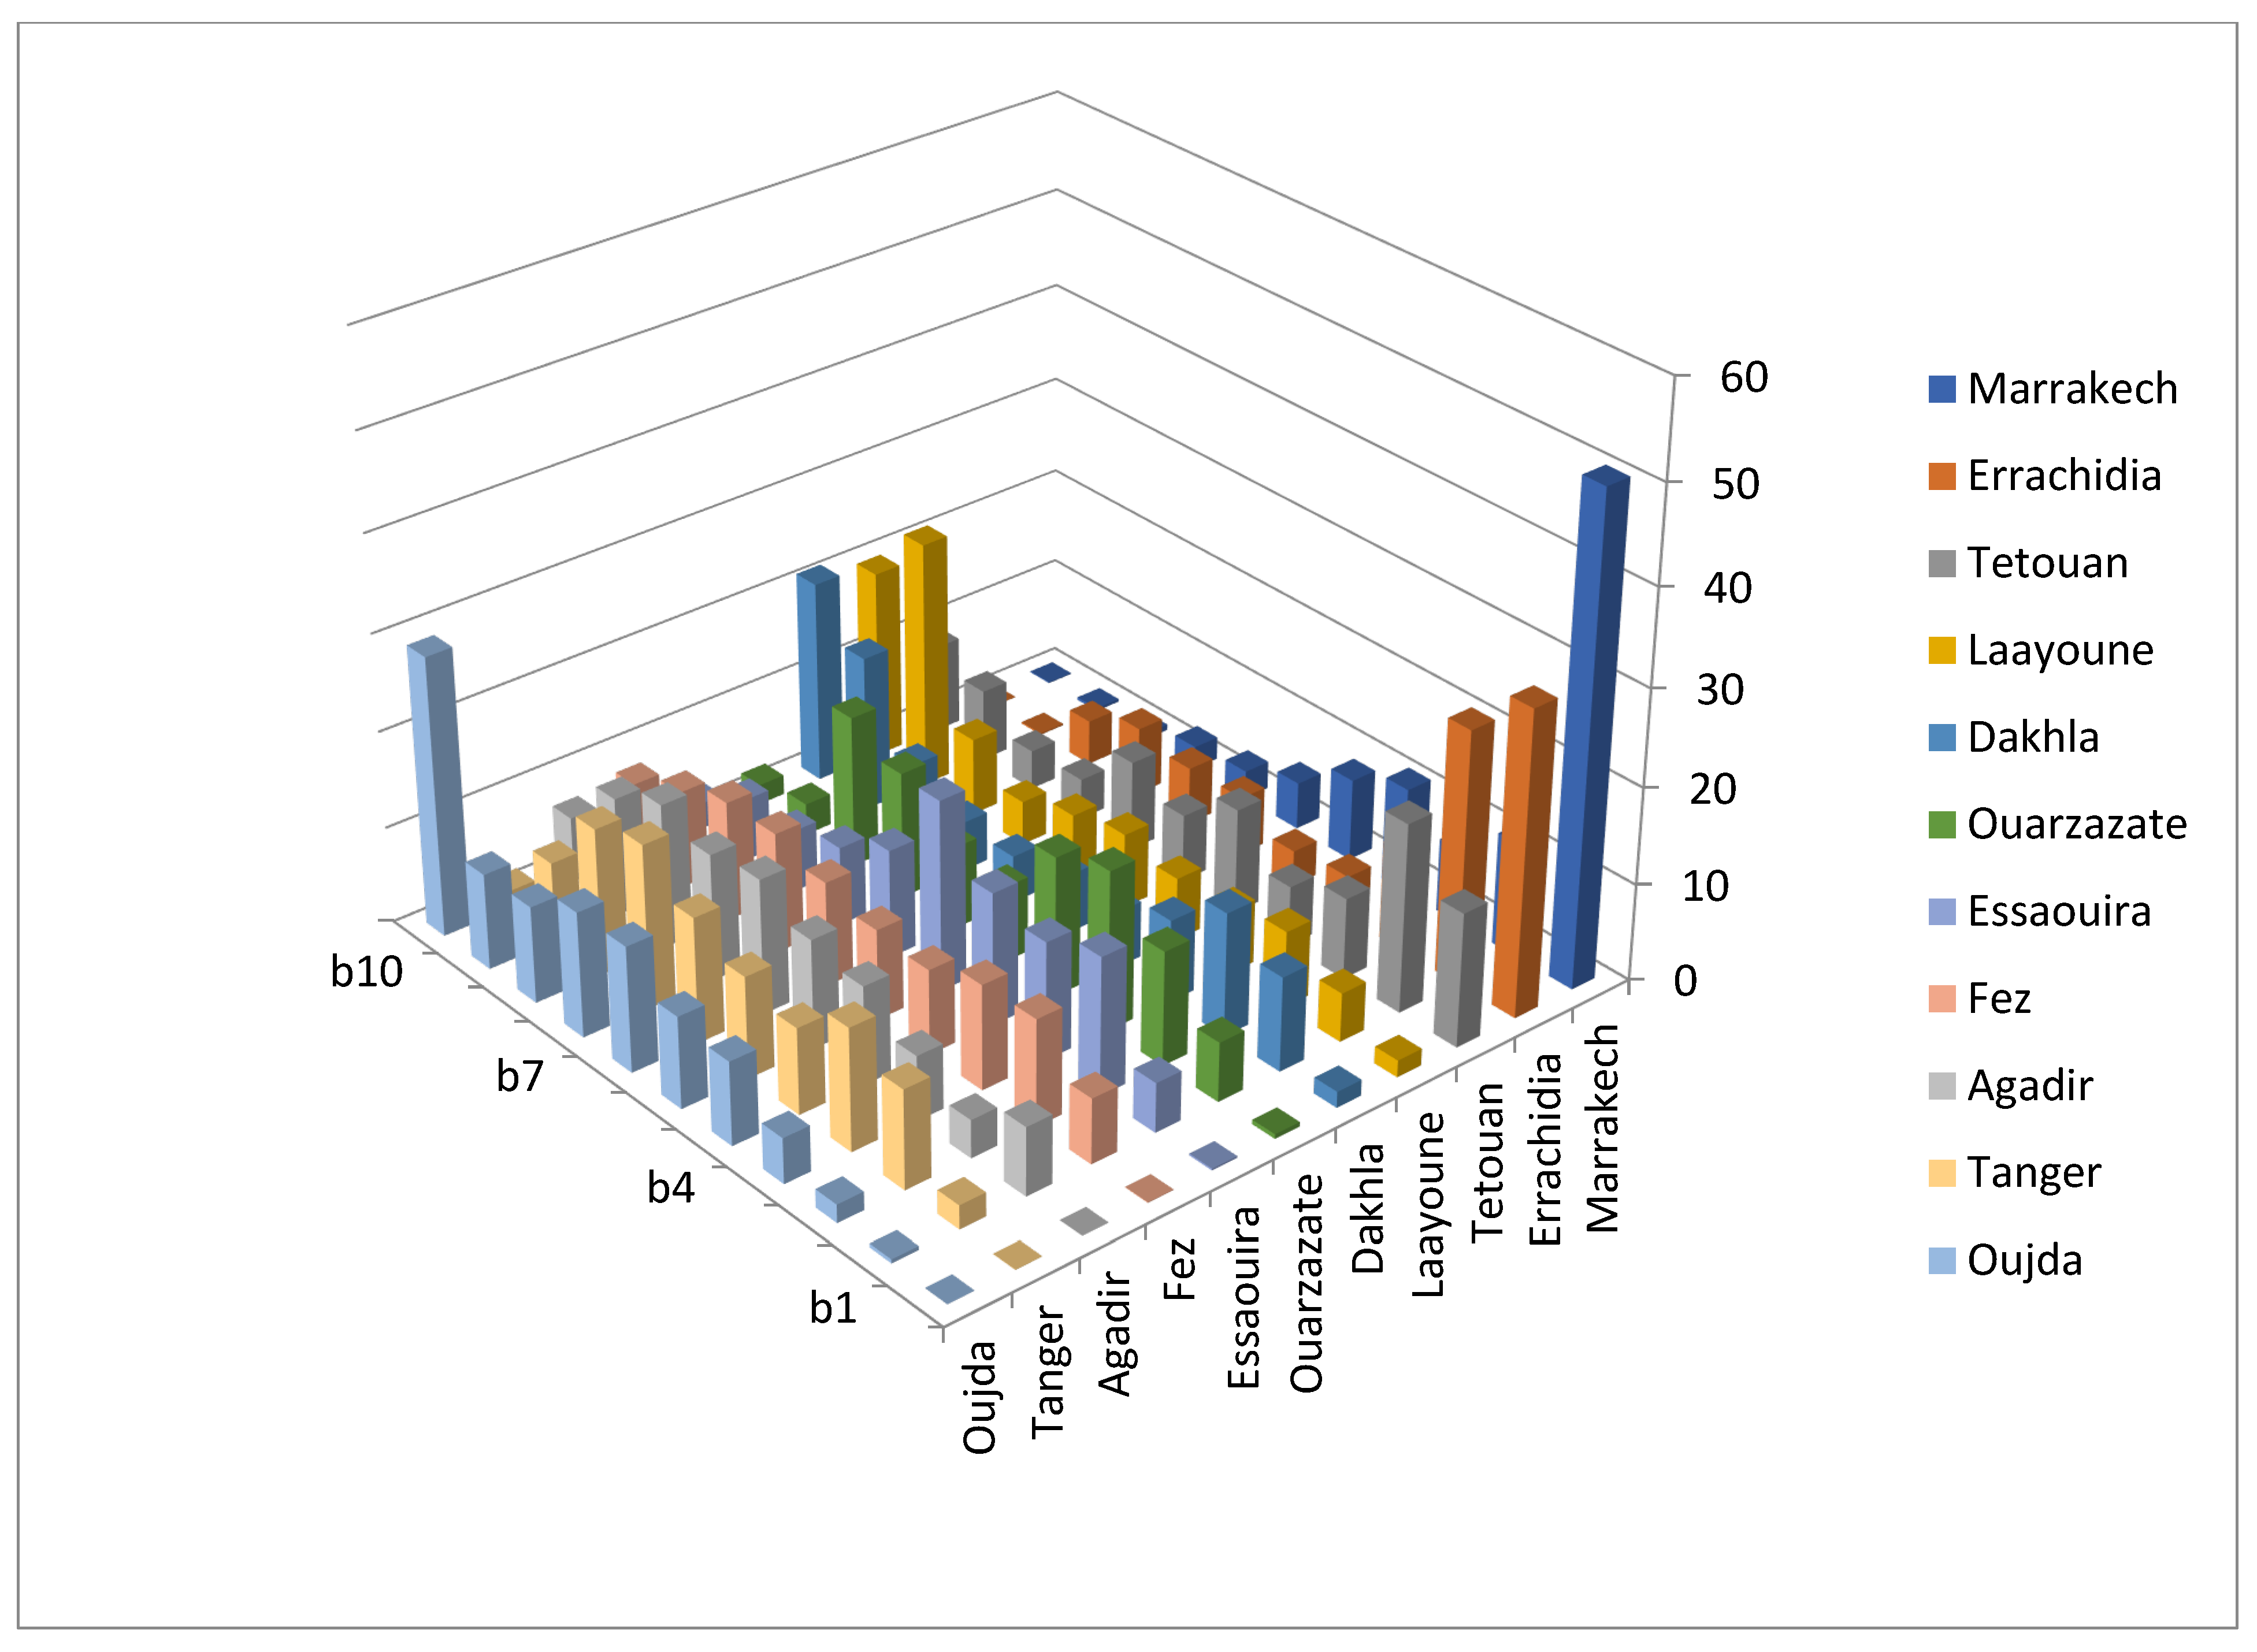
- The rank acceptability index . This is a generalization of the acceptability index for each rank r ∈ {1, …, m}. It describes how widely an alternative obtains rank r. Obviously, = ai. Rank acceptability indices are useful for a more holistic evaluation of all alternatives. In particular, in the problem setting of finding one or a few best alternatives, often no alternatives are clearly superior in terms of the (first rank) acceptability index. In these cases, it makes sense to study the entire rank acceptability profile of each alternative. Good compromise alternatives are those receiving high rank acceptability indices for the top ranks and low indices for the worst ranks. A good way to visualize the rank acceptability indices is to draw them as a 3-dimensional column chart where alternatives (xi) are on one axis, the ranks (r) are on the other axis, and the height of the column is ;
- The pairwise winning indexcik. This describes how widely, considering the stochastic weight distribution, one alternative is better than another. Technically, the pairwise winning index is the probability that alternative i is better than k. Because the pairwise winning index is computed entirely based on the two alternatives, it is not subject to the rank reversal problem. This means that adding or removing other alternatives or changing criteria measurements of other alternatives does not affect the pairwise winning index. The pairwise winning indices can also be used to form a stochastic ranking of the alternatives. This will be described in more detail in Section 2.2;
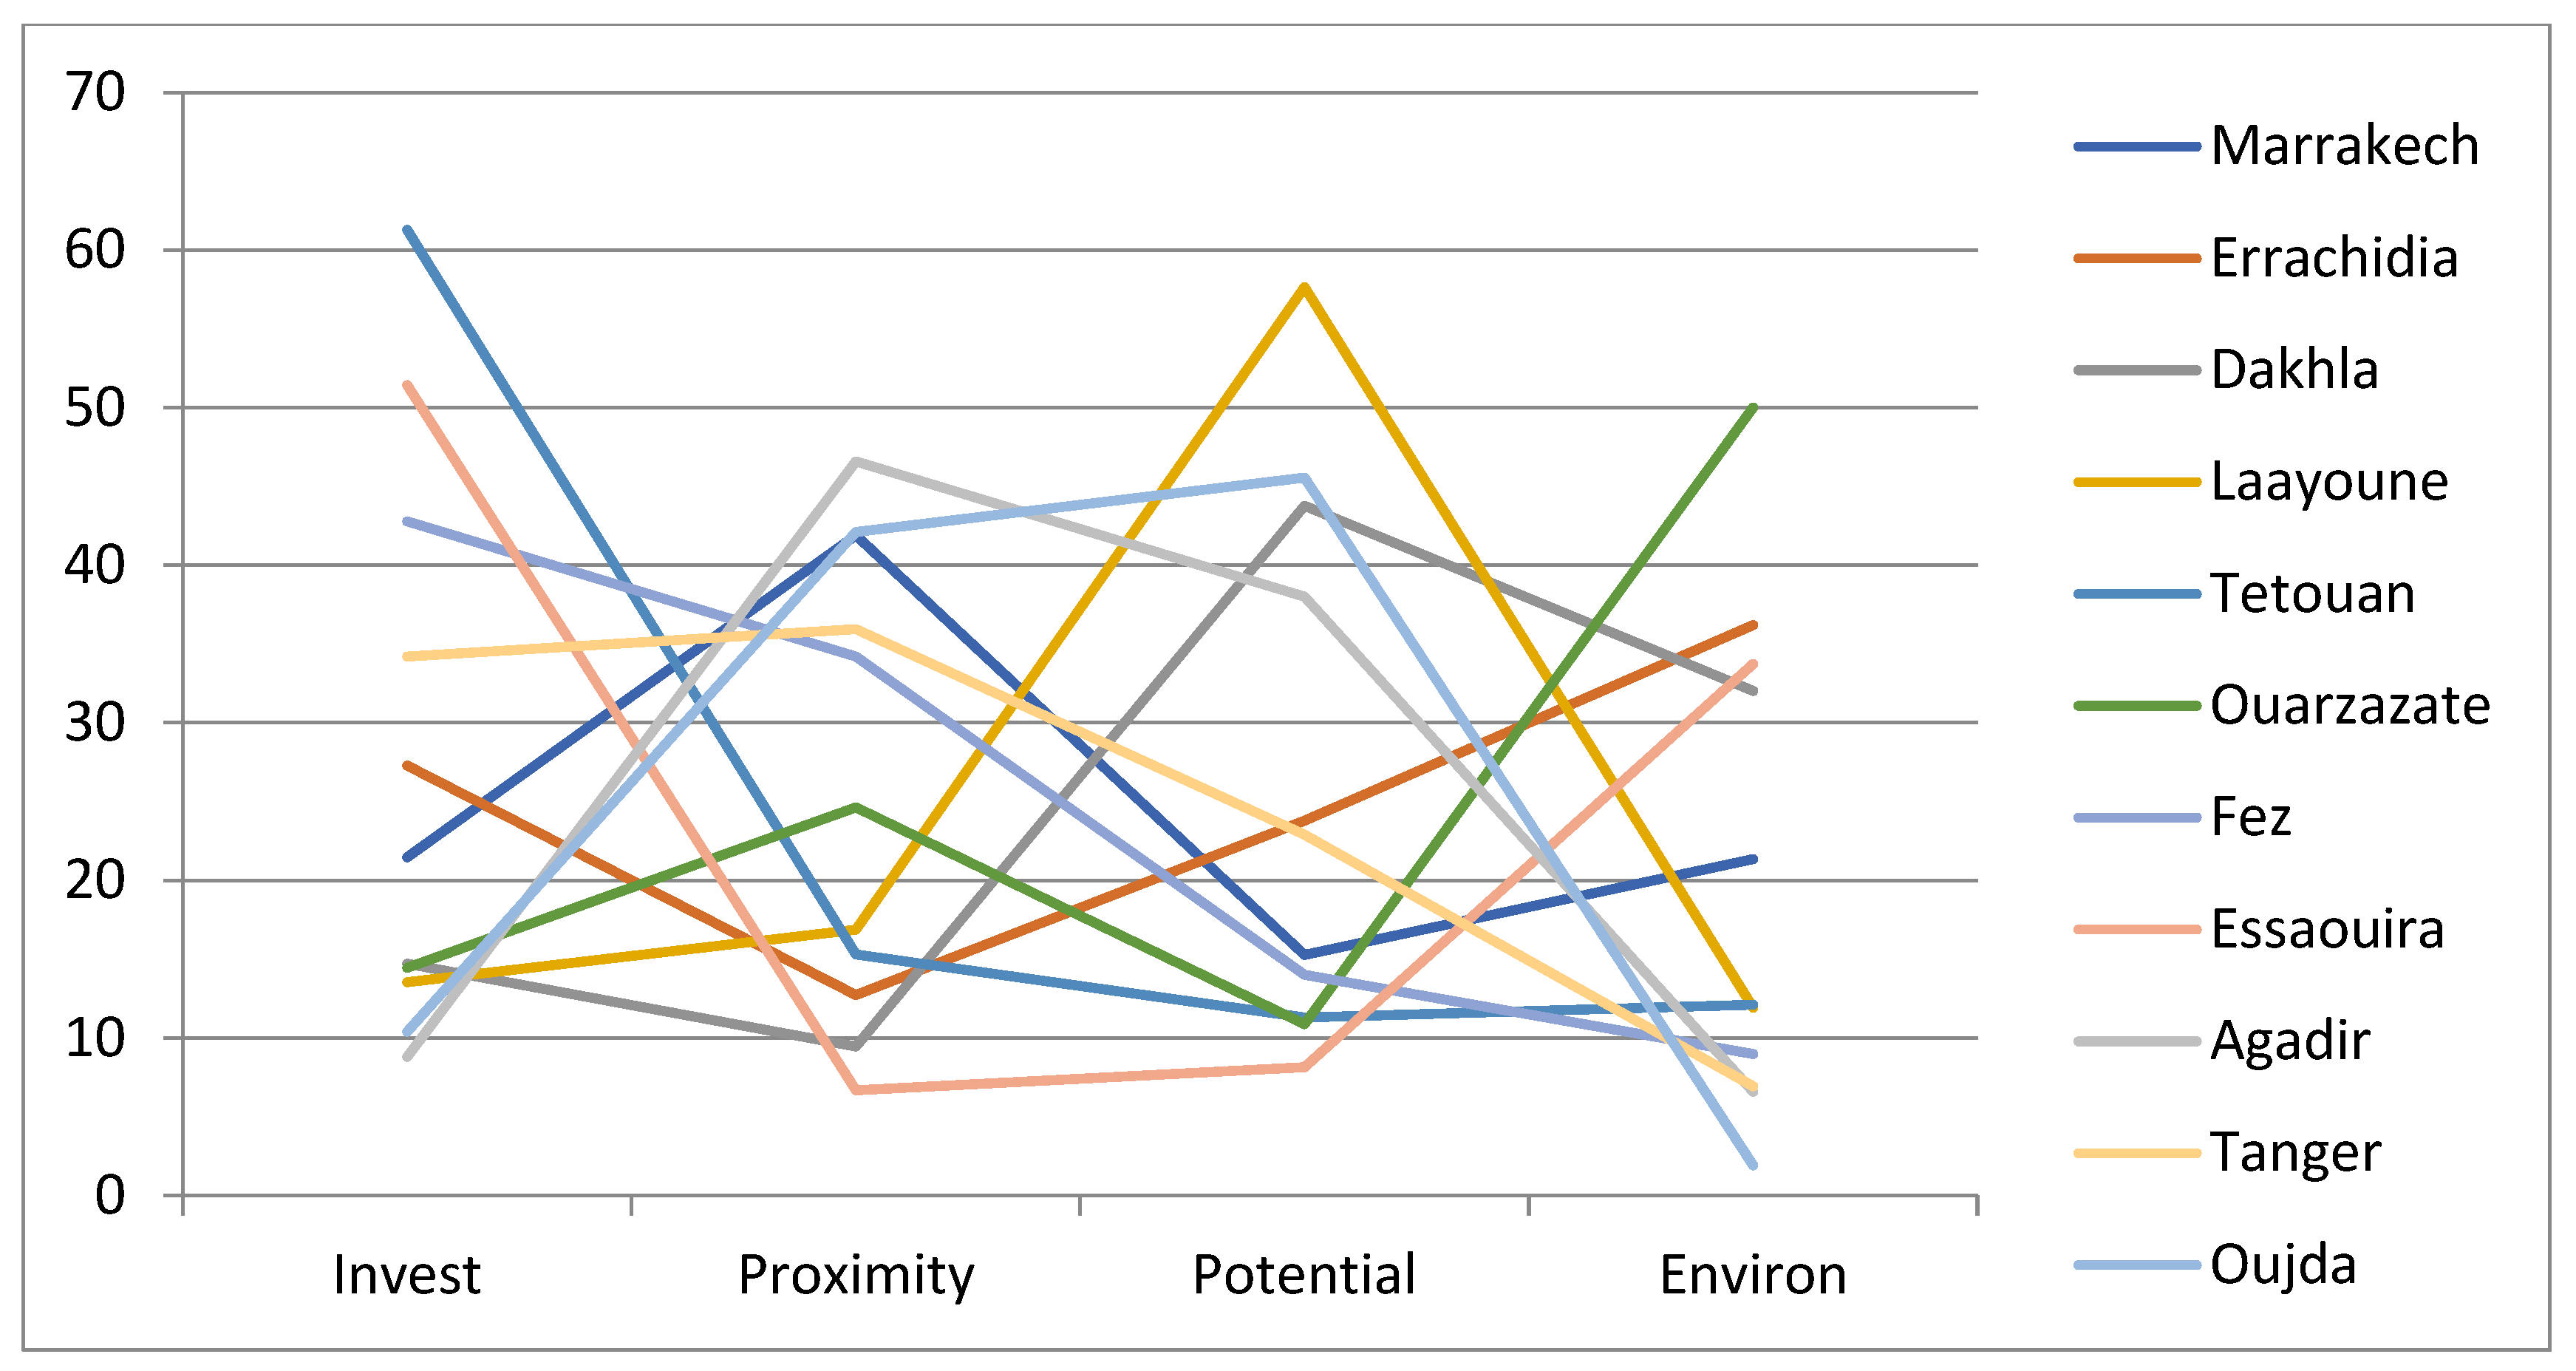
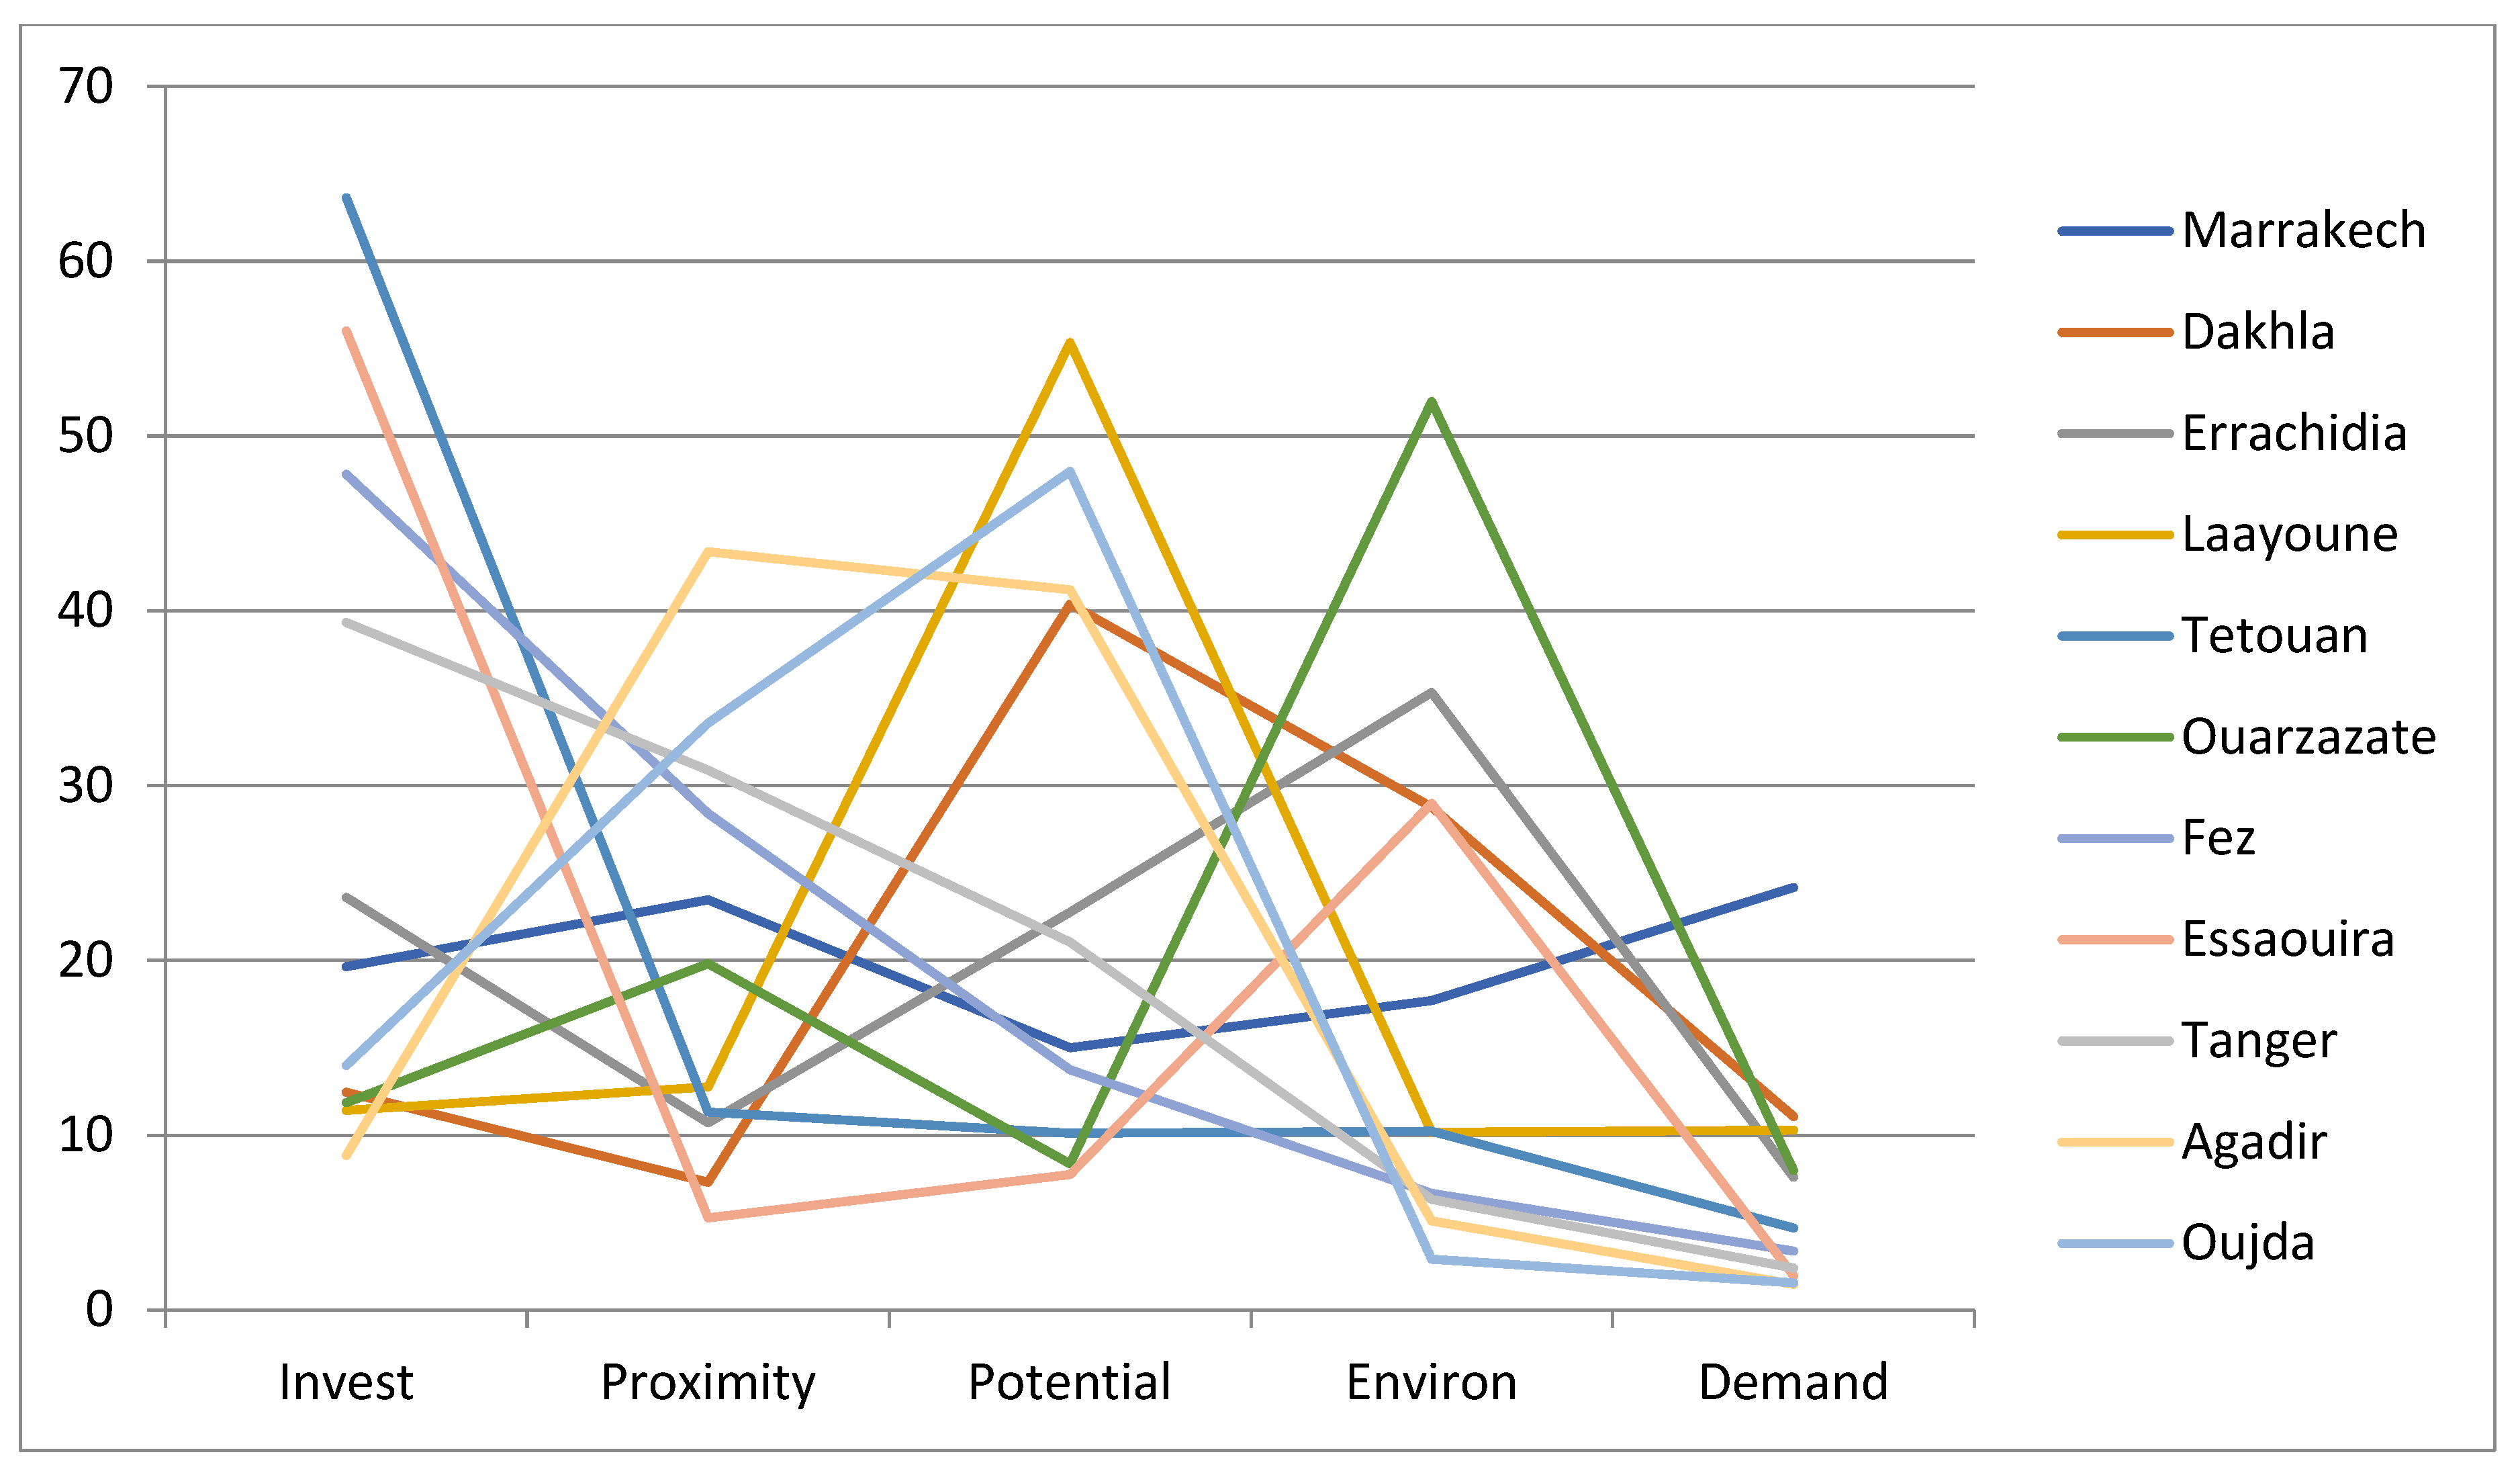
- The central weight vector . This describes what kinds of weights are favourable for the alternative xi, i.e., to make it the most preferable. The central weights can be presented to the DMs in order to help them understand how different weights correspond to different choices. The central weights are undefined for inefficient alternatives. Central weights can be visualized, e.g., by a two-dimensional line chart where alternatives are represented by lines of different colours, the horizontal axis contains the criteria, and the vertical axis contains the weights;
- The confidence factor . This is the probability that an alternative is the most preferred if its central weight vector is selected. The confidence factors measure if the criteria measurements are accurate enough to discern the alternatives reliably. A low confidence factor together with a low acceptability index indicates that an alternative is unlikely the most preferred and can be eliminated when seeking one best alternative.
Good approximations for all SMAA measures can be computed efficiently using Monte Carlo simulation. At each simulation round, criteria measurements and weights are generated randomly from their corresponding distributions. In each simulation round, alternatives are ranked based on their overall utilities and statistics about the performances of the alternatives are collected. Typically, the number of rounds K = 10,000–100,000 (see [29] for details).
SMAA can be used with absent preference information. Absent weight information is represented by a uniform distribution in the full weight space W defined in (2). This means that any weight vector w ∈ W is considered equally probable. When preference information is available, it can be considered in SMAA quite flexibly. It is, for example, possible to introduce upper and lower bounds for individual weights (wj ∈ []) or for weight ratios (wj/wk ∈ []). It is also possible to specify an importance order for the criteria by introducing inequality constraints between pairs of weights (wj ≥ wk). Different kinds of preference information can be easily considered during the Monte Carlo simulation by rejecting weights that do not satisfy the constraints.
2.2. Ranking Based on Pairwise Winning Indices
For a pair of alternatives, A and B, the pairwise winning index cAB is the probability for A to be more preferred than B. Here, we introduce methods for ranking based on the pairwise winning indices. Let us first study some properties of the pairwise winning index. The pairwise winning index has the convenient property that it only depends on the two alternatives, not on any other alternatives. This means that the so-called ‘rank reversal’ of a pair of alternatives cannot happen due to changes in the criteria measurements of other alternatives, or due to adding or removing alternatives to the problem.
When the pairwise winning index is computed through Monte Carlo simulation, in each simulation round, one of the following three cases happens: uA > uB, uA < uB, or uA = uB. In the first two cases, the respective counters CAB or CBA are incremented. Thus,
while the number of shared ranks during the simulation is K-CAB-CBA. We note that shared ranks are rare with real-valued utility/value functions and continuous distributions for criteria measurements and weights. Considering half of the shared ranks as wins for each alternative, the pairwise winning indices are estimated by
CAB + CBA ≤ K
cAB = CAB/K + (K − CAB + CBA)/2K
With this definition, the pairwise winning index satisfies
cAB ∈ [0, 1] and cAB + cBA = 1.
The pairwise winning index cAB can be interpreted as a measure of the strength of the preference for A over B on a scale where 100% means total preference for A over B, 50% denotes equal preference, and 0% means total preference for B over A. If cAB > 50%, we say that A is (statistically) preferred to B [37]. We define cAB ≥ 50% as weak preference A ≽ B. The weak preference relation is complete, i.e., for each (A, B), either A ≽ B, B ≽ A, or both (in case of equal preference). Equal preference is rare in problems with continuous distributions for criteria measurements and weights.
Next, we consider ranking the alternatives based on the pairwise winning indices. If the weak preference relation defined by the pairwise winning indices is transitive, then it is easy to form a complete ranking (A ≻ B ≻ C…) of the alternatives using Kahn’s topological sorting algorithm [38]. We note that in past applications of the pairwise winning indices, the preference relation has been transitive.
However, the weak preference relation is not necessarily transitive. The different rankings simulated in the SMAA calculations can be interpreted as votes in a ranked voting electoral system. This means that ranking based on the pairwise winning indices is subject to the Condorcet paradox, implying that the preference relation defined by the pairwise winning indices may be intransitive [39]. This means that a set of three or more alternatives may be preferred cyclically, in a non-transitive manner. A simple example leading to this is when a 1/3 share of DMs support each of the rankings (A, B, C), (B, C, A) and (C, A, B). Then, cAB = cBC = cCA = 2/3 and cBA = cCB = cAC = 1/3. Another source for cyclic preferences is (the rare) equal preference between pairs of alternatives. If cAB = cBA, then A ≽ B, and B ≽ A forms a cycle between the two.
When the weak preference relation is intransitive, a straight-forward approach lets each cyclically dependent subset of two or more alternatives share the same rank. For example, if (A, B, C) are preferred to each other in a cyclic manner, we define (A ≈ B ≈ C). Such cyclically dependent subsets of alternatives are called strong components of the preference relation. Cyclically dependent subsets of alternatives can be identified by computing the transitive closure of the preference relation. See Nuutila [40] for several algorithms for transitive closure computation. Replacing each cyclically dependent set of alternatives by single nodes in the weak preference relation results in the condensation graph of the original relation. The condensation graph is complete and transitive. The topological sorting algorithm can then be applied on the condensation graph. This leads into a partial ranking with shared ranks for cyclically dependent subsets of alternatives and unique ranks for other alternatives.
Many different methods for producing a complete ranking in ranked voting systems have been proposed. However, every method fails to satisfy some of many intuitively meaningful criteria for voting systems. Here, we suggest using the Ranked Pairs or Tideman method [41], because it is easy to implement and satisfies many criteria that are relevant in the scope of MCDA. See [42] for the comparison of several ranked voting methods.
The Ranked Pairs method resolves cycles based on the strengths of the pairwise preferences. The ranking is formed by considering pairwise preference relations in strength order starting from the strongest preference (largest cij). If the next preference relation cAB forms a cycle (conflict) with the already considered relations, it is rejected; otherwise, the two alternatives are ordered (A ≻ B) according to the pairwise relation. This means that the cycles are broken at the weakest preference relations. One theoretical problem with this approach is that if a case has equally strong preference relations, one of them must be chosen arbitrarily, and this choice may affect the resulting ranking. However, such ties are again rare with real-valued utility/value functions and continuous distributions for criteria measurements and weights.
2.3. Implementations of SMAA
Several non-commercial implementations of SMAA exist. The analyses of this study were performed by our own research implementation in C++ and the results were visualised with an MS Excel spreadsheet. The results can also be replicated using JSMAA, which is an open-source implementation (GPL3) of SMAA [43]. To compute pairwise winning indices with JSMAA, it is necessary to analyse each pair of alternatives separately.
3. Problem Description
Energy consumption at airports can be divided into electricity and various fuels. Various fuels can be used at airports for heating and service traffic. The energy efficiency of European airports is typically in the range of 4–18 kWh/PAX (PAX = passengers per year). In warm climates, such as Morocco, electricity is clearly the largest component of energy consumption. The main cause of electricity consumption is cooling. The share of electricity consumption is about 90%. [44]
Table 1 presents data on 15 important airports in relation to the development targets for renewable energy production: PAX, the annual electric power demand of the airport, the energy performance index (EPI), annual solar radiation, and average wind speed. Based on PAX, we can see that the size of the airports varies a lot. Correspondingly, electric power demand also varies a lot. The EPI is computed here as a ratio between electric power demand and PAX. The EPI ratios are rather low in comparison to many international airports [45]. Solar radiation and wind speed are quite high in most parts of Morocco. This indicates high theoretical potential for solar power and wind power.

Table 1.
Statistical data on selected airports in Morocco. Solar radiation and wind speed measurement originate from the World Bank Group Solar Atlas [6] and World Bank Group Wind Atlas [46].
4. Multicriteria Analysis
The multicriteria analysis was performed in several phases. First, a preliminary analysis was performed to eliminate clearly non-promising locations and thus to reduce the problem size. Then, the SMAA method was used to analyse the problem in terms of different sets of criteria.
4.1. Preliminary Analysis
For each site, the preliminary analysis considered the practical potential for renewable energy production, the connectivity between solar and wind production sites and the airport, and the connectivity of the airport with the national power grid.
Practical potential for solar and wind power production is important to make investments in renewable energy cost-efficient. Practical potential depends not only on the average solar radiation and wind speed, but also on other local conditions, such as terrain roughness, orography, and ruggedness. Additionally, soft constraints, such as areas that are unavailable due to regulations and existing land use, were considered. The good connectivity of local power production sites allows the efficient transmission of power to the airport. Strong connection with the national power grid is essential because the production of solar and wind farms is highly intermittent, and non-coincident with the consumption at the airport. Thus, the grid is needed for balancing production with consumption by two-way power transfer. Table 2 lists the airports and how promising they are in terms of the preliminary evaluation criteria. Four airports were eliminated from further analysis based on weak performance (zero or one “X”) on solar and wind production site connectivity. The remaining 11 airports in bold were selected for further analysis.
Table 2.
Preliminary analysis of locations for renewable energy. Alternatives selected for further multicriteria analysis appear in bold.
4.2. First SMAA Model
The initial multicriteria model for 11 alternatives was formulated in terms of the following four criteria:
- Investment cost reflects the cost per MW for wind and solar plants at each respective location; this also includes the land cost, which is higher near larger cities. Investment costs are represented here as dimensionless numbers on a 100-point scale, where 100 is worst and corresponds to the highest costs. Investment costs were evaluated by the Regional Investment Centre of Morocco, which is a public governmental organization;
- Proximity of the production sites to the grid. This criterion measures how well the grid can respond to the transfer needs of renewable power at the location. Proximity was evaluated by a group of ONDA experts on an ordinal scale, i.e., the experts placed the alternatives on different rank levels from the best (1) to the worst (7);
- Potential to market the renewable energy. Potential is related to the zone of economic influence of the airport. Potential is represented here by dimensionless numbers on a 1000-point scale, where 1000 is best and 0 is the worst. Potential was evaluated by the Regional Investment Centre of Morocco;
- Environmental impacts at different locations. Aircraft noise and pollution are typical environmental impacts in air transport. Renewable energy production does not affect the noise and pollution. However, these impacts must still be assessed because it is difficult to develop an airport into a sustainable airport if the noise and pollution levels are high. A group of ONDA experts evaluated the environmental impacts of the alternatives on an ordinal scale in consensus after deliberation. As a result, the experts placed the alternatives on different rank levels from the best (1) to the worst (4).
Table 3 presents the criteria measurements for the initial SMAA model and also for two subsequent models. The measurement of the cardinal Invest and Potential criteria were uncertain, as indicated on the last row of the table. The uncertain criteria were represented in SMAA by uniform distributions around the presented expected values. The ordinal criteria of Proximity and Environ were treated in SMAA by simulating different consistent cardinal-to-ordinal mappings.
Table 3.
Criteria measurements for the alternatives in the three analyses. Different subsets of criteria were used in the first, second, and third analysis. Elec = yearly electricity consumption (MWh). EPI = energy performance index (kWh/PAX).
The problem was analysed using SMAA with absent preference information. Figure 2 presents the rank acceptability indices () for the different alternatives. The horizontal axes contain the ranks (b1, …, b11) and the alternatives. To make the figure more readable, the alternatives are sorted by the first rank acceptability index . Figure 3 shows the central weights supporting each alternative. To interpret the central weight diagram, it is meaningful to focus on extremely high or low weights.
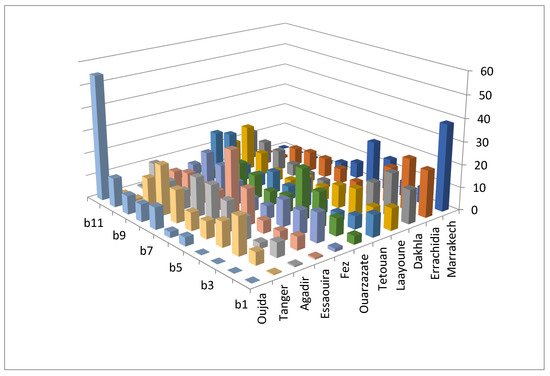
Figure 2.
Rank acceptability indices for alternatives based on 4 criteria.
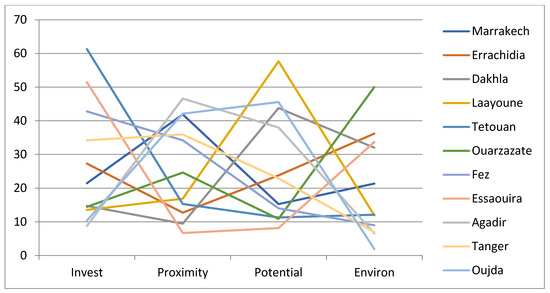
Figure 3.
Central weights for alternatives sorted according to their acceptability indices.
Marrakech received the highest acceptability (38%) for the first rank. This means that without knowledge about the mutual importance between criteria, the largest variety of different possible preferences (weights) makes Marrakech the most preferred alternative. Additionally, Errachidia, followed by Dakhla, Tetouan and Laayoune received fairly high acceptability (22%, 14%, 10%, 10%) for the first rank. The confidence factors of the top five alternatives were 97%, 94%, 74%, 85%, 55%, respectively. These indicate that only the top 4 alternatives could be chosen with high confidence if the DM concurred with the central weights of the corresponding alternatives. Due to imprecision in the criteria measurements, Laayoune was an uncertain candidate for the first rank, even with its most favourable weights. Figure 3 shows the central (most favourable) weights for each alternative. The choice between the four top alternatives depends on the preferences of the DM:
- Marrakech is the choice if Proximity is emphasized somewhat more than the other criteria, but overall, the weight distribution is still quite balanced (21%, 42%, 15%, 21%);
- Errachidia is most preferred with emphasis on Environ (36%) and a low weight on Proximity (12%);
- Dakhla is favoured by emphasizing Potential (44%) and Environ (32%);
- Tetouan is the choice if Invest (61%) is the most important.
ONDA has the option to select not just one but multiple locations for developing solar and wind power. The rank acceptability indices are more suitable for identifying one or a few of the best alternatives, rather than ranking all alternatives. If the most acceptable alternative (nearly) dominates other alternatives, their acceptability indices become (nearly) zero because they are (nearly) inefficient. This happens for inefficient alternatives even if they would be strong candidates for other high ranks. Instead, a weak alternative may receive fairly high acceptability if it is sufficiently different from the most acceptable alternative. See Lahdelma and Salminen (2001) for a description of this phenomenon.
To support identifying multiple preferred alternatives, we use the pairwise winning indices to form a (partial) ranking of the alternatives. Table 4 presents the pairwise winning indices for the alternatives sorted so that when cik > 50%, the alternative xi is ranked before xk and the cycles are resolved by assigning cyclically winning sets of alternatives the same rank. The alternatives obtain the partial ranking:
Marrakesh ≻ Errachidia ≻ Dakhla ≻ Ouarzazate ≻ (Tanger ≈ Fez ≈ Essaouira ≈ Laayoune) ≻ Agadir ≻ Tetouan ≻ Oujda
Table 4.
Pairwise winning indices cik for alternatives after first analysis based on 4 criteria. Partial ranking is formed based on cik > 50%. Tanger, Fez, Essaoiura and Laayoune share ranks 5–8 due to cyclic pairwise wins. Cycles broken using the Ranked Pairs method are shown in red.
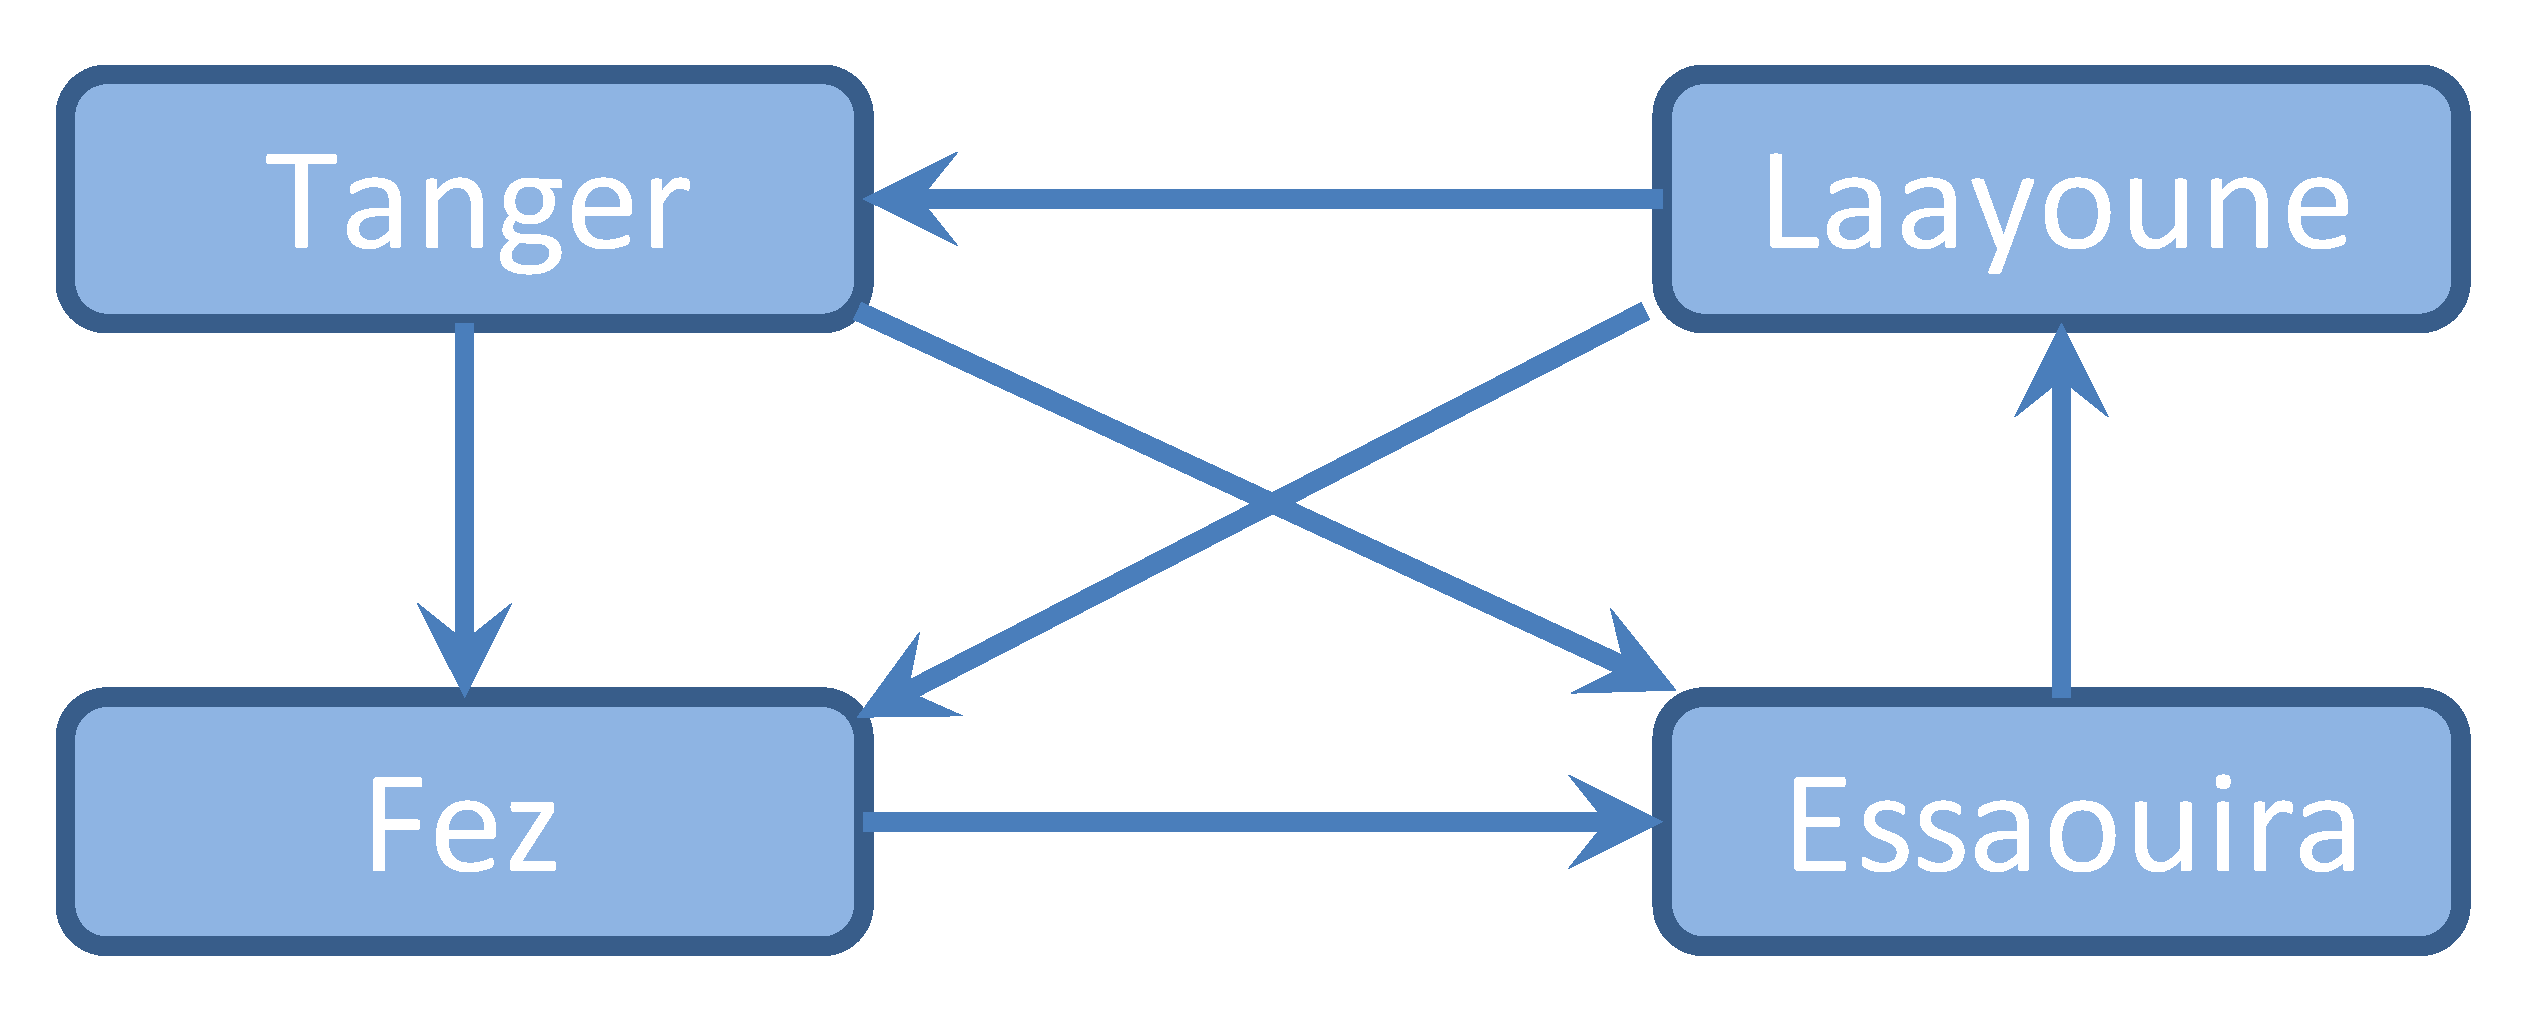
Here, the ‘≈’ mark denotes equal ranking, indicating that the four alternatives share ranks 5–8. In this case, the shared ranks are due to four alternatives winning each other in a non-transitive (cyclic) manner. There are two cycles, as illustrated in Figure 4: (Tanger ≻ Fez ≻ Essaouira ≻ Laayoune ≻ Tanger) and (Laayoune ≻ Fez ≻ Essaouira ≻ Laayoune).
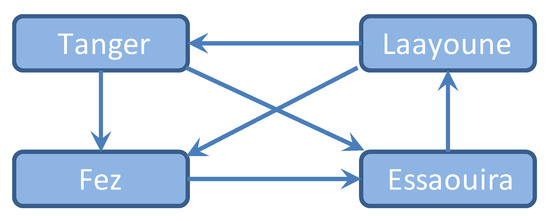
Figure 4.
Four alternatives with cyclic pairwise winning indices.
The Ranked Pairs method considers the pairwise winning indices in magnitude order and breaks cycle-forming dependencies for the pairs (Laayoune, Tanger) and (Laayoune, Fez), as shown Table 4. This gives the complete ranking of Tanger ≻ Fez ≻ Essaouira ≻ Laayoune for the cyclically winning alternatives.
4.3. Second SMAA Model
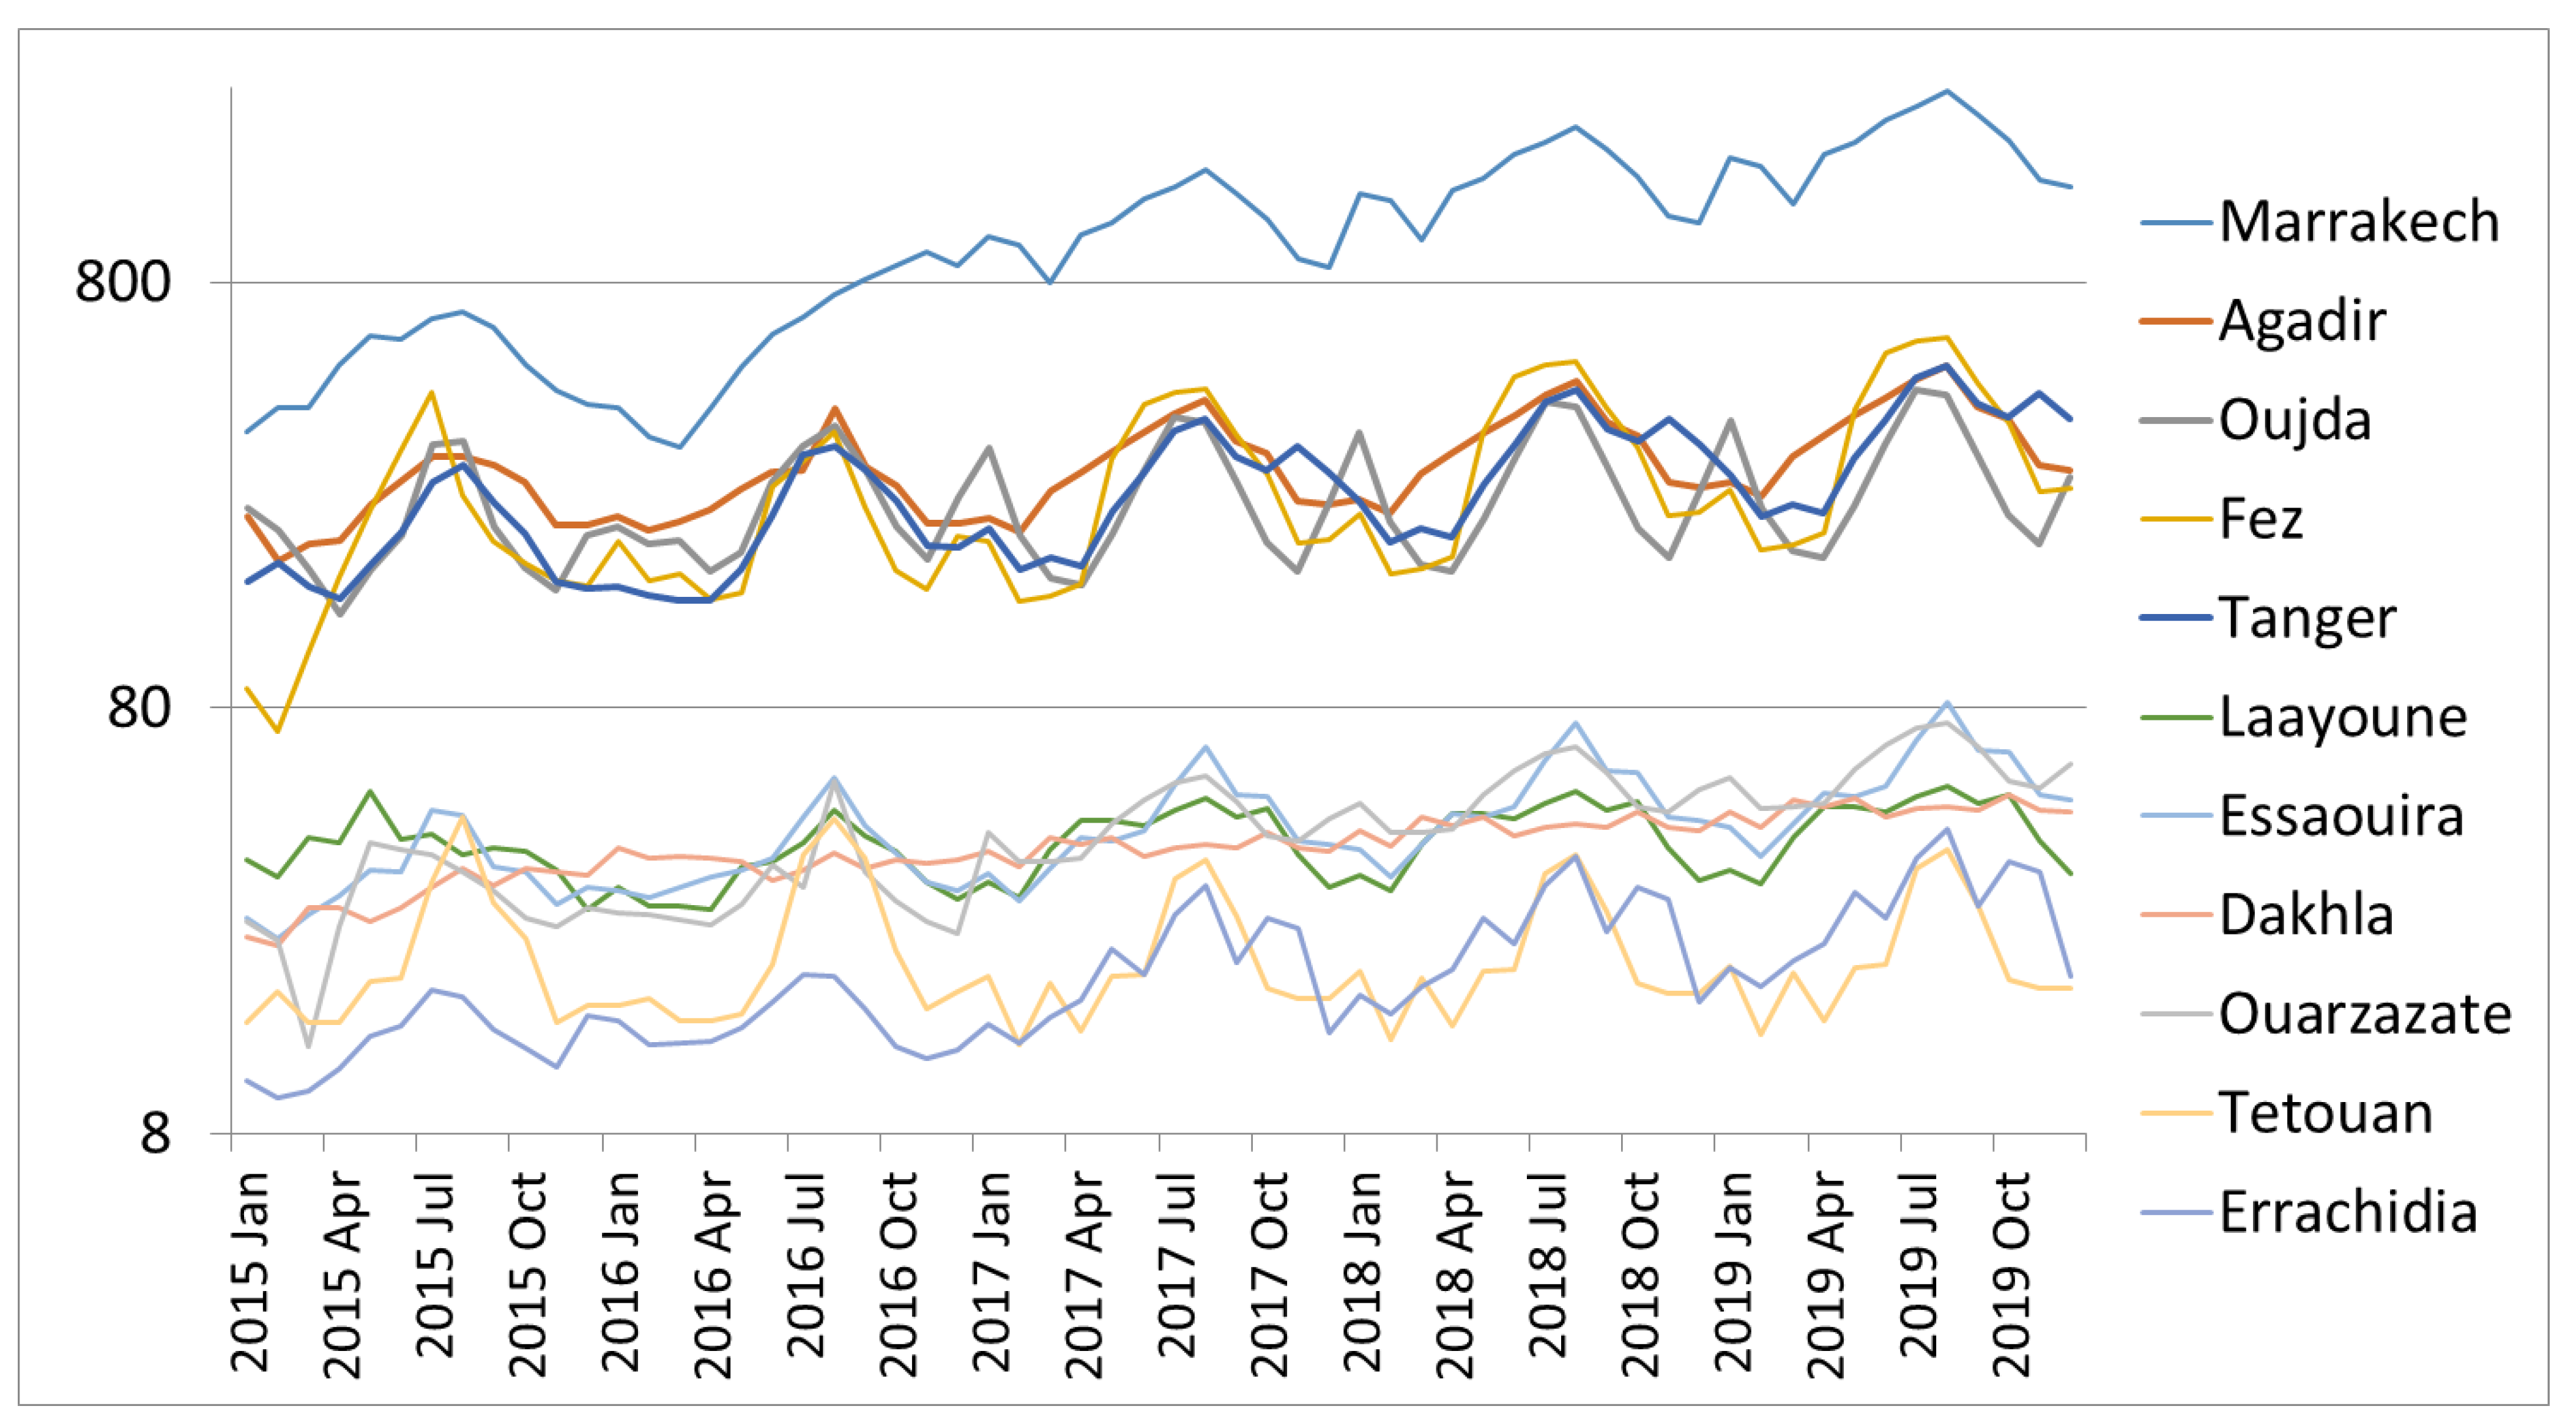
After the first analysis, ONDA wanted to consider additional factors when selecting sites for renewable power generation. In particular, they wanted to consider the electricity consumption at the airports. Electricity consumption at a sustainable airport should be mostly covered by local renewable power production. To reduce transmission losses, renewable energy production should be dimensioned so that it can be primarily consumed at the airport and in near-by communities, and only secondarily transmitted to other parts of the country. Figure 5 shows the monthly historical (2015–2018) and predicted (2019) electricity consumption at the airports. Due to the COVID-19 pandemic, airport operation in 2020 and 2021 has been exceptional and data from these years should not be used for decision making. There is a significant seasonal variation in the electricity consumption at each airport, peaking in the summer when space cooling is used the most. There is also a clear growing trend at each airport. These data can be used to estimate how much renewable power can be consumed at each airport currently and in the future.
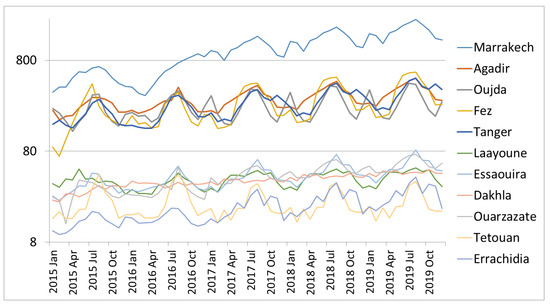
Figure 5.
Monthly electricity consumption (MWh) on logarithmic scale at airports: historical 2015–2018; predicted 2019.
ONDA also wanted to include the electricity consumption as a criterion in the multicriteria analysis. Larger electricity consumption supports building up larger volumes of renewable power and thus has greater impact on the Moroccan green energy supply. Therefore, the predicted electricity consumption of airports for the year 2019 was included as a new criterion to be maximized in the model. The criteria measurements for electricity demand at airports are shown in Table 1. The historical and predicted power demand at airports also forms the basis for estimating the required amount of PV at each airport to satisfy at least the yearly net self-consumption.
Figure 6 shows the rank acceptability indices from the second analysis. Including electric power consumption as a criterion strengthens the position of Marrakesh, because it clearly has highest electricity consumption. Dakhla bypasses Errachidia and Laayoune. As in the first analysis, the rank acceptability indices are more suitable for identifying one or a few of the best alternatives, rather than ranking all alternatives. Figure 7 shows the central weights for each alternative. Marrakech, with the highest demand for electric power, obtained a large weight (24%) for the new Demand criterion, while the other alternatives received much smaller weights in the range of [1.4%, 11.8%].
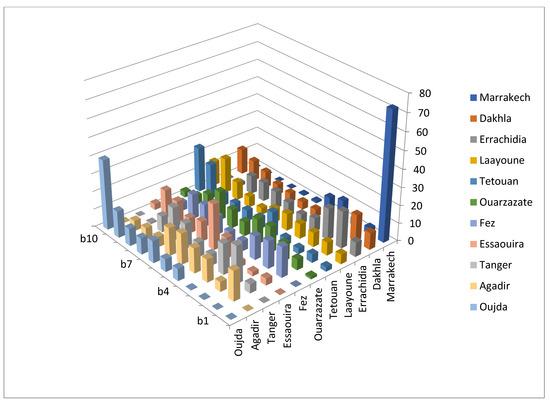
Figure 6.
Second analysis with electricity consumption as the new criterion. Rank acceptability indices for the alternatives sorted according to their acceptability indices.
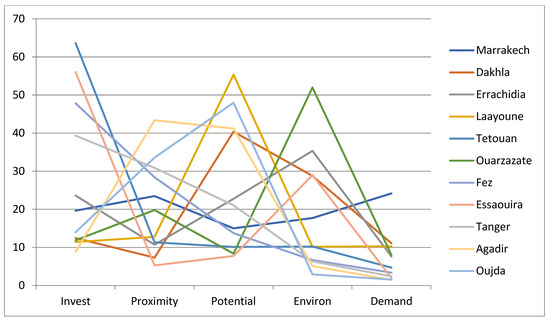
Figure 7.
Second analysis with electricity consumption as the new criterion. Central weights for the alternatives.
Table 5 presents the pairwise winning indices for alternatives sorted so that when cik > 50%, the alternative xi is ranked before xk. Based on Table 5, we form the partial order of Marrakesh ≻ Errachidia ≻ (Agadir ≈ Tanger ≈ Fez ≈ Dakhla) ≻ Ouarzazate ≻ Essaouira ≻ Laayoune ≻ Tetouan ≻ Oujda.
Table 5.
Pairwise winning indices cik for alternatives after second analysis. Partial ranking is formed based on cik > 50%. Agadir, Tanger, Fez, and Dakhla share ranks 3–6. Cycles broken using the Ranked Pairs method are shown in red.
The four alternatives (denoted by ≈) share ranks 3–6. Compared with the first run, the ranking of the two first and two last alternatives has not changed. Agadir improved its ranking (from 9th rank to shared 3–6) and Ouarzazate moved down (from 4th rank to 7th). Again, the Ranked Pairs method could be used to form a complete order for the cyclically winning alternatives: (Agadir ≻ Tanger ≻Fez ≻ Dakhla).
4.4. Third SMAA Model
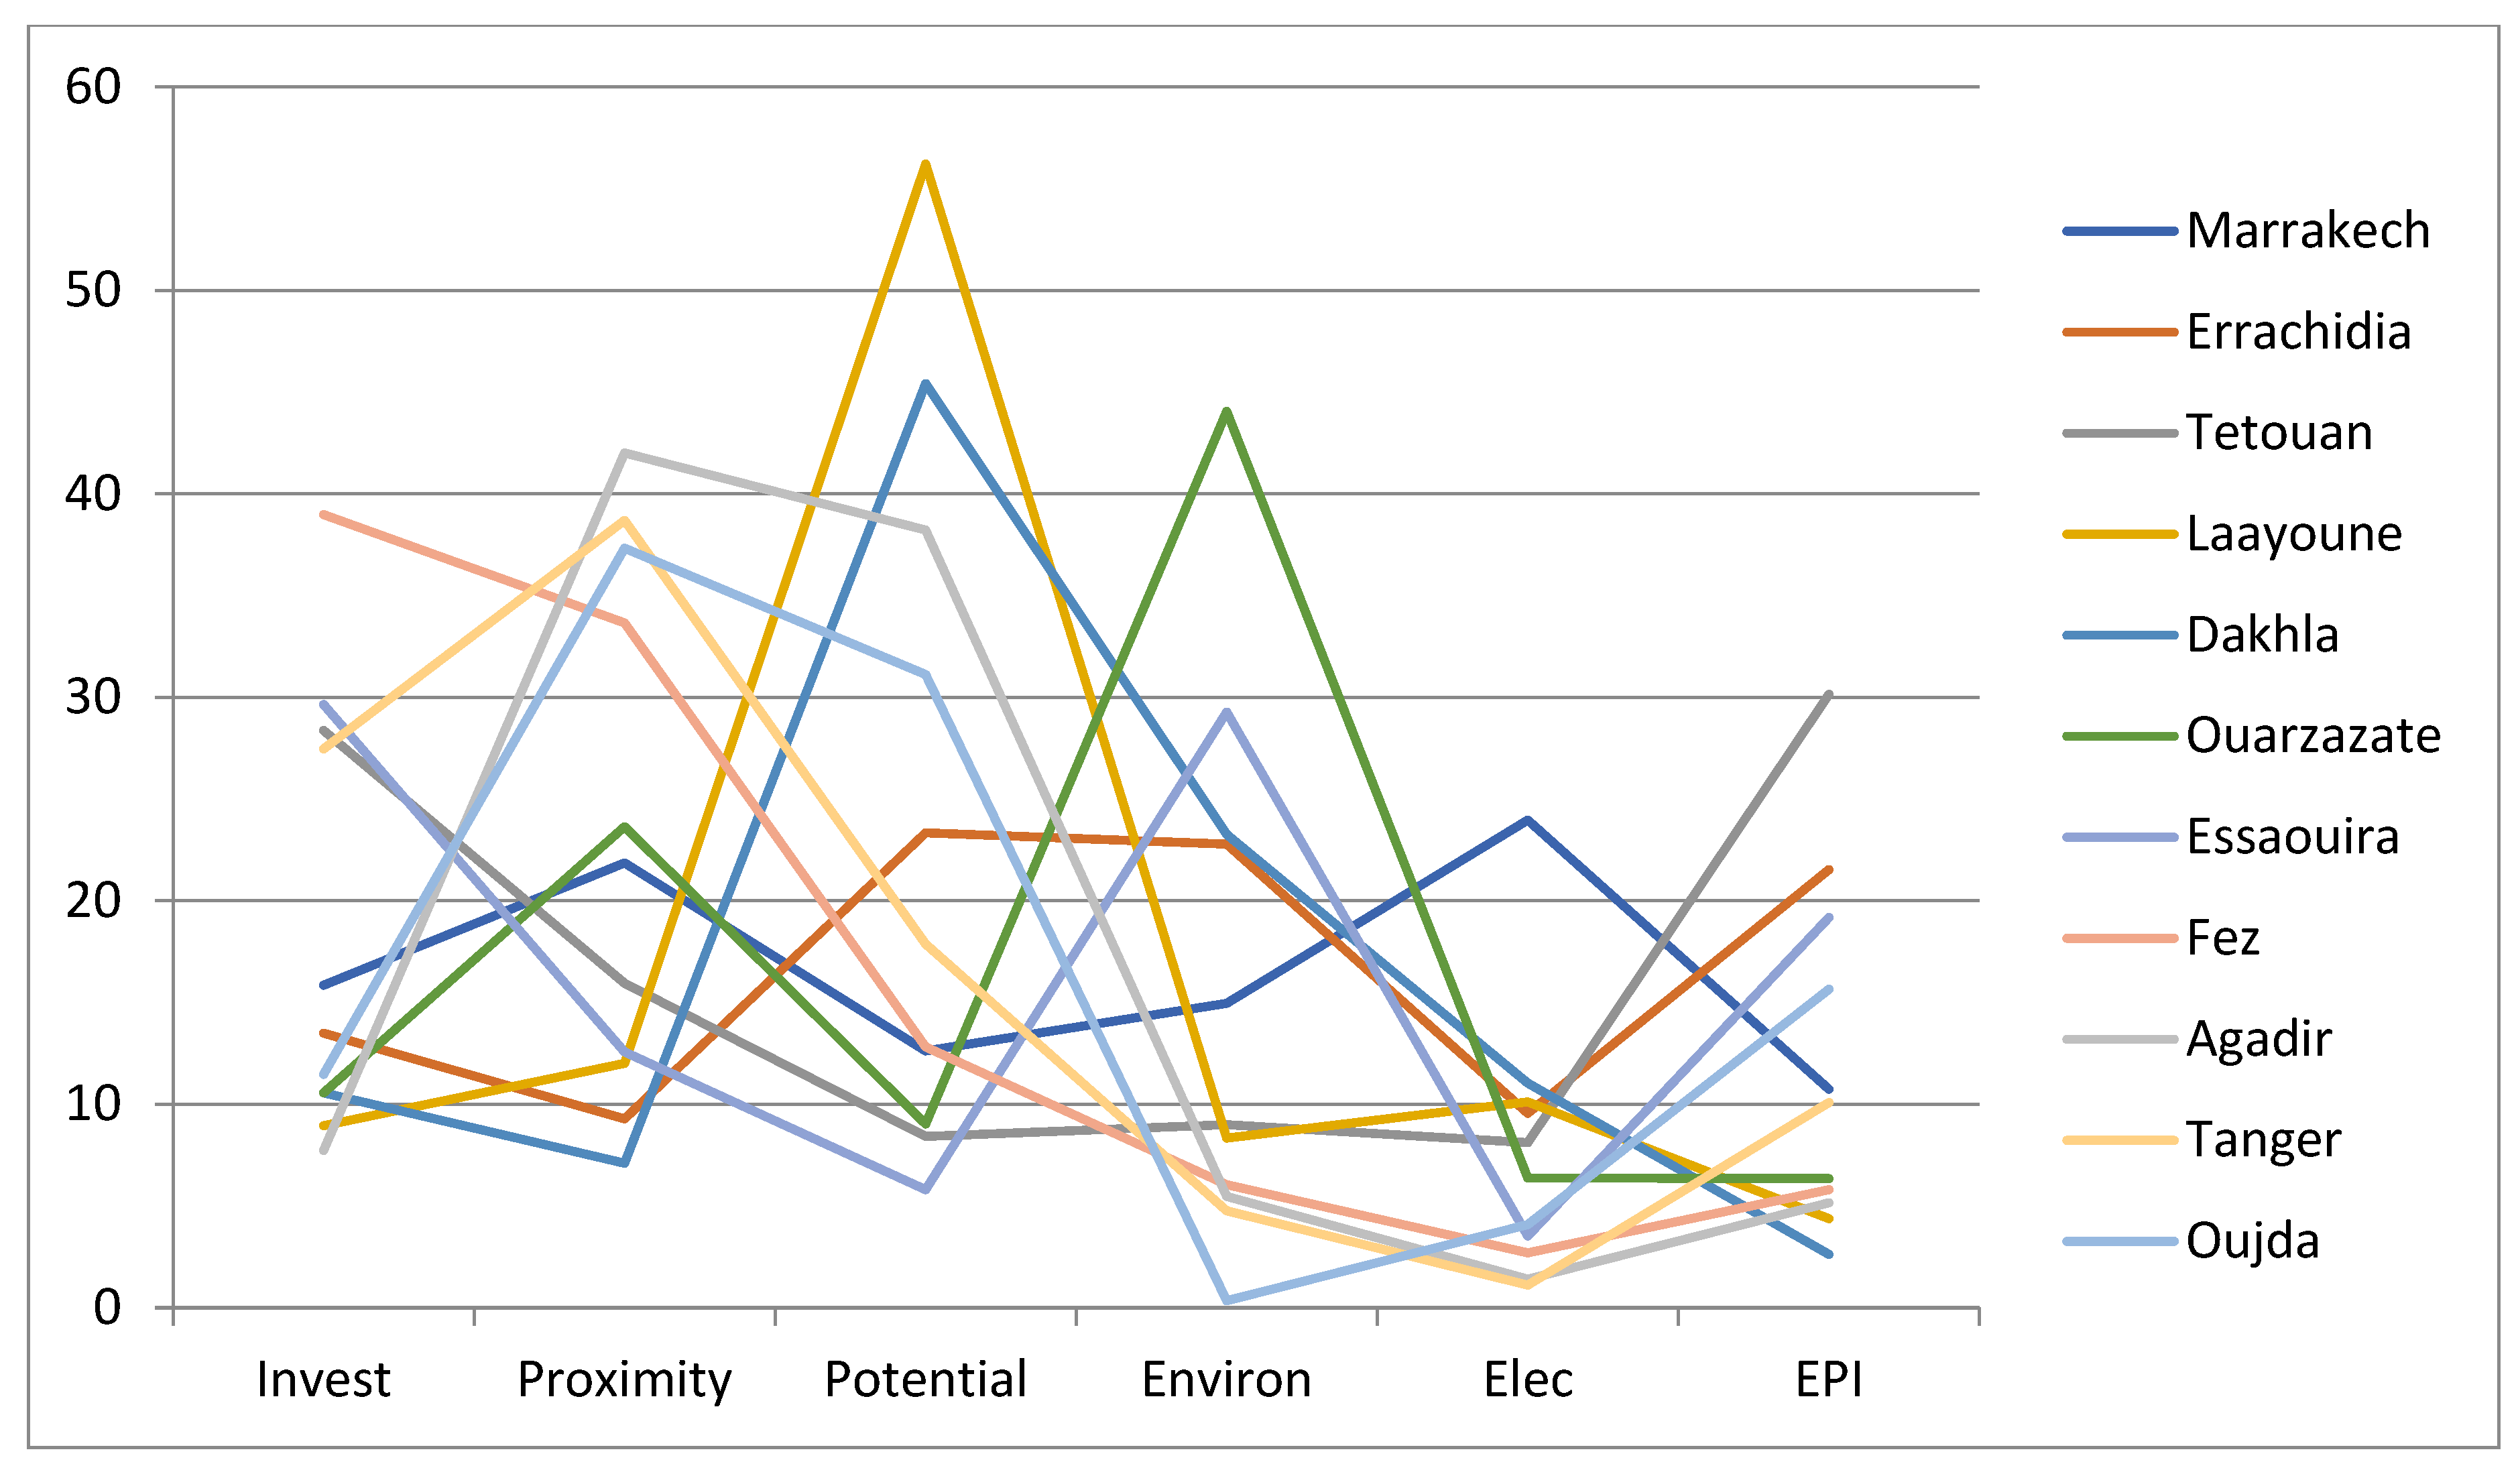
After the second analysis, ONDA still wanted to consider the energy performance indicator (EPI) as a criterion. Here, we measure EPI as electric power consumption per PAX (kWh/PAX). Additionally, other energy consumption could, in principle, be included, but in warm climates electricity consumption due to air-conditioning is the major consumer of energy at airports. For a sustainable airport, it is important that either the EPI is very low or that the power consumption is satisfied from renewable sources to a large degree. To maximize the environmental impact of developing some airports into sustainable airports, ONDA wanted to favour airports with a high EPI as there is ‘much room to improve’ and make an impact on the Moroccan renewable energy sector. The third SMAA model thus included as criteria: Invest, Proximity, Potential, Environ, Elect, and EPI, as presented in Table 3. The uncertainty of the EPI criterion was computed as 14% based on the uncertainty of PAX (10%) and the uncertainty of the Elect criterion (10%) using the ‘law of propagation of uncertainty’ [47].
Figure 8 presents the rank acceptability indices for the alternatives. Compared to the previous models, the acceptability of Tetouan was improved significantly as a result of including EPI as a criterion. Figure 9 presents the central weights. We can see that Tetouan was favoured by weight for the EPI and Invest criteria.
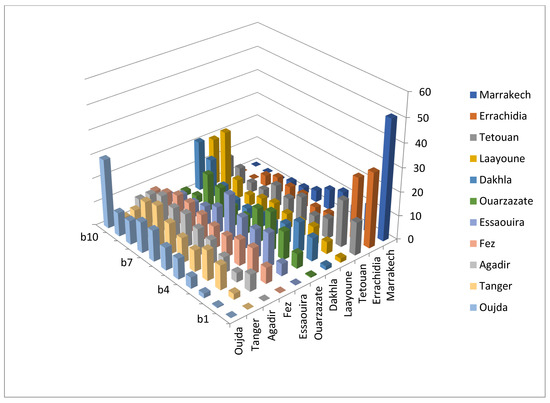
Figure 8.
Third analysis with EPI as a new criterion. Rank acceptability indices for alternatives sorted according to their acceptability indices.

Figure 9.
Third analysis with EPI as a new criterion. Central weights for the alternatives.
Table 6 shows the pairwise winning indices. This time the pairwise winning indices were transitive, and we directly obtained a complete ranking for the alternatives:
Marrakesh ≻ Errachidia ≻ Tetouan ≻ Essaouira ≻ Ouarzazate ≻ Tanger ≻ Fez ≻ Dakhla ≻ Agadir ≻ Laayoune ≻ Oujda
Table 6.
Pairwise winning indices cik for alternatives after third analysis. Complete ranking is formed based on cik > 50%.
Tetouan improved its ranking most (10th rank to 3rd). Additionally, Essaouira improved its ranking compared to the previous models.
5. Discussion
Table 7 summarises the airport rankings based on SMAA pairwise winning indices in three models with different sets of criteria. The table supports deciding which airports should be developed and in which order. Two airports obtained the highest ranks regardless of which set of criteria was applied. Marrakesh is the most obvious airport to develop, if only one airport is selected. Similarly, Errachidia obtained the second rank in all three models, and would be a natural choice if two airports are selected. The third rank depends on which model is used and what kind of criteria the DM wants to emphasize. Possible candidates for third rank are Tetouan, Dakhla, Fez, Agadir, and Tanger. Out of these, Tetouan is the second to last alternative according to the first two models but improves its position dramatically when the EPI (energy performance index) criterion is included. However, Tetouan is a very small airport with small electricity consumption, and developing it into a sustainable airport would have little impact nationwide. Oujda was the least preferred alternative in all models.
Table 7.
Summary of airport rankings in different models. Complete ranking by the Ranked Pairs method in parenthesis.
Within this study, a methodology was developed for using the pairwise winning indices to form partial and complete rankings of the alternatives. In our past applications, pairwise winning indices have defined a transitive preference relation. From a transitive relation it is easy to form a complete ranking using topological sorting. However, in the first and second models, pairwise winning indices defined an intransitive preference relation. This is a manifestation of the Condorcet paradox in ranked voting procedures.
To treat intransitivity, we suggested two alternative approaches:
- (1)
- Compute the transitive closure of preference relation in order to identify cyclically dependent strong components of the preference relation. Then, form a partial ranking by assigning the same rank to the cyclically dependent subsets of alternatives;
- (2)
- If a complete ranking is needed, apply the Ranked Pairs procedure for ranking the cyclically winning subsets of alternatives. The Ranked Pairs method considers the pairwise winning indices in strength order, breaking cycles at the weakest pairwise winning indices.
6. Conclusions
This study presents a multicriteria analysis for choosing the best locations for solar and wind power near Moroccan airports. This is the first application of MCDA for developing large-scale renewable energy production for airports. The main conclusion is that two airports, Marrakesh and Errachidia, are the primary choices for renewable energy production, regardless of which set of criteria is applied. This study shows that SMAA and the pairwise winning indices suit the current MCDA ranking problem setting well. In this problem, mixed ordinal and uncertain cardinal criteria measurements were available, but a priori preference information was absent. The scientific novelty of this study lies in developing a methodology for using pairwise winning indices to form partial and complete rankings of alternatives. The Ranked Pairs procedure was found suitable to resolve cyclic dependencies into a complete ranking. Interesting avenues for future research include comparing variants of SMAA in different ranking problems.
Author Contributions
All authors have contributed to conceptualization, modelling, analysis, interpreting the results, and writing the article. A.M. was responsible for data collection and validation. R.L. and P.S. were responsible for extending the SMAA methodology. All authors have read and agreed to the published version of the manuscript.
Funding
This research received no external funding.
Institutional Review Board Statement
Not applicable.
Informed Consent Statement
Not applicable.
Data Availability Statement
Not applicable.
Conflicts of Interest
The authors declare no conflict of interest.
References
- Morocco 2017. Stratégie Nationale de Développement Durable 2017–2030, RAPPORT FINAL. Available online: https://www.greengrowthknowledge.org/sites/default/files/downloads/policy-database/Morocco_Sustainable_Development_Strategy.pdf (accessed on 12 July 2022).
- Nfaoui, H.; Sayigh, A. Sustainability in Energy and Buildings: Research Advances, Special Edition—Mediterranean Green Energy Forum 2013 (MGEF-13); Future Technology Press: Shoreham-by-Sea, UK, 2013; Volume 2, pp. 36–43. Available online: https://nimbusvault.net/publications/koala/sebra (accessed on 12 July 2022).
- Azzioui, A.; Bouhamidi, M.H.; Mouadine, M.; Ettarid, M. Towards a more reliable evaluation of the Morocco’s solar resource. AIP Conf. Proc. 2019, 2126, 190003. [Google Scholar] [CrossRef]
- Afrik21. MOROCCO: Ranked Second Worldwide in Climate Change Control. Afrik 21. Green Economy and Sustainable Growth in Africa, 30 April 2020. Available online: https://www.afrik21.africa/en/morocco-ranked-second-worldwide-in-climate-change-control/ (accessed on 19 May 2022).
- Germanwatch. 2020. Available online: https://www.germanwatch.org/en/indices (accessed on 12 July 2022).
- World Bank. World Bank Group Global Solar Atlas. 2020. Available online: https://globalsolaratlas.info (accessed on 12 July 2022).
- Kılkış, Ş.; Kılkış, Ş. Benchmarking airports based on a sustainability ranking index. J. Clean. Prod. 2016, 130, 248–259. [Google Scholar] [CrossRef]
- Chao, C.C.; Lirn, T.C.; Lin, H.C. Indicators and evaluation model for analyzing environmental protection performance of airports. J. Air Transp. Manag. 2017, 63, 61–70. [Google Scholar] [CrossRef]
- Boussauw, K.; Vanoutrive, T. Flying Green from a Carbon Neutral Airport: The Case of Brussels. Sustainability 2019, 11, 2102. [Google Scholar] [CrossRef] [Green Version]
- Boca Santa, S.L.; Ribeiro, J.M.P.; Mazon, G.; Schneider, J.; Barcelose, R.L.; Osório de Andrade Guerra, J.B.S. A Green Airport model: Proposition based on social and environmental management systems. Sustain. Cities Soc. 2020, 59, 102160. [Google Scholar] [CrossRef]
- Ferrulli, P. Green Airport Design Evaluation (GrADE)—Methods and tools improving infrastructure planning. Transp. Res. Procedia 2016, 14, 3781–3790. [Google Scholar] [CrossRef] [Green Version]
- Lee, K.C.; Tsai, W.H.; Yang, C.H.; Lin, Y.Z. An MCDM approach for selecting green aviation fleet program management strategies under multi-resource limitations. J. Air Transp. Manag. 2018, 68, 76–85. [Google Scholar] [CrossRef]
- Kumar, A.; Aswin, A.; Gupta, H. Evaluating green performance of the airports using hybrid BWM and VIKOR methodology. Tour. Manag. 2020, 76, 103941. [Google Scholar] [CrossRef]
- Wu, D.; Qi, H. Evaluating the economic and ecological impact for small and medium airport subsidies in China. J. Clean. Prod. 2021, 281, 124811. [Google Scholar] [CrossRef]
- Kucukvar, M.; Alawi, K.A.; Abdella, G.M.; Bulak, M.E.; Onat, N.C.; Bulu, M.; Yalçıntaş, M. A frontier-based managerial approach for relative sustainability performance assessment of the world’s airports. Sustain. Dev. 2022, 29, 89–107. [Google Scholar] [CrossRef]
- Kaya, S.K.; Erginel, N. Futuristic airport: A sustainable airport design by integrating hesitant fuzzy SWARA and hesitant fuzzy sustainable quality function deployment. J. Clean. Prod. 2020, 275, 123880. [Google Scholar] [CrossRef]
- Nikoloudis, C.; Aravossis, K.; Strantzali, E.; Chrysanthopoulos, N. A novel multicriteria methodology for evaluating urban development. J. Clean. Prod. 2020, 263, 120796. [Google Scholar] [CrossRef]
- Broniewicz, E.; Ogrodnik, K. A Comparative Evaluation of Multi-Criteria Analysis Methods for Sustainable Transport. Energies 2021, 14, 5100. [Google Scholar] [CrossRef]
- Pinto, G.; Abdollahi, E.; Cappozoli, A.; Savoldi, L.; Lahdelma, R. Optimization and Multicriteria Evaluation of Carbon-neutral Technologies for District Heating. Energies 2019, 12, 1653. [Google Scholar] [CrossRef] [Green Version]
- Bandaru, S.H.; Becerra, V.; Khanna, S.; Espargilliere, H.; Torres Sevilla, L.; Radulovic, J.; Hutchinson, D.; Khusainov, R. A General Framework for Multi-Criteria Based Feasibility Studies for Solar Energy Projects: Application to a Real-World Solar Farm. Energies 2021, 14, 2204. [Google Scholar] [CrossRef]
- Vagiona, D.G. Comparative Multicriteria Analysis Methods for Ranking Sites for Solar Farm Deployment: A Case Study in Greece. Energies 2021, 14, 8371. [Google Scholar] [CrossRef]
- Tsagkari, M.; Roca, J.; Stephanides, P. Sustainability of local renewable energy projects: A comprehensive framework and an empirical analysis on two islands. Sustain. Dev. 2022, 1–14. [Google Scholar] [CrossRef]
- Alhammad, A.; Sun, Q.; Tao, Y. Optimal Solar Plant Site Identification Using GIS and Remote Sensing: Framework and Case Study. Energies 2022, 15, 312. [Google Scholar] [CrossRef]
- Lahdelma, R.; Salminen, P. SMAA-2: Stochastic multicriteria acceptability analysis for group decision making. Oper. Res. 2001, 49, 444–454. [Google Scholar] [CrossRef]
- Salminen, P.; Hokkanen, J.; Lahdelma, R. Comparing multicriteria methods in the context of environmental problems. Eur. J. Oper. Res. 1998, 104, 485–496. [Google Scholar] [CrossRef]
- Sałabun, W.; Watróbski, J.; Shekhovtsov, A. Are MCDA Methods Benchmarkable? A Comparative Study of TOPSIS, VIKOR, COPRAS, and PROMETHEE II Methods. Symmetry 2020, 12, 1549. [Google Scholar] [CrossRef]
- Paradowski, B.; Salabun, W. Are the results of MCDA methods reliable? Selection of materials for Thermal Energy Storage. Procedia Comput. Sci. 2021, 192, 1313–1322. [Google Scholar] [CrossRef]
- Cinelli, M.; Kadziński, M.; Miebs, G.; Gonzalez, M.; Słowiński, R. Recommending multiple criteria decision analysis methods with a new taxonomy-based decision support system. Eur. J. Oper. Res. 2022, 302, 633–651. [Google Scholar] [CrossRef]
- Tervonen, T.; Lahdelma, R. Implementing stochastic multicriteria acceptability analysis. Eur. J. Oper. Res. 2007, 178, 500–513. [Google Scholar] [CrossRef] [Green Version]
- Menou, A.; Benallou, A.; Lahdelma, R.; Salminen, P. Decision support for centralizing cargo at a Moroccan airport hub using stochastic multicriteria acceptability analysis. Eur. J. Oper. Res. 2010, 204, 621–629. [Google Scholar] [CrossRef]
- Tervonen, T.; Figueira, J. A survey on stochastic multicriteria acceptability analysis methods. J. Multi-Criteria Decis. Anal. 2008, 15, 1–14. [Google Scholar] [CrossRef]
- Lahdelma, R.; Salminen, P. Stochastic multicriteria acceptability analysis (SMAA). In Trends in Multiple Criteria Decision Analysis; Ehrgott, M., Figueira, J.R., Greco, S., Eds.; International Series in Operations Research and Management Science; Springer: Berlin, Germany, 2010; Volume 142. [Google Scholar]
- Pelissari, R.; Oliveira, M.C.; Ben Amor, S.; Kandakoglu, A.; Helleno, A.L. SMAA methods and their applications: A literature review and future research directions. Ann. Oper. Res. 2019, 293, 433–493. [Google Scholar] [CrossRef]
- Lahdelma, R.; Hokkanen, J.; Salminen, P. SMAA—Stochastic multiobjective acceptability analysis. Eur. J. Oper. Res. 1998, 106, 137–143. [Google Scholar] [CrossRef]
- Lahdelma, R.; Salminen, P. The shape of the utility or value function in stochastic multicriteria acceptability analysis. OR Spectr. 2012, 34, 785–802. [Google Scholar] [CrossRef]
- Lahdelma, R.; Miettinen, K.; Salminen, P. Ordinal criteria in stochastic multicriteria acceptability analysis (SMAA). Eur. J. Oper. Res. 2003, 147, 117–127. [Google Scholar] [CrossRef]
- Montes, I.; Rademaker, M.; Pérez-Fernández, R.; de Baets, B. A correspondence between voting procedures and stochastic orderings. Eur. J. Oper. Res. 2020, 285, 977–987. [Google Scholar] [CrossRef]
- Kahn, A.B. Topological sorting of large networks. Commun. ACM 1962, 5, 558–562. [Google Scholar] [CrossRef]
- Condorcet, M. An essay on the application of probability theory to plurality decision making: An election between three candidates. In The Political Theory of Concordet; Sommerlad, F., McLean, I., Eds.; University of Oxford: Oxford, UK, 1989. [Google Scholar]
- Nuutila, E. Efficient Transitive Closure Computation in Large Digraphs. Ph.D. Thesis, Helsinki University of Technology, Helsinki, Finland, 1995; 124p. [Google Scholar]
- Tideman, T.N. Independence of clones as a criterion for voting rules. Soc. Choice Welf. 1987, 4, 185–206. [Google Scholar] [CrossRef]
- Nurmi, H. Comparing Voting Systems; Springer Science & Business Media: Berlin, Germany, 2012. [Google Scholar]
- Tervonen, T. SMAA.fi—Open Source Decision Aiding Software for Real-Life Applications. 2009. Available online: http://smaa.fi/jsmaa (accessed on 19 July 2022).
- Ortega, S.; Manana, M. Energy Research in Airports: A Review. Energies 2016, 9, 349. [Google Scholar] [CrossRef] [Green Version]
- Akyüz, M.K.; Kafali, H.; Altuntaş, Ö. An analysis on energy performance indicator and GWP at Airports: A case study. Energy Sources Part A Recovery Util. Environ. Eff. 2020, 43, 2402–2418. [Google Scholar] [CrossRef]
- World Bank. World Bank Group Global Wind Atlas. 2020. Available online: https://globalwindatlas.info (accessed on 12 July 2022).
- Lahdelma, R.; Makkonen, S.; Salminen, P. Two ways to handle dependent uncertainties in multi-criteria decision problems. Omega 2009, 37, 79–92. [Google Scholar] [CrossRef]

Publisher’s Note: MDPI stays neutral with regard to jurisdictional claims in published maps and institutional affiliations. |
© 2022 by the authors. Licensee MDPI, Basel, Switzerland. This article is an open access article distributed under the terms and conditions of the Creative Commons Attribution (CC BY) license (https://creativecommons.org/licenses/by/4.0/).