Article

Energetic and Economic Analysis of Spineless Cactus Biomass Production in the Brazilian Semi-arid Region

by
Jéssica Bárbara da Silva
1,
Edvaldo Pereira Santos Júnior
2,
João Gabriel Távora Pedrosa
3,
Aldo Torres Sales
3,
Everardo Valadares de Sa Barretto Sampaio
3,
Rômulo Simões Cezar Menezes
3,
Emmanuel Damilano Dutra
3,* and
Paulo Rotella Junior
4
1
Graduate Program in Energy and Nuclear Technologies (PROTEN), Federal University of Pernambuco (UFPE), Recife 50740-545, Brazil
2
Renewable Energy Graduate Program (PPGER), Federal University of Paraíba (UFPB), João Pessoa 58051-970, Brazil
3
Department of Nuclear Energy (DEN), Federal University of Pernambuco (UFPE), Recife 50740-545, Brazil
4
Department of Production Engineering, Federal University of Paraíba, João Pessoa 58051-970, Brazil
*
Author to whom correspondence should be addressed.
Energies 2022, 15(14), 5270; https://doi.org/10.3390/en15145270
Submission received: 27 May 2022 / Revised: 13 June 2022 / Accepted: 20 June 2022 / Published: 20 July 2022
(This article belongs to the Special Issue Finance and Economics of Energy Transition)

Abstract

:
The Brazilian semi-arid region is marked by a variable spatial-temporal rainfall distribution, concentrated over a 3 to 4 month season. Limited water availability is the main obstacle to the production of forage plants of C3 metabolism (such as corn and soybeans) and C4 metabolism (such as sugarcane), as well as livestock. To mitigate this forage supply, the spineless cactus (SC) has been cultivated in the region, producing high biomass amounts in this harsh environment. Recently, this remarkable capacity to produce biomass has drawn the attention of the renewable energy sector, supported by recent studies demonstrating the feasibility of its biomass as a raw material for bioenergy production. However, before moving to commercial scale, it is necessary to demonstrate that large-scale production has energy and economic viability for clean energy investors. Thus, the objective of this article was to analyze the energetic and economic viability of forage cactus cultivation systems in the Brazilian semi-arid region. The data used were extracted from the literature, based on forage production. For the energy evaluation, the energy balance was performed and the energy efficiency, energy productivity, specific energy, and net energy metrics were applied. The financial feasibility analysis used the Net Present Value (NPV) and Internal Rate of Return (IRR). The energy balance revealed that the SC cultivation is viable for biomass commercial-scale production, with an energy efficiency of 3.36, an energy productivity of 0.25 kg MJ−1, a specific energy of 13.5 MJ kg−1, and an energy balance of 127,348 MJ ha−1. For the economic aspect, considering an attractive minimum rate of return of 8%, production also proved to be viable, in a time horizon of three years. The Net Present Value and IRR metrics were USD 2196 and the IRR was 46%, respectively. The results found are important to encourage new investments in rural properties in the semi-arid region, and cultivation in new areas proved to be an efficient alternative from an energy and economic point of view, in addition to collaborating for the energy transition to sustainable sources and in the mitigation of regional environmental impacts.

Graphical Abstract

1. Introduction

The search for clean energy has been boosting the production of biomass, bioenergy, and chemical compounds in arid and semi-arid regions. However, the management of these areas will be a major challenge for society, especially in a scenario of their expansion, due to climate change [1]. A large part of the Brazilian Northeast region has a semi-arid climate, with rains concentrated in 3 to 4 months of the year, resulting in limited water availability and unfavorable conditions for the most common agricultural crops [2]. However, some species adapt well to these conditions, such as the Cactus prickly pear (Opuntia ficus-indica), a culture already known around 6000 BC by ancestral peoples who inhabited what is now Mexico [3].
Many uses for prickly cactus are described in the literature. In Brazil, their main use is forage source for the herds [4]. This cactus is a remarkable crop from a morphophysiological point of view, as it adapts to low water availability, due to its Crassulaceae Acid Metabolism (CAM), which allows the reduction of water loss during photosynthesis [5]. In addition, it is an important crop for regional socio-economic development, with the possibility of having a strong prominence in the semi-arid regions of the world, being able to produce biomass even during long drought periods, reaching productivities above 10 t ha−1 y−1 of dry matter under rainfed and 40 t ha−1 y−1 with irrigation [6]. Forage cactus has the potential to produce biofuels such as biogas and ethanol comparable to traditional energy crops. It is already an important crop in Brazil and other countries with semi-arid areas and has the potential to increase this importance if its use as an energy crop is confirmed [6,7].
The use of renewable fuels has been an important strategy in the energy transition and for the reduction of greenhouse gas (GHG) emissions, both in the transport sector dominated by fuels derived from petroleum, and for the generation of electricity. The application of these resources promotes a sustainable rural economy and improves national energy security [8]. However, studies on the sustainability and efficiency analysis of biomass production, particularly from an energy point of view, are still limited [9,10,11].
The sustainability of agricultural ecosystems should be analyzed from the energy balance [12], but also in relation to their financial viability [13]. The analyses of the energy and economic balances provide elements necessary for decision-making by stakeholders, which contributes to the optimization of energy and economic costs [14].
The first studies involving energy balance in agricultural production took shape in the 1970s, motivated by the global energy crisis, caused by the low supply of fossil fuels. In addition, the population increase, the concern with food availability and the environmental discussions initiated in this period resulted in the search for the expansion of knowledge in this area [15,16]. Sustainability in agriculture must consider the main sources of energy waste, through the inputs and outputs of the system [17,18]. Thus, the efficiency of a production process is measured by the relationship between the benefits obtained and the resources used [19].
Several energy balance studies, some accompanied by economic feasibility analyses, have been reported for biomass, covering different applications and sources, such as sugarcane, sweet sorghum, corn, and rice [19,20,21]. Hiloidhari et al. [20] presented the energy balance of the sugarcane crop destined for the production of sugar, ethanol, and electricity in India; Lopez-Sandin et al. [19] evaluated sorghum production in India. Jankowski et al. [21] also considered efficiency assessments for various oilseeds in Poland. Other trials such as Macedo et al. [22] for the rice-pasture; Rahman and Hasan [23] for wheat, and Mohammadi et al. [24] for multiple crops (wheat, barley, canola, soybean, rice, and corn silage) should also be highlighted.
Some studies have also addressed agricultural production in semi-arid areas, such as Moreno et al. [25] for barley production on farms in central Spain; Taner et al. [26] for wheat plantations, at different scales, in Turkey, and Sahabi, Feizi, and Amirmoradi [27] who evaluated both crops (wheat and barley) for a province in Iran, where the authors identified wheat systems as more efficient. However, although some research has been carried out in the semi-arid regions of the planet, there are several crops with energy potential that have not been evaluated and tests, such as the one proposed in this work, are necessary to detail the efficiency of their production system.
In turn, economic profitability is one of the most important factors for the farmer, before the implementation of an energy crop [28]. Economic evaluations can be carried out by different methods, which are subdivided between those that consider uncertainties and those that do not consider uncertainties (static or dynamic) [29]. Static and dynamic assays use average costs and benefits over time and are also used for biomass production assessments, as shown in the work of Sgroi et al. [30] for eucalyptus production, Testa et al. [31] for poplar, Styles et al. [32] for Miscanthus and short-rotation coppice willow, and Testa et al. [28] for the cultivation of giant sugarcane in Italy. The financial assessment of the spineless cactus system is complementary to the energy assessment, favoring the expansion of its production.
Based on the above, the objective of this article was to analyze the energy balance and the economic viability of the Cactus forage (Opuntia ficus-indica) biomass production system for energy purposes, in a semi-arid region, using the case of the Brazilian Northeast region. The findings of this study can better guide producers and thus offer solutions that can increase productivity efficiency, reduce costs, and maximize profits from agricultural systems.

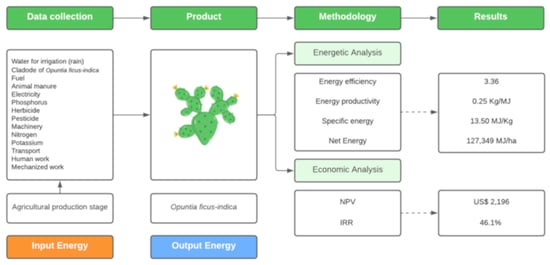
2. Materials and Methods

2.1. Definition of the Planting System

A cropping system in Northeast Brazil with a medium level of efficiency has been simulated based on previous models developed by Ramos et al. [33], Lima et al. [34], and Dantas et al. [35]. The most representative characteristics were used in the simulated cropping system. The limits of the system under study, from the soil preparation process to the harvest and sale of forage cactus, were defined.

2.2. Analysis of the Energy Balance of the Cropping System

To calculate the energy balance, we used the methodology proposed by Rodón and Rodríguez [36] and De Las Cuevas et al. [37]. All energy consumed in the cropping system (input energy) was aggregated and compared with the energy obtained from the post-harvest forage cactus biomass (output energy). Table 1 shows the characteristics of the cultivation system in the Brazilian Northeast region and Table 2 shows the energy equivalents of the input energy of the cropping system that were used in the study.
The method uses Equation (1) that aggregates the activities presented in Table 1 into groups.
E T = E M + E F + E L F + E M R + E S + E F H P + E E + E L
where ET is the total energy used; EM is the energy in materials, manufacturing, and transportation; EF is the energy in fuel; ELF is the energy in lubricants and filters; EMR is the energy in maintenance and repairs; ES is energy in seeds; EFHP is energy in fertilizers, herbicides, and pesticides; EL is energy in labor, and EE is energy in electricity. The values are given in MJ ha−1.
EM includes all energy used to build the tractor and machinery (implements), plus the energy equivalent for field use. To estimate EM, we used the method proposed by Fluck et al. [46], expressed by Equation (2).
E M = M t × E M T T I + M M × E M M A I
where MT and MM are the masses in kg of the tractor and machinery; EMT and EMM are the energies per unit mass (MJ kg−1), and TI and AI are the useful life in hours of the tractor and agricultural implements, respectively. The mass values of the tractor and machinery were obtained from the manufacturers’ catalog. Table 3 shows the values used to calculate the EM.
EF was determined through the product of the fuel consumption per hour (C, L h−1) multiplied by the fuel equivalent in energy (EEC, MJ L−1) (Equation (3)).
E F = C × E E F
To estimate ELF and EMR, we used the methods proposed by Fluck [46] and Rodón, Fernandes, and Oliveira et al. [49], adopting values of 5% of EC for ELF and 129% of EM for EMR.
In the method proposed by Rodón and Rodríguez [36] and De Las Cuevas et al. [37], relate the variables of the energy cost of agricultural machinery MJ h−1. For the analysis of the energy balance, the values are expressed in energy per hectare, that is, MJ ha−1. The conversion was done through the effective field capacity of the machines, CM (h ha−1) (Table 4), defined by the methodology proposed by Rodón and Rodríguez [36] (Equation (4)).
C M = 10 A × S × τ
where A is the width of the machine (m); S is the working speed of the machines (km h−1), and τ is the time utilization coefficient in the working day.
The width of the machines was obtained from the manufacturer’s catalog, the working speeds were obtained from the study of Balastreire [47], and the coefficient of use of time in the working day (τ) was 0.63, a value proposed by Rondón [50] and Ibañez and Rojas [51].
Table 5 shows the values converted by the resulting field capacity factor of 2.89 h ha−1 of the elements under study referring to machinery.
To quantify the energy contained in cladodes, fertilizers, herbicides, and pesticides, we used the methods proposed by Vilche et al. [45], Yilmaz et al. [42], Meul et al. [32], and Ren et al. [52] (Equation (5)). The dry matter (DM) content of cactus forage varies considerably depending on the genus and species, with values between 6.1% and 17.1%. Thus, the value proposed by Valadares Filho et al. [53] was established in the research. The average weight of the cladode was considered to be 1 kg [54]. The lower calorific value for forage cactus biomass was 13.5 MJ kg−1 [10].
E S + E F H P = ( M C × E E C L A × ( % )   D M ) + ( M F × E E F E R ) + ( V H × E E H E R ) + ( V P × E E P E S )
where MC and MF are the masses in kg ha−1, and EECLA and EEFER are energy equivalents in MJ kg−1 of the planted cladodes and the fertilizers used, respectively; VH and VP are volumes in L ha−1, and EEHER and EEPES are energy equivalents in MJ L−1 of herbicides and pesticides, respectively. Table 6 shows the values used to calculate the ES and EFHP. The biomass of the planted cladode per hectare was considered assuming a planting arrangement of 1.5 m × 0.5 m × 0.4 m with double planting rows.
Energy of electricity (EE) is the cost of availability, that is, the amount charged by the energy distributor to make the electricity service available to the customer. The cultivation system considered for this work does not have direct electricity costs, therefore it is charged through the minimum energy rate. According to the Pernambuco state distributor, CELPE, the availability cost for a single-phase customer is 30 kWh.
Finally, the labor energy, EMO, Equation (6), was calculated using the methodology proposed by Tabatabaeefar et al. [44] and Mittal and Singh [40].
E M O = ( T m a n × E m a n ) + ( T m e c × E m e c )
where Tman and Tmec are the hours of work, and Eman and Emec correspond to the equivalent energy in MJ ha−1 of manual and mechanical work, respectively. For calculation purposes, 8 h of work per day in the field were considered. The data used to calculate the energy by human labor are described in Table 7.
The energy of the cactus forage that were obtained after harvest, the output energy, Eharvest, in MJ ha−1, was necessary to estimate the mass of each plant and multiply by the quantity of plants, the energy equivalent, and the percentage of dry matter (DM) (Equation (7)). According to Silva et al. [55], the O. fícus-indica plant has an average of 5.58 cladodes per plant after two years of growth. The lower calorific power (LCP) of a forage cactus plant was considered to be 13.5 MJ kg−1.
E h a s r v e s t = N u m b e r   o f   p l a n t s h a × C l a d o d e   w e i g h t   ( k g ) × N u m b e r   o f   C l a d o d e s   f o r   p l a n t s × L C P × D M ( % )  

2.3. Energy Indicators

To determine energy indicators, methodologies were used proposed by Tabatabaie et al. [56] and Nabavi-Pelesaraei et al. [57]. The energy efficiency of the crop system was defined as the energy provided by the forage cactus at harvest time (output energy), divided by the sum of all the energy spent in the crop cycle (input energy) (Equation (8)). Overall, this indicator is used when the purpose of the process is energy generation [19].
E n e r g y   E f f i c i e n c y = E n e r g y   O b t a i n e d ( M J   h a 1 ) D e p o s i t e d   E n e r g y ( M J   h a 1 )
Energy productivity was defined as the amount of cactus forage that can be obtained, in kilograms, for each MJ used in the production process (Equation (9)).
E n e r g y   P r o d u c t i v i t y = C a c t u s   F o r a g e   p r o d u c t i v i t y ( k g   h a 1 ) D e p o s i t e d   E n e r g y ( M J   h a 1 )
Specific energy (MJ kg−1) was defined as the amount of energy contained in each kilogram of forage cactus after harvest (Equation (10)).
S p e c i f i c   E n e r g y = E n e r g y   O b t a i n e d ( M J   h a 1 ) C a c t u s   f o r a g e   p r o d u c t i v i t y ( k g   h a 1 )
The net energy was defined as the difference between the output energy obtained after harvest and the total energy used in production (input energy) (Equation (11)).
N e t   E n e r g y = E n e r g y   O b t a i n e d ( M J   h a 1 ) E n e r g y   D e p o s i t e d ( M J   h a 1 )

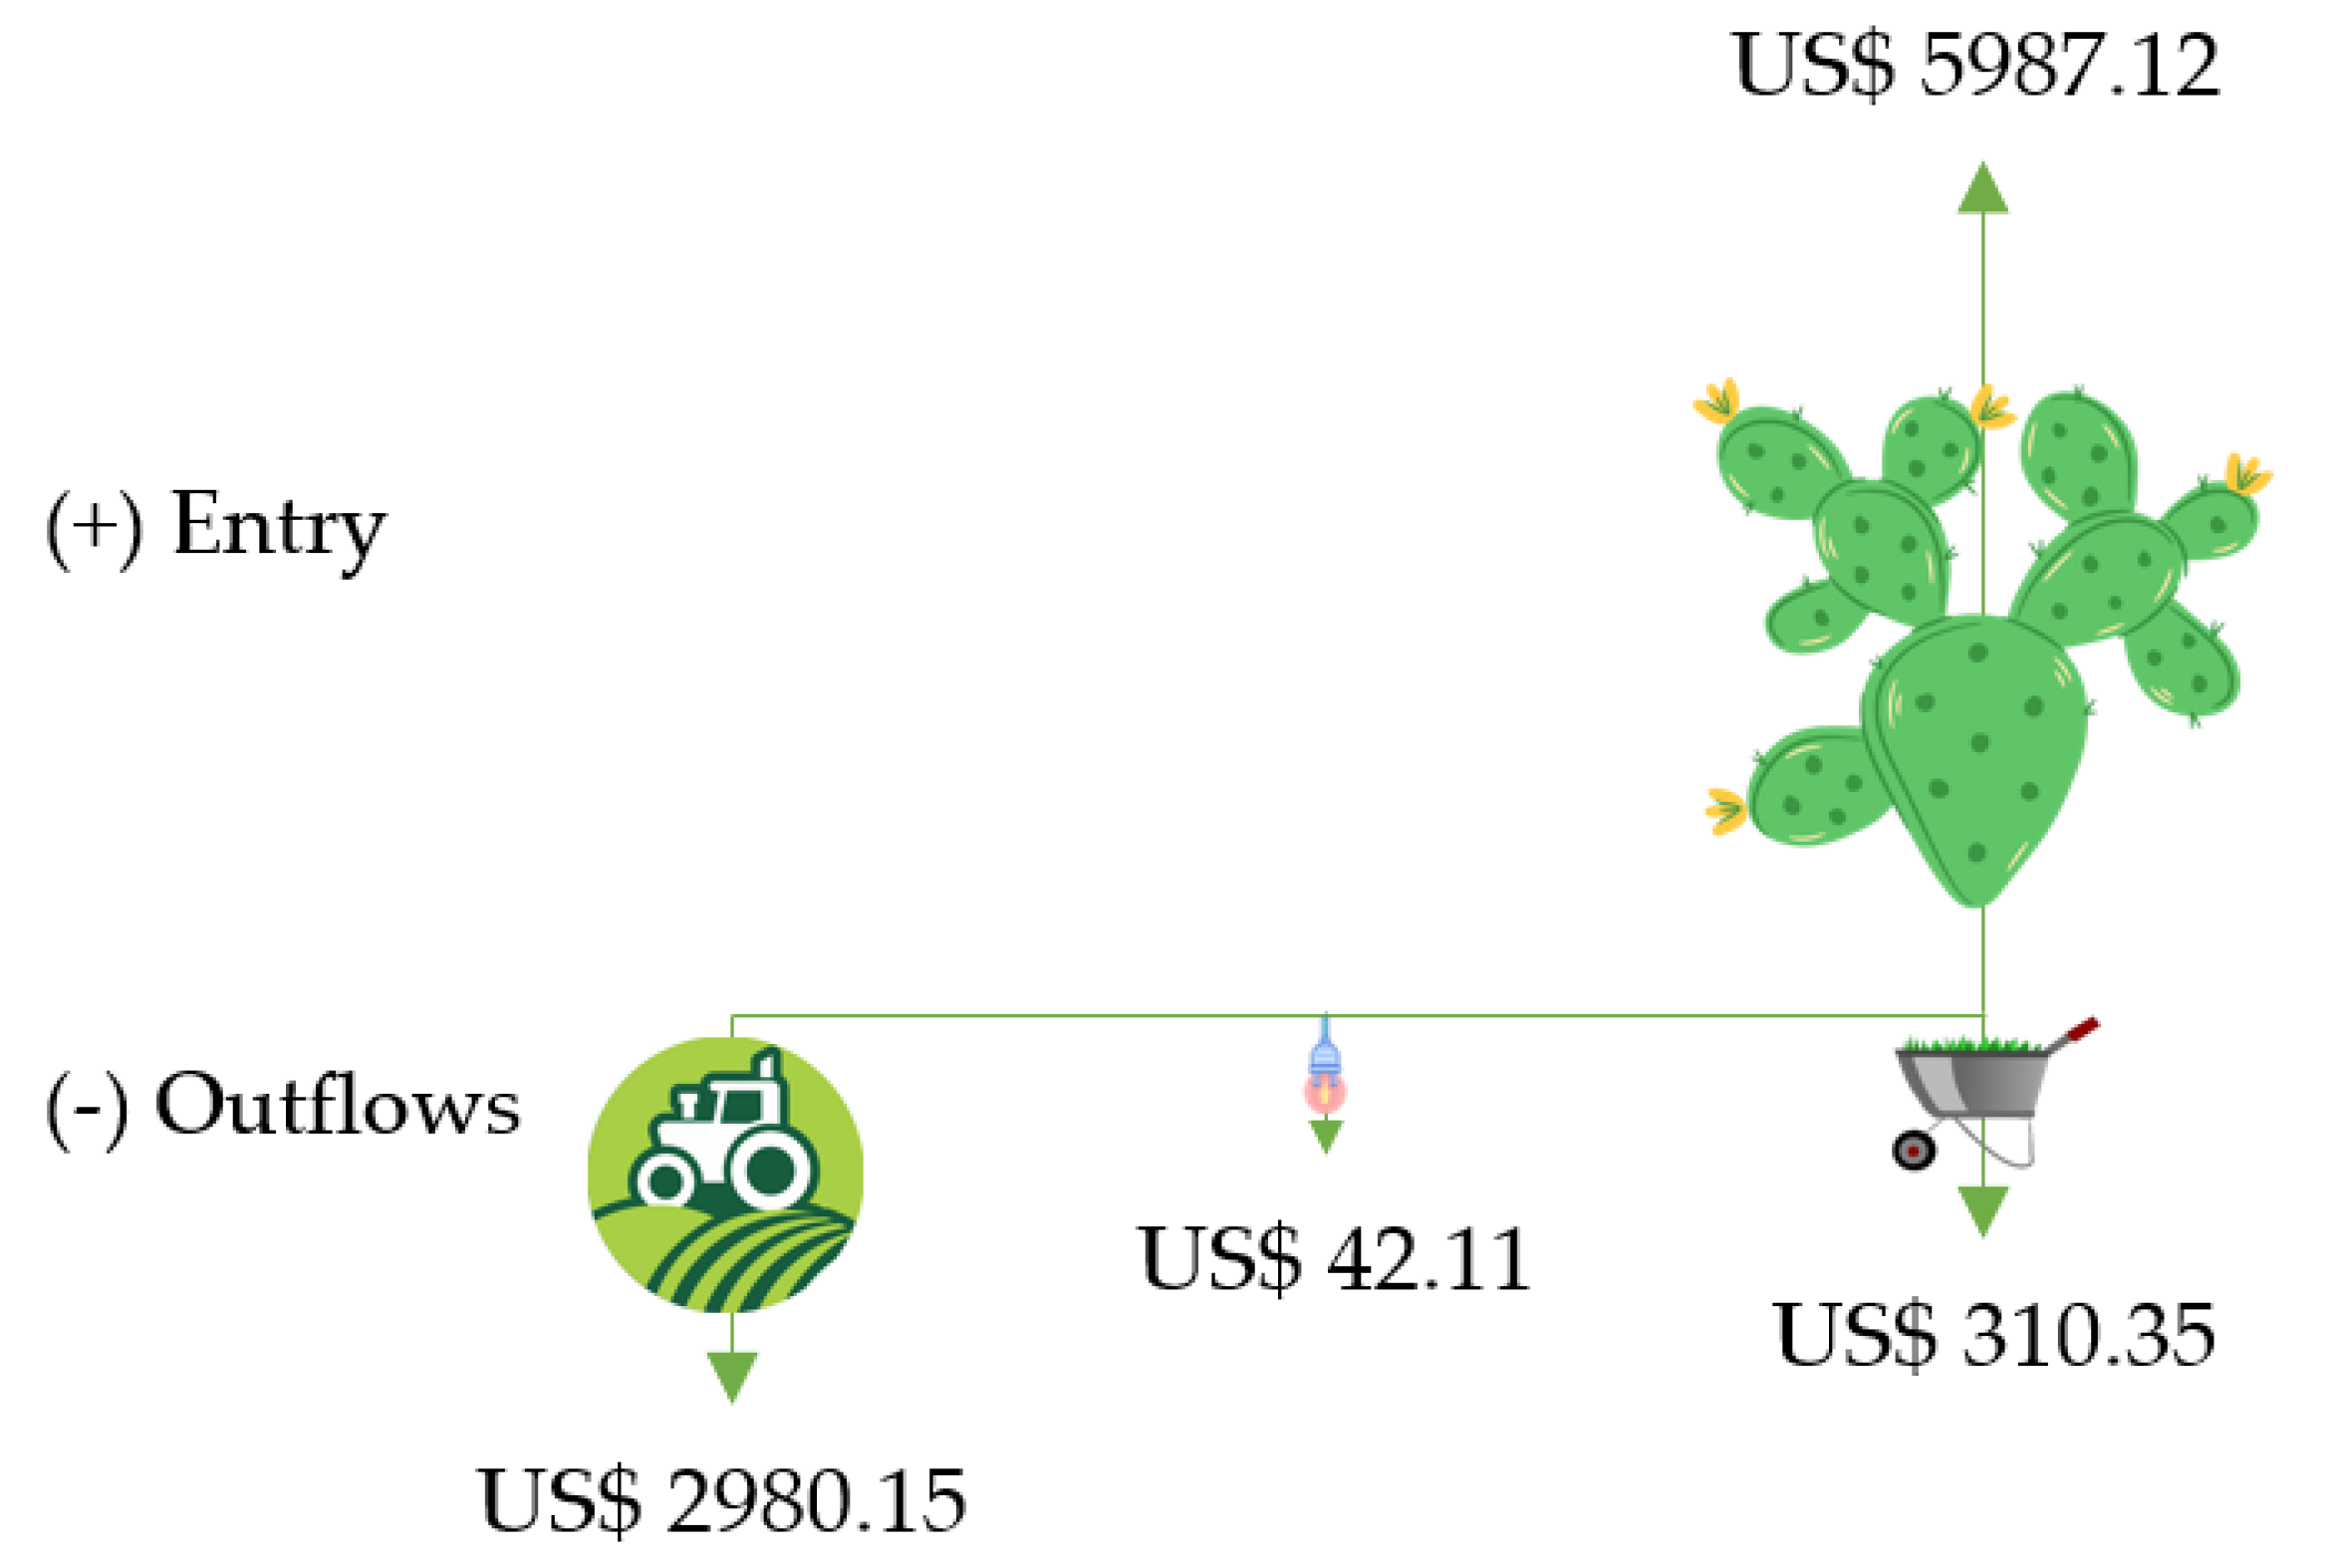
2.4. Economic Analysis of the Cropping System

The production process (for one hectare of planted area) considered the price of purchase of cladodes for planting and manure (organic fertilizer), and the human and mechanized labor. The purchase and depreciation of machinery were not considered, since the machinery would be leased [34,35].
The financial viability analysis was carried out through discounted profits and expenses using the cash flow method [58]. The Net Present Value of investment (NPV) and the Internal Rate of Return (IRR) for the production of forage cactus were measured. The temporal plane was only the first rotation of the forage cactus, considered to be three years.
The NPV transfers to the initial period of analysis all the future cash flow of the study, with a discount rate (r), rhe r, of 8% [35,58]. The purpose of the NPV is to identify whether the investment made has a return greater than its cost [59]. When the result shows a positive NPV, the project is viable, while a negative NPV indicates a return below the minimum assumed rate and an economic unviability. The NPV was obtained according to Equation (12).
N P V = I + ( t = 1 ) n F C 1 ( 1 + r ) t
where I is the initial investment; t is the time (in years); n is the total project time (3 years); r is the discounted rate (8.0%), and FC is the cash flow per period.
The project is accepted if the Internal Rate of Return (IRR) is greater than the r and rejected otherwise. This indicator guarantees that the investor obtains, at least, the required rate of return and was calculated using Equation (13).
0 = I + ( t = 1 ) n F C 1 ( 1 + I R R ) t
where I is the Initial investment; t is time (in years); n is total project time (3 years), and IRR is Internal Rate of Return (8.0%).
In order to apply the NPV and IRR financial instruments, it was necessary to determine the prices of all necessary items in the cultivation system, from the planting stage to the harvest. The data used were extracted from the literature, following the common cultivation conditions in the Brazilian Northeast semi-arid region [34,35,60]. Table 8 shows the prices of the items used in the investment phase.
Investments in planting cladodes, animal manure, herbicides, labor for cleaning the land, planting, fertilizing and applying pesticides, tractor plowing, furrowing, and subsoiling were considered as initial investments, that is, were carried out in period 0 of the project’s cash flow. The investment in harvesting labor was considered to be paid in the second period of the cash flow. Finally, the investment in electricity was divided into two equal parts between period 1 and 2.
To calculate the income, we assumed the mass of each plant at the time of harvest, the spacing of plants in the field and the market price of the cladodes. Equations (14) and (15) were used to calculate the final sales weight (Wfinal) and revenue, respectively. The number of cladodes per plant was 5.58 and the mass of each cladode 1 kg [54,55].
W f i n a l = N u m b e r   o f   c l a d o d e s   p l a n t e d ×   N u m b e r   o f   c l a d o d e s   p e r   p l a n t × C l a d o d e   m a s s ( k g )
S a l e s   r e v e n u e = W f i n a l ( k g )   ×   C l a d o d e   u n i t   ( R $ )
After calculating the values of the final cactus mass and the revenue from its sales, the cash flow for the period between the first investment made and the receipt of the value referring to the commercialized cladodes was constructed (Figure 1).

3. Results and discussions

3.1. Energy Analysis

The total energy required for the production of cactus forage biomass was Eha = 54,008 MJ ha−1 (Table 9); such value is higher than those reported for corn and sweet sorghum crops in Poland, which had energy expenditures of 25,517 MJ ha−1 y−1 and 22,816 MJ ha−1 a−1, respectively [62], and sugarcane, cassava, and corn in Brazil with values of 14,370 MJ ha−1 y−1, 9528 MJ ha−1 y−1, and 15,634 MJ ha−1 y−1, respectively [63].
The cladodes for planting represented the highest energy consumption (32,501 MJ ha−1), followed by fertilizers, herbicides, and pesticides (EFHP), with a third of this amount (8.999 MJ ha−1). The lower consumption was that of lubricants and filters for the machinery (90 MJ ha−1).
Biomass productivity varies according to the genetic potential of plants, soil conditions, climate, and agricultural operations [21]. The energy obtained in the cactus harvest, after two years of cultivation, was 181,357 MJ ha−1 (Table 10), a value higher than other crops such as soybean (67,641 MJ ha−1) and corn (66,971 MJ ha−1) in southern Brazil [64], and lower than sweet sorghum (average of 346,725 MJ ha−1) in Mexico [19].
The energy efficiency was approximately 3.36, that is, the energy at the end of the process was 3.36 times greater than the energy invested (Table 11). Therefore, cultivating Cactus forage (Opuntia ficus-indica), with a moderate level of technological intensity is capable of generating a positive balance energy. According to Schroll [65], an energy efficiency of 2 is already considered reasonable in Denmark’s ecological sustainability development policy. Jankowski et al. [62], in Poland, obtained energy efficiencies of rapeseed (Brassica napus subsp. Napus) and mustard production that ranged from 1.24 to 4.92.
The energy productivity was 0.25, representing a ratio of ¼ of the cactus forage biomass production for each MJ consumed in the crop system (Table 11). This is a smaller value when compared to sweet sorghum, which had energy productivity values ranging from 1.81 to 2.62 [19], and higher value when compared to wheat, which had values ranging from 0.018 to 0.114 [44].
For each kilogram of cactus harvested, 13.50 MJ of energy was obtained (specific energy), which represented a net energy of 127,349 MJ. Such values are greater than those reported for sweet sorghum [19].

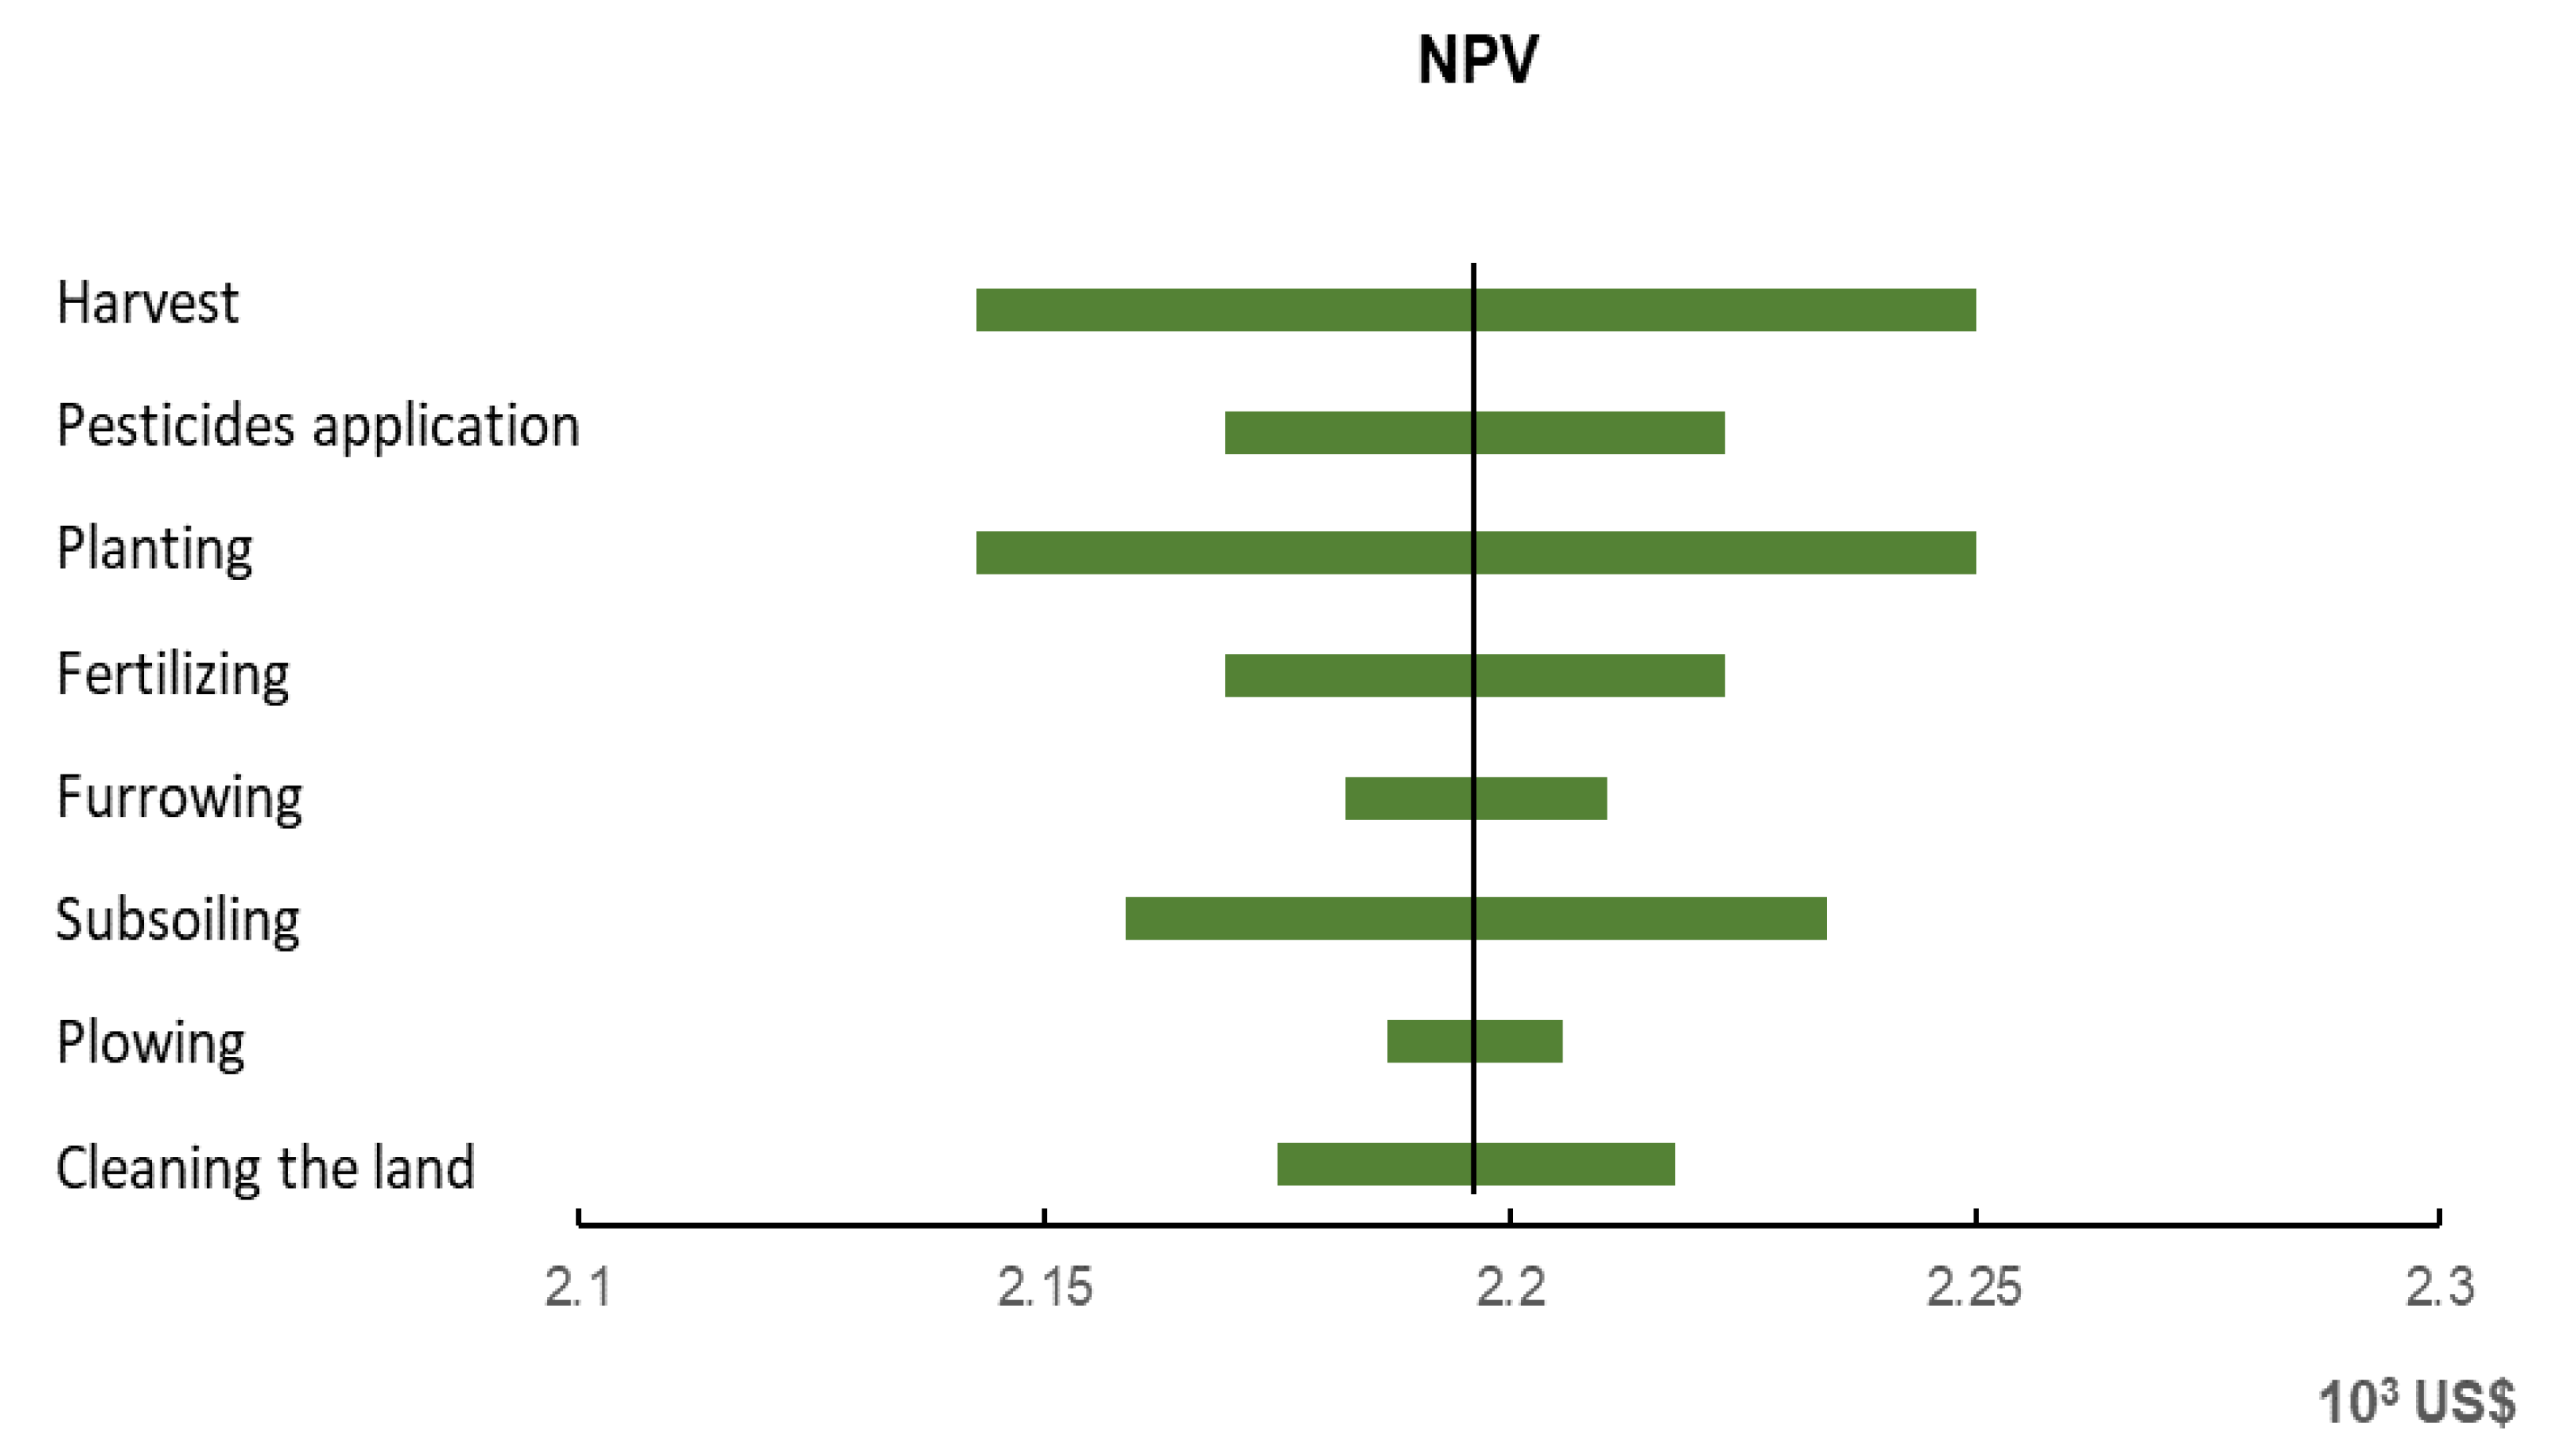
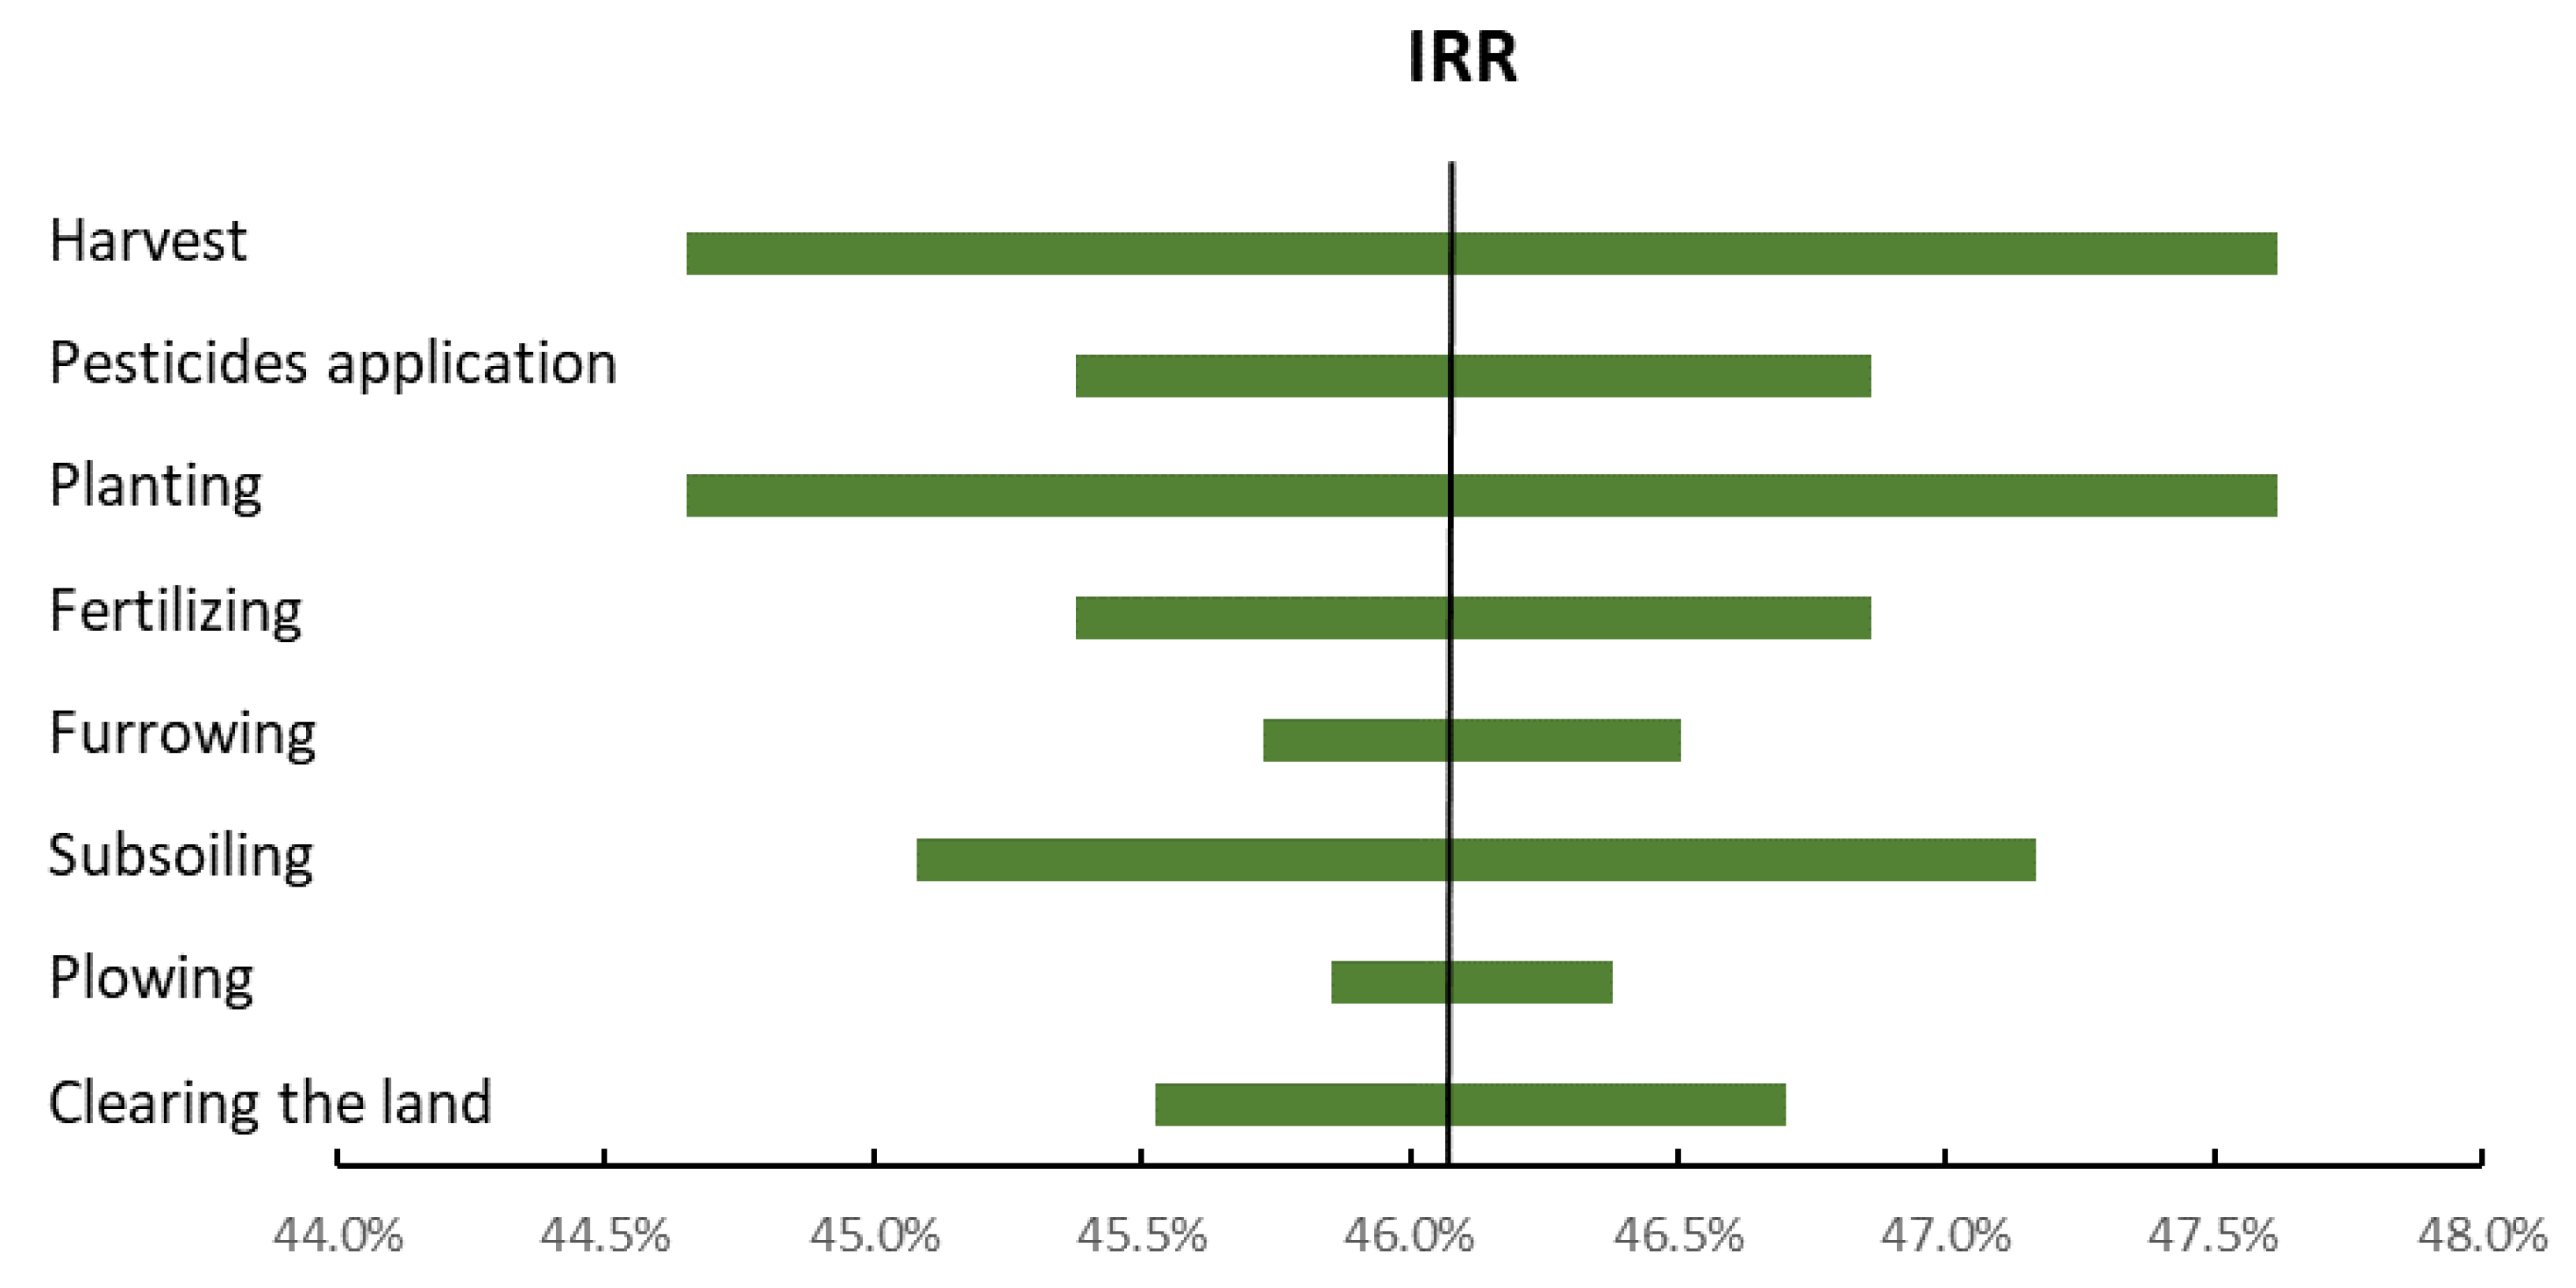
3.2. Economic Analysis

The mass harvested was 139,500 kg and the revenue from its sale was USD 5987. The results indicated economic viability for cultivating cactus forage in Northeast Brazil. The IRR of 46.1% was 5.76 times higher than the r, indicating a highly viable investment that can attract attention to this culture. The NPV was USD 2196, which represents a profitable investment for the producer (Table 12). The highest investment was the purchase of cladodes for planting and, even if the price undergoes a considerable adjustment, the project is economically viable.
The profitability found in this work was lower than in similar studies that evaluated the economic viability of cactus cultivation systems. Dantas et al. [35] found an NPV of USD 22,723) and an IRR of 88%, considering an r of 8%, but considering higher biomass production (300 t ha−1 y−1) and a 10-year time interval. However, both studies were carried out under an irrigated system, which has high costs of production and also a much higher biomass productivity per hectare than the rainfed system we evaluated.
One of the advantages of the cactus system is the positive return in small, planted areas (1 ha), different from that observed for other crops, such as sugarcane, which is only economically viable in areas above 51 ha [66]. Naturally, larger cactus areas would have higher returns, given that the profitability of the system should increase, due to lower logistical costs [13,67].
The price of the cladodes for planting was the largest cost associated with the crop system (Table 7). Due to the large extension of the semi-arid region in Brazil, this price tends to be one of the variables with the greatest variability; thus, different scenarios were simulated for different prices and their influence on the associated NPV and IRR (Table 13). It is important to mention that Cactus forage is cultivated in all states with the existence of this climate condition in Brazil.
Scenarios were also simulated for different cactus cladodes sales values. The high costs with the establishment of crops is a specificity of this and other crops with vegetative reproduction, such as sugarcane, when compared to crops such as corn, sorghum, and millet. The costs of planting sorghum in India were estimated at USD 1218, while that of millet at USD 1133.
In all scenarios, the business showed economic viability. Keeping the other variables with constant costs and revenues, the investment becomes unfeasible from the purchase price of cladodes of USD 0.13 and the sale of cactus below USD 0.02.
Another extremely important variable is associated with the average growth of the cactus plant. Silva et al. [55] suggested an average value of 5.58 cladodes in each plant, every two years. Table 14 presents different growth scenarios.
For the other variables, the sensitivity analysis was carried out considering a variation of 20%, up and down (Figure 2). The harvest and planting variables had the greatest impacts on NPV and IRR. It is important to emphasize that technological optimizations can result in lower costs and, consequently, increased economic returns.
Plowing, subsoiling and furrowing involved expenditure on renting machines, the sensitivity analysis showed that these agricultural practices do not represent a high cost, nor can they make the business unfeasible, as long as they have low fluctuations. In the Northeast Brazil, it is common to have large local variability, which makes this assessment important. Renting the machines is advantageous in the short term, considering that depreciation costs can be neglected. Kaneko et al. [68] evaluated the outsourcing of these processes for sugarcane production, in São Paulo state, Brazil, and identified IRR lower than discount rate and negative NPV.

4. Conclusions

In general, the spineless cactus cultivation system in the semi-arid region of Brazil had energetic and economic viability. Large variations in the purchase and sale values of the cactus biomass could turn the production system unfeasible, but variations of up to 20% in the prices of other inputs and processes would not make it unfeasible.
These results, although initial, stimulate the sustainable production of spineless cactus in semi-arid areas and guide investors. In several locations around the world, there are indications that the production of cactus for the purpose of biogas production is possible and viable. The main limitation was the availability of data on spineless cactus production in a semi-arid region. Subsequent work needs to assess not only the production of biomass, but also incorporate the transport and processing of spineless cactus in the conditions of the Brazilian Northeast, and may also include risks in financial analyses.

Author Contributions

Conceptualization, J.B.d.S., E.P.S.J., J.G.T.P. and E.D.D.; methodology, J.B.d.S., E.P.S.J., J.G.T.P., E.D.D. and P.R.J.; validation, E.V.d.S.B.S., A.T.S., R.S.C.M., E.D.D. and P.R.J.; formal analysis, J.B.d.S., E.P.S.J. and J.G.T.P.; investigation, J.B.d.S., E.P.S.J. and J.G.T.P.; resources, R.S.C.M. and E.D.D.; data curation, J.B.d.S., E.P.S.J. and J.G.T.P.; writing—original draft preparation, J.B.d.S., E.P.S.J. and J.G.T.P.; writing—review and editing, E.V.d.S.B.S., A.T.S., R.S.C.M., E.D.D. and P.R.J.; visualization, E.V.d.S.B.S., A.T.S., R.S.C.M., E.D.D. and P.R.J.; supervision, E.D.D.; project administration, A.T.S., R.S.C.M. and E.D.D.; funding acquisition, R.S.C.M. and P.R.J. All authors have read and agreed to the published version of the manuscript.

Funding

This research was funded by CNPq Universal Palma, grant number 421779/2018-7 and the Federal University of Paraiba—UFPB for funding the APC.

Institutional Review Board Statement

Not applicable.

Informed Consent Statement

Not applicable.

Data Availability Statement

Not applicable.

Acknowledgments

The authors acknowledge the Brazilian National Council for Scientific and Technological Development—CNPq (grants: 465764/2014-2; 441305/2017-2; 308021/2019-3), Coordination for the Improvement of Higher Education Personnel—CAPES (grants: 88887.136369/2017-00; 88887.507561/2020-00; 88887.571633/2020-00), FACEPE (APQ- 0176-19; Project Biotec-Semiárido APQ- 1379-9.25/21), MCTI for financial support, PEGASUS (grant: 441305/2017–2), the Paraíba State Research Foundation—FAPESQ Brazil (Process 3060/2021) and the Federal University of Paraiba, Brazil (grant: PVK13150-2020). This work is part of the National Observatory of Water and Carbon Dynamics in the Caatinga Biome—NOWCDCB, supported by FACEPE (grants: APQ-0296-5.01/17; APQ-0498-3.07/17 ONDACBC; APQ-0532-5.01/14), CNPq and CAPES.

Conflicts of Interest

The authors declare no conflict of interest.

Abbreviations

ETTotal energy
EMEnergy in materials, manufacturing, and transportation
EFEnergy in fuel
ELFEnergy in lubricants and filters
EMREnergy in maintenance and repairs
ESEnergy in seeds
EFHPEnergy in fertilizers, herbicides, and pesticides
ELEnergy in labor
EEEnergy in electricity
MTMass of the tractor
MMMass of the machinery
TITractor useful life
AIAgricultural implements useful life
CMCapacity of the machines
DMDry matter
EECLAEnergy equivalents of the planted cladodes
EEFEREnergy equivalents of the fertilizers used
EEHEREnergy equivalents of herbicides
EEPESEnergy equivalents of pesticides
EmanEnergy equivalents of manual work
EmecEnergy equivalents of mechanical work
LCPLower calorific power
NPVNet Present Value
IRRInternal Rate of Return

References

  1. Neupane, D.; Mayer, J.A.; Niechayev, N.A.; Bishop, C.D.; Cushman, J.C. Five-year field trial of the biomass productivity and water input response of cactus pear (Opuntia spp.) as a bioenergy feedstock for arid lands. GCB Bioenergy 2021, 13, 719–741. [Google Scholar] [CrossRef]
  2. Menezes, R.S.C.; Sampaio, E.V.S.B. Simulação dos Fluxos e Balanços de Fósforo em Uma Unidade de Produção Agrícola Familiar no Semi-Árido Paraibano. Agricultura Familiar e Agroecologia no Semi-Árido; Avanços a partir do Agreste da Paraíba: Rio de Janeiro, Brazil, 2002; pp. 249–260. [Google Scholar]
  3. Bravo-Avilez, D.; Zavala-Hurtado, J.A.; Rendón-Aguilar, B. Evolution under domestication of correlated traits in two edible columnar cacti in Mexico. Evol. Ecol. 2022, 36, 33–54. [Google Scholar] [CrossRef]
  4. Dubeux, J.C.B.; Santos, M.V.F.D.; Cunha, M.V.D.; Santos, D.C.D.; Souza, R.T.D.A.; Mello, A.C.L.D.; Souza, T.C.D. Cactus (Opuntia and Nopalea) nutritive value: A review. Anim. Feed Sci. Technol. 2021, 275, 114890. [Google Scholar] [CrossRef]
  5. Grace, O.M. Succulent plant diversity as natural capital. Plants People Planet 2019, 1, 336–345. [Google Scholar] [CrossRef]
  6. Cortázar, V.G.; Varnero, M.T. Produção de energia. In Agroecologia, Cultivos e Usos da Palma Forrageira; (Paraíba: SEBRAE/PB); Barbera, G., Inglese, P., Eds.; SEBRAE/PB: João Pessoa, Brazil, 2001; pp. 187–210. [Google Scholar]
  7. Neves, F.P.; Spínola, A.M.; das Chagas, M.C.M.; de Carvalho Neves, J.D.; Küster, I.S.; de Figueiredo, M.R.P.; de Oliveira, F.S.; de Oliveira, E.F.; Pereira, S.L. Palma Forrageira: Opção e Potencialidades para Alimentação Animal e Humana em Propriedades Rurais do Estado do Espírito Santo; Incaper: Vitória, Brazil, 2020; Volume 276. [Google Scholar]
  8. Pereira, L.G.; Cavalett, O.; Bonomi, A.; Zhang, Y.; Warner, E.; Chum, H.L. Comparison of biofuel life-cycle GHG emissions assessment tools: The case studies of ethanol produced from sugarcane, corn, and wheat. Renew. Sustain. Energy Rev. 2019, 110, 1–12. [Google Scholar] [CrossRef]
  9. Cushman, J.C.; Davis, S.C.; Yang, X.; Borland, A.M. Development and use of bioenergy feedstocks for semi-arid and arid lands. J. Exp. Bot. 2015, 66, 4177–4193. [Google Scholar] [CrossRef] [PubMed] [Green Version]
  10. Santos, T.D.N.; Dutra, E.D.; Gomes do Prado, A.; Leite, F.C.B.; de Souza, R.D.F.R.; dos Santos, D.C.; Moraes de Abreu, C.A.; Simões, D.A.; de Morais, M.A., Jr.; Menezes, R.S.C. Potential for biofuels from the biomass of prickly pear cladodes: Challenges for bioethanol and biogas production in dry areas. Biomass Bioenergy 2016, 85, 215–222. [Google Scholar] [CrossRef]
  11. Alencar, B.R.A.; Dutra, E.D.; Sampaio, E.V.D.S.B.; Menezes, R.S.C.; Morais, M.A. Enzymatic hydrolysis of cactus pear varieties with high solids loading for bioethanol production. Bioresour. Technol. 2018, 250, 273–280. [Google Scholar] [CrossRef]
  12. Quintero-Angel, M.; González-Acevedo, A. Tendencies and challenges for the assessment of agricultural sustainability. Agric. Ecosyst. Environ. 2018, 254, 273–281. [Google Scholar] [CrossRef]
  13. Patel, B.; Patel, A.; Syed, B.A.; Gami, B.; Patel, P. Assessing economic feasibility of bio-energy feedstock cultivation on marginal lands. Biomass Bioenergy 2021, 154, 106273. [Google Scholar] [CrossRef]
  14. Mazzeo, D.; Baglivo, C.; Matera, N.; Congedo, P.M.; Oliveti, G. A novel energy-economic-environmental multi-criteria decision-making in the optimization of a hybrid renewable system. Sustain. Cities Soc. 2020, 52, 101780. [Google Scholar] [CrossRef]
  15. Pimentel, D.; Hurd, L.E.; Bellotti, A.C.; Forster, M.J.; Oka, I.N.; Sholes, O.D.; Whitman, R.J. Food Production and the Energy Crisis. Science 1973, 182, 443–449. [Google Scholar] [CrossRef] [PubMed]
  16. Pervanchon, F.; Bockstaller, C.; Girardin, P. Assessment of energy use in arable farming systems by means of an agro-ecological indicator: The energy indicator. Agric. Syst. 2002, 72, 149–172. [Google Scholar] [CrossRef]
  17. Karimi, M.; Pour, A.R.; Tabatabaeefar, A.; Borghei, A. Energy analysis of sugarcane production in plant farms—A case study in Debel Khazai agro-industry in Iran. Am. Eurasian J. Agric. Environ. Sci. 2008, 4, 165–171. [Google Scholar]
  18. Rafiee, S.; Mousavi Avval, S.H.; Mohammadi, A. Modeling and sensitivity analysis of energy inputs for apple production in Iran. Energy 2010, 35, 3301–3306. [Google Scholar] [CrossRef]
  19. López-Sandin, I.; Gutiérrez-Soto, G.; Gutiérrez-Díez, A.; Medina-Herrera, N.; Gutiérrez-Castorena, E.; Zavala-García, F. Evaluation of the Use of Energy in the Production of Sweet Sorghum (Sorghum Bicolor (L.) Moench) under Different Production Systems. Energies 2019, 12, 1713. [Google Scholar] [CrossRef] [Green Version]
  20. Hiloidhari, M.; Haran, S.; Banerjee, R.; Rao, A.B. Life cycle energy–carbon–water footprints of sugar, ethanol and electricity from sugarcane. Bioresour. Technol. 2021, 330, 125012. [Google Scholar] [CrossRef]
  21. Jankowski, K.J.; Budzyński, W.S.; Kijewski, Ł. An analysis of energy efficiency in the production of oilseed crops of the family Brassicaceae in Poland. Energy 2015, 81, 674–681. [Google Scholar] [CrossRef]
  22. Macedo, I.; Terra, J.A.; Siri-Prieto, G.; Velazco, J.I.; Carrasco-Letelier, L. Rice-pasture agroecosystem intensification affects energy use efficiency. J. Clean. Prod. 2021, 278, 123771. [Google Scholar] [CrossRef]
  23. Rahman, S.; Hasan, M.K. Energy productivity and efficiency of wheat farming in Bangladesh. Energy 2014, 66, 107–114. [Google Scholar] [CrossRef] [Green Version]
  24. Mohammadi, A.; Rafiee, S.; Jafari, A.; Keyhani, A.; Mousavi-Avval, S.H.; Nonhebel, S. Energy use efficiency and greenhouse gas emissions of farming systems in north Iran. Renew. Sustain. Energy Rev. 2014, 30, 724–733. [Google Scholar] [CrossRef]
  25. Moreno, M.M.; Lacasta, C.; Meco, R.; Moreno, C. Rainfed crop energy balance of different farming systems and crop rotations in a semi-arid environment: Results of a long-term trial. Soil Tillage Res. 2011, 114, 18–27. [Google Scholar] [CrossRef] [Green Version]
  26. Taner, A.; Arısoy, R.Z.; Kaya, Y.; Gültekin, İ.; Partigöç, F. Comparison of energy of planting methods in wheat production in a semi-arid region. Arch. Agron. Soil Sci. 2021, 67, 1961–1973. [Google Scholar] [CrossRef]
  27. Sahabi, H.; Feizi, H.; Amirmoradi, S. Which crop production system is more efficient in energy use: Wheat or barley? Environ. Dev. Sustain. 2013, 15, 711–721. [Google Scholar] [CrossRef]
  28. Testa, R.; Foderà, M.; Di Trapani, A.M.; Tudisca, S.; Sgroi, F. Giant reed as energy crop for Southern Italy: An economic feasibility study. Renew. Sustain. Energy Rev. 2016, 58, 558–564. [Google Scholar] [CrossRef]
  29. Sgroi, F.; Di Trapani, A.M.; Foderà, M.; Testa, R.; Tudisca, S. Economic assessment of Eucalyptus (spp.) for biomass production as alternative crop in Southern Italy. Renew. Sustain. Energy Rev. 2015, 44, 614–619. [Google Scholar] [CrossRef]
  30. Hauk, S.; Knoke, T.; Wittkopf, S. Economic evaluation of short rotation coppice systems for energy from biomass—A review. Renew. Sustain. Energy Rev. 2014, 29, 435–448. [Google Scholar] [CrossRef]
  31. Testa, R.; Di Trapani, A.M.; Foderà, M.; Sgroi, F.; Tudisca, S. Economic evaluation of introduction of poplar as biomass crop in Italy. Renew. Sustain. Energy Rev. 2014, 38, 775–780. [Google Scholar] [CrossRef]
  32. Styles, D.; Thorne, F.; Jones, M.B. Energy crops in Ireland: An economic comparison of willow and Miscanthus production with conventional farming systems. Biomass Bioenergy 2008, 32, 407–421. [Google Scholar] [CrossRef]
  33. Ramos, J.; Ramos, J.P.F.; Santos, E.M.; Freitas, F.F.D.; Candido, E.P.; Lima Junior, A.C.D.; Leite, M.L.V.; Oliveira Junior, S.D. Caracterização técnica dos sistemas de produção de palma forrageira em Soledade, PB. Agropecuária Técnica 2014, 35, 23–30. [Google Scholar] [CrossRef]
  34. Lima, G.F.C.; Wanderley, A.M.; Guedes, F.X.; Rego, M.M.T.; Dantas, F.D.G.; Silva, J.G.M.; Novaes, L.P.; Aguiar, E.M. Palma Forrageira Irrigada e Adensada: Uma Reserva Forrageira Estratégica para o Semiárido Potiguar; EMPARN, Parnamirim: Rio Grande do Norte, Brazil, 2015. [Google Scholar]
  35. Dantas, S.F.D.A.; Lima, G.F.D.C.; Mota, E.P.D. Viabilidade econômica da produção de palma forrageira irrigada e adensada no semiárido Potiguar. Rev. IPecege 2017, 3, 59–74. [Google Scholar] [CrossRef] [Green Version]
  36. Rondón, P.P.; Rodríguez, Y.S. Costo energético de la cosecha mecanizada del arroz en Cuba. Rev. Cienc. Técnicas Agropecu. 2006, 15, 19–23. [Google Scholar]
  37. De las Cuevas Milán, H.R.; Rodríguez Hernández, T.; Paneque Rondón, P.; Díaz Álvarez, M. Costo energético del rodillo de cuchillas CEMA 1400 para cobertura vegetal. Rev. Cienc. Técnicas Agropecu. 2011, 20, 53–56. [Google Scholar]
  38. Acaroglu, M.; Aksoy, S.A. The cultivation and energy balance of Miscanthus  giganteus production in Turkey. Biomass Energy 2005, 29, 42–48. [Google Scholar] [CrossRef]
  39. Kitani, O.; Jungbluth, T.; Peart, R.M.; Ramdani, A. Energy and biomass engineering. In CIGR Handbook of Agricultural Engineering; American Society of Agricultural Engineers: St Joseph, MI, USA, 1999; p. 17. [Google Scholar]
  40. Mittal, S.P.; Singh, P. Studies on Intercropping of Field Crops with Foddercrops of Subabul under Rainfed Conditions; Annual Report; Central Soil & Water Conservation Research and Training Institute: Dehra Dun, India, 1983. [Google Scholar]
  41. Hatirli, S.A.; Ozkan, B.; Fert, C. An econometric analysis of energy input-output in Turkish agriculture. Renew. Sustain. Energy Rev. 2005, 9, 608–623. [Google Scholar] [CrossRef]
  42. Yilmaz, I.; Akcaoz, H.; Ozkan, B. An analysis of energy use and input costs for cotton production in Turkey. Renew. Energy 2005, 30, 145–155. [Google Scholar] [CrossRef]
  43. Meul, M.; Nevens, F.; Reheul, D.; Hofman, G. Energy use efficiency of specialised dairy, arable and pig farms in Flanders. Agric. Ecosyst. Environ. 2007, 119, 135–144. [Google Scholar] [CrossRef]
  44. Tabatabaeefar, A.; Emamzadeh, H.; Varnamkhasti, M.; Rahimizadeh, R.; Karimi, M. Comparison of energy of tillage systems in wheat production. Energy 2009, 34, 41–45. [Google Scholar] [CrossRef]
  45. Vilche, M.S. El uso de la energía en los sistemas agropecuarios del distrito de Zavalla (Santa Fé). Rev. Científica Agropecuaria. 2006, 10, 7–19. [Google Scholar]
  46. Fluck, R.C. Energy Sequestered in Repairs and Maintenance of Agricultural Machinery. Trans. ASAE 1985, 28, 738–744. [Google Scholar] [CrossRef]
  47. Balastreire, L.A. Máquinas Agrícolas; Manole: São Paulo, Brazil, 1987; p. 307. [Google Scholar]
  48. Pacheco, E.P. Seleção e Custo Operacional de Máquinas Agrícolas; Embrapa Acre: Rio Branco, Brazil, 2000; p. 21. [Google Scholar]
  49. Rondón, P.P.; Fernandes, H.C.; Oliveira, A.D. Comparación de cuatro sistemas de labranza/siembra en relación con su costo energético. Rev. Ciências Técnicas Agropecu. 2002, 11, 1–6. [Google Scholar]
  50. Rondón, P.P.P. Gastos energéticos de la poda mecanizada en las plantaciones citrícolas de Cuba. Rev. Cienc. Técnicas Agropecu. 2000, 9, 23–28. [Google Scholar]
  51. Ibañez, M.; Rojas, E. Costos de Operación y Producción por Concepto de Maquinaria Agrícola; Boletin de Ext. No 26; Universidad de Concepción, Facultad de Ingeniería Agrícola: Concepción, Chile, 1994; p. 58. [Google Scholar]
  52. Ren, L.T.; Liu, Z.X.; Wei, T.Y.; Xie, G.H. Evaluation of energy input and output of sweet sorghum grown as a bioenergy crop on coastal saline-alkali land. Energy 2012, 47, 166–173. [Google Scholar] [CrossRef]
  53. Valadares Filho, S.C.; Cabral, L.S. Aplicação dos princípios de nutrição de ruminantes em regiões tropicais. Reun. Anu. Soc. Bras. Zootec. 2002, 39, 514–543. [Google Scholar]
  54. Oliveira, A.S.C. A palma forrageira: Alternativa para o Semi-árido. Rev. Verde Agroecol. Desenvolv. Sustentável 2011, 6, 49–58. [Google Scholar]
  55. Silva, L.M.D.; Fagundes, J.L.; Viegas, P.A.A.; Muniz, E.N.; de Albuquerque Rangel, J.H.; Moreira, A.L.; Backes, A.A. Produtividade da palma forrageira cultivada em diferentes densidades de plantio. Ciência Rural 2014, 44, 2064–2071. [Google Scholar] [CrossRef] [Green Version]
  56. Tabatabaie, S.M.H.; Rafiee, S.; Keyhani, A.; Ebrahimi, A. Energy and economic assessment of prune production in Tehran province of Iran. J. Clean. Prod. 2013, 39, 280–284. [Google Scholar] [CrossRef]
  57. Nabavi-Pelesaraei, A.; Rafiee, S.; Hosseinzadeh-Bandbafha, H.; Shamshirband, S. Modeling energy consumption and greenhouse gas emissions for kiwifruit production using artificial neural networks. J. Clean. Prod. 2016, 133, 924–931. [Google Scholar] [CrossRef]
  58. Tao, J.Y.; Finenko, A. Moving beyond LCOE: Impact of various financing methods on PV profitability for SIDS. Energy Policy 2016, 98, 749–758. [Google Scholar] [CrossRef]
  59. Chen, S.; Feng, H.; Zheng, J.; Ye, J.; Song, Y.; Yang, H.; Zhou, M. Life Cycle Assessment and Economic Analysis of Biomass Energy Technology in China: A Brief Review. Processes 2020, 8, 1112. [Google Scholar] [CrossRef]
  60. Lima, D.O.; Araújo, C.D.A.; Melo, L.M.D. Análise descritiva do custo de implantação de palma forrageira em plantio de sequeiro no Semiárido alagoano: Um estudo de caso. Divers. J. 2020, 5, 1271–1280. [Google Scholar] [CrossRef]
  61. Superintendência do Desenvolvimento do Nordeste—SUDENE; Instituto Nacional do Semiárido—INSA. Documento de referência sobre palma forrageira. [S.l.]: Superintendência do Desenvolvimento do Nordeste—SUDENE. 2020. Available online: https://www.gov.br/sudene/pt-br/centrais-de-conteudo/documento-de-referncia-palma-sudene-verso-05-03-20-final-pdf (accessed on 10 May 2022).
  62. Jankowski, K.J.; Dubis, B.; Sokólski, M.M.; Załuski, D.; Bórawski, P.; Szempliński, W. Productivity and energy balance of maize and sorghum grown for biogas in a large-area farm in Poland: An 11-year field experiment. Ind. Crops Prod. 2020, 148, 112326. [Google Scholar] [CrossRef]
  63. Salla, D.A.; Cabello, C. Análise Energética de Sistemas de Produção de Etanol de Mandioca, Cana-de-Açúcar e Milho. Energ. NA Agric. 2010, 25, 32. [Google Scholar] [CrossRef] [Green Version]
  64. Melo, D.D.; Pereira, J.O.; Souza, E.G.D.; Filho, A.G.; Nóbrega, L.H.P.; Neto, R.P. Balanço energético do sistema de produção de soja e milho em uma. Acta Sci. Agron. 2007, 29, 173–178. [Google Scholar] [CrossRef]
  65. Schroll, H. Energy-flow and ecological sustainability in Danish agriculture. Agric. Ecosyst. Environ. 1994, 51, 301–310. [Google Scholar] [CrossRef]
  66. Santos, D.F.L.; Souza, C.A.F.; Farinelli, J.B.D.M.; Silva, B.L.D.; Horita, K. Análise Econômica da Produção de Cana-de-Açúcar em Diferentes Pacotes Tecnológicos. Rev. Estud. Debate 2018, 25, 262–283. [Google Scholar] [CrossRef]
  67. Patel, B.; Patel, M.; Gami, B.; Patel, A. Cultivation of bioenergy crops in Gujarat state: A consultative survey process to understand the current practices of landowners. Environ. Dev. Sustain. 2021, 23, 8991–9013. [Google Scholar] [CrossRef]
  68. Kaneko, F.H.; Tarsitano, M.A.A.; Rapassi, R.M.A.; Chioderolli, C.A.; Nakayama, F.T. Análise Econômica da Produção de Cana-De-Açúcar Considerando-se a Terceirização das Operações Agrícolas: O Caso de um Produtor. Pesq. Agropec. Trop. 2009, 3, 266–270. [Google Scholar]
Figure 1. Cash flow of the cactus (Opuntia ficus-indica) cultivation system in the semi-arid region of Northeast Brazil, in a period of 3 years.
Energies 15 05270 g001
Figure 2. Sensitivity analysis for inputs and processes in cactus production (Opuntia ficus-indica) in the northeastern semi-arid region of Brazil.
Energies 15 05270 g002aEnergies 15 05270 g002b
Table 1. Characteristics of the cultivation system in the Brazilian Northeast region.
VariablesUnitsDescription
Cultivated species-Opuntia ficus-indica
Purpose of the cactus-Biofuel production
Cultivated areaHa1
Crop densityPlants ha−125,000
Planting time-Beginning of the rainy season
Type of planting-Manual
Cladode position-
Clearing the aread h−1 **10
Subsoilingh tractor−1 *8
Plowingh tractor−1 *2
Organic fertilizationt ha−125
Fertilization labord h−1 **12.5
Furrow openingh tractor−1 *3
HerbicideL7
Planting labord h−1 **25
Application of pesticidesd h−1 **12.5
Harvest labord h−1 **35
Note: * Hour Tractor; ** Day man. Source: Adapted [33,34,35].
Table 2. Defining the characteristics of the cultivation system.
VariablesUnitsEnergy Equivalent
(MJ × Unit−1)
Source
Water for irrigation (rain)L1.02[38]
Cladode of Opuntia ficus-indica Kg13.5[10]
FuelL47.8[39]
Animal manureKg0.3[40]
ElectricityKwh11.93[41]
PhosphorusKg12.44[42]
HerbicideL214[43]
PesticideL278[43]
MachineryKg138[44]
NitrogenKg77.5[45]
PotassiumKg11.15[42]
Transport MJ Km−1 h−14.5[44]
Human work h1.95[44]
Mechanized workh1.05[44]
Source: [10,16].
Table 3. Data for EM calculation.
EquipmentDescriptionMass (kg)Lifespan (h)
Small tractor60 HP306510,000
SubsoilerHydraulic, 5 stems.4002000
PlowFixed, 3 disks.4002000
FurrowerSingle line1052000
Source: Adapted [47,48].
Table 4. Data for CM calculation.
MachineryWidth (m)Operating Speed (km h−1)
Subsoiler1.24Between 4 and 7
Plow0.9Between 4 and 8
Furrower0.6Between 4 and 7
Source: [47,50,51].
Table 5. Conversion of deposited energy in materials, manufacturing, and transportation (EM), fuel (EF), lubricants and filters (ELF), and maintenance and repair (EMR) from MJ h−1 to MJ ha−1 from the field productivity factor of 2.89 h ha−1.
ActivityEnergy Deposited (MJ h−1)Converted Energy (MJ ha−1)
EM 104,105.743032.73
EF 621.4017,965.85
ELF 31.07890.79
EMR135.11390.47
Table 6. Data for calculating ES and EFHP.
VariablesUnitsValues
Mass of planted cladodesKg ha−125,000
Mass of fertilizersKg ha−125,000
Volume of herbicidesL ha−17
Dry matter content in cladodes%9.63
Source: [10,34,53].
Table 7. Data for calculation of EMO.
ActivityUnitsAmount
Clearing the landd h−110
Subsoilingh tractor−18
Plowingh tractor−12
Furrow openingh tractor−13
Fertilizingd h−112.5
Plantingd h−125
Pesticide applicationd h−112.5
Harvestd h−125
Source: [34,35].
Table 8. Prices of the forage cactus cropping system.
ServicesUnitQuantitiesUnit Value (USD)Total Amount (USD)Participation
Services
Clearing the landD.M−11010.73107.303.60%
PlowingH.M−1223.6147.211.58%
SubsoilingH.M−1823.61188.846.34%
FurrowingH.M−1323.6170.822.38%
FertilizingD.M−112.510.73134.124.50%
PlantingD.M−12510.73268.249.00%
Pesticide application D.M−112.510.73134.124.50%
HarvestD.M−12510.73268.249.00%
Lease of equipmentsha142.9242.920.07%
Land taxesha12.152.150.07%
Inputs
CladodesUnit25,0000.041072.9636.00%
Animal manuret2521.46536.4818.00%
HerbicideL73.2222.530.76%
ElectricitykWh7200.1284.232.83%
2980.15100%
Revenue
Sale of cladodesUn139,5000.045987.12-
Caption: D.M−1 = Day man; H.M−1 = Hours machine; ha = hectare; t = ton; L = Liter. Source: [10,34,35,60,61].
Table 9. Energy consumed (MJ ha−1) in the production of cactus biomass in the Brazilian Northeast region.
ActivityEnergy Consumed (MJ ha−1)
Machinery303
Fuels1796
Lubricants and filters90
Maintenance and repair390
Cactus cladodes32,501
Fertilizers, herbicides, and pesticides8999
Labor1340
Electricity8590
Total: 54,008
Table 10. Characterization of cactus biomass energy production in the Brazilian Northeast region.
DescriptionUnitsQuantities
Number of plantsPlants ha−125,000
Number of cladodesCladodes plants−15.58
Cutting timeYears2
Cladode weightKg1
Lower calorific valueMJ kg−113.50
Dry matter content%9.63
Energy obtained after harvestMJ ha−1181,357
Source: [49].
Table 11. Energy indicators of cactus biomass production in the Brazilian Northeast region.
IndicatorUnitsValue
Energy efficiency-3.36
Energy productivityKg MJ−10.25
Net energyMJ kg−113.50
Energy balanceMJ ha−1127,349
Table 12. Economic feasibility analysis for cactus biomass production in the Brazilian Northeast region.
Time Course (Year)Cash Flow (USD)Discount Rate
(%)
Cash Flow Corrected to Present Value
0−26288.00−2628
1−44−41
267485254
NPV (USD)2196
IRR (%)46.1
Table 13. Sensitivity of NPV and IRR for different costs of acquisition of cactus cladode seeds and sale of produced cladodes in the Brazilian Northeast production system.
Cost of Cladodes
USD kg−1
Total Cost of Cladodes
USD ha−1
NPV
USD
IRR
%
0.02536.52732.963.7
0.03804.72464.654.1
0.041073.02196.446.1
0.051341.21928.239.2
0.061609.41659.933.2
Total Sale Value
USD ha−1
NPV
USD
IRR
%
0.022993.6−370.10.2
0.034490.3913.225.2
0.045987.12196.446.1
0.057483.93479.764.4
0.068980.74762.980.8
Table 14. NPV and IRR sensitivity for different average cactus plant growth in the Brazilian Northeast production system.
Cladodes Per PlantCladode Productivity ha−1NPV
USD
IRR
%
2.5864,500−563−4.2
3.5889,50035715.0
4.58114,500127631.5
5.58139,500219646.1
6.58164,500311659.4
Publisher’s Note: MDPI stays neutral with regard to jurisdictional claims in published maps and institutional affiliations.

