Abstract
The framework of energy transition poses significant challenges in subtransmission network development, where the increased renewable energy generation is collected, in order to efficiently convey power production, avoiding limitations in a range of operating conditions. In this paper, a method to evaluate possible margins for further renewable penetration due to electric network development is assessed, by means of scenario evaluation for the concretisation of renewable initiatives, combined producibility analysis, and load flow studies, accounting for operation islands in subtransmission network organisation, carried out in N and N-1 conditions. The method is applied to a provisional model of the southern part of the Italian power system.
1. Introduction
The energy transition process toward a decentralised, variable renewable energy system, together with the unbundling of the electricity market, raises several additional complexities to the transmission expansion planning problem. The two challenging climate and energy objectives defined at the European level include reducing net emissions by at least 55% by 2030, compared with 1990, and being the first climate-neutral continent by 2050 [1]; for Italy, this objective determined the upward revision of the 55% initial target of load covered by renewable energy source (RES) generation by 2030, as established in the Integrated National Energy and Climate Plan [2], and up to 65% and even more ambitious targets in the very long-term horizon.
In the restructured environment, the role of the electric transmission infrastructure has overcome the historical functions of connecting concentrated conventional power generation units to load centres while fulfilling the desired security and reliability standards. In fact, the transmission system plays a leading role in enabling new generation capacity to participate in the competitive market, alleviating network congestions, and providing an economic and reliable service to final consumers [3,4]. An efficient and coordinated transmission infrastructure development planning is a crucial aspect in this profound transformation of the energy landscape to face the major concerns in network planning and operation deriving from the progressive thermal synchronous capacity replacement with intermittent, variable power generation [5].
Focusing on Italy, the generation mix has significantly evolved in recent years, as illustrated in Figure 1. In 2005, RES generation covered about 16% of national net energy production (mainly due to hydroelectric power plants), while the percentage has increased up to 42% during 2020 [6], reaching the daily record of 65% on 5 April 2020, proving the growing importance of solar photovoltaic and wind technologies. The generation capacity of these two systems installed in each market zone of the Italian power system (North, Centre North, Centre South, South, Calabria, Sicily, and Sardinia) [7,8] at the end of the year 2020 is represented in Figure 2.
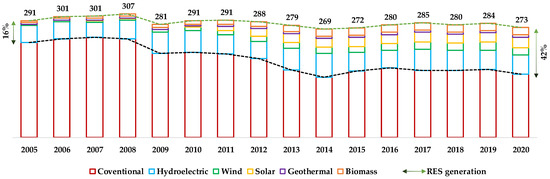
Figure 1.
National net electricity generation by source.
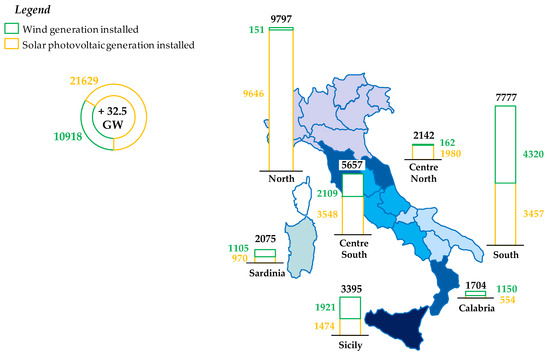
Figure 2.
Solar photovoltaic and wind generation installed in Italy, December 2020 update. Regions of the same color belong to the same market zone of the Italian power system.
Italy’s potential in terms of RES generation is very high: In recent years, an incredible number of new renewable power plant connection requests are being made, as illustrated in Figure 3. Focusing on solar photovoltaic and wind on-shore technologies, about 95 GW, more than 90% of the total connection initiatives (updated to the end of December 2020) concern new generation connection requests to high-voltage subtransmission and extra-high-voltage transmission networks. In addition to these, about 10 GW of RES connection requests to distribution networks can be counted. The incentive mechanisms in force until 2013 allowed the economic sustainability of RES power plants in areas characterised by a minor availability of the primary sources. Since the present regulatory scheme changed, the requests are today concentrated in southern Italy and the main islands, contrary to the current national energy policy scenario (named “National Trend” (NT)) forecast of relevant amounts of RES located in northern Italy. The comparison between the 2030 NT-scenario RES generation increase and the presented initiatives per each zone is depicted in Figure 4.
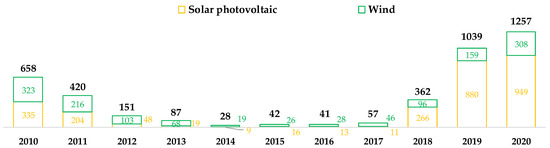
Figure 3.
Number of new solar photovoltaic and wind connection requests evolution in Italy, December 2020 update.
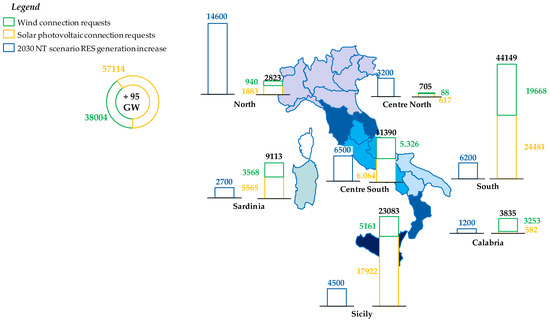
Figure 4.
Comparison (MW) between the current national energy policy scenario RES increase forecast at 2030 year horizon (+39 GW at national level) and the present RES initiatives distribution (December 2020 update) in Italy. Regions of the same color belong to the same market zone of the Italian power system.
In this framework, the proper inclusion of power connection requests to extra-high-voltage (EHV) and high-voltage (HV) networks in planning studies is clearly important, along with the evaluation of a rate of concretisation for RES generation initiatives in compliance with green sources’ energy targets established by the European and national policies [9]. In fact, a rational investment in power system development planning, taking into account the authorisation difficulties and other external factors affecting the commissioning of new RES power plants, is crucial to avoid the risk for the transmission system operator (TSO) of building inefficient transmission capacity. With regard to system operation, the phase-out of conventional synchronous generators (foreseen at the 2025 horizon for the coal-fired plants) implies further concerns regarding the dispatching of great renewable generation quantities collected on active HV subtransmission networks, besides the widely known inertia reduction and frequency control [10].
In the field of research for long-term transmission expansion planning problems assuming a TSO perspective, either developed on test networks or on models of actual power systems, the focus on admissible RES increase is mainly provided in multi-scenario approaches in which increases in power generation are uncorrelated with load forecasts, as for instance, reported in [11,12,13,14,15], whereas other studies adopt a multi-year approach, with predefined and correlated evolution of power generation and load evolution [16,17,18].
In this paper, a comprehensive analysis of a significant real-world case study of the Italian power system characterised by a relevant increase in the RES generation capacity installed toward achieving the policy scenario horizon is performed. A new approach based on the TSO connection request information is used to distribute the RES capacity increase with a nodal detail and to define 150 kV operation islands (obtained by opening the loops at double-busbar substations) useful to collect the solar and wind energy production to be routed to the EHV transmission network. Starting from a future scenario defined as readjusting the 2030 NT renewables national target on the basis of the connection requests, an iterative methodology is proposed to assess the power system performances in a static regime in the presence of growing discrete RES quantities, the most feasible connection solutions, and possible network reinforcements needed to solve overloads and bottlenecks, obtaining an indicator of network-driven RES admissible growth [19].
The setup of the operation islands proves to be useful to enhance the power flow control and the protection system [20].
The main contributions of this paper are:
- -
- The definition of a methodology to implement a process for the dynamic and structured planning of subtransmission networks to allow RES penetration, in the context of energy transition;
- -
- The setup of a procedure to report RES policy targets to region-based quantities and nodal installation amounts useful for network analysis, based on ongoing initiatives;
- -
- The individuation of the combined effect of non-programmable RES (solar photovoltaic and wind) at a regionally detailed level to analyse the stressful network operating conditions;
- -
- The iterative definition of RES admissible growth according to 150 kV operation islands and efficient network reinforcements directly ascribable to RES connection requests.
The rest of the paper is organised as follows: Section 2 deals with the methodology adopted for connection solutions’ assessment, renewable sources’ producibility estimation, operation islands’ definition, and maximum RES generation amount that can be integrated considering the planned network developments evaluation. The case study and the performances of the system under consideration in the static regime are reported in Section 3. Lastly, Section 4 concludes the paper.
2. Methodology
The continuous evolution of the energy system requires the dynamic and structured planning of subtransmission networks to allow RES penetration and energy transition in general. In order to analyse the subtransmission network needs, a multi-step methodology, synthesised with the following points, was developed:
- The setup of a scenario analysis coherent with active connection requests and the 2030 national target regarding the NT-adjusted renewables;
- The selection of the producibility values of RES technologies with a conservative approach, based on historical data series and possible developments;
- The definition of the best network assessment with operation islands;
- Iterative load flow analysis with the aim to detect the maximum RES penetration target in the area under study.
In the following sections, the details of the different phases are discussed.
2.1. Scenario Analysis
In order to set a scenario of analysis consistent with the actual evolution of the power system and the national target of RES penetration, the assumptions about the generation mix and load demand are provided in this section.
The number of requests for new power generation installations, collected by the TSO, is greater than those that will actually be installed. Therefore, planning the transmission and subtransmission infrastructure considering the total number of RES connection requests should result in inefficient network development, due to the expected authorisation and/or economic failures of the projects.
In this paper, the rate of the concretisation of connection requests was defined for different resource technologies, according to the foreseen scenario of analysis [9]:
where
- represents the target fixed for the i-th RES technology increase by the s-th planning scenario at the y-th year horizon (GW);
- represents the total number of the i-th RES technology’s active connection requests to the EHV-HV transmission system (GW);
- represents the total number of the i-th RES technology’s active connection requests to the HV distribution system for which the TSO has visibility (GW).
Through rate of concretisation, the number of new solar and wind power plants to include in the network model was determined; therefore, their distribution in the areas under study was evaluated as follows:
where
- represents the target fixed for the i-th RES technology increase by the s-th planning scenario at the y-th year horizon in the z-th area (GW);
- represents the total number of the i-th RES technology’s active connection requests to the EHV-HV transmission and distribution system in the z-th area (GW).
An analogous approach was used for the nodal distribution of the i-th RES technology increase:
where
- represents the target fixed for the i-th RES technology increase by the s-th planning scenario at the y-th year horizon in the n-th node of the z-th area (GW);
- represents the total number of the i-th RES technology’s active connection requests to the EHV-HV transmission and distribution system in the n-th node of the z-th area (GW).
The active connection requests could fall under different steps of the releasing connection solution process; therefore, in the allocation of new RES capacity installations in the network model, the requests at a more advanced stage of the process were prioritised. The process consists of four phases, assuming the fourth as the less advanced phase. With these assumptions, the target was composed as follows:
with:
- = 1 if ≤ ;
- if > .
2.2. Producibility Values of RES Technologies
In order to identify the optimal set of infrastructure needs, and to avoid the oversizing of projects to be planned, an analysis of RES producibility and load demand historical data series was performed. An hourly producibility value for the i-th RES technology in the z-th area for two historical years was calculated. Based on these values, a correlation matrix was defined, as depicted in Table 1, between the solar and wind technologies’ producibility values to set a producibility value that considers their contemporaneity factor.

Table 1.
Correlation matrix between solar and wind technologies’ producibilities.
The matrix values represents the total number of hours in the historical data series for the z-th area, in which the value of wind technology producibility is within the range shown in the matrix columns, and contemporaneously, the value of solar technology producibility is within the range shown in the matrix rows .
Therefore, the producibility value for the i-th RES technology in the z-th area is established by calculating the average value of the maximum range of contemporaneously producibility values:
In order to consider the technological advancements related to wind turbines and photovoltaic panels enabling major producibility for the same availability of the primary source, the “equivalent hours” of future RES generation were determined according to the last relevant information at hand.
It should be noted that even in the presence of combined RES storage initiatives, the considered contemporaneity of wind and photovoltaic technologies represents the most stressful operating condition for the transmission network under study.
In the range of maximum producibility, the lower load demand was selected. Table 2 summarises the values of the average load demand in the z-th area in each range of the wind and solar technologies’ producibility.
Table 2.
Correlation matrix between RES producibilities and load value.
2.3. Iterative Analysis Method
As mentioned above, in a future scenario with high-RES penetration that causes the flow inversion from HV to EHV level, a major control of a single portion of the subtransmission network is increasingly required. Therefore, the first step of the analysis was the division of the electric power system under study into a series of auto-consistent grid portions named “operation islands”, as shown in Figure 5. The criteria to define the HV operation islands were:
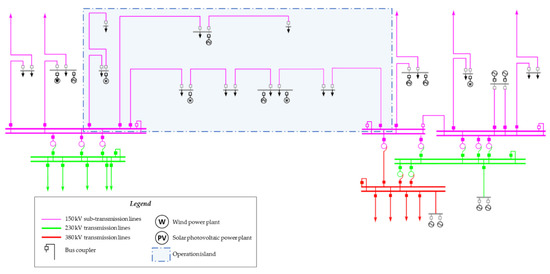
Figure 5.
Typical architecture of HV operation island.
- Each operation island was delimited by more than one (typically three) electrical substations with HV/EHV transformers;
- There was no electrical link between different operation islands;
- The identified grid assessment improves the operation aspects, for example, avoiding users connected with a single power link in operating conditions that cause unserved energy in N-1 conditions.
The assessment of HV operation islands allows the better management of power flow, reducing the bottlenecks and maximising the RES penetration without infrastructural investments.
Once the topological setting of the network model was defined, the iterative process of the analysis represented in Figure 6 was followed.
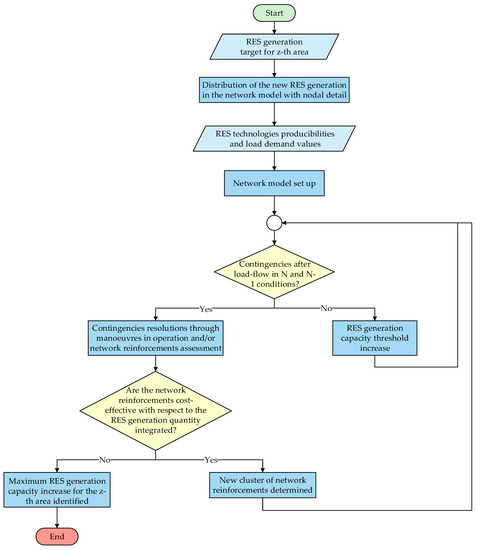
Figure 6.
Workflow of the proposed iterative process.
The aim of the proposed method was to define, for the z-th area and through a static load flow analysis, some sets of operation or infrastructure solutions to mitigate the contingencies due to additional RES capacity installation. The maximum admissible RES capacity increase was assessed according to the network topology, the power flow distribution in the presence of operation islands, the thermal rating of transmission and subtransmission lines, and the related security criteria [21]. In a steady-state regime, the alternating current (AC) load flow problem was solved considering N and N-1 conditions, increasing the RES capacity step by step.
For each relevant condition, the AC load flow problem can be summarised in the following standard form:
where the vectors of nodal power injections and are affected by the scenario analysis and producibility levels obtained in the previous subsections, and are the vectors obtained from the nodal admittance matrix, and the solution leads to the determination of nodal voltage amplitude and phase vectors, together with branch flows.
The resolution of contingencies was attained by the following actions, influencing the nodal admittance matrix to be evaluated in the proposed order:
- The identification of new operation network assessment;
- The replacement of power line or substation components with the aim to increase transmission capacity;
- Grid reinforcements on the HV level;
- Grid reinforcements on the EHV level.
According to the security criteria [22,23], the maximum loading value accepted in the N condition for the transmission lines was 80%; in the N-1 condition, the value increased to 120%.
As regards the economic burden, for action 1, it is very limited, whereas for actions 2 and 3, it is generally incurred by RES producers in the connection process since they are related to the correct integration of new power injections; therefore, cost-effectiveness is provided, whereas action 4 is devoted to the preliminary individuation of network reinforcement at the system scale prior to cost–benefit analysis, which follows specific methods [23,24]. Moreover, the installation of energy storage devices is not considered among the possible actions for the TSO in order not to take advantage of energy arbitrage in an unbundled energy industry [25].
The load flow analysis and contingency solution were evaluated by iteratively increasing the number of new RES installations at a defined contemporaneous production level. The iterative process stopped when no cost-effective network reinforcement could be defined; in this condition, the maximum target of RES integration for the z-th area was established.
3. Case Study and Results
This study was focused on a specific and very extensive grid portion of the Italian power system located in the south and the main islands of the country, namely Sicily, Sardinia, Calabria, Apulia, Basilicata, and Campania regions, with a focus on the 2030 system evolution. The analysis involved 380 kV, 230 kV, and 150 kV transmission and subtransmission networks in these areas, entailing the performance assessment of 2278 lines and 251 dedicated transformers both in normal operation (N) and during contingencies involving single branch faults (N-1).
The long-term 2030 year was considered the target horizon significant for planning studies. Load flow analyses in N conditions and in all N-1 conditions were performed through the official power system planning studies tool, “SPIRA”. The Newton–Raphson iterative method was used to solve the complete system of load flow equations, with tolerances of 0.1 MW and 1 MVAr for active and reactive power, respectively.
In the following subsections, all details about the case study and the results are provided.
3.1. Initial RES Generation Capacity Scenario
The methodology proposed in Section 2.1 was adopted for the assessment of a RES generation capacity scenario by 2030 consistent with the real connection requests. The reference scenario adopted in the present study was named “National Trend Connection Requests” or “NTCR” and resulted from the re-distribution of the original 2030 NT target in each market zone of the Italian power system based on the evidence of real RES connection initiatives, i.e., applying in (2.1) the values reported in Figure 4 as divided by regions.
The resulting RES generation distribution to be exploited in the proposed analysis is synthetically represented in Figure 7. A significant variation from the 2030 NT scenario can be observed in the north (reduction of about 12 GW) and south, and in Sicily (an increase of about 10 GW and 5 GW, respectively).
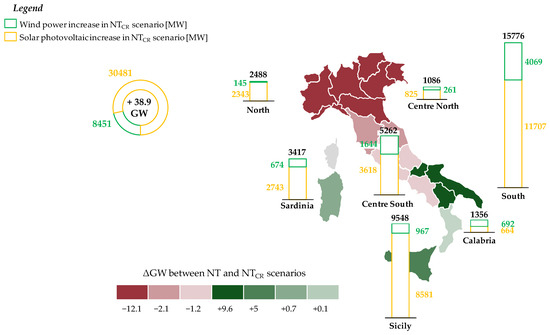
Figure 7.
New RES generation distribution at national level in the NTCR scenario and variation compared to the original 2030 NT one. Regions of the same color belong to the same market zone of the Italian power system.
The detailed rates of concretisations for wind and solar technologies’ provisional targets for all regions under study are summarised in Table 3.
Table 3.
Rate of concretisation and target fixed for the solar and wind on-shore technologies’ increase values for all areas under study with the 2030 year horizon.
3.2. Results of Producibility Analysis of RES Technologies
Table 4.
Correlation matrix between solar and wind technologies’ producibilities for Sicily region.
Table 5.
Correlation matrix between RES producibilities and load value for Sicily region.
The producibility values of photovoltaic and wind generation, respectively, 55% and 65%, were assumed to be equal to the medium value of the maximum contemporaneous producibility range, as highlighted with red text in Table 4. With the aim to adopt a conservative approach to analysis, the lower load value in the maximum producibility range was identified, as highlighted with red text in Table 5.
In Figure 8, a typical wind production, solar photovoltaic production, and daily peak and off-peak load day profiles for the Sicily region are depicted, as an example of performed producibility analysis. The approach above described was applied to each area under study, and the relevant yields are shown in Table 6, showing higher producibility for wind and photovoltaic in Sardinia.
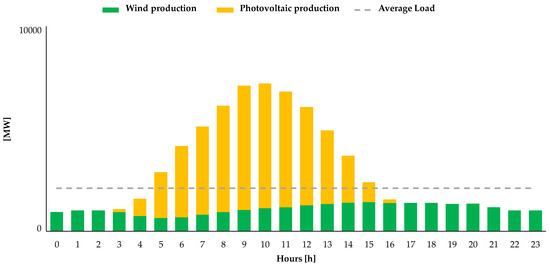
Figure 8.
Typical foreseen day profile for Sicily region: wind production, solar photovoltaic production, and average load.
Table 6.
Assumptions regarding load value and RES technologies’ producibility values for all areas under study.
3.3. Operation Islands Definition and Setting
Implementing the above-described assumptions in the network model, the first run of static load flow was performed. Based on the detected contingencies and network topology, the operation islands in all regions were assessed, as depicted in Figure 9. The different colours in the figure represent the portions of territories served by the subtransmission power lines belonging to the same operation island.
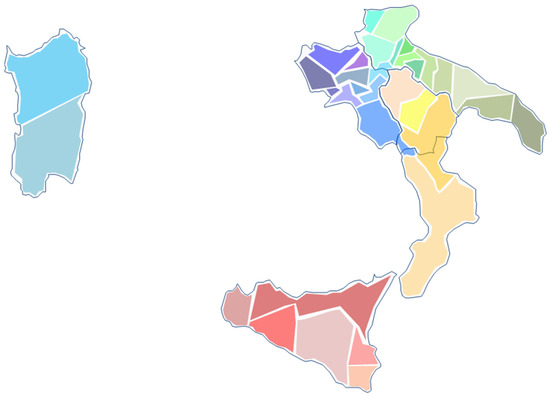
Figure 9.
Operation islands defined for areas under consideration. The different colours represent the portions of territories served by the subtransmission power lines belonging to the same operation island.
In Figure 10, an example of two identified operation islands in western Sicily is portrayed.
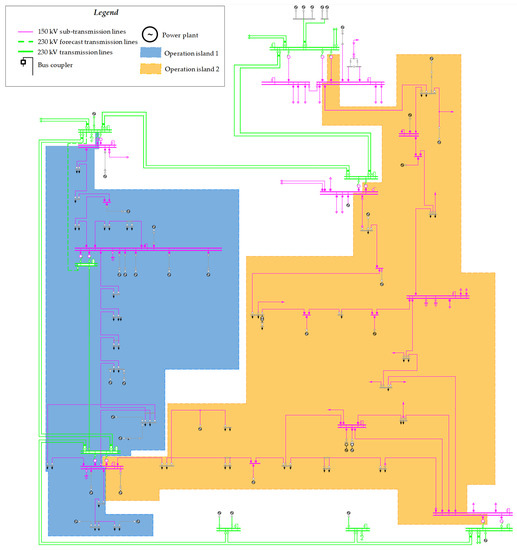
Figure 10.
Operation islands in a specific portion of Sicilian 150 kV subtransmission network.
The proposed methodology and its application were focused on subtransmission networks; however, the conditions of high RES production require some consideration of the export capacity of the studied areas. In particular, at the 2030 year horizon, Sicily and Sardinia islands, which have limited export capacity, will be connected by a new high-voltage direct current (HVDC) connection named “Tyrrhenian Link”, planned in the National Development Plan [6]. Therefore, in order to evaluate the energy flow of the new HVDC, an analysis regarding the contemporaneous RES production in the islands in 2019 was performed.
Figure 11 shows the correlation between the Sicilian and Sardinian RES generation; the points within the area bounded by the yellow hatch represent the moments when there was a simultaneous production greater than the third quartile of the generation curves of each region. This condition occurred for about 14% of hours in the analysed year.
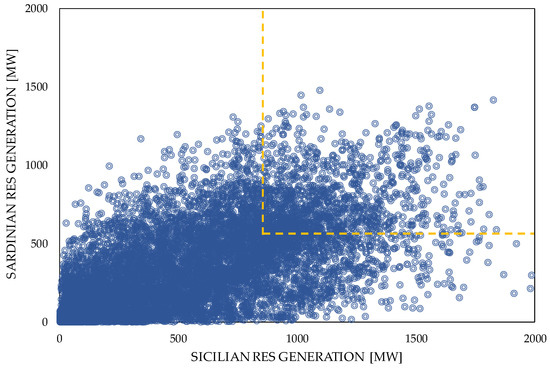
Figure 11.
Correlation analysis about Sicilian and Sardinian RES production. The yellow hatch delimites the area where there was a simultaneous production greater than the third quartile of the generation curves of each region.
3.4. Load Flow Results and Iterative Analysis
In this section, the load flow results in N and N-1 conditions are reported.
Figure 12 summarises the subtransmission lines loading in N conditions for every significant step analysed (in the relevant selected wind and solar photovoltaic production and load consumption snapshot for each region under study):
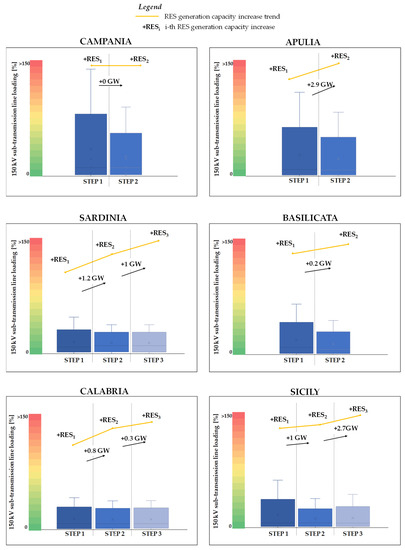
Figure 12.
Boxplots summarising the HV subtransmission line loading (%) in different RES increase steps in Italian regions under consideration.
- Step 1: RES generation increase allowed considering the already planned development projects included in the NDP 2021 at the 2030 year horizon and the network reinforcements related to the already released connection solutions;
- Step 2: RES generation increase allowed after the implementation of further HV subtransmission grid reinforcements with respect to Step 1;
- Step 3: RES generation increase allowed after the implementation of further EHV transmission grid reinforcements with respect to Step 2.
For this aim, the iterative analysis of increasing RES generation was performed starting from the preceding step (in terms of Step 1, it is represented by installations in 2020, as depicted in Figure 2) and providing first a sharp increase by 1 GW per iteration and, therefore, a refinement with a 0.1 GW increase per iteration.
The new renewable capacity amount was different for each area in each step, depending on the active connection requests, characteristic sources producibilities, load, transmission, and subtransmission systems performances.
The main results can be summarised as follows:
- In some cases, the RES generation increase stopped at the second step, since further RES integration would lead to inefficient network reinforcements;
- The regions with the most significant RES generation capacity increases were Apulia (+195% of the current value), Sardinia (+217% of the current value), and Sicily (+279% of the current value), which are also the areas involved in the considerable number of new RES initiatives;
- In general, the implementation of further reinforcements on the HV subtransmission and EHV transmission systems led to the alleviation of loading levels. In fact, the maximum loading decreased in Step 2 for Apulia (−23% compared with Step 1) and in Step 3 for Sardinia (−21% compared with Step 1) and Sicily (−39% compared with Step 1);
- Step 3 was implemented in Sicily, Calabria, and Sardinia considering the grid reinforcements affecting the EHV transmission system. An increased loading could be observed in this condition, due to the major RES integration.
For the other regions, relevant network developments are currently under study.
As regards network reinforcements, in Step 2, most developments were represented by transmission capacity increase in lines and transformers, whereas few HV power lines were hypothesised to reduce overloads and allow operation islands assessment, specifically:
- One 150 kV subtransmission link between two HV substations in Sardinia, where some new RES power plants will connect, to allow a better balance of power flows in the analysed area;
- Two new 150 kV subtransmission lines in Apulia in order to improve the potential meshing of the power grid and to define more efficient operation islands.
Finally, the reinforcements identified in Step 3 mainly consisted of interzonal links, and this preliminary assessment is the input for further studies to be performed in the next National Development Plan and are out of the scope of this paper.
Table 7 lists the results obtained from the analysis in N-1 conditions, showing the main contingencies that involve the maximum loading. The empty rows in Step 3 for some regions indicate that the condition was not examined. Starting from the initial situation (Step 1), characterised by severe N-1 overloads, the additional network reinforcements in the following steps proved their effectiveness in alleviating and/or solving critical situations. In step 3, the remaining overloads were all generally within the accepted threshold of 120%, with some exceptions: L3 in Sicily, the critical loading of which can be solved by re-dispatching actions (i.e., closing the bus coupler in the 220 kV substation which fed the 150 kV operation island, managing the system in a meshed manner during contingency) and 150 kV subtransmission lines in Apulia and Campania due to the EHV interzonal links currently under study, to be included in the next edition of the National Development Plan.
Table 7.
Load flow results in N-1 conditions.
The introduction of operation islands and the identified grid reinforcements allowed the integration of further RES generation capacities in the studied areas by about 31 GW, saturating the envisaged new installations of scenario definition. This value was reached in each step as follows:
- Step 1: +21 GW relative to the RES generation capacity already installed;
- Step 2: +6.1 GW compared with Step 1;
- Step 3: +3.9 GW compared with Step 2.
It could be inferred that the main contribution to the integration of the new RES generation capacity is determined by the operation islands’ assessment, the already planned development projects included in the NDP 2021 at the 2030 year horizon, and the network reinforcements related to the already released connection solutions, whereas further integration of RES in the considered contemporaneous stressful condition are more and more demanding, thus arising the need for new HV and EHV connections or different integration paradigms aiming at programmability.
4. Discussion and Conclusions
In this paper, a new methodology developed by the Italian TSO was presented that aimed to assess the maximum RES generation increase in grid portions affected by the massive number of new RES connection requests. A new energy scenario based on the latest information about new RES connection request distribution was defined to perform a comprehensive planning study able to analyse the new RES generation increase in a coordinated and efficient manner. The case study involved a very extensive area of the Italian power system characterised by poorly meshed transmission network and low load consumptions and, therefore, particularly critical in terms of renewable generation integration.
The HV 150 kV subtransmission network operation islands’ setup was used in the future network model considering all network developments at the 2030 horizon in order to ensure a secure collection of distributed renewable generation and connected loads, due to the simpler control of power injections and protection system, the short circuit level reduction, and the limited disturbance propagation.
An extensive analysis of different RES technologies’ producibilities was carried out in order to select significant critical contemporary conditions for the future power system.
The load flow analysis performed both in normal conditions and during contingencies by the means of the official tool adopted by the Italian TSO led to the definition of further network reinforcements or manoeuvres in operation able to reduce or solve the network overloads related to each RES generation capacity increase, until the maximum allowed RES quota was reached.
The proposed methodology and the outcomes of this study can prove useful for the TSO, in order to highlight the actions enabling the transmission network for the energy transition, in particular under the intensive development of RES generation, and in order to analyse the subtransmission network, under the assumption of operation islands, with the aim of obtaining information on the amount of integrable RES generation and on the network reinforcements ascribable to new connection requests.
Future work could deal with the definition of dynamic-based RES increase, according to N and N-1 dynamic analyses considering the inertial contribution by RES, as well as the integration of RES generation initiatives with energy storage, thus modifying the individuation of scenarios and the producibility analysis.
Author Contributions
Conceptualisation, C.G. (Corrado Gadaleta) and M.M.; data curation, A.D.C. and C.G. (Chiara Giordano); formal analysis, C.G. (Corrado Gadaleta), M.M. and G.F.; investigation, C.G. (Chiara Giordano), M.M. and G.F.; methodology, A.D.C. and C.G. (Chiara Giordano); resources, E.M.C.; software, A.D.C., C.G. (Chiara Giordano), and M.M.; supervision, E.M.C. and C.G. (Corrado Gadaleta); validation, E.M.C., A.D.C. and C.G. (Corrado Gadaleta); visualisation, C.G. (Chiara Giordano) and M.M.; writing—original draft preparation, C.G. (Chiara Giordano), M.M. and G.F.; writing—review and editing, E.M.C., A.D.C. and C.G. (Corrado Gadaleta). All authors have read and agreed to the published version of the manuscript.
Funding
This research received no external funding.
Conflicts of Interest
The authors declare no conflict of interest.
References
- European Commission. ‘Fit for 55’: Delivering the EU’s 2030 Climate Target on the Way to Climate Neutrality; European Commission: Brussels, Belgium, 2021. [Google Scholar]
- Ministry of Economic Development; Ministry of the Environment and Protection of Natural Resources and the Sea; Ministry of Infrastructure and Transport. Integrated National Energy and Climate Plan; Ministry of Economic Development; Ministry of the Environment and Protection of Natural Resources and the Sea; Ministry of Infrastructure and Transport: Rome, Italy, 2019.
- Wu, F.F.; Zheng, F.L.; Wen, F.S. Transmission investment and expansion planning in a restructured electricity market. Energy 2006, 31, 954–966. [Google Scholar] [CrossRef]
- Mahdavi, M.; Antunez, C.S.; Ajalli, M.; Romero, R. Transmission Expansion Planning: Literature Review and Classification. IEEE Syst. J. 2019, 13, 3129–3140. [Google Scholar] [CrossRef]
- Domínguez, R.; Conejo, A.J.; Carrión, M. Toward Fully Renewable Electric Energy Systems. IEEE Trans. Power Syst. 2015, 30, 316–326. [Google Scholar] [CrossRef]
- Terna, S.p.A. Italian National Network Development Plan; Terna Group: Rome, Italy, 2021. [Google Scholar]
- Terna, S.p.A. Allegato A.24 al Codice di Rete, Individuazione Zonale Della Rete Rilevante; Terna Group: Rome, Italy, 2021. [Google Scholar]
- Italian Regulatory Authority for Energy, Networks and Environment. Decision 19 March 2019. 103/2019/R/EEL, In Italian. Available online: https://www.arera.it/allegati/docs/19/103-19.pdf (accessed on 1 March 2022).
- Migliori, M.; Lauria, S.; Gadaleta, C.; Aluisio, B.; De Cesare, A.; Forte, G. Assessment of transmission network development with HV operation islands under renewable diffusion. In Proceedings of the 2021 IEEE Madrid PowerTech, Madrid, Spain, 28 June–2 July 2021; pp. 1–5. [Google Scholar] [CrossRef]
- Mosca, C.; Bompard, E.; Chicco, G.; Aluisio, B.; Migliori, M.; Vergine, C.; Cuccia, P. Technical and Economic Impact of the Inertia Constraints on Power Plant Unit Commitment. IEEE Open Access J. Power Energy 2020, 7, 441–452. [Google Scholar] [CrossRef]
- Lumbreras, S.; Ramos, A.; Banez-Chicharro, F.; Olmos, L.; Panciatici, P.; Pache, C.; Maeght, J. Large-scale transmission expansion planning: From zonal results to a nodal expansion plan. IET Gener. Transm. Distrib. 2017, 11, 2778–2786. [Google Scholar] [CrossRef] [Green Version]
- Mortaz, E.; Valenzuela, J. Evaluating the impact of renewable generation on transmission expansion planning. Electr. Power Syst. Res. 2019, 169, 35–44. [Google Scholar] [CrossRef]
- Papaemmanouil, A.; Tjernberg, L.B.; Tuan, L.A.; Andersson, G. Improved cost–benefit analysis for market-based transmission planning, a European perspective. Energy Policy 2013, 63, 215–223. [Google Scholar] [CrossRef]
- Cole, S.; Martinot, P.; Rapoport, S.; Papaefthymiou, G. Cost-benefit analysis of a coordinated grid development in the North Sea. In Proceedings of the 2015 IEEE Eindhoven PowerTech, Eindhoven, The Netherlands, 29 June–2 July 2015. [Google Scholar] [CrossRef]
- Dicorato, M.; Tricarico, G.; Forte, G.; Marasciuolo, F. Technical Indicators for the Comparison of Power Network Development in Scenario Evaluations. Energies 2021, 14, 4179. [Google Scholar] [CrossRef]
- Yin, S.; Wang, J. Generation and Transmission Expansion Planning Towards a 100% Renewable Future. IEEE Trans. Power Syst. 2020, 37, 3274–3285. [Google Scholar] [CrossRef]
- Dehghan, S.; Amjady, N.; Conejo, A.J. A multistage robust transmission expansion planning model based on mixed binary linear decision rules—Part I. IEEE Trans. Power Syst. 2018, 33, 5341–5350. [Google Scholar] [CrossRef]
- Dedecca, J.G.; Hakvoort, R.A.; Herder, P.M. Transmission expansion simulation for the European Northern Seas offshore grid. Energy 2017, 125, 805–824. [Google Scholar] [CrossRef]
- De la Torre, S.; Conejo, A.J.; Contreras, J. Transmission Expansion Planning in Electricity Markets. IEEE Trans. Power Syst. 2008, 23, 238–248. [Google Scholar] [CrossRef]
- Bompard, E.; Cuccia, P.; Masera, M.; Fovino, I.N. Cyber Vulnerability in Power Systems Operation and Control. In Critical Information Infrastructure Protection; Lopez, J., Setola, R., Wolthusen, S.D., Eds.; Springer: Berlin/Heidelberg, Germany, 2012; pp. 197–234. [Google Scholar] [CrossRef]
- Carlini, E.M.; Vergine, C.; Gadaleta, C.; Aluisio, B.; Migliori, M.; Dicorato, M.; Trovato, M.A.; Forte, G. Static and Dynamic Evaluation of Different Architectures for an Actual HVDC Link Project. IEEE Trans. Power Deliv. 2020, 35, 2782–2790. [Google Scholar] [CrossRef]
- Joint Working Group. Planning Criteria for Future Transmission Networks in the Presence of a Greater Variability of Power Exchange with Distribution Systems; CIGRE/CIRED C1.29; CIGRE/CIRED: Ljubljana, Slovenia, 2017. [Google Scholar]
- Terna Group. Allegato A.74 al Codice di Rete: Metodologia Analisi Costi—Benefici—ACB 2.0, rev. 01, in Italian. February 2019. Available online: https://download.terna.it/terna/0000/1009/13.pdf (accessed on 1 March 2022).
- Dicorato, M.; Tricarico, G.; Trovato, M.; Forte, G.; Bronzini, M. Techno-economic benefit of network developments: A flow-based evaluation. In Proceedings of the 2020 55th International Universities Power Engineering Conference (UPEC), Turin, Italy, 1–4 September 2020. [Google Scholar] [CrossRef]
- Martins, J.; Miles, J. A techno-economic assessment of battery business models in the UK electricity market. Energy Policy 2021, 148, 111938. [Google Scholar] [CrossRef]
Publisher’s Note: MDPI stays neutral with regard to jurisdictional claims in published maps and institutional affiliations. |
© 2022 by the authors. Licensee MDPI, Basel, Switzerland. This article is an open access article distributed under the terms and conditions of the Creative Commons Attribution (CC BY) license (https://creativecommons.org/licenses/by/4.0/).