Article

Thermal Performance Analysis of Materials and Configurations for Cylindrical Sidewalls of Charcoal Kilns

by
Antão Rodrigo Valentim
1,*,
Jhon Ramírez Behainne
2 and
Aldo Braghini Junior
3
1
Federal Institute of Paraná (IFPR), Av. José Felipe Tequinha, 1400, Paranavaí 87703-536, Brazil
2
Department of Mechanical Engineering, Federal University of Technology-Paraná, Rua Doutor Washington Subtil Chueire, 330, Ponta Grossa 84017-220, Brazil
3
Department of Industrial Engineering, Federal University of Technology-Paraná, Rua Doutor Washington Subtil Chueire, 330, Ponta Grossa 84017-220, Brazil
*
Author to whom correspondence should be addressed.
Energies 2022, 15(16), 5872; https://doi.org/10.3390/en15165872
Submission received: 31 May 2022 / Revised: 27 July 2022 / Accepted: 6 August 2022 / Published: 13 August 2022

Abstract

:
Most of the charcoal in the world comes from small and medium-sized producers, using rudimentary carbonization kilns that require significant time or energy during the heating and cooling stages of the process. Despite advances in improving the performance, the influence of materials used in the sidewalls of these kilns has been scarcely studied. Therefore, based on numerical simulations, the present study analyses the thermal performance of cylindrical sidewalls composed of combinations of metallic materials, ceramic materials, and insulating blankets grouped in three configurations: configuration I (sidewall with just one material), configuration II (sidewall with two materials assembled in series), and configuration III (pivoting sidewall). Results were encouraging, especially when comparing kiln configuration I with the novel configuration III. Simulations suggested that the proposed configuration III could reduce the heating time by 62%, the cooling time by 91%, the heat supplied to sidewalls by 80%, and the heat loss to the external environment by 99.7%. The save of wood charged into the charcoal kiln grew up to 7.3 times, varying the thickness of the inner layer of the sidewall.

1. Introduction

Currently, almost 17% of all the wood the world uses as fuel is used to produce charcoal. In 2020, charcoal production was estimated at 54.7 million tons, of which almost 64% was concentrated in Africa, followed by 29% equally distributed between Asia and Latin America. In this scenario, Brazil appears to have the most significant world production of charcoal, providing approximately 6.3 million tons in 2019 [1].
Unlike other countries, Brazil uses charcoal to replace coal in the production of pig iron and steel [2], bringing environmental benefits due to the carbon sequestration and the release of oxygen through photosynthesis in forests planted to produce charcoal. For instance, to obtain one ton of pig iron using coal, 1.9 tons of CO2 are emitted, and 1.3 tons of oxygen are consumed. Using charcoal to produce the same quantity of pig iron, about 1.1 tons of CO2 are sequestered, and 164 kilos of oxygen are generated, representing a reduction of around three tons of CO2 [3]. Nevertheless, charcoal cannot wholly replace coal in the pig iron production process due to its properties, such as low density, low compressive strength, and low reactivity [4].
Considering that charcoal consumption represents 40% to 50% of pig iron production costs [5], alternatives to make the carbonization process more efficient include the increase of carbon yield in charcoal and reducing its production cycle time [5,6].
In Brazil, about 80% of the kilns used in charcoal production employ partial combustion of the biomass load to supply the energy demanded by the carbonization process [7]. These kilns consume around 10% to 20% of the biomass placed inside [8]. In particular, masonry kilns, which use up to 20% of the wood mass to generate thermal energy, convert about 60% of the wood mass into gases and vapours [9]. In such kilns, walls composed of materials with insulating characteristics can considerably reduce the energy consumption during the heating stage.
According to Syred et al. (2006) [10], charcoal production occurs in the following stages: (i) the temperature is raised from room temperature to 110 °C, and the wood absorbs thermal energy and releases water vapor; (ii) the temperature remains close to 100 °C until all moisture is eliminated; (iii) the temperature is raised from 110 °C to 270 °C, and the wood begins to decompose, releasing some gases, such as carbon monoxide and carbon dioxide, and liquids, such as acetic acid and methanol; (iv) the temperature is raised from 270 °C to 290 °C and the endothermic reaction of the wood occurs; (v) temperatures above 270 °C allow the subsequent breakage of the wood to occur spontaneously; (vi) the temperature is raised from 290 °C to 400 °C; with further decomposition, various gases are released, such as carbon monoxide, carbon dioxide, hydrogen, and methane, in addition to condensable vapours such as water, acetic acid, methanol, and acetone. Wood tars begin to predominate as the temperature rises; (vii) temperature around 400 °C to 600 °C; the carbonization process is complete with charcoal as the main product.
Wood carbonization is a slow process. The heating rate needs to be controlled to preserve the quality of the charcoal obtained in this process [6]. Good results in physicochemical properties and laboratory yield of coal are achieved with heating rates below 1.67 °C/min [11,12].
Once the heating stage is over, the kiln starts to cool down to reduce the internal temperature to around 50 °C, allowing the kiln to be opened and the charcoal produced to be handled safely [7,13,14]. In this phase, there is no need to control the cooling rate because the physical–chemical quality of the charcoal is not affected by the cooling speed. In this sense, it is advantageous that the cooling occurs as soon as possible to reduce the time taken for charcoal production [13,14].
Materials of kiln walls used for charcoal production require antagonistic characteristics. While walls with excellent thermal insulator features are required during the heating stage, they also must behave as excellent thermal conductors in the cooling stage. Using a mathematical model, Bustos-Vanegas et al. [15] and Bustos-Vanegas [16] verified that materials with lower thermal conductivity of a masonry kiln minimize energy losses during the heating stage of carbonization, but they also extend the cooling time.
Despite the importance of the configuration and materials used in the construction of the kiln’s walls, as far as we know, no study systematically assesses their influence on the parameters of performance of the carbonization process. This work performs an analysis based on numerical simulations aiming to contribute to filling the gap.

2. Materials and Methods

Figure 1 shows the steps to evaluate the influence of configurations and materials used in the kiln’s sidewalls on the thermal performance parameters.
Details of these steps are presented as follows.

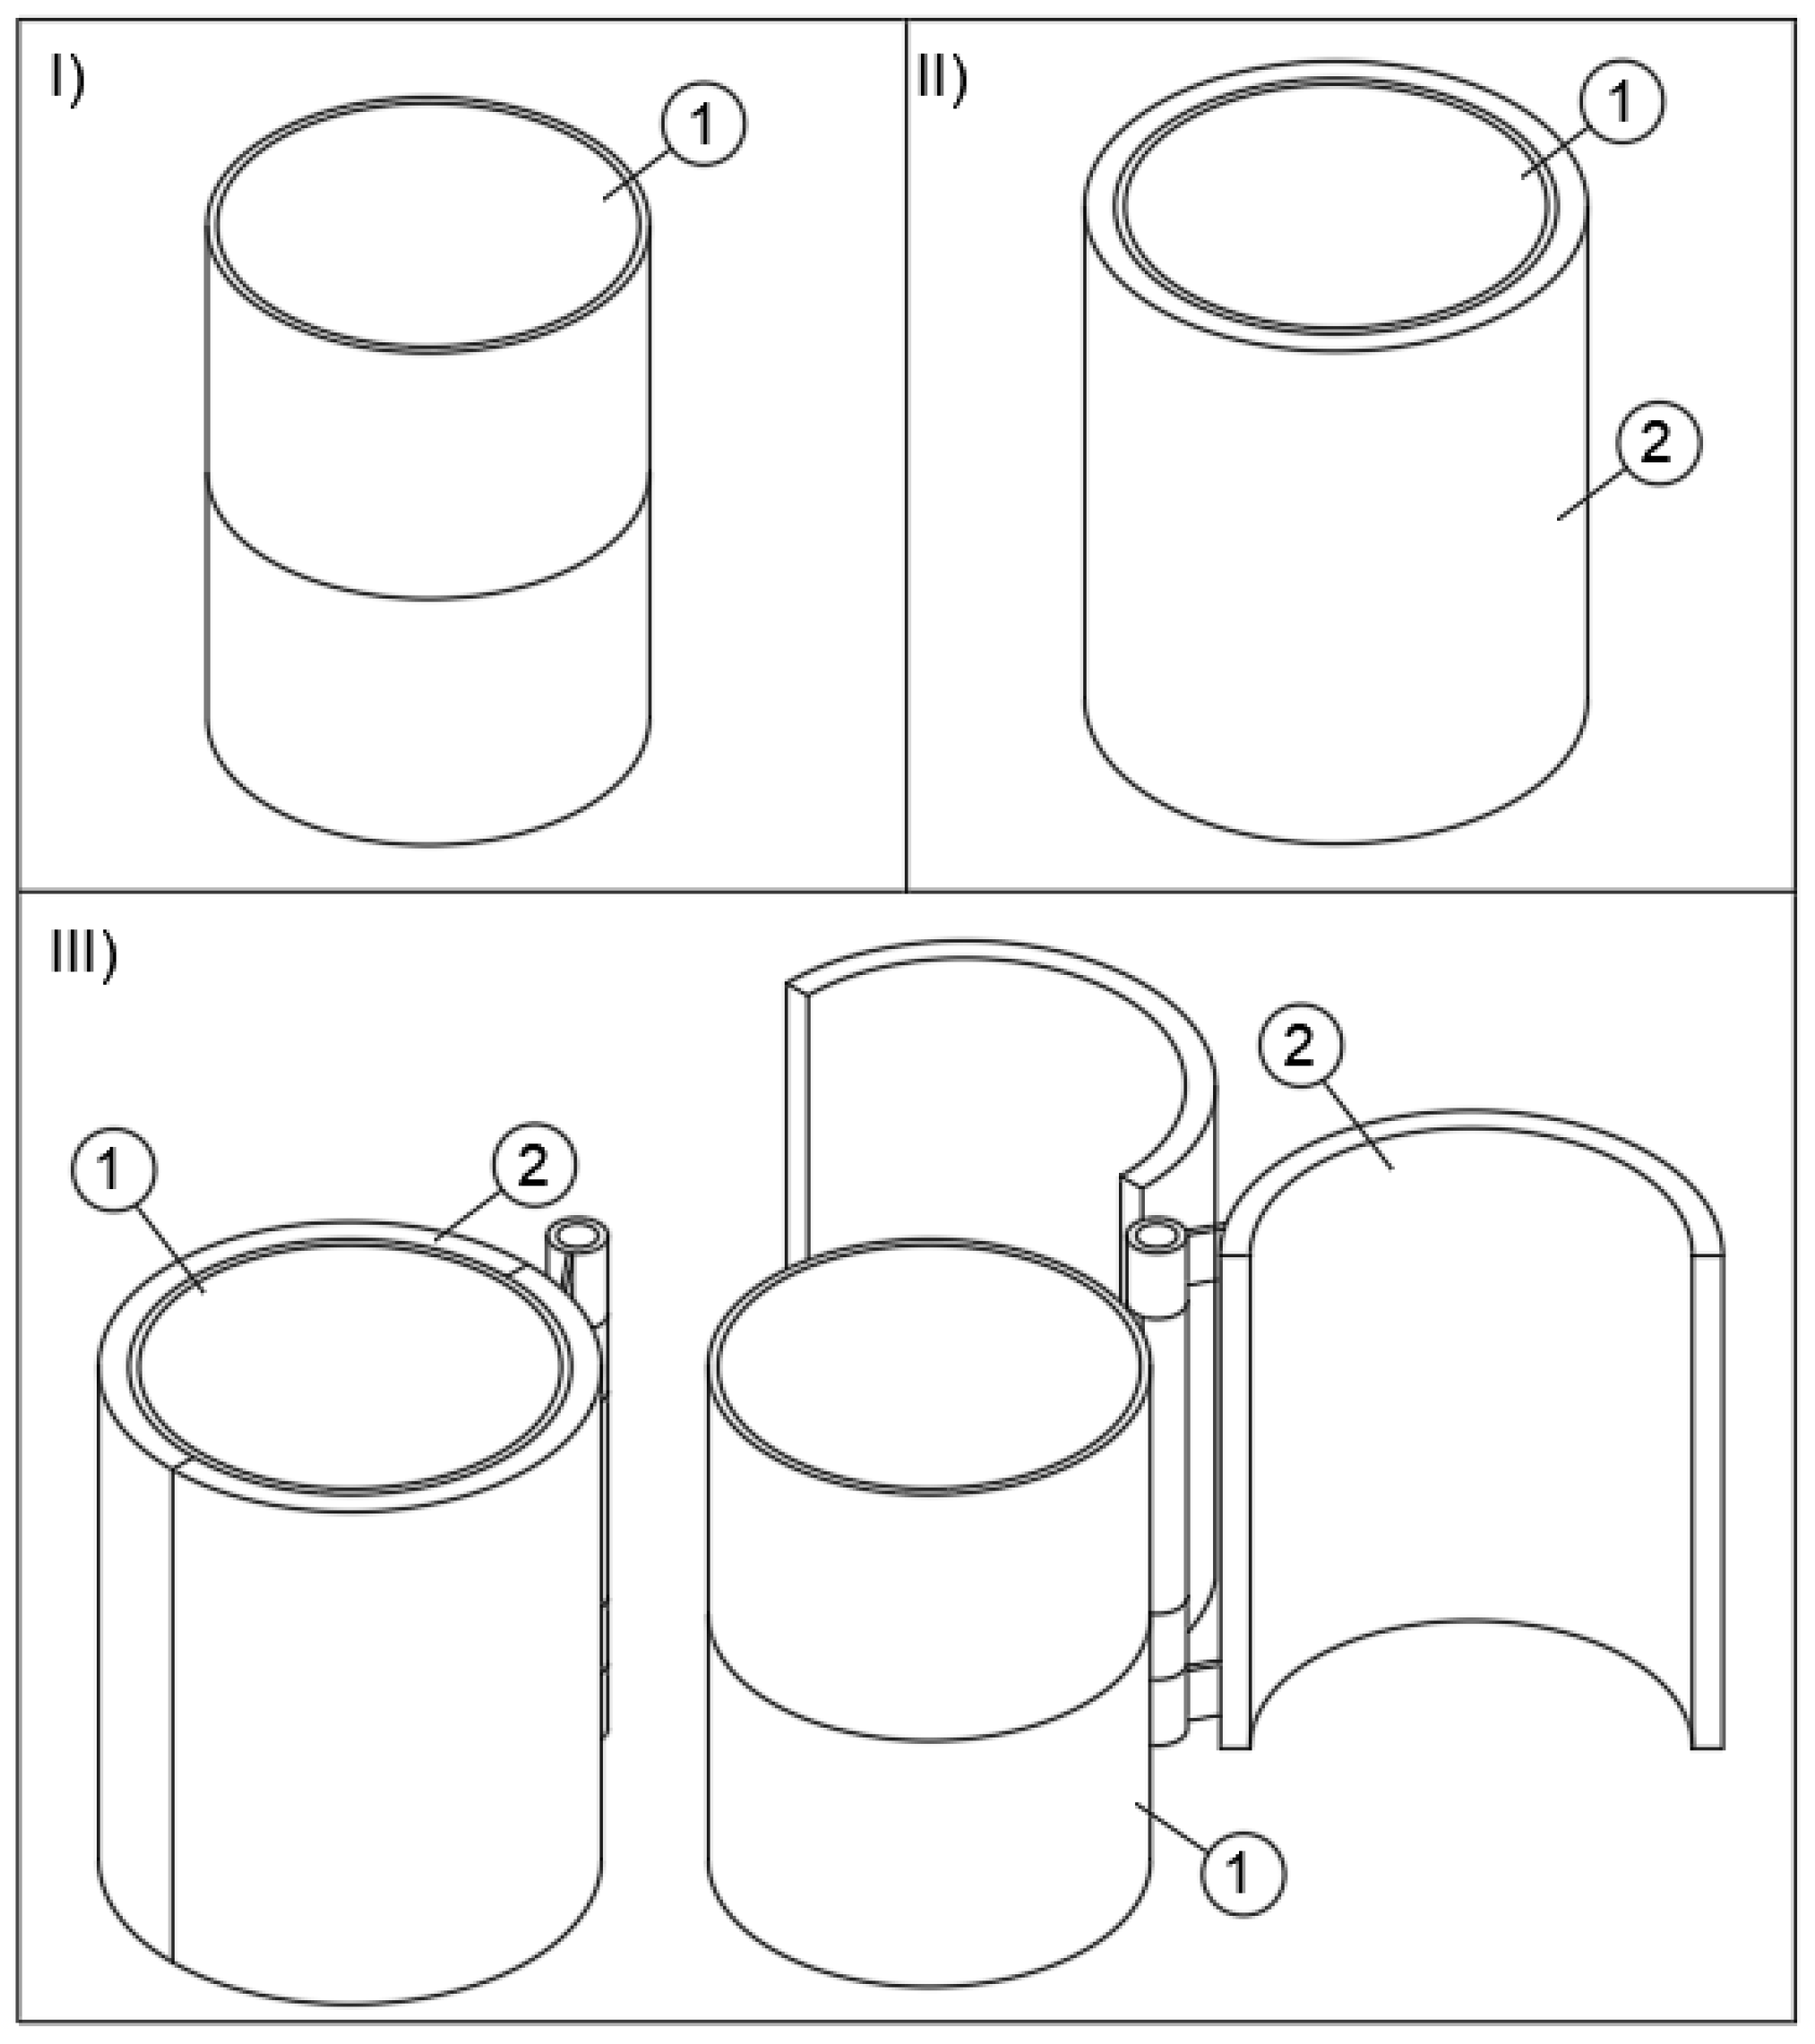
2.1. Configuration of the Kiln’s Sidewalls

Figure 2 illustrates the configuration schemes of the studied carbonization kilns, which were all built with cylindrical sidewalls. In configuration I, the sidewall of the kiln has just one material (material 1). On the other hand, in configuration II, the sidewalls are composed of two materials (material 1 and material 2) assembled in series. The inner face of material 1 is kept in contact with the carbonization environment, whereas the outer face of material 2 is exposed to the external atmosphere. Finally, in configuration III, the kiln includes a pivoting door mechanism, which allows using a sidewall composed of two layers (materials 1 and 2) during the heating stage, and a sidewall of only one layer (material 1) in the cooling stage. In this configuration, material 2 of the sidewall is removed after finishing the carbonization stage, leaving the external face of material 1 exposed to the atmosphere. Materials 1 and 2 were chosen with the properties of a good heat conductor and thermal insulator, respectively.
In all configurations, the internal diameter of the kiln was 2.8 m, and the height of its sidewalls was 2 m [17]. The external diameter of the sidewalls varied according to the materials’ thicknesses.

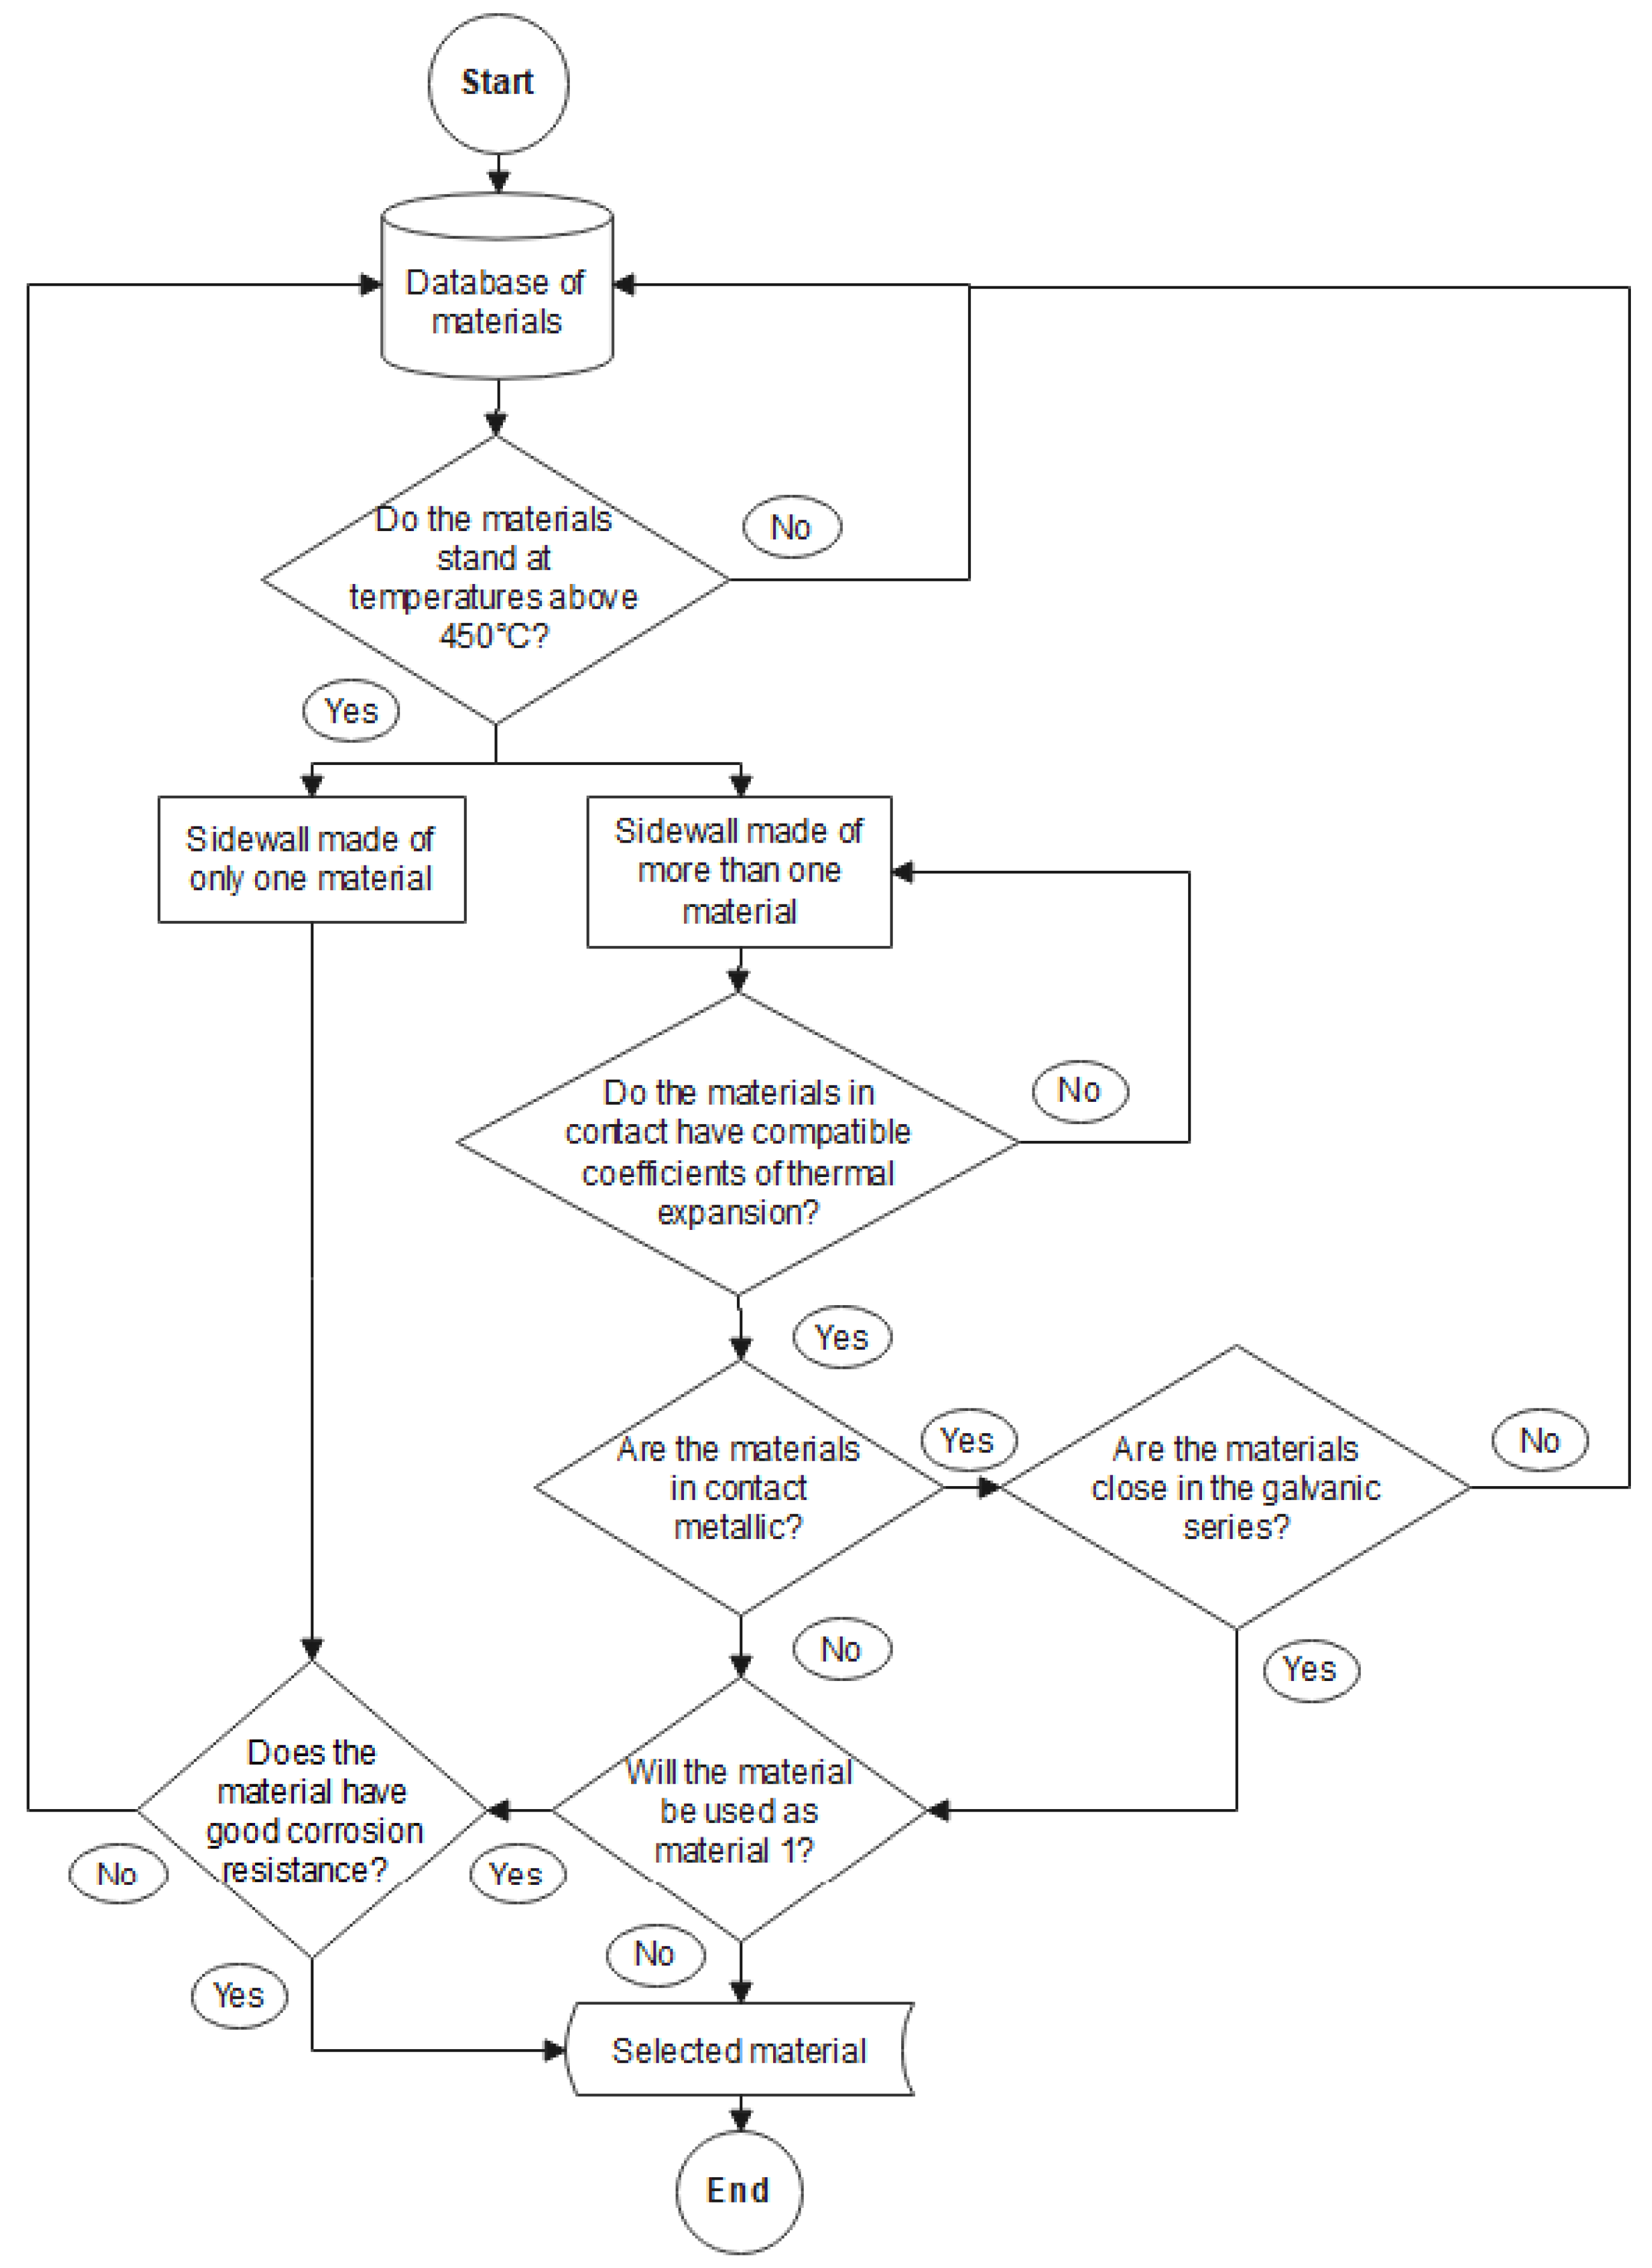
2.2. Selection of Materials for the Sidewalls

The choice of materials 1 and 2 was carried out by following the steps and criteria featured in Figure 3.
The first requirement of the selected material is to withstand a maximum working temperature equal to or higher than 450 °C, which is close to the temperature of the carbonization process. Temperatures lower than this on the inner face of the kiln’s sidewalls were reported in previous works [18,19,20].
Regardless of the sidewall configuration, material 1 must have good corrosion resistance to the gases generated from the carbonization process. Such a requirement is not necessary for material 2 of the sidewall.
In the case of walls composed of two materials, it is necessary to compare their thermal expansion coefficients; the closer the coefficient values, the safer the kiln operation will be due to relieving mechanical stress during the heating stage. In such cases, it is also necessary to evaluate the possibility of galvanic corrosion due to the potential difference. In this sense, choosing materials further apart in the galvanic series should be avoided. The properties of the metallic materials selected in this study are summarized in Table 1
On the other hand, insulating and ceramic materials features are presented in Table 2 and Table 3. Since not all of them follow a standardized terminology, they were identified according to the chemical compositions provided by manufacturers.

2.3. Thermal Analysis of the Kiln’s Sidewalls

Thermal performance parameters related to the kiln’s sidewalls, such as total heat supplied, heat loss to surroundings during the heating stage, and heating and cooling times were assessed using computational simulation. In these simulations, the thermochemical phenomena of the carbonization process were not considered. Instead, boundary conditions were imposed on the sidewalls based on existing data in the literature to compare the relative performance that resulted from the choices made for the kiln’s configuration and materials used in the sidewalls.
The features of each thermal performance parameter were based on the literature [4,12,13,16,17,27,28,29,30], and they are summarized as follows:
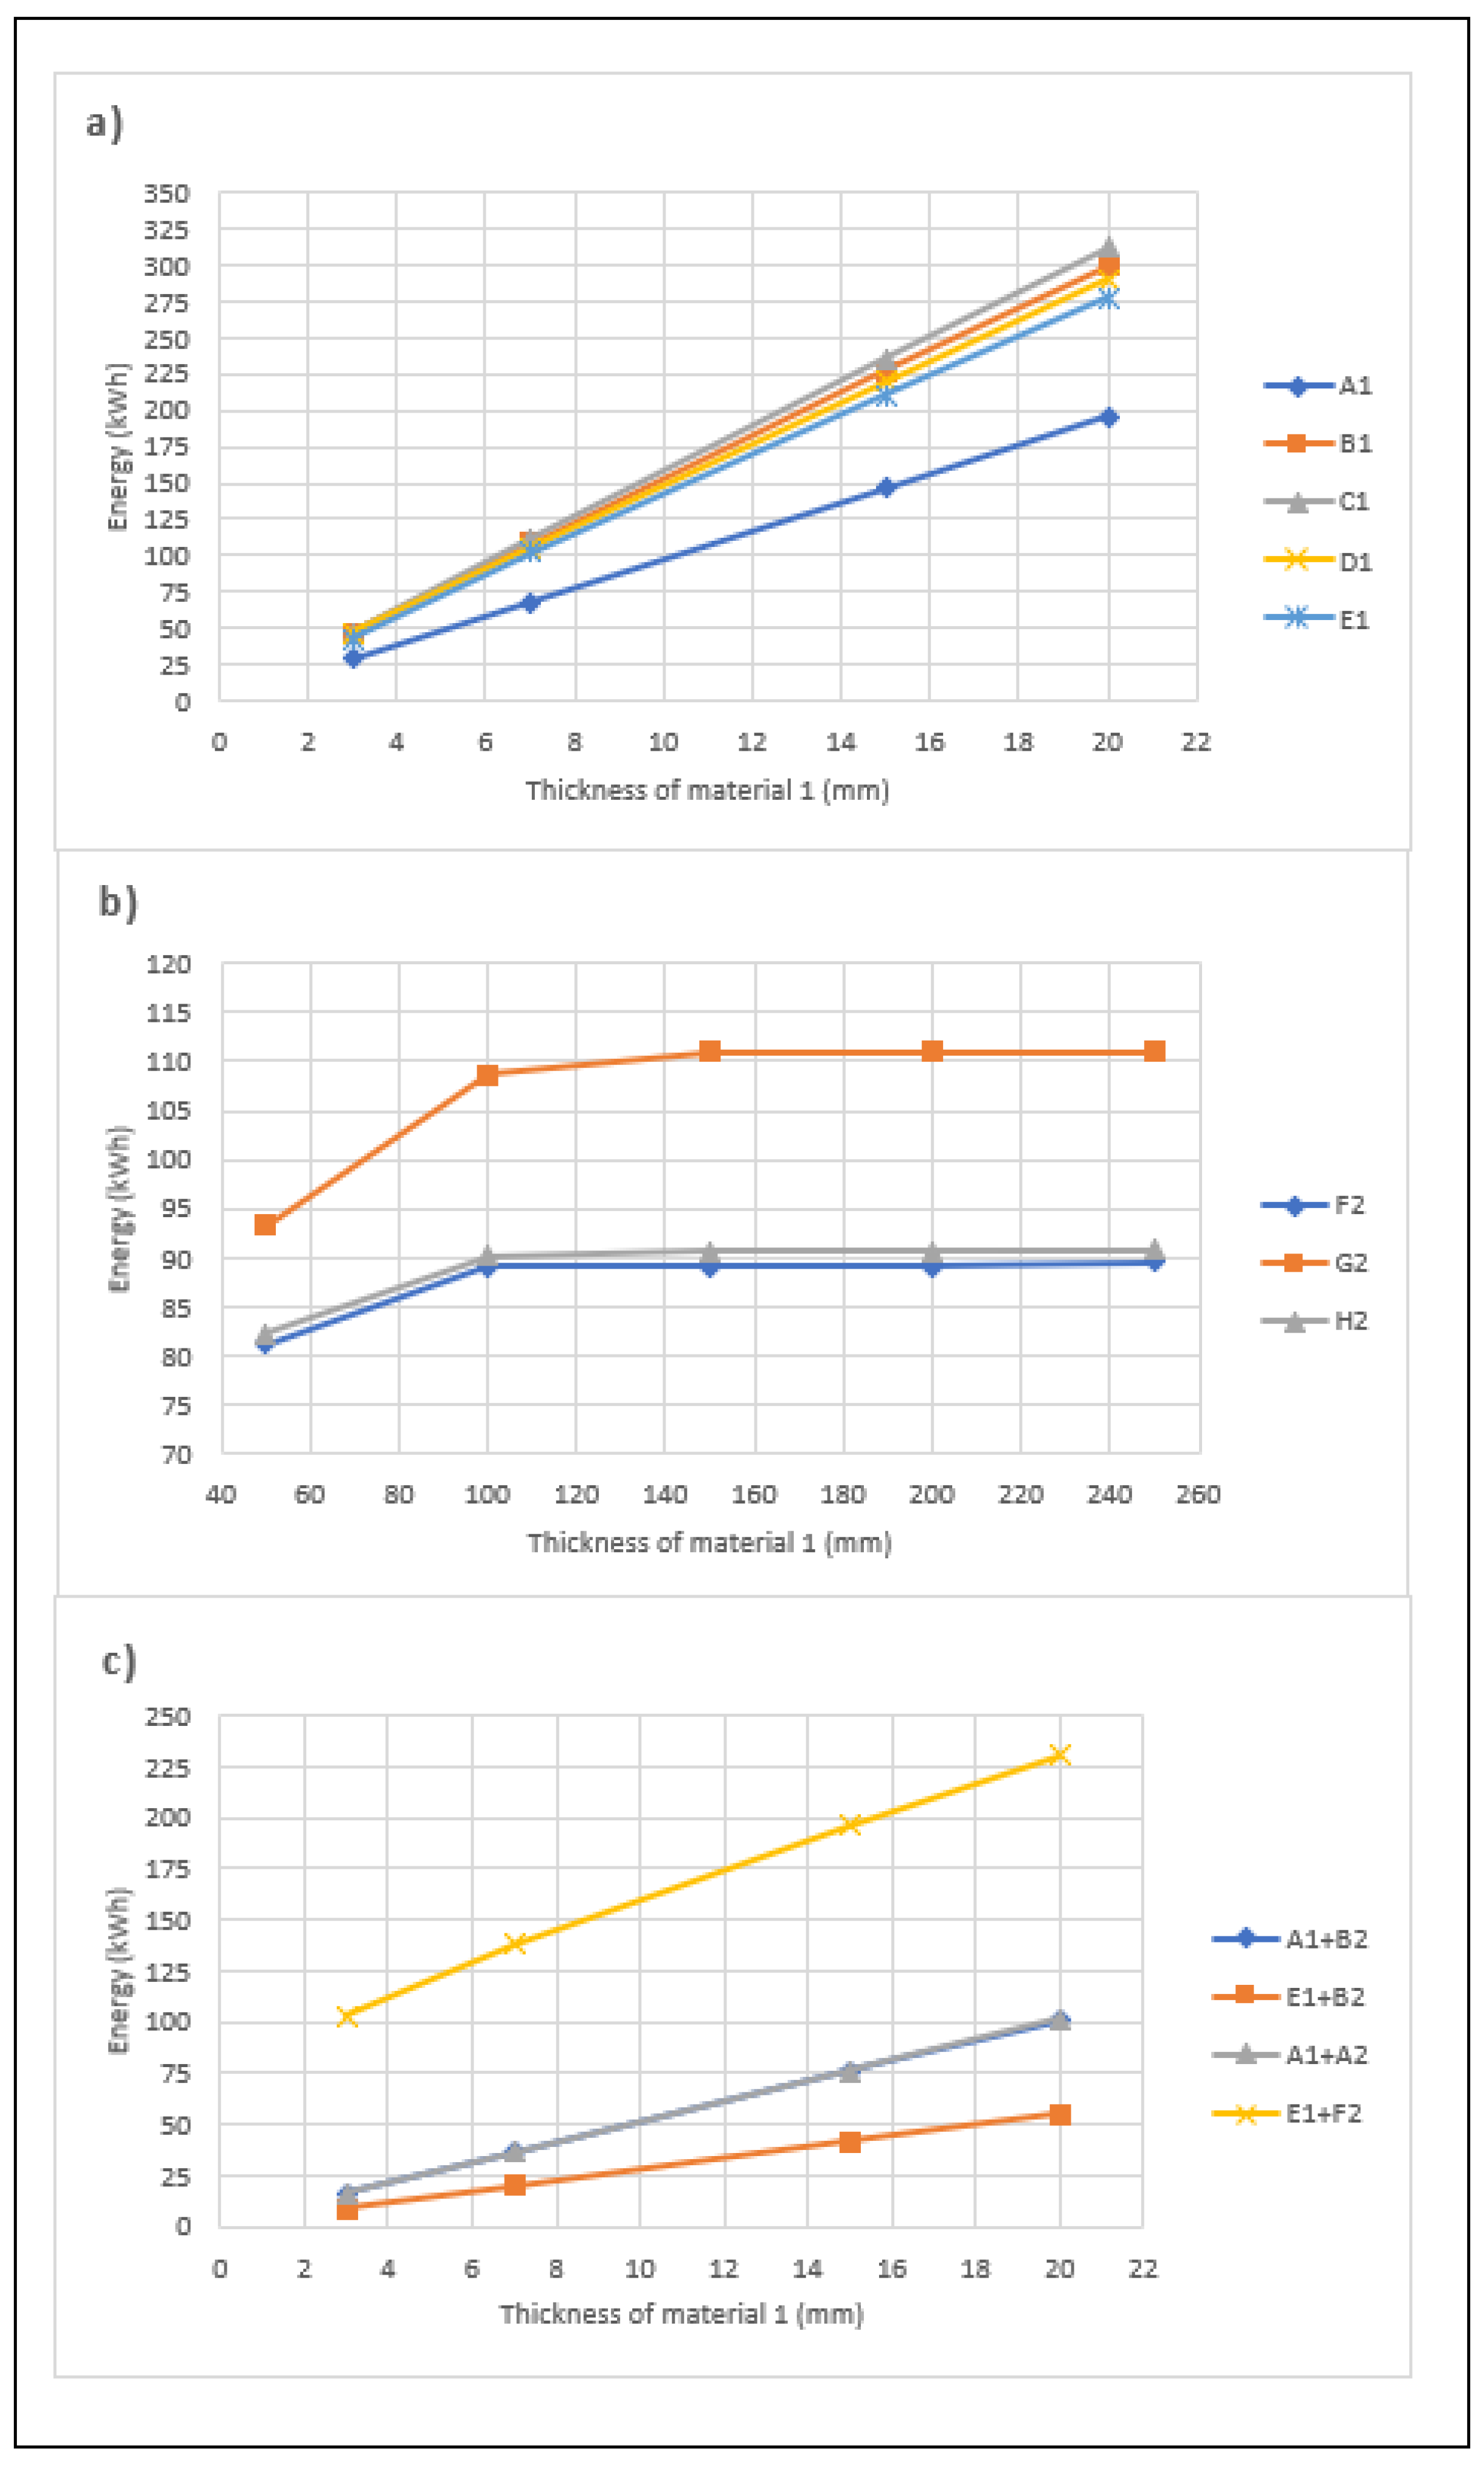
  • Total heat supplied to the sidewall: the total thermal energy added to the sidewall to raise the temperature of the inner surface of the kiln from 25 °C up to 300 °C during the heating stage;
  • Heat loss from sidewalls: the total thermal energy delivered by sidewalls to the external environment during the heating stage;
  • Heating time: the time required for the inner surface of the sidewall to heat up to 300 °C [17,31] from an initial temperature of 25 °C;
  • Cooling time: the time required for the inner surface of the sidewall to cool from 300 °C up to 50 °C. This final temperature was considered safe to open the kiln after finishing a carbonization cycle [11,31].

2.3.1. Heat Transfer Model

The thermal analysis of the kiln’s sidewalls was performed for the heating and cooling stages. Thus, for transient conditions, heat transfer only in the radial direction, absence of internal energy generation, and isotropic materials, the heat diffusion through the sidewalls is given by Equation (1) [22]:
1 r r r T l r , t r = 1 α T l r , t t r l 1 < r < r l   ; t < 0   ; l = 1 ,   2
where Tl indicates the temperature of material l in the sidewall. For composite sidewalls, perfect contact was assumed at the interface between materials 1 and 2. Therefore, at the interface, Equation (2) applies:
k l T l r , t r = k l + 1 T l + 1 r , t r with T l r , t = T l + 1 r , t ; t > 0
The boundary conditions applied to the internal and external surfaces of the sidewalls, as well as the respective initial conditions, are described as follows.
  • Heating stage: the boundary condition for the inner face of the sidewall is given by Equation (3):
    k 1 r T 1 r , t r = q 0 r = r 0 ; t > 0
    where q 0 is the heat flux applied to the inner surface of the sidewall. On the other hand, for the outer face of the sidewall in contact with its surroundings, the boundary condition is given by Equation (4):
    k 2 T 2 r , t r = h T 2 r , t T + ε 2 σ T 2 r , t 4 T v i z 4 r = r 2 ; t > 0
Finally, the initial condition is established by Equation (5):
T l r , 0 = T i r l 1 < r < r l ; t = 0 , ; l = 1 ,   2
  • Cooling stage: for this stage, the boundary condition is given by Equation (6), which assumes that the inner face of the sidewall is adiabatic:
    T 1 r , t r = 0 r = r 0 ; t > 0
  • For the outer face of the sidewall, Equation (4) is considered. The initial condition for the cooling stage is described by Equation (7):
    T l r , 0 = T l , f r r l 1 < r < r l ; t = 0 , ; l = 1 ,   2
    where T l , f r is the temperature reached at the end of the heating stage at radius r of the respective sidewall.
Equations of the mathematical models were solved using the program ANSYS® 2020/R1-Transient Thermal/Mechanical module.

2.3.2. Simulation Procedure and Calculation of the Thermal Performance Parameters

The simulations were conducted to determine the effects of the kiln’s configuration (I, II, and III), the selected sidewall’s material, and its thickness on the previously described thermal performance parameters. According to the stage of the charcoal production cycle, the simulation procedure was as follows:
  • Heating stage: for all simulated cases, it was considered the application of constant and uniform heat flux of 3800 W/m2 on the inner face of the sidewalls, which is held until the surface temperature reaches 300 °C [15,19,31]. This heat flux stands for approximately 10% of the total chemical energy of the wood loaded into the kiln and released as combustion thermal energy during a period of 9 h [32].
For this stage, the heat loss from sidewalls (Q) and the total heat supplied to the sidewalls (Etot) were calculated according to Equations (8) and (9), respectively.
Q = A e t = 0 t = t h q d t
E t o t = q 0 t h A i
where q″ is the heat flux released from the outer face of the sidewall as a function of time; Ae is the area of the outer face of the sidewall. Additionally, q0″ stands for the constant heat flux applied to the inner face of the sidewall; th is the time of the heating stage; Ai, the area of the inner face of the sidewall.
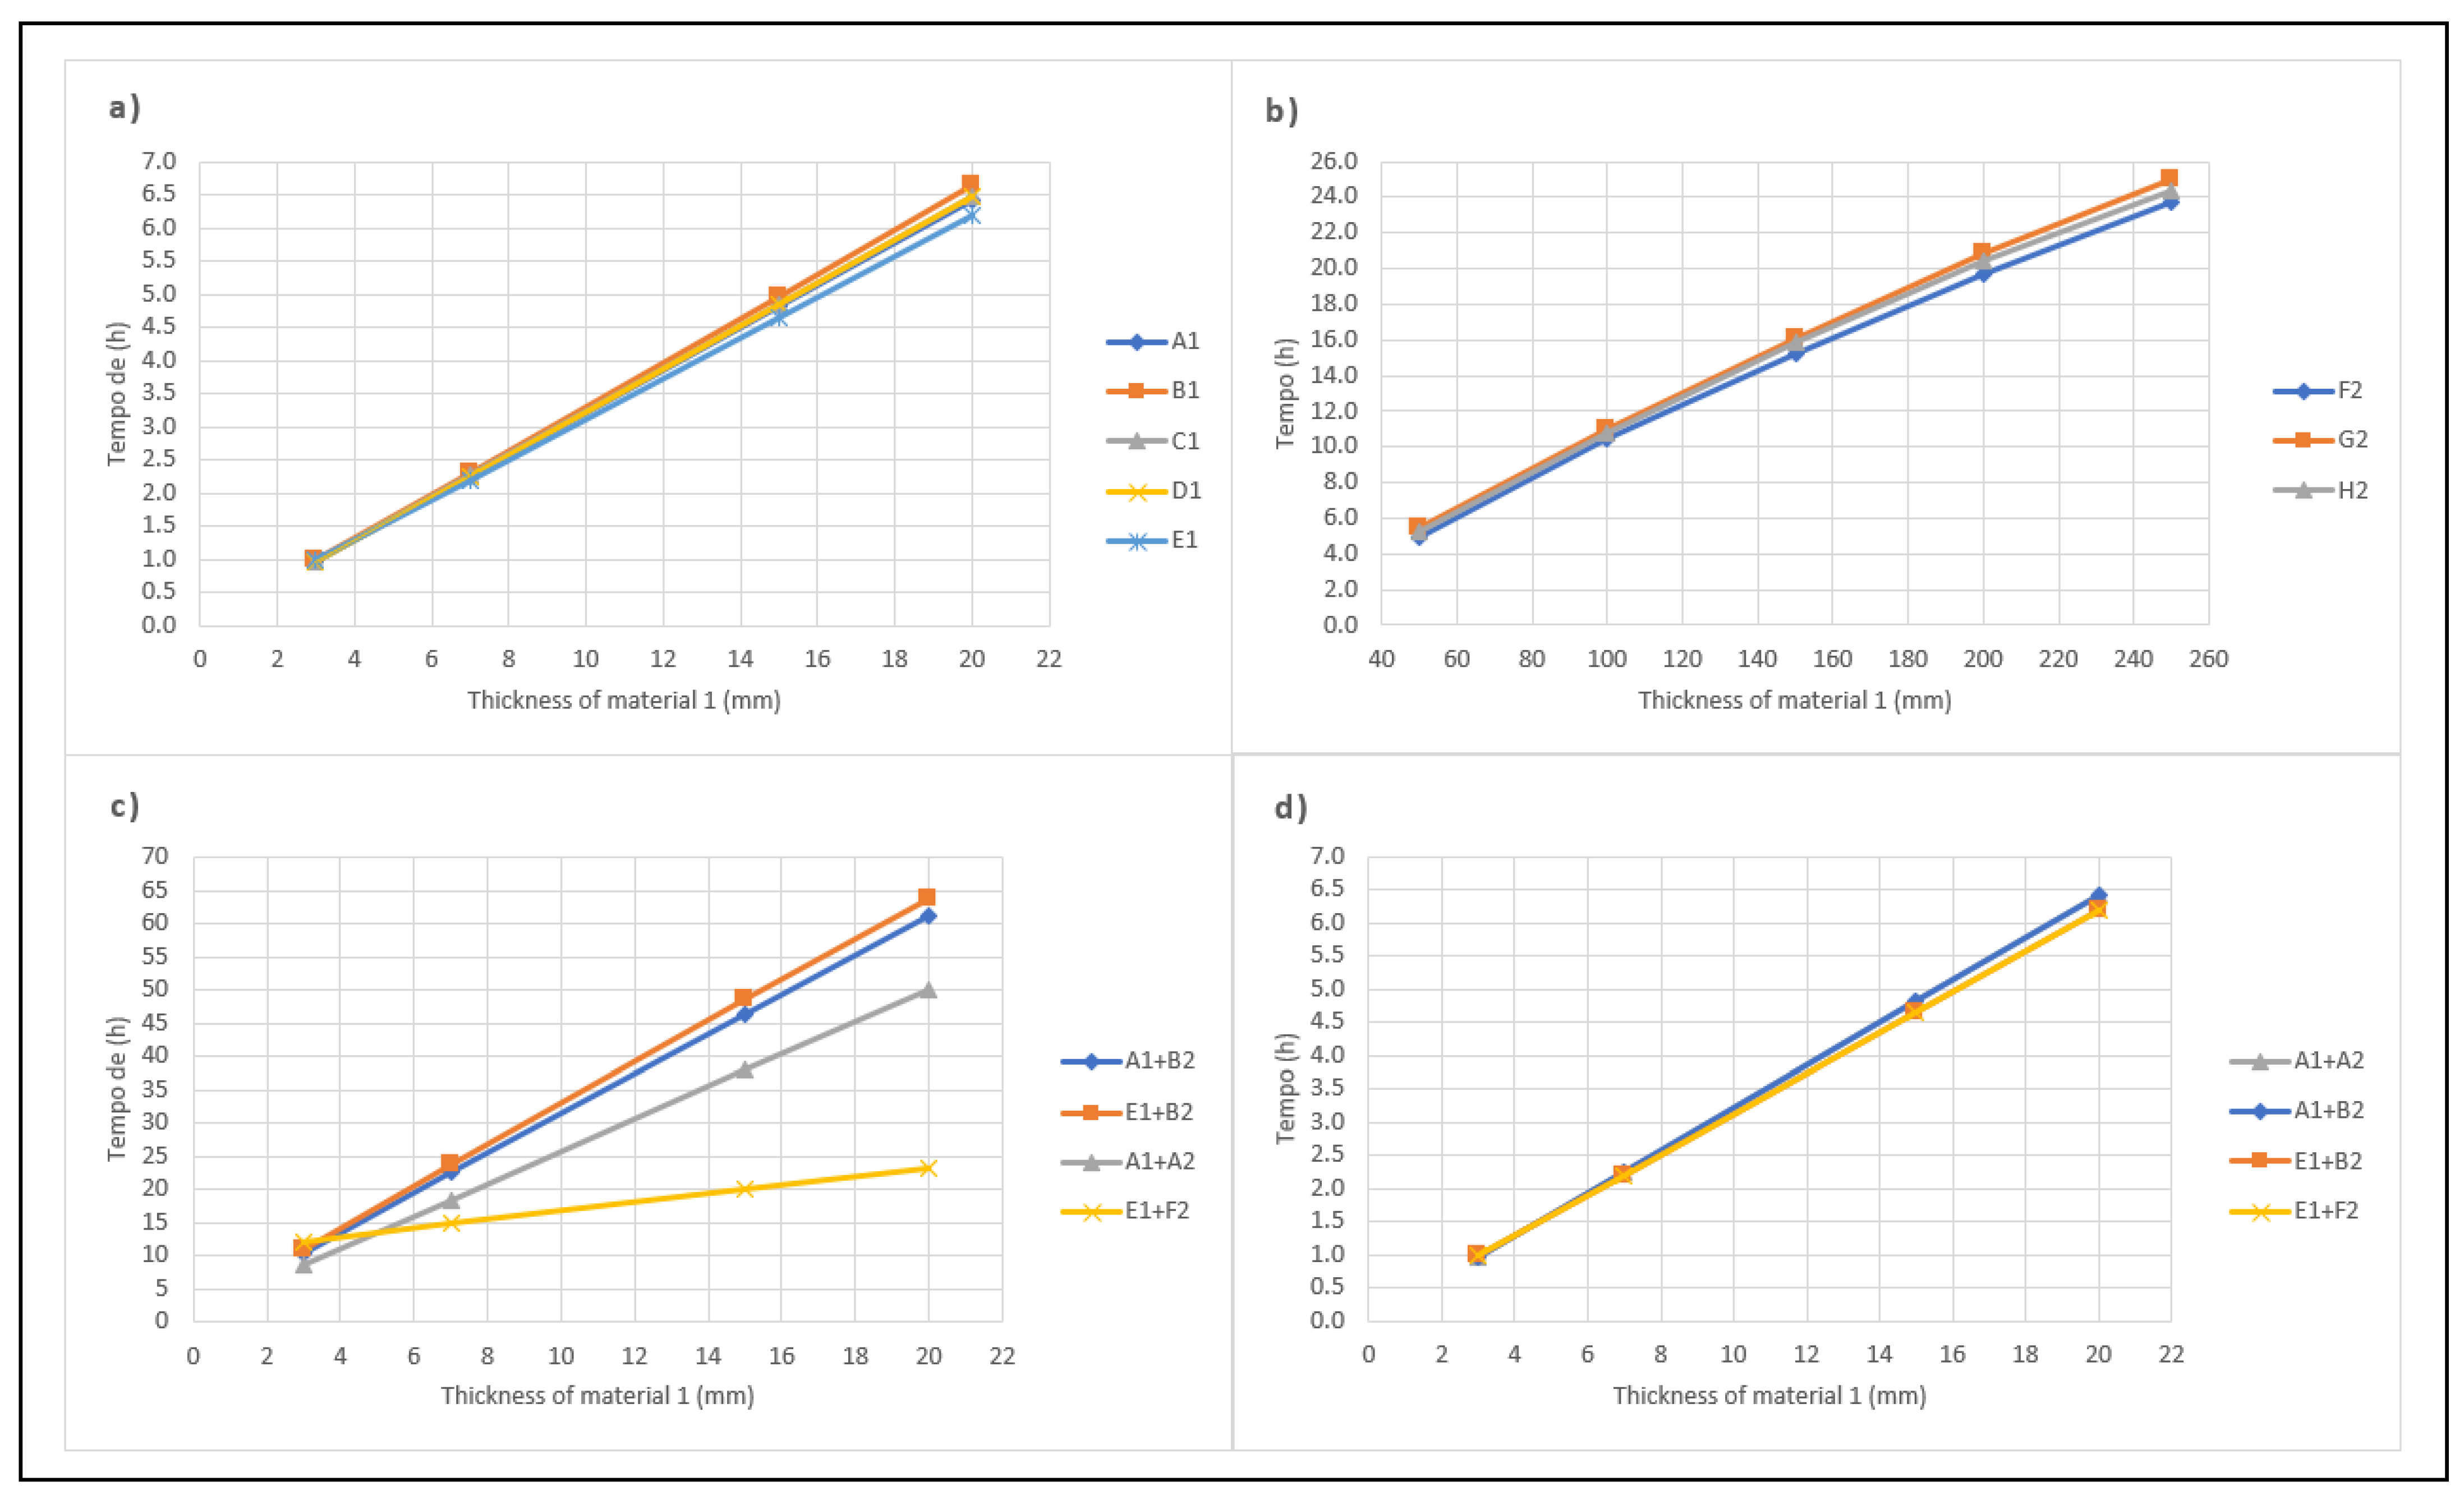
  • Cooling stage: in this stage, simulations consider that the inner face of the sidewall is adiabatic and that the outer face of the sidewall loses heat by convection and thermal radiation with the environment at 25 °C. The performance parameter assessed during this stage is the cooling time of the sidewall. This time ends when the temperature of the inner face of the sidewalls reaches the value of 50 °C, which is an appropriate condition for opening the kiln [18].

3. Results and Discussion

Results presented in this section are discussed in terms of the influence produced by the kiln’s side-wall configurations and the thickness of material 1 on the thermal performance parameters. A two-way ANOVA test was applied first to assess the existence of significant differences brought by combinations of configurations and materials [33]. Afterward, Duncan’s test (Duncan’s multiple ranges) was used to compare sets of means [34].

3.1. Total Heat Supplied to the Sidewall

Figure 4 shows the influence of material 1, its thickness, and the kiln’s configuration on the total heat supplied to the sidewall.
Figure 4a shows that for the metallic materials selected and configuration I, the heat supplied to the kiln’s sidewall grows similarly for materials B1, C1, D1, and E1. For material A1, the energy delivered to the sidewall was, on average, approximately 40% lower than for the other metallic materials.
On the other hand, when employing sidewalls composed of ceramic materials on configuration 1, an increase in the amount of heat supplied up to the thickness of 100 mm was noted. Beyond this thickness, the heat supplied to the sidewalls was kept around the same value. For this situation, the ceramic material G2 demanded approximately 22% higher thermal energy than the others. By comparing Figure 4a,b in terms of total heat supplied, it was noted that metallic sidewalls with thicknesses close to 7 mm were equivalent to ceramic sidewalls with thicknesses around 100 mm. Therefore, considering the same boundary conditions imposed on the sidewalls and kiln’s configuration, sidewalls composed of one layer of the metallic material had an advantage over ceramic ones up to a specific sidewall thickness value.
Figure 4c evaluates the amount of heat supplied for kiln configurations II and III using combinations of two metallic materials (A1 and E1) as material 1, besides one option for ceramic material (F2) and two insulating blankets (A2 and B2) as material 2 to compose the sidewall. In simulations, the thickness of material 2 was kept constant (50 mm).
All curves showed that the amount of heat supplied increased at a higher thickness of the internal metallic material. However, for the sidewall composed of materials E1 + F2, it was noted that the growth in the heat supplied tended to diminish when the thickness of the metallic material was increased, suggesting that the ceramic material brought a favourable effect.
As expected, for sidewalls composed of metallic materials and insulting blankets, combinations performed similarly, and they required less energy when compared to the use of the ceramic material F2. Table 4 shows the reduction in total heat provided to the sidewalls when composed of materials A1 + B2 or E1 + B2 in configuration II or III to sidewalls built with only materials A1 or E1 (configuration I), respectively.
Table 5 summarizes the results obtained from a two-way ANOVA without replications to identify the existence of statistical differences among combinations.
The results from Table 5 indicate that the differences among the means are statistically significant in all cases. Therefore, Duncan’s test was applied to assess the statistical equality of configurations I, II or III separately, and configuration I in comparison with configuration II or III using different materials and thicknesses (Table 6).
Table 6 suggests that for configuration I, only material A1 presented a different result from the other metallic materials; in terms of thickness, all results were different. Among the ceramics, the G2 material differed from the others; as for the thicknesses, only the 50 mm material presented different results.
For configuration II or III, only the means for materials A1 + A2 and A1 + B2 were the same. In addition, considering the material 1 thickness, 3 mm and 7 mm layers had similar results for materials A1 + B2 and E1 + B2.
Results of configuration I versus configuration II or III were similar for the following groups of sidewall materials: C1, B1, E1 + F2, D1, and E1; B1, E1 + F2, D1, E1, and A1; A1, A1 + A2, and A1 + B2. On the other hand, the results for each thickness were all different.

3.2. Heat Loss from Sidewalls

Figure 5 features the influence of the kiln’s configuration, materials used in sidewalls, and their thicknesses on heat loss to the external environment during the heating stage.
For configuration I, results show a progressive increase in the dissipated heat from sidewalls built with metallic materials as their thickness increases, which is a consequence of the high thermal diffusivity and temperatures on the outer surfaces in contact with the external environment. Material B1 promoted the highest dissipated heat for this configuration, while material A1 had the lowest. By comparing these two materials using sidewalls with a thickness of 20 mm, the reduction in heat loss was about 63%. This suggests that relevant differences in heat loss come out even among steels.
Figure 5b illustrates the results of the dissipated heat for configuration I using ceramic materials. In this case, an exponential decrease in heat loss for all materials was verified, which becomes almost insignificant and approximately constant at a thickness of the sidewall greater than 100 mm.
By comparing Figure 5a,b, it is noted that all ceramic materials with thicknesses greater than 100 mm allowed less heat loss than metallic materials with thicknesses close to 3 mm or more.
Figure 5c shows the effect of the material used in the inner and outer layers of the kiln’s sidewall and the variation in thickness of the inner layer material for configurations II and III. As expected, the curves indicate that sidewalls composed of materials E1 + F2 promoted higher heat dissipation than the other sets of materials, which include an insulating blanket. Furthermore, results from Figure 5b,c suggest that one layer of ceramic material (configuration I), with a thickness greater than 100 mm, leads to the similar performance of insulating blankets used along with metallic materials in configuration II or III.
By comparing Figure 5 ac, it is evident that insulating materials play an essential role in reducing heat loss during the heating stage. Table 7 summarizes the reduction in heat dissipated when sidewalls composed of materials A1 + B2 or E1 + B2 in configuration II or III are used instead of sidewalls built with only material A1 or E1 (configuration I), respectively.
Table 8 shows the two-way ANOVA applied to the sidewall heat loss results.
Results indicate that just sidewalls composed of the layered materials used for configurations II or III allow heat loss in a similar way. Table 9 presents the respective Duncan’s test.
Duncan’s test showed that for configuration I, only material A1 led to a different result from the other metallic materials. In addition, the results for the thicknesses of the metallic materials were all different. Among the ceramics, there was no difference in heat loss, but as the sidewall thicknesses for these materials were compared, only the thickness of 50 mm resulted in a significant difference.
For configuration II, only the set of materials E1 + F2 presented a different result from the others, and considering the thickness of the layer 1 material, all effects were the same.
On the other hand, results for the sidewall composed of material A1 were similar to those obtained for the sidewall built of materials E1 + F2 when configuration I was compared with configuration II or III.

3.3. Heating Time

Curves from Figure 6 illustrate the effect of the kiln’s configuration, sidewall mate-rial, and the material thickness on the heating time.
Figure 6a shows that for all metallic materials used in configuration I, there was an increase in the heating time as thicker sidewalls were used. In addition, sidewalls composed of only material A1 featured the shortest heating time for all thicknesses compared to the other materials. It also led to the most significant reduction, of about 37% in the heating time regarding material C1 with the same thickness.
Figure 6b depicts the results of the heating time for ceramic materials using configuration I. Even though all materials evaluated promoted the same trend, sidewalls composed of materials F2 and H2 presented very similar heating times in the thickness range, 19% lower than those obtained using material G2 for thickness greater than 100 mm. For the three materials assessed, the influence of the sidewall’s thickness on the heating time occurred only for sidewalls finer than 100 mm.
In Figure 6c, which presents the results obtained in simulations for kiln’s configurations II or III, all heating times also grew as the inner layer of the sidewall became thicker. The most significant variation in heating time for the same thickness of the inner layer was around 56%, which occurred between the composed sidewalls E1 + F2 and A1 + A2.
Table 10 indicates the reduction in heating time using sidewalls composed of materials A1 + B2 and E1 + B2 compared to those built solely with material A1 or E1, respectively.
Table 11 and Table 12 show the results obtained from the two-way ANOVA and the Duncan’s test, respectively. They suggest that there are significant differences in all cases analysed.
As also observed for the heat loss parameter, results from Table 12 indicate that for configuration I, only material A1 led to a different result from the other metallic materials. Among ceramics, material G2 showed a significant difference. Regarding the thickness of these materials, only that of 50 mm produced a different effect.
Evaluating configuration II or III, only the set of materials E1 + F2 presented a different result from the others; considering the thickness of the layer 1 material, all the results were different.
For configuration I versus configuration II or III, only material A1 and composite material E1 + B2 showed significant equality; comparing the thicknesses of material 1, all results were different.

3.4. Cooling Time

Figure 7 provides information about the influence of the kiln’s configuration, materials, and thicknesses used in the sidewall on the cooling time.
Figure 7a,b show that the cooling times for metallic and ceramic materials have a similar trend, even though the latter grows less as the thickness increases. They also evidence the advantage of using sidewalls built of only one metallic material during the cooling stage, once it meets structural function even using fine layers. Table 13 compares the performance of configurations II and III (pivoting sidewall) for several thicknesses of the materials.
Results from simulations suggest that configuration III with pivoting sidewall could save more than 73% in the cooling time, which would be representative to increase the performance of the carbonization process.
Table 14 and Table 15 summarize the results obtained from the two-way ANOVA and the Duncan’s test, respectively.
Results from Table 14 indicate that the differences among the means are statistically significant in all cases.
Table 15 shows that for configuration I or III, the groups of metallic materials, B1, C1, and D1; C1, D1, and A1; and A1 and E1, presented the same effect; however, the results produced by the sidewall thicknesses for these materials were different. On the other hand, results for the ceramic materials were all different, as were the results among the thicknesses.
Comparing the results obtained using configuration II, the groups of composite materials: A1 + A2, and A1 + B2; A1 + B2, and E1 + B2; E1 + B2, and E1 + F2, led to similar influence. Considering the thicknesses of material 1, all effects were different.
Finally, when analysing the configuration I or III versus configuration II, it was observed that the material B1 and the composite material E1 + F2 produced a similar effect. In addition, no significant difference in results was noticed for the following pairs of sidewall thicknesses: 15–20 mm, and 3–7 mm.

3.5. Reduction of the Wood Charge

To outstand the importance of materials and sidewall configurations assessed in this study, Table 16 shows the equivalent mass of wood that could be saved during the charging of the charcoal kiln. These results were obtained for the case of the higher energy savings reached from simulations, which corresponded to the heating stage using configuration II or III with sidewalls composed of materials E1 + B2 in regard to configuration I using only sidewalls composed of material E1 (reduction of total heat supplied in Table 4).
It is known that the physical and energetic properties of wood can be changed if the biomass undergoes some treatment, such as briquetting or pelleting [35]. By applying these treatments, it is possible to modify the characteristics of the biomass and so the available energy for the charcoal production process. However, due to technological constraints, most of the charcoal kilns are still charged using wood without any modification in its energetic density. Results summarized in Table 16 were obtained considering the lower heating value of three different untreated biomasses [36,37]. They show that the save of wood charged into the kiln varies proportionally to the thickness of material 1 in the sidewall, covering the maximum range from 6.99 to 50.75 kg.

4. Conclusions

Using numerical simulations, the present study compared the influence of sidewalls of different materials and thicknesses as well as kiln configurations on the variation of four thermal parameters: heat supplied to the side wall, heat loss from sidewalls; heating time, and cooling time.
It was found that sidewalls composed of stainless steel AISI 410 S in configuration I need to absorb a higher quantity of heat under the boundary and initial conditions imposed for all cases. Similarly, sidewalls with a combination of stainless steel AISI 316 L and an insulating blanket in configuration II or III led to spending more time for heating and cooling, which contributes to making the cycle of charcoal production longer.
A new alternative of sidewall configuration for kilns used in charcoal production was analysed. Such a proposal uses a pivoting mechanism to reduce or accelerate the heat loss to the environment during the heating or cooling stage. By comparing with the configuration I using the same materials and thicknesses of the inner layer of the sidewalls, the results obtained for the moving sidewall were encouraging. In terms of heating and cooling times, heat supplied to the sidewalls, and heat loss to the environment, the reductions were up to 62%, 91%, 80%, and 99.7%, respectively. Finally, it was found that for the condition of lower energy loss across the kiln’s sidewall, the charge of wood can be reduced by approximately 7.3 times when the thickness of material 1 varies from 3 to 20 mm.

Author Contributions

Conceptualization, A.R.V., J.R.B. and A.B.J.; methodology, A.R.V. and J.R.B.; software, A.R.V.; validation, A.R.V. and J.R.B.; formal analysis, A.R.V.; investigation, A.R.V.; resources, A.R.V.; data curation, A.R.V.; writing—original draft preparation, A.R.V., J.R.B. and A.B.J.; writing—review and editing, A.R.V., J.R.B. and A.B.J.; visualization, A.R.V. and J.R.B.; supervision, J.R.B. and A.B.J.; project administration, J.R.B. and Barghini Junior. All authors have read and agreed to the published version of the manuscript.

Funding

This study was financed in part by the Coordination for the Improvement of Higher Education Personnel—Brazil (CAPES), Finance Code 001.

Institutional Review Board Statement

Not applicable.

Informed Consent Statement

Not applicable.

Data Availability Statement

Not applicable.

Conflicts of Interest

The authors declare no conflict of interest.

References

  1. FAO. Forestry Production and Trade. Available online: http://www.fao.org/faostat/en/#data/FO (accessed on 29 April 2022).
  2. de Oliveira Miranda, S.D.F.; Piekarski, C.M.; Ugaya, C.M.L.; Donato, D.B.; Júnior, A.B.; De Francisco, A.C.; Carvalho, A.M.M.L. Life Cycle Analysis of Charcoal Production in Masonry Kilns with and without Carbonization Process Generated Gas Combustion. Sustainability 2017, 9, 1558. [Google Scholar] [CrossRef]
  3. Lopes, N.L.; de Nacif, A.P.; de Carneiro, A.C.O.; Assis, J.B.; Oliveira, A. Ciflorestas; Aço Verde Brasileiro: Açailândia, Brazil, 20 March 2018. [Google Scholar]
  4. Adam, J.C. Improved and More Environmentally Friendly Charcoal Production System Using a Low-Cost Retort–Kiln (Eco-Charcoal). Renew. Energy 2009, 34, 1923–1925. [Google Scholar] [CrossRef]
  5. Centro de Gestão e Estudos Estratégicos (CGEE). Modernização Da Produção de Carvão Vegetal No Brasil: Subsídios Para Revisão Do Plano Siderurgia; Centro de Gestão e Estudos Estratégicos: Brasília, Brazil, 2015. [Google Scholar]
  6. Pratt, K.; Moran, D. Evaluating the Cost-Effectiveness of Global Biochar Mitigation Potential. Biomass Bioenergy 2010, 34, 1149–1158. [Google Scholar] [CrossRef]
  7. Brito, J.O. Princípios de Produção e Utilização de Carvão Vegetal de Madeira; USP/ESALQ—Documentos Florestais: Piracicaba, Brazil, 1990; pp. 1–19. [Google Scholar]
  8. de Assis, M.R.; de Protásio, T.P.; de Assis, C.O.; Trugilho, P.F.; Santana, W.M.S. Qualidade e Rendimento Do Carvão Vegetal de Um Clone Híbrido de Eucalyptus Grandis x Eucalyptus Urophylla. Pesquisa Florestal Brasileira 2012, 32, 291–302. [Google Scholar] [CrossRef]
  9. Peláez-Samaniego, M.R.; Garcia-Perez, M.; Cortez, L.B.; Rosillo-Calle, F.; Mesa, J. Improvements of Brazilian carbonization industry as part of the creation of a global biomass economy. Renew. Sustain. Energy Rev. 2008, 12, 1063–1086. [Google Scholar] [CrossRef]
  10. Syred, C.; Griffiths, A.J.; Syred, N.; Beedie, D.; James, D. A clean, efficient system for producing Charcoal, Heat and Power (CHaP). Fuel 2006, 85, 1566–1578. [Google Scholar] [CrossRef]
  11. Rodrigues, T.; Braghini Junior, A. Charcoal: A discussion on carbonization kilns. J. Anal. Appl. Pyrolysis 2019, 143, 104670. [Google Scholar] [CrossRef]
  12. Silva, F.T.M.; Ataíde, C.H. Valorization of Eucalyptus Urograndis Wood via Carbonization: Product Yields and Characterization. Energy 2019, 172, 509–516. [Google Scholar] [CrossRef]
  13. Oliveira, A.C.; de Carneiro, A.C.O.; Barcellos, D.C.; Rodriguez, A.V.; Amaral, B.M.N.; Pereira, B.L.C. Resfriamento Artificial Em Fornos Retangulares Para a Produção de Carvão Vegetal. Revista Árvore 2015, 39, 769–778. [Google Scholar] [CrossRef]
  14. Rodrigues, T.; Braghini Junior, A. Technological Prospecting in the Production of Charcoal: A Patent Study. Renew. Sustain. Energy Rev. 2019, 111, 170–183. [Google Scholar] [CrossRef]
  15. Bustos-Vanegas, J.D.; Martins, M.A.; De Cassia, A.; Carneiro, O.; Freitas, A.G.; Barbosa, R.C. Thermal Inertia e Ff Acts of the Structural Elements in Heat Losses during the Charcoal Production in Brick Kilns. Fuel 2018, 226, 508–515. [Google Scholar] [CrossRef]
  16. Bustos-Vanegas, J.D. Characoal Cooling Kinetics: Computacional Simulation and Industrial Aplications. Ph.D. Thesis, Universidade Federal de Viçosa, Viçosa, Brazil, 2018. [Google Scholar]
  17. Shah, N.; Girard, P.; Mezerette, C.; Vergnet, A.M. Wood-to-Charcoal Conversion in a Partial-Combustion Kiln: An Experimental Study to Understand and Upgrade the Process. Fuel 1992, 71, 955–962. [Google Scholar] [CrossRef]
  18. Oliveira, A.C. Sistema forno-fornalha para produção de carvão vegetal. Master’s Thesis, Universidade Federal de Viçosa, Viçosa, Brazil, 2012. [Google Scholar]
  19. Oliveira, A.C.; de Cássia Oliveira Carneiro, A.; Pereira, B.L.C.; Rocha Vital, B.R.; Carvalho, A.M.M.L.; Trugilho, P.F.; Damásio, R.A.P. Optimization of charcoal production through control of carbonization temperatures. Revista Árvore 2013, 37, 557–566. Available online: https://www.scielo.br/pdf/rarv/v37n3/a19v37n3.pdf (accessed on 30 May 2022). [CrossRef]
  20. Lana, A.Q. Forno de Alvenaria Para Incremento Da Produtividade Por Meio Do Resfriamento Externo Do Carvão Vegetal. Ph.D. Thesis, USP/Escola Superior de Agricultura, Piracicaba, Brazil, 2018. [Google Scholar]
  21. Matweb AISI 1020 Steel, as Rolled. Available online: http://www.matweb.com/search/DataSheet.aspx?MatGUID=a2eed65d6e5e4b66b7315a1b30f4b391 (accessed on 27 February 2021).
  22. Çengel, Y.A.; Ghajar, A. Transferência de Calor e Massa—Uma Abordagem Prática, 4th ed.; McGraw Hill: Porto Alegre, Brazil, 2012. [Google Scholar]
  23. Matmatch SEW 470 Grade X12CrNi23-13 Solution Annealed (+AT). Available online: https://matmatch.com/materials/minfm32771-sew-470-grade-x12crni23-13-solution-annealed-at- (accessed on 27 February 2021).
  24. Matmatch EN 10088-1 Grade X6Cr13 Soft Annealed (+A). Available online: https://matmatch.com/materials/minfc21051-en-10088-1-grade-x6cr13-soft-annealed-a- (accessed on 27 February 2021).
  25. Matmatch EN 10095 Grade NiCr20Ti Solution Annealed (+AT). Available online: https://matmatch.com/materials/minfm35126-en-10095-grade-nicr20ti-solution-annealed-at-%0A (accessed on 2 May 2022).
  26. Matmatch EN 10028-7 Grade X3CrNiMoBN17-13-3 Solution Annealed (+AT). Available online: https://matmatch.com/materials/minfm36124-en-10028-7-grade-x3crnimobn17-13-3-solution-annealed-at- (accessed on 2 May 2022).
  27. França, G.A.C.; Campos, M.B. Análise Teórica e Experimental Do Resfriamento de Carvão Vegetal Em Forno Retangular. In Proceedings of the 4th Encontro de Energia no Meio Rural. 2020. Available online: http://www.proceedings.scielo.br/scielo.php?pid=MSC0000000022002000100017&script=sci_arttext&tlng=en (accessed on 30 May 2022).
  28. de Miranda, R.C.; Bailis, R.; de Vilela, A.O. Cogenerating Electricity from Charcoaling: A Promising New Advanced Technology. Energy Sustain. Dev. 2013, 17, 171–176. [Google Scholar] [CrossRef]
  29. Filho, D.O.; Teixeira, C.A.; De Silva, J.S.E.; Reis, H.O.; Vorobieff, C.L. Resfriamento Rápido de Fornos de Carbonização. Eng. Agric. 2010, 30, 1023–1032. [Google Scholar] [CrossRef]
  30. Santos, I.D.S.D. Resfriamento Artificial de Carvão Vegeral Em Fornos de Alvenaria. Ph.D. Thesis, Universidade Federal de Viçosa, Viçosa, Brazil, 2013. [Google Scholar]
  31. Sangsuk, S.; Buathong, C.; Suebsiri, S. High-Energy Conversion Efficiency of Drum Kiln with Heat Distribution Pipe for Charcoal and Biochar Production. Energy Sustain. Dev. 2020, 59, 1–7. [Google Scholar] [CrossRef]
  32. Daugaard, D.E.; Brown, R.C. Enthalpy for Pyrolysis for Several Types of Biomass. Energy Fuels 2003, 50011, 934–939. [Google Scholar] [CrossRef]
  33. Tukey, J.W. One Degree of Freedom for Non-Additivity. Biometrics 1949, 5, 232–242. [Google Scholar] [CrossRef]
  34. Duncan, B. David Multiple Range and Multiple F Tests. Biometrics 1955, 11, 1–42. [Google Scholar] [CrossRef]
  35. Roman, K.; Barwicki, J.; Rzodkiewicz, W.; Dawidowski, M. Evaluation of Mechanical and Energetic Properties of the Forest Residues Shredded Chips during Briquetting Process. Energies 2021, 14, 3270. [Google Scholar] [CrossRef]
  36. Nurek, T.; Gendek, A.; Roman, K. Forest Residues as a Renewable Source of Energy: Elemental Composition and Physical Properties. BioResources 2019, 14, 6–20. [Google Scholar] [CrossRef]
  37. Quirino, W.F.; Do Vale, A.T.; De Andrade, A.P.A.; Abreu, V.L.S.; Azevedo, A.C.D.S. Poder Calorífico Da Madeira e de Materiais Ligno-Celulósicos. Revista da Madeira 2005, 89, 100–106. [Google Scholar]
Figure 1. Sequence for the thermal analysis of configurations and sidewalls materials of the kiln.
Energies 15 05872 g001
Figure 2. Carbonization kiln configurations: (I) fixed sidewall composed of material 1; (II) fixed side wall composed of materials 1 and 2; (III) pivoting sidewall for the heating stage with materials 1 and 2, and the cooling stage with material 1.
Energies 15 05872 g002
Figure 3. Flowchart used for the material selection of sidewalls.
Energies 15 05872 g003
Figure 4. Heat supplied to the sidewalls for different thicknesses and configurations. (a) metallic materials (configuration I); (b) ceramic materials (configuration I); and (c) material composition (configuration II or III-no pivoting sidewall).
Energies 15 05872 g004
Figure 5. Heat loss through the sidewalls during the heating phase for different thicknesses and configurations; (a) metallic materials (configuration I); (b) ceramic materials (configuration I); and (c) material composition (configuration II or III–without pivoting side walls).
Energies 15 05872 g005
Figure 6. Heating time for different thicknesses and configurations. (a) metallic materials (configuration I); (b) ceramic materials (configuration I); and (c) material composition (configurations II or III-on-pivoting sidewall).
Energies 15 05872 g006
Figure 7. Cooling time for different thicknesses and configurations. (a) metallic materials (configuration I); (b) ceramic materials (configuration I); (c) material composition (configuration II); and (d) material composition (sidewall pivoting III configuration).
Energies 15 05872 g007
Table 1. Thermophysical properties of the selected metallic materials.
Material SymbolDensityThermal
Conductivity
Specific HeatEmissivityRef.
(kg/m3)(W/m·K)(J/kg·K)-
AISI 1020A1794051.94380.32[21,22]
AISI 309 SB1780015.95030.40[22,23]
AISI 410 SC1770025.24980.40[22,24]
Nimonic 75D1840015.64550.40[22,25]
AISI 316 LE1798015.04600.40[22,26]
Table 2. Composition of the selected insulating blankets and ceramic materials.
MaterialSymbolConcentration (wt%)
Al2O3SiO2Fe2O3CaOMgOFe2O3 + TiO2Na2O + K2OCaO + MgONa,O,K
Insulating blanketA24456---0.150.10.05-
Insulating blanket B2-60<1297----
Insulating blanket C24554≤0.15---≤0.2≤0.1-
Insulating blanket D24851---0.2-0.4---
Insulating blanket E24554≤0.15---≤0.2≤0.1-
Typical brick (clay)F2---------
Brick (refractory)G2---------
Mortar with cement, sand, and stoneH2---------
Table 3. Thermophysical properties of the selected insulating blankets and ceramic materials.
MaterialDensityThermal ConductivitySpecific HeatEmissivityRef.
(kg/m3)(W/m·K)(J/kg·K)-
A2960.067500.32[22]
B21280.0488500.32[22]
C2960.0657300.32[22]
D2620.087100.32[22]
E2960.078000.32[22]
F219220.728000.95[22]
G219200.907900.75[22]
H218600.728400.90[22]
Table 4. Reduction in total heat supplied to sidewalls A1 + B2 or E1 + B2 (configuration II or III-no pivoting door) compared to sidewalls A1 or E1 (configuration I).
Kiln’s
Configuration
Materials of the SidewallEnergy (kWh)
3 (mm)7 (mm)15 (mm)20 (mm) *
IA128.9767.78146.71195.92
II or IIIA1 + B216.2736.2175.58100.09
Reduction 44%47%48%49%
IE142.43102.14210.77277.63
II or IIIE1 + B28.9419.9941.7355.22
Reduction79%80%80%80%
* Thickness of material 1.
Table 5. Two-way ANOVA applied to results of the total heat supplied to the sidewalls.
CaseMaterial TypeSource of VariationFFcriticalF  > Fcritical
Results obtained for configuration IMetallic materialsMaterials of the sidewall186.233.49yes
Thickness of material 19.703.26yes
Ceramic materialsMaterials of the sidewall13.243.84yes
Thickness of material 1102.424.46yes
Results obtained for configuration II or IIILayered materialsMaterials of the sidewall26.893.86yes
Thickness of material 165.923.86yes
Comparative results for configuration I versus II or IIILayered materialsMaterials of the sidewall35.183.01yes
Thickness of material 19.392.36yes
Table 6. Duncan’s test for total heat supplied to the sidewall for different sidewall configurations, materials, and material thickness.
CaseDuncan (Confidence Interval of 95%)
Sidewall
Material
GroupThickness Material 1Group
Results obtained for
configuration I
C1A 20A
B1A 15 B
D1A 7 C
E1A 3 D
A1 B
G2A 250A
H2 B 150A
F2 B 200A
100A
50 B
Results obtained for
configuration II or III
E1 + F2A 20A
A1 + A2 B 15 B
A1 + B2 B 7 C
E1 + B2 C 3 C
Comparative results for
configuration I versus II or III
C1A 20A
B1AB 15 B
E1 + F2AB 7 C
D1AB 3 D
E1AB
A1 BC
A1 + A2 CD
A1 + B2 CD
The means followed by the same letter are not different at the confidence level of 95%.
Table 7. Reduction of heat loss from sidewalls A1 + B2 or E1 + B2 (configuration II or III) compared to sidewalls A1 or E1 (configuration I).
Kiln’s
Configuration
Materials of the
Sidewall
Energy (kWh)
3 (mm)7 (mm)15 (mm)20 (mm) *
IA115.8036.3557.9270.65
II or IIIA1 + B20.050.510.911.52
Reduction 99.7%99%98%98%
IE125.2056.81137.55190.94
II or IIIE1 + B20.060.370.791.65
Reduction99.8%99%99%99%
* Thickness of material 1.
Table 8. Two-way ANOVA applied to the sidewall heat loss results.
CaseMaterial TypeSource of VariationFFcriticalF  > Fcritical
Results obtained for configuration IMetallic materialsMaterials of the sidewall34.413.49yes
Thickness of material 15.243.25yes
Ceramic materialsMaterials of the sidewall8.343.83yes
Thickness of material 11.384.45yes
Results obtained for configuration II or IIILayered materialsMaterials of the sidewall2.703.86no
Thickness of material 19.173.86yes
Comparative results for configuration I versus II or IILayered materialsMaterials of the sidewall9.233.00yes
Thickness of material 18.412.35yes
Table 9. Duncan’s test for heat loss from sidewalls of different configurations, materials, and material thicknesses.
CaseDuncan (Confidence Interval of 95%)
Sidewall
Material
GroupThickness of Material 1Group
Results obtained for configuration IB1A 20A
D1A 15 B
E1A 7 C
C1A 3 D
A1 B
G2A 50A
F2A 100 B
H2A 150 B
200 B
250 B
Results obtained for configuration II or IIIE1 + F2A 20A
A1 + A2 B 15A
A1 + B2 B 7A
E1 + B2 B 3A
Comparative results for configuration I versus II or IIB1A 20A
D1A 15A
E1A 7 B
C1AB 3 B
A1 BC
E1 + F2 C
A1 + A2 C
A1 + B2 C
E1 + B2 C
The means followed by the same letter are not different at the confidence level of 95%.
Table 10. Reduction in heating time for sidewall A1 + B2 or E1 + B2 (configuration II or III) compared to sidewalls A1 or E1 (configuration II or III, non-pivoting sidewall).
Kiln’s
Configuration
Materials of the
Sidewall
Time (h)
3 (mm)7 (mm)15 (mm)20 (mm) *
IA10.431.012.192.93
II or IIIA1 + B20.240.541.131.50
Reduction 44%47%48%49%
IE10.661.533.154.15
II or IIIE1 + B20.250.571.191.57
Reduction62%63%62%62%
* Thickness of material 1.
Table 11. Two-way ANOVA applied to the results of heating time.
CaseMaterial TypeSource of VariationFFcriticalF  > Fcritical
Results obtained for configuration IMetallic materialsMaterials of the sidewall186.093.49yes
Thickness of material 19.723.26yes
Ceramic materialsMaterials of the sidewall22.073.84yes
Thickness of material 1123.704.46yes
Results obtained for configuration II or IIILayered materialsMaterials of the sidewall84.623.86yes
Thickness of material 1133.843.86yes
Comparative results for configuration I versus II or IILayered materialsMaterials of the sidewall43.763.01yes
Thickness of material 19.312.36yes
Table 12. Duncan’s test for heating time using different sidewall configurations, materials, and material thicknesses.
CaseDuncan (Confidence Interval of 95%)
Sidewall
Material
GroupThickness of Material 1Group
Results obtained for configuration IC1A 20A
B1A 15 B
D1A 7 C
E1A 3 D
A1 B
G2A 250A
F2 B150A
H2 B200A
100A
50 B
Results obtained for configuration II or IIIE1 + F2A 20A
E1 + B2 B 15 B
A1 + A2 B 7 C
A1 + B2 B 3 D
Comparative results for configuration I versus II or IIC1A 20A
B1A 15 B
E1 + F2A 7 C
D1A 3 D
E1AB
A1 BC
E1 + B2 C
A1 + A2 C
A1 + B2 C
The means followed by the same letter are not different at the confidence level of 95%.
Table 13. Influence of the kiln’s configurations III (pivoting sidewall) and II on the cooling time.
Materials of the
Sidewall
Thickness of
Material 1
(mm)
Cooling Time (h)Time
Reduction
Configuration IIConfiguration III
E1 + B23.0010.830.9991%
7.0023.612.1891%
15.0048.614.6590%
20.0063.896.1990%
A1 + A23.008.470.9689%
7.0018.442.2588%
15.0037.924.8287%
20.0050.006.4287%
A1 + B23.0010.420.9691%
7.0022.502.2590%
15.0046.394.8290%
20.0061.116.4289%
E1 + F23.0012.000.9992%
7.0015.002.1885%
15.0020.004.6577%
20.0023.066.1973%
Table 14. Two-way ANOVA applied to the cooling time results.
CaseMaterial TypeSource of VariationFFcriticalF  > Fcritical
Results obtained for configuration I or IIIMetallic materialsMaterials of the sidewall6221.893.49yes
Thickness of material 15.553.26yes
Ceramic materialsMaterials of the sidewall5322.333.84yes
Thickness of material 127.284.46yes
Results obtained for configuration IILayered materialsMaterials of the sidewall5743.293.86yes
Thickness of material 13.823.86yes
Comparative results for configuration I or III versus IILayered materialsMaterials of the sidewall8.243.01yes
Thickness of material 19.72.36yes
Table 15. Duncan’s test for cooling time using different sidewall configurations, for different materials, and material thicknesses.
CaseDuncan (Confidence Interval of 95%)
Sidewall
Material
GroupThickness of
Material 1
Group
Results obtained for configuration I or IIIB1A 20A
C1AB 15 B
D1AB 7 C
A1 BC3 D
E1 C
G2A 250A
H2 B 200 B
F2 C150 C
100 D
50 E
Results obtained for configuration IIA1 + A2A 20A
A1 + B2 AB 15 B
E1 + B2 BC7 C
E1 + F2 C3 D
Comparative results for configuration I or III versus IIE1 + B2A 20A
A1 + B2 A 15A
A1 + A2AB 7 B
E1 + F2 BC3 B
B1 C
C1 C
D1 C
A1 C
E1 C
The means followed by the same letter are not different at the confidence level of 95%.
Table 16. Maximum reduction in the kiln’s charge by using several woods.
BiomassMass (kg)
3 (mm)7 (mm)15 (mm)20 (mm) *
Residues from Pinus sylvestris L. [35]7.62 18.75 38.57 50.75
Pinus sp. [36]7.47 18.34 37.74 49.65
Eucalyptus sp. [36]6.99 17.15 35.29 46.43
* Thickness of material 1.
Publisher’s Note: MDPI stays neutral with regard to jurisdictional claims in published maps and institutional affiliations.

