Article

Assessment of Biomass and Biochar of Maritime Pine as a Porous Medium for Water Retention in Soils

by
Rodrigo V. Santos
1,
Miguel A. A. Mendes
2,
Carlos Alexandre
3,
Manuela Ribeiro Carrott
4,
Abel Rodrigues
2,5,6 and
Ana F. Ferreira
2,*
1
Instituto Superior Técnico, Universidade de Lisboa, 1 1049-001 Lisboa, Portugal
2
IDMEC, Instituto Superior Técnico, Universidade de Lisboa, 1049-001 Lisboa, Portugal
3
Department of Geosciences (ECT) and MED—Mediterranean Institute for Agriculture, Environment and Development, Instituto de Investigação e Formação Avançada, Universidade de Évora, Pólo da Mitra, Ap. 94, 7006-554 Évora, Portugal
4
LAQV-REQUIMTE, Instituto de Investigação e Formação Avançada, Departamento de Química e Bioquímica, Escola de Ciências e Tecnologia, Colégio Luís António Verney, Universidade de Évora, 7000-671 Évora, Portugal
5
INIAV, Instituto de Investigação Agrária e Veterinária, 2780-157 Oeiras, Portugal
6
GeoBiotec, Faculdade de Ciências e Tecnologia, Universidade Nova de Lisboa, 2825-149 Caparica, Portugal
*
Author to whom correspondence should be addressed.
Energies 2022, 15(16), 5882; https://doi.org/10.3390/en15165882
Submission received: 11 July 2022 / Revised: 2 August 2022 / Accepted: 4 August 2022 / Published: 13 August 2022
(This article belongs to the Special Issue Sustainable and Circular Systems for Biofuel Production and Usage)

Abstract

:
Pinewood biomass in Portugal can be considered a major source of biochar for soil physical, chemical, and biological edaphic amendment. This work intended to evaluate the aptitude of lab produced biochar for upgrading soil moisture dynamics’ relationships considering mixtures of biochar with silica-based sand. The methodology used focused on the carbonization of pine biomass with inert atmosphere at 300 °C, 400 °C, 500 °C and 600 °C, followed by a chemical proximate and thermogravimetric analysis, scanning electron microscopy, Fourier Transform Infrared analysis, numerical modeling, and characterization of biochar porosity by gas adsorption (Brunauer–Emmett–Teller) and mercury porosimetry. The results showed the increased amounts of soil water retention and plant available water, evaluated through pF curves, due to biochar application. The thermogravimetric analysis mass loss patterns and FTIR transmittance, reflected major structural modifications in carbonized products by comparison with raw biomass. Mercury porosimetry showed that biochar pores between 392 and 250 μm and 32 μm and 6 μm gave the highest pore volume for water retention with a major increase from carbonization, by comparison with physical activation. The used methodologies allowed us to conclude that the carbonaceous feedstock can potentiate the improvement of soil water relations aiming at agricultural land use.

1. Introduction

Biochar, the main product of biomass carbonization or slow pyrolysis, is a feedstock for innumerous applications such as soil amendment, source of heat and power, industrial applications or activated carbon. Biochar application in soil contributes decisively for boosting edaphic physical, chemical and biological profiles with a positive impact on agricultural productivity, while delivering a negative carbon budget along the lifecycle thus contributing to the mitigation of negative impacts in climate change [1,2,3,4].
Maritime pine is a major forest species in Portugal, being a potential huge biomass source for biochar production. [5] This carbonaceous feedstock can be obtained from the carbonization of hardwoods and softwoods’ biomasses which are mainly composed by lignin, cellulose, and hemicellulose. A major difference between hardwood and softwood biomasses is the highest content of lignin in the latter, 35–40%, vs. 20–25% in the former. Conversely, the cellulose amount is of around 45–50% in hardwoods’ biomass vs. 20–25% in softwoods’. The hemicellulose amounts in both biomasses are similar being 25–30% in softwoods and 45–50% in hardwoods [6].
Biochar exhibits a spongy structure which interconnects with outside boundaries of its particles delivering a surface area between orders of magnitude up to hundreds of m2g−1 [7,8]. Soil specific surface area is a relevant property influencing fertility, and other important features such as water and air flow, nutrient cycling and microbial activity (Figure 1) [4,9].
Surface specific area of soil mineral constituents increase from coarse and fine sands (about 0.01 m2g−1 to 0.1 m2g−1) up to clays, with much higher specific surface area, namely as in montmorillonite, the bentonite’s main clay mineral, is also dominant in some soils [10]. Soils containing a large fraction of clay may have high total water-holding capacity but inadequate aeration. Biochar specific surface areas, being generally higher than sand and comparable or higher than clay, will therefore cause a net increase in the total soil-specific surface when added as an amendment. Typical specific surface areas for pores with diameters lower than 2 nm and between 50 nm and 200 nm range between 750 m2g−1 and1360 m2g−1 and 51 m2g−1 and138 m2g−1, respectively [10,11,12].
Soil texture is determinant to the amount of water that can be retained, with stiffer retention of water molecules occurring in fine clay structure. Organic matter amendments will improve the water holding capacity of soil especially in coarse sandy soils by comparison with finer clay textured soils. The positive effect of soil organic matter, which can take water up to 20 times its mass, is due to its swelling and shrinking properties and to a porosity increase [7,10].
The water holding capacity (WHC) of soils, also known as field capacity, is defined as the amount of water retained in a soil that has been saturated, and therefore allowed to gravity drainage corresponding roughly to a suction of 33 kPa. Another soil moisture variable is wilting point defined as the water content below which the plant will wilt, considered as the amount of water retained in the soil when submitted to a pressure of 1500 kPa. Those properties are evaluated though pF curves simulating suction stresses for water removal which have to be exerted on soil, e.g., by plant roots.
In all this context, WHC is also potentiated from biochar due to its high porosity. The major effect of biochar amendment is expected in the lower pF segment, corresponding to soil water contents closer to field capacity wherein the effects of pores higher than 50 nm diameter, prevail. These dimensions induce a strong hold of incoming water drops by the biochar particles. With a smaller porosity most plants are not able to extract water from soil [7]. Biochar should also positively affect water infiltration in soils due to its porous structure. However, this impact was shown to be reduced in soils with high amounts of organic matter [13,14].
Higher increases of the soil WHC, up to 30%, have been reported in soils with lower initial WHC values. Biochar WHC can be very high with some feedstocks able to absorb up to 10 times its weight in water. Internal biochar porosity alone cannot accommodate such amounts of water, therefore requiring the contribution of interporosity between irregularly shaped biochar particles [1,2,15,16].
Soil water repellency is another soil process which can be caused by biochar. This process is essentially characterized by a reduction of the affinity of soils to water by resisting wetting periods ranging from seconds to a few days or weeks [14].
Concerning water retention capacity, the porosity classification distinguishing between micropores, mesopores and macropores with typical dimensions lower than 2 nm, between 2 and 50 nm and higher than 50 nm, is not sufficient due to the dominance of larger biochar pore sizes in water retention. A decrease of biochar particle size to a micro range between 10 and600 µm can lead to an increase of the available sites for water adsorption and a further decrease of biochar particle size to a nano range of 100 nm can increase its overall properties, concerning biological environment, adsorption capability and surface/volume ratio [4].
In this context, an alternative functional classification can be [17]: (i) external porosity, for the pores between biochar particles, with size and shape depending on particle size and morphology; (ii) residual porosity inherited from the feedstock structure with a pore size distribution centered in the range between 1 μm and 100 μm. These pores are derived from plant cellular structures, such as pinewood tracheids, constituting the bulk of biochar pore volumetry [18,19], and (iii) pyrogenic nanopores, in the range between smaller than 2 nm up to 50 nm, being internal pores produced at higher carbonization temperatures. The contribution of pyrogenic porosity for liquid uptake is very small [20,21]. For biochar mesoporosity, capillary condensation prevails in water capturing. For microporosity, adsorption in molecular layers commands water volume filling [22,23].
Intrapore size and configuration provide additional space for water storage beyond the interpore space between particles exerting influence on porosity and water storage [2,17]. Moreover due to different dimensions, biochar particles can fill the spaces between coarser soil particles or contribute to the packing of soil grains, with physical interactions between them [4].
When the capillary pressure is the main agent commanding soil water matric potential, difference influences in the soil biochar systems are delivered by interpore and intrapore clusters. In fact, while intrapores act in the domain of lower soil water potential, influencing wilting point and field capacity, interpores control water retention at higher soil water potential values for finer textured biochar-sand mixtures.
The water uptake by biochar depends on capillary forces influenced by the surface chemical properties. The absolute magnitude of capillary forces is inversely proportional to pore radius with the extreme case wherein hydrophobic surfaces with micrometer to nanometer pore radii can generate strong capillary forces able to prevent water entry in the pores. Total porosity, on the other hand, represents the theoretical WHC, and this variable in conjugation with capillarity commands the total water uptake in biochar media [19].
Biochar hydrophobicity hinder water uptake but not ethanol absorption. Ethanol is a full wetting liquid with a zero-degree contact, subjected only to positive capillary forces and thus saturating all porosity. Thus, the operative temperature of biochar production, influencing its porosity, does not influence the accessibility of ethanol to the carbonaceous feedstock. Oppositely, water absorption by biochar is influenced by that temperature. Water absorption is influenced also by non-porosity factors e.g., pyrogenic nanopore blockage by tars or oils, hydrophobicity or pressurized pore air. As such, the uptake of water and ethanol dynamics should allow evaluating the mechanisms responsible for water uptake in biochar media [17].
Because oxygen and nitrogen are soluble in ethanol in opposition with water wherein neither gas is highly soluble, water intrusion in biochar porosity could cause and increase air pressure in pores, inhibiting the accessibility of further water on them. This process should occur mainly in pyrogenic nanopores which are prevalent in higher temperature biochars. Reduced hydrophobicity in biochars formed at higher carbonization temperatures could be due to variations in the proportions of hydrophobic and hydrophilic functional groups or to aliphatic surface functionality instrumental techniques such as FTIR showing decreasing surface functionalities in biochars obtained under higher carbonization temperatures for several woody biomass feedstocks. Two functional groups correlated with hydrophobicity and hydrophilic ionizable carboxyl groups in biochars are, for example, C-H/CH3 aliphatic peak (wavenumber 2800–2990 cm−1) and C=O carbonyl group (wavenumber 1680–1730 cm−1). Methyl groups in biomass components are associated with long carbon chains signaling hydrophobic behaviour [7,15,16,24].
In Mediterranean areas, the link between biochar application in agricultural soils and drought associated with climate change is seldom addressed. In this context, this work intended to analyse the impact of lab produced biochar from pinewood biomass in mix with silica-based sand in moisture equilibrium curves, water holding capacity and water retention curves. Biomass and biochars were subjected to thermogravimetric analysis (TGA), proximate analysis, FTIR, characterization by gas adsorption and mercury porosimetry. Water suction evaluation, through the establishment of pF curves, was carried out to assess the strength of water retention by the biochar/sand mixtures.

2. Materials and Methods

Pinewood biomass was used for biochar production on a laboratory scale. The biomass was dried for 24 h. Inert substrate of silica-based sand was used in experimentation for biochar mixtures in soil. The biomass and the inert substrate of silica-based sand are sieved to obtain a particle size in the range 400–1000 μm, accordingly with the standards USP General Test 768 Method I and ISO 3310.
Figure 2 depicts the steps considered during the study. This methodology included: (i) biochar production and physical activation, (ii) physical and chemical characterization through proximate analysis, TGA, Scanning Electron Microscopy analysis (SEM), Fourier Transform Infrared (FTIR), gas adsorption at 77 K and mercury porosimetry, (iii) moisture characterization of biochar and inert substrate thought tests of water holding capacity and water retention suction, and (iv) parametric Van Genutchen model fitting. These tests were carried out according to the mixture between biochar and sand substrate with percentages presented on Table 1. The acronyms PS-Raw, PS-C600 and PS-AC are used for pine sawdust, pine biochar produced at 600 °C and activated pine biochar, respectively.

2.1. Biochar Production

The biochar production was carried out in batch laboratory scale. Figure 3a,b shows the horizontal heating furnace used, consisting of a controlled atmosphere within an internal alumina-tube with an internal diameter of 4 cm and a length of 55 cm. Heating was conducted with an electrical resistance with operative temperature controlled by the Eurotherm 3216 device. Pine biomass samples were placed in the crucibles in the central part of the tube, and subjected to carbonization with N2 gas, with the left rotameter. The heating rate used is 33 °C/min and the residence time is 1 h. [25] The operative temperatures were 300 °C, 400 °C, 500 °C and 600 °C [26]. For each temperature, mass yield ( Y m ), was determined with Equation (1).
Y m = m f i n a l m i n i t i a l
where mfinal is the mass of the biochar obtained and minitial is the mass of raw biomass.
The physical activation of biochar produced at 600 °C was carried out with CO2 flow gas with a rate of 104 mL·min−1 by one hour at 800 °C, introduced with the right rotameter, according to the procedure of [27,28,29].
The materials chosen for the evaluation of moisture variables were mixtures of sand with biochar produced at 600 °C and the subsequent activated biochar.

2.2. Characterization of Biomass, Biochar and Activated Biochar

2.2.1. Proximate Analysis

Proximate analysis giving the composition in terms of moisture (M), volatile matter (VM), ash (Ash) and fixed carbon (FC). VM was determined following the standard EN 15148:2009, ash followed standard EN ISO 18122, moisture standard EN ISO 18134-3 and fixed carbon was computed by the difference of the remaining components for PS-Raw and PS-C600.

2.2.2. Thermogravimetric Analysis

Thermogravimetric analysis of PS-Raw, PS-C600 and PS-AC was performed on a Perkin Elmer STA 6000 thermogravimetric analyzer, with a heating rate of 10 °C min−1 and under a 20 cm3 min−1 flow of He, for obtaining mass loss and the derivative (DTG) mass loss curves.

2.2.3. SEM

Morphology of tracheid structure in biomass and biochar particles was analysed using a scanning electron microscope (SEM), the instrument used was JEOL model JSM-7001F. This analysis allowed us to evaluate the morphology of the biochar particles produced at different temperatures to compare them with raw biomass.

2.2.4. Kripton and N2 Adsorption at 77 K

To characterize the samples by gas adsorption the following apparatus were used: Quantachrome Autosorb iQ (Kr at 77 K) and Quadrasorb (N2 at 77 K), equipped with vacuum systems with turbomolecular pumps. Before the adsorption measurements, PS-Raw was degassed for 3 days at room temperature and then for 4 h at 60 °C, while PS-C600 and PS-AC were degassed for 8 h at 200 °C. The specific surface areas were determined from the adsorption isotherms of N2 at 77 K, except for the raw biomass that was determined from Kr adsorption at 77 K, following the recommendations of IUPAC [30] for very low specific surface area materials. The specific surface areas were obtained by the application of the BET method using the Brunauer–Emmett–Teller equation [30] and the criteria recommended by Rouquerol et al. [31] and subsequently endorsed by IUPAC [30]. The pore volumes corresponding to the micro and mesopore range were estimated from the uptake of N2 at p/po = 0.95 and expressed as equivalent liquid volume.

2.2.5. Mercury Porosimetry

The mercury porosimetry was used for assessing variables, such as pore diameter, pore size distribution, pore volume and absolute and bulk density of the porous structure in the macropore and mesopore ranges. The equipment used for this assessment was an AutoPore® IV 9500 Series apparatus. This equipment has a range of low pressure between 0 and 345 kPa, which translates to pore size range of 360 and 3.6 µm and a range of high pressure between atmospheric pressure and 228 MPa, corresponding to 6 and 0.003 µm.

2.2.6. FTIR Spectroscopy

Fourier transform infrared spectroscopy was performed using a PerkinElmer spectrometer allowing us to obtain a curve of transmittance/absorbance as a function of wavenumber, and consequently through the peaks of this curve it is possible to identify the functional groups present on the surface of the material. The identification of functional groups was made considering previous studies with functional group assignments indicated in Section 3.2.1 below.

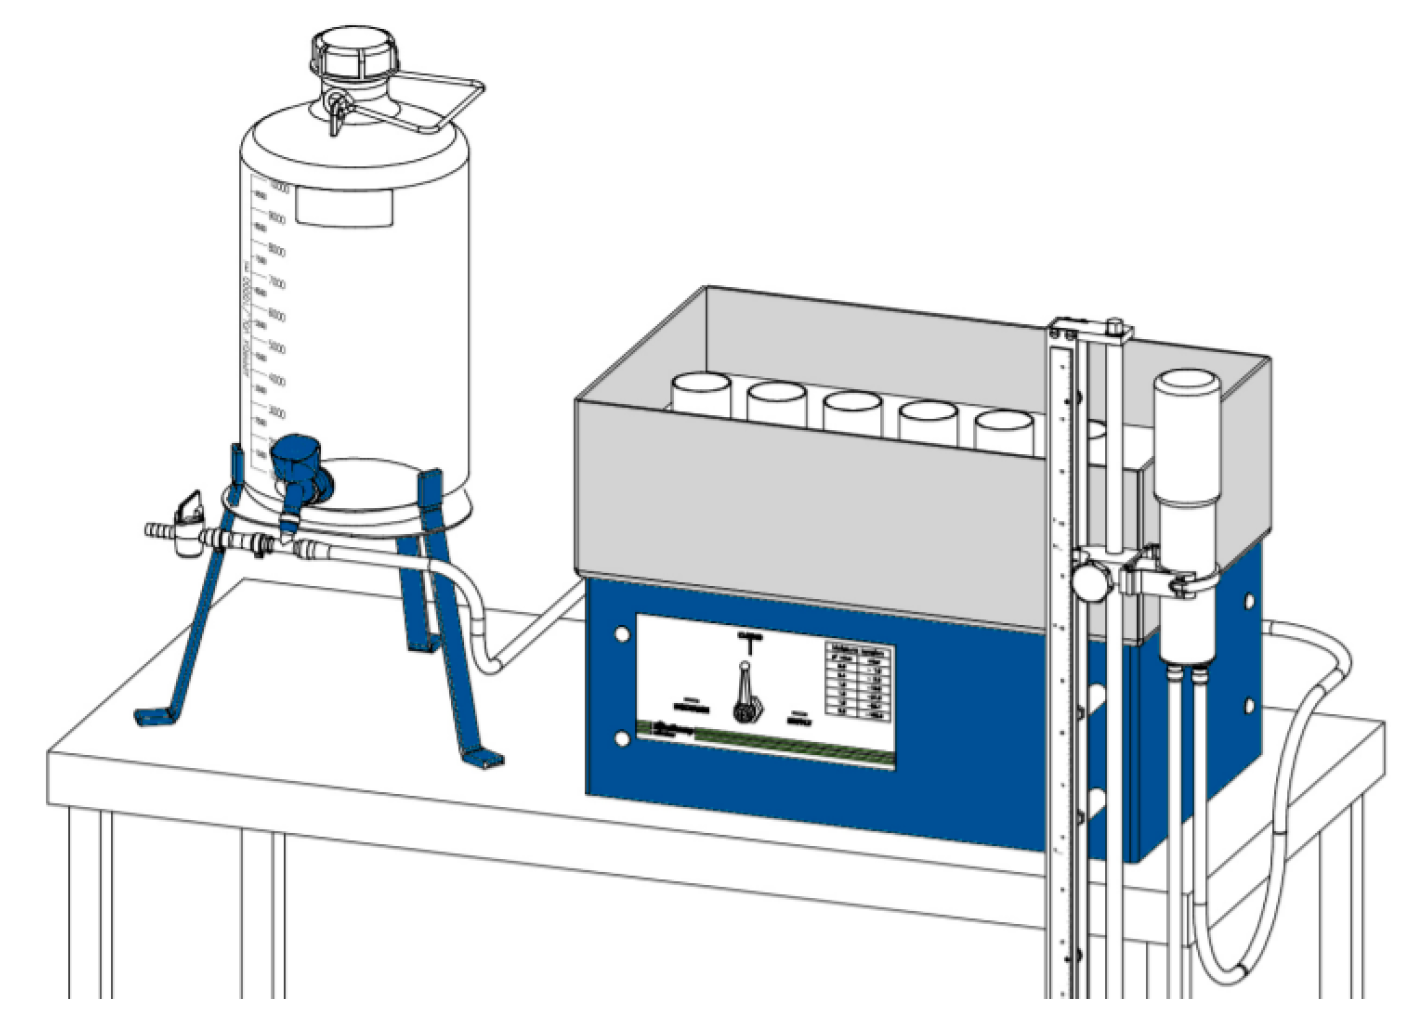
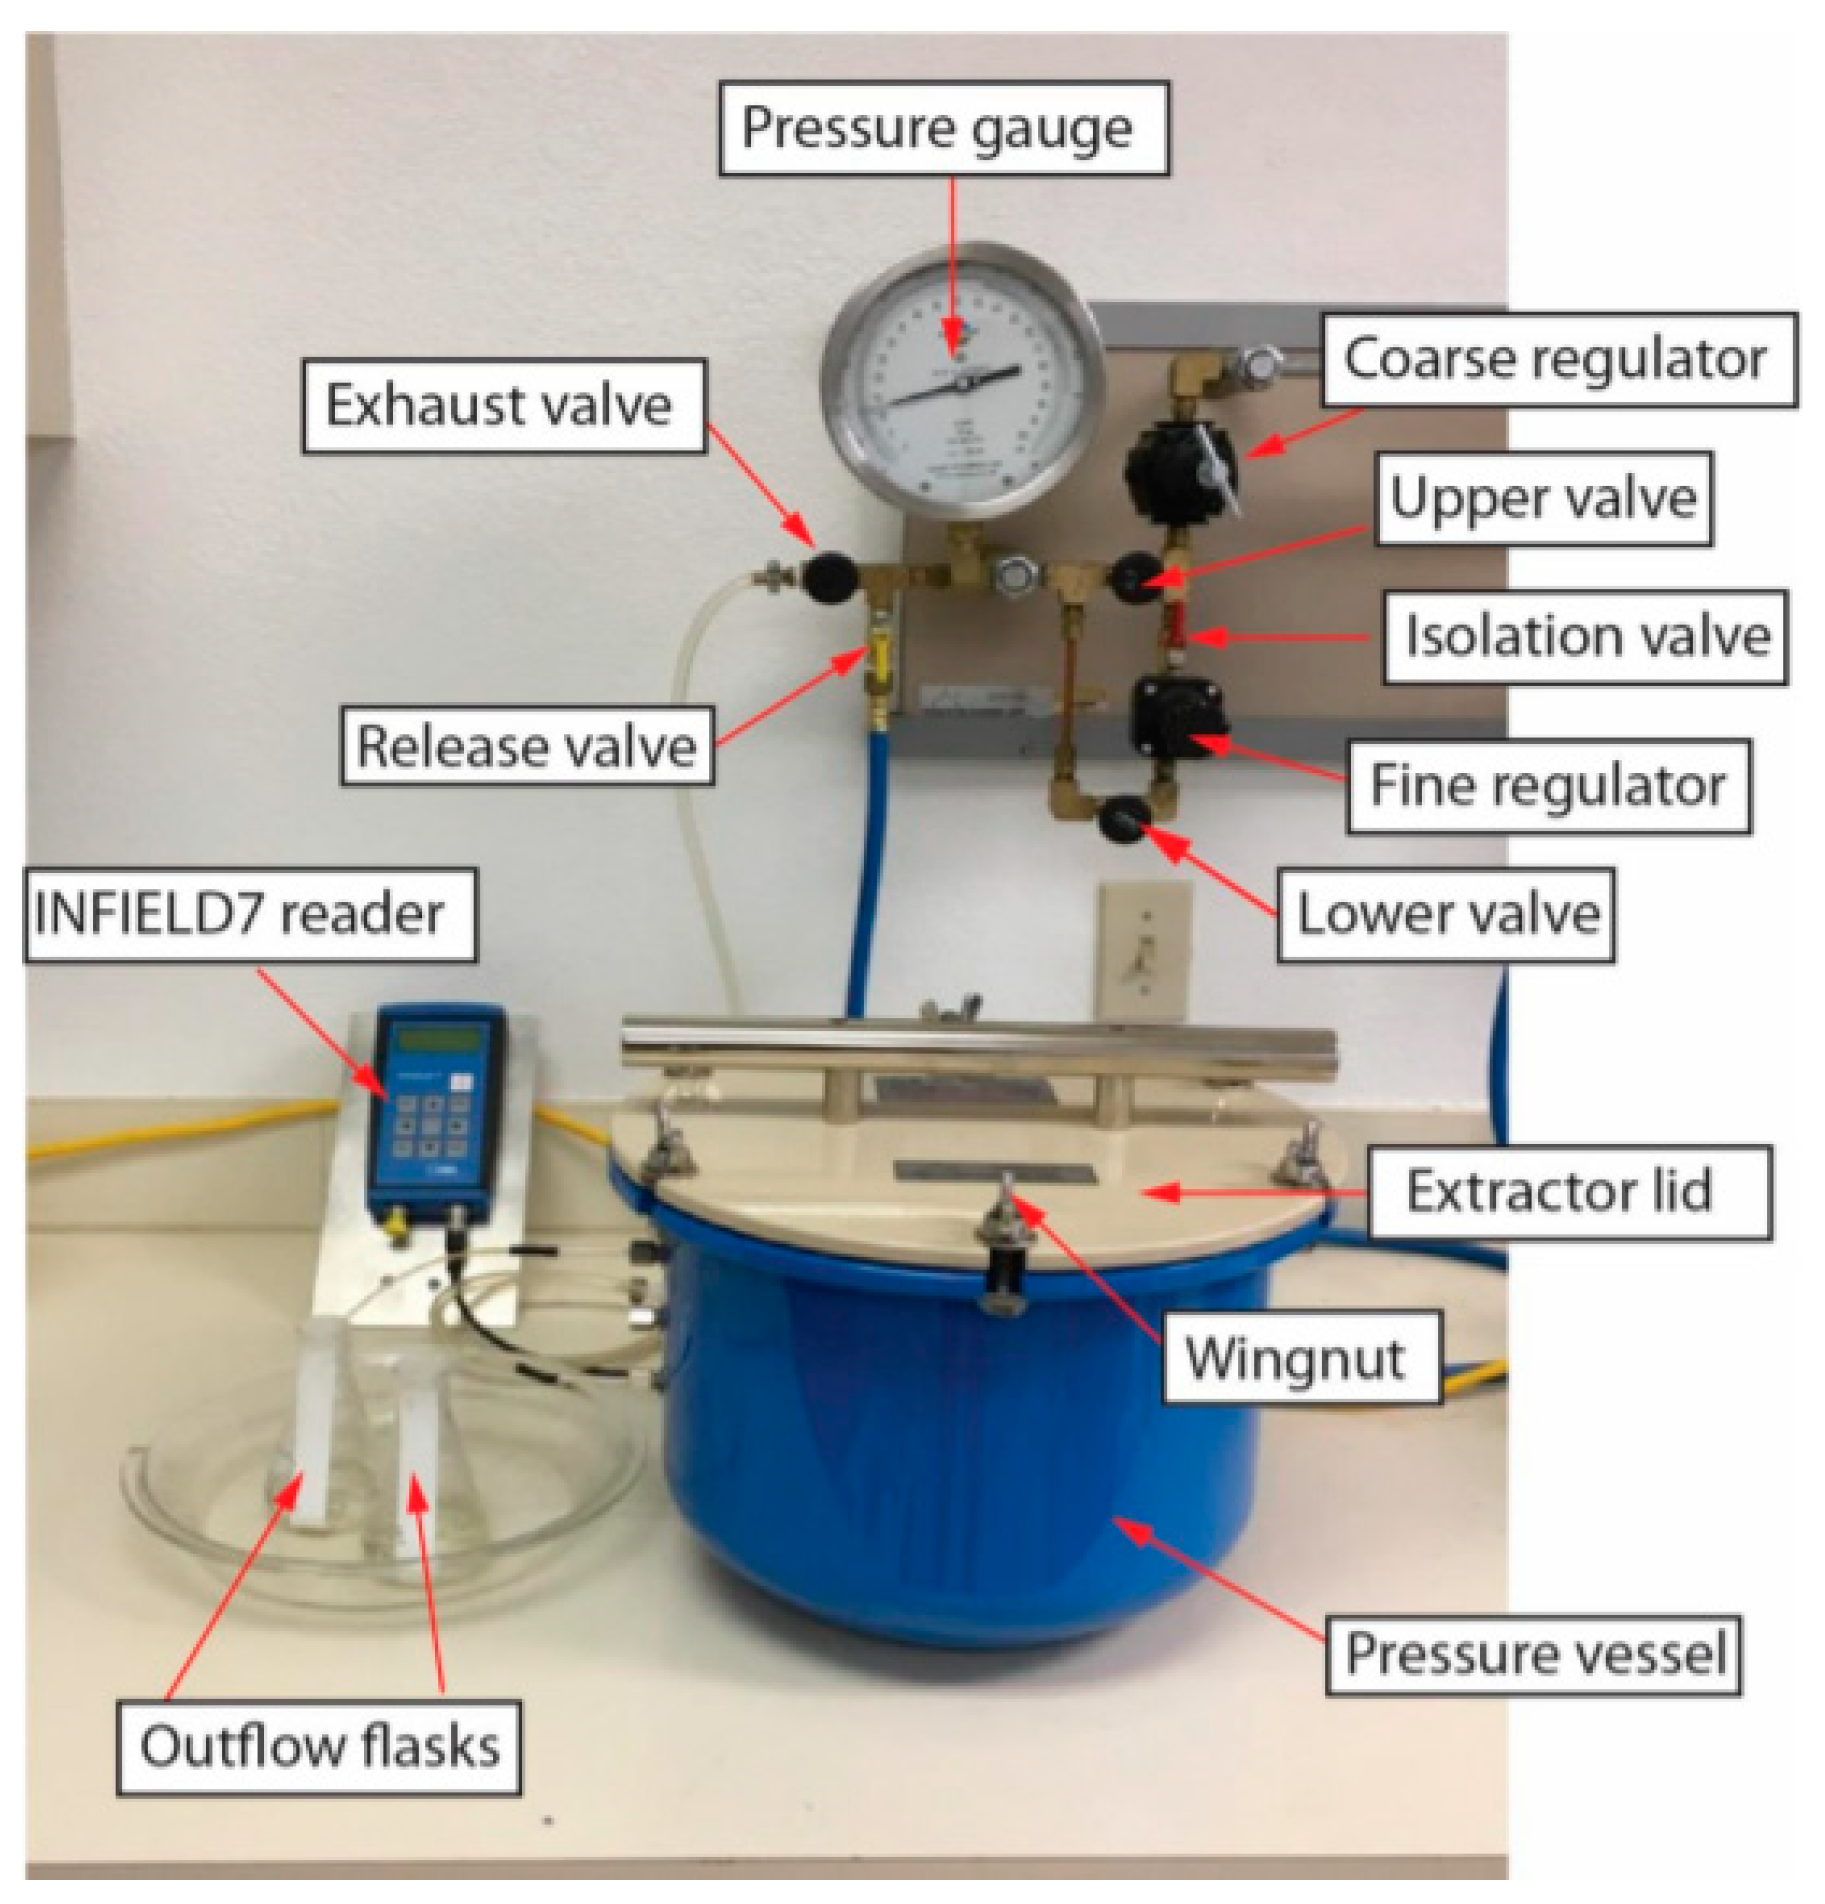
2.3. Water Retention Curves (pF curves)

2.3.1. The Experimental Approach

The water retention curves were obtained for different points of matric potential, as defined in the Introduction section: saturation point (ψ = 0 kPa), field capacity points (ψ = 10 kPa and ψ = 33 kPa for fine texture soils) and wilting point (ψ = 1500 kPa). It is common to present these values in logarithmic form through the following Equation (2).
p F = log   ( ψ )
where ψ is the suction pressure in hPa. On pF scale the moisture contents at several suctions corresponded to pF 0 for saturation moisture, pF 2 for field capacity, pF 2.5 for an intermediated moisture content and pF 4.2 for wilting point. Plant available water is given by the difference between field capacity and wilting point water contents. A sandbox and a ceramic pressure vessel with a ceramic plate and regulated air system were used for the moisture determination at the considered pF points (Figure 4 and Figure 5).
The water content (θ) is then calculated following Equation (3):
θ i [ cm 3 cm 3 ] = ( m w i m d r y ) / ρ w V r i n g
where, mwi [g] is the mass of wet sample at each applied pressure, mdry [g] is the mass of oven dry sample, ρw [g/cm3] is the density of deionized water (1 g/cm3) and Vring [cm3] is the volume of the sample ring.
For the water retention analysis, the sand was used as a control with three mixtures of sand and biochar, with 0%, 10%, 50% and 100% on a volume basis. The saturation θs, field capacity θfc, θpf2.5 and wilting point θwp, were determined.

2.3.2. Plant Available Water

To study the effect of biomass/biochar from the point of view of a practical application, another parameter is introduced which is called the available water for plants θpaw, and is determined according to Equation (4):
θ p a w = θ f c θ w p
where θ f c   [ cm 3 cm 3 ] is the field capacity and θ w p   [ cm 3 cm 3 ] is the wilting point.

2.3.3. Van Genutchen Model

For fitting water retention curves, the empirical Van Genutchen Model [33], fitted with Matlab 9.3, was used. This is a one-dimensional model that relates soil water contents with soil water matric potential, is given by Equation (5).
θ ( ψ ) = θ r + ( θ s θ r ) · [ 1 ( 1 + ( α | ψ | ) n ] 1 1 n
where θ ( ψ )   [ cm 3 cm 3 ] is the volumetric water content at a given matric potential ψ , θ s [ cm 3 cm 3 ] is the saturated water content when ψ = 0 , θ r is the residual water content [cm3/cm3] and α and n are shape parameters, representing the inverse of the entry pressure and the pore size distribution, respectively.

2.3.4. Water Holding Capacity (Field Capacity)

The water holding capacity (WHC) measurement of biochar and soil mixture samples at constant volume of 12 cm3 was placed in an acrylic tube (diameter of 32 mm and height of 50 mm) and one end covered with a wire mesh, while allowing total water permeability. Then the tube with the sample was saturated in a glass beaker with deionized water for 24 h. The direction of the water was upwards (imbibition) and slow enough to expel the pores air without causing changes in the structure of the materials. The sample with the tube was then fixed in a bigger container in order to let excessive water drain for about 15 min (i.e., until there is no more dripping from the sample). The wet sample was then weighted and consequently dried in an oven at 105 °C until constant weight. Similar methods have been reported in the literature [3,34]. Water holding capacity is computed by using Equation (6).
W H C ( cm 3 / cm 3 ) = ( M 1 M 2 ) / ρ w V s
where M1 [g] is the total weight of the wet sample and acrylic tube, M2 [g] is the total weight of the dry sample and acrylic tube, ρw [g/cm3] is the density of water and Vs [cm3] is the volume of sample.

3. Results and Discussion

3.1. Biochar Production

Figure 6 shows the mass yield curve from laboratory experimentation for biomass carbonization at an electrically heated horizontal tube furnace. As expected, a reduction in the mass yield is observed with the operative temperature increase, due to the release of condensable tars and non-condensable gases after the breakdown of the various biomass constituents. A reduction from 38.47% to 20.11%, for operative temperatures of 200 °C and 600 °C was verified, respectively. A major reduction of 12.78% occurred between 300 °C and 400 °C by comparison of only 4.94 % between 400 °C and 500 °C. This is explained by the fact that pine biomass is composed mainly by cellulose, hemicellulose and lignin, with decomposing temperature of around 380 °C, 300 °C and in the range between 300 and 700 °C, respectively. In the production of activated carbon through biochar at 600 °C, the mass yield obtained was 11.79%.

3.2. Characterization of Biomass and Biochar Samples

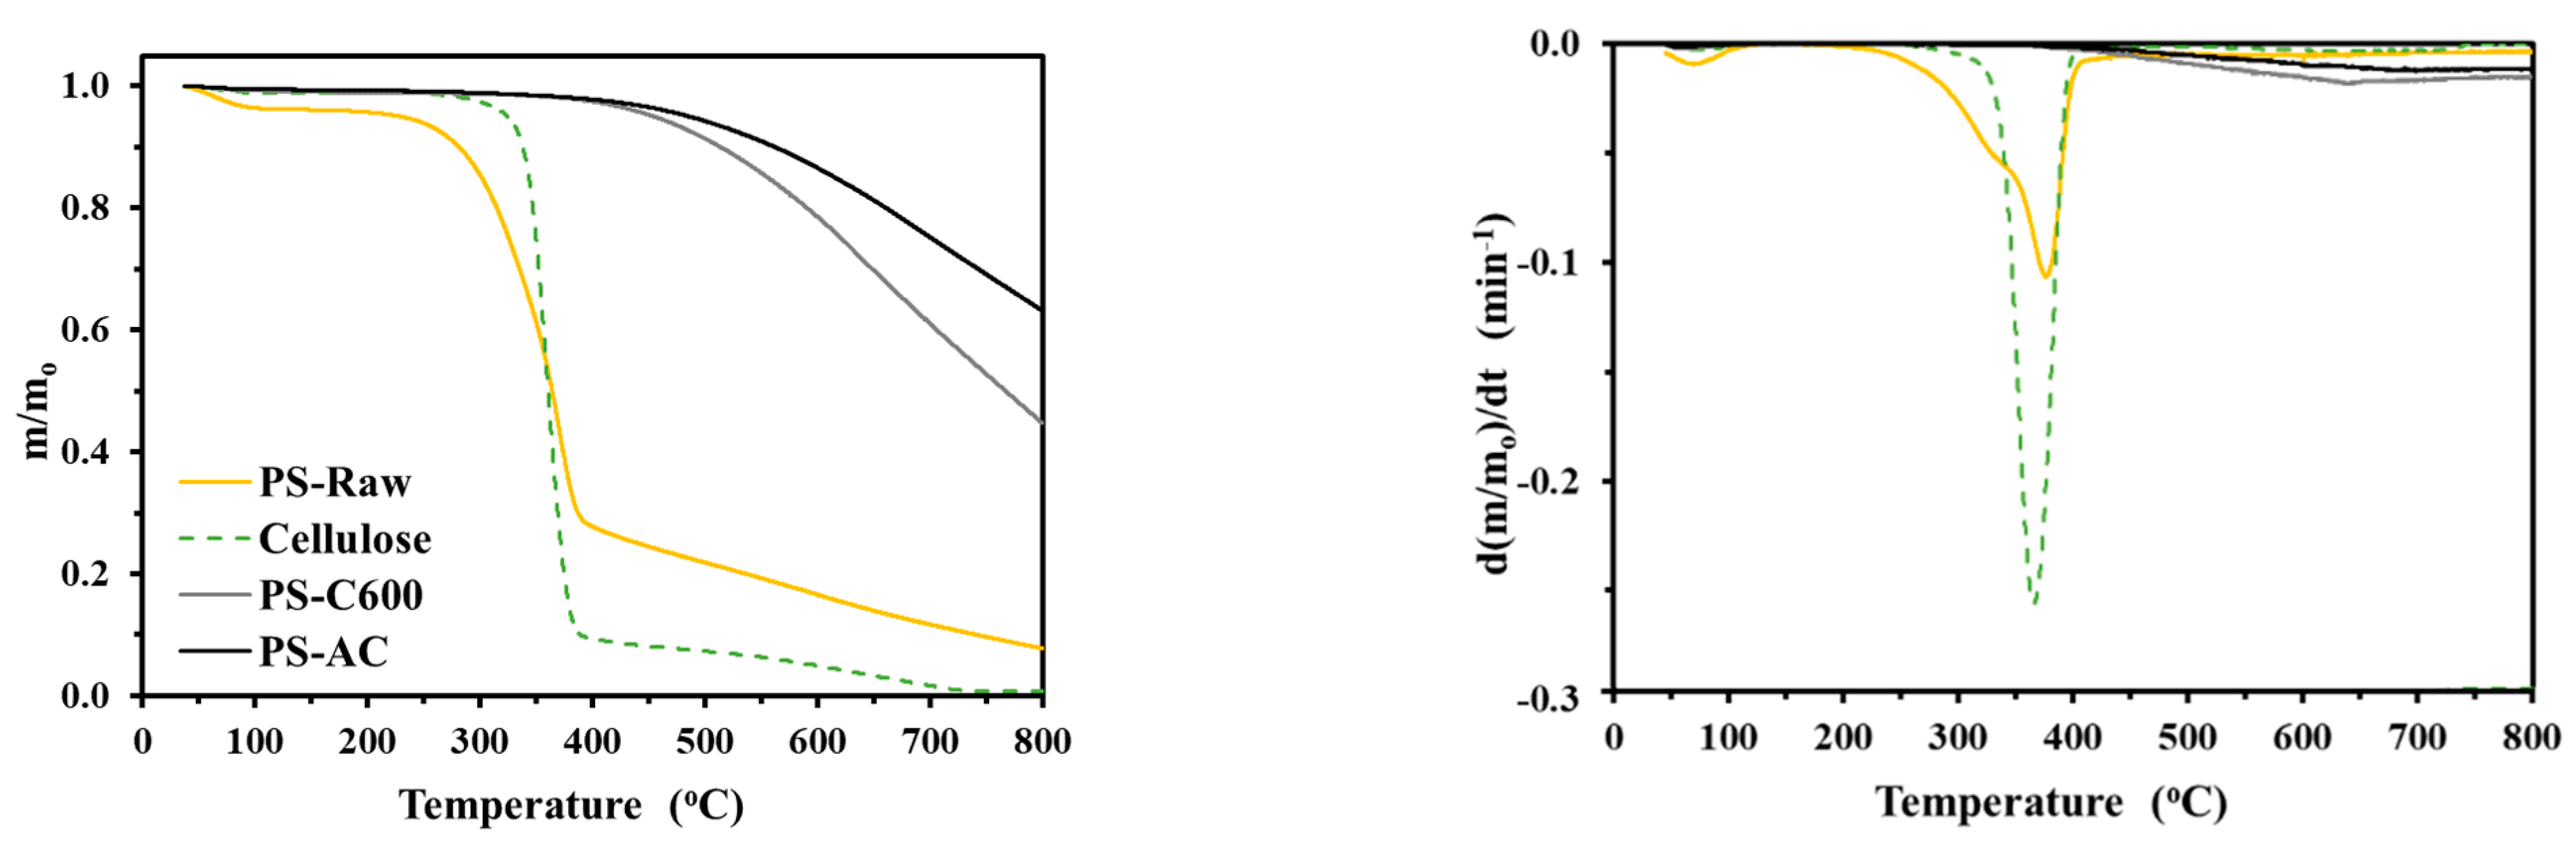
3.2.1. Proximate, Thermogravimetric and FTIR Analysis

Table 2 shows the results of proximate analysis for the PS-Raw and PS-C600. In PS- Raw, the high amount of volatile matter (87%) is reflected in the ability of gas release in carbonization processes. The high amount of fixed carbon (83%) in PS-C600 corresponded to a main objective carbonization which is carbon sequestration in soil. PS-C600 also presented low volatile matter (15.16%) and ash contents (1.39%) higher than PS-Raw (0.49%).
Thermogravimetric analysis and the corresponding derivative curves (DTG) (Figure 7) were carried out to simulate the devolatilization process in carbonization.
Considering PS-Raw, it can be seen that there is an initial mass loss of values around 5%, which is related to the moisture loss. Afterwards, between 100 °C and 250 °C, there is practically no mass variation, since this is the temperature range for which torrefaction occurs, where the mass yield is very high, and a slight carbon fixation occurs. Between 300 and 400 °C occurs the largest drop in mass variation, due to the release of volatiles, and compared with the decomposition of hemicellulose and cellulose we can see that the major release of these components occurs at around 300 °C and 380 °C, respectively. So, in this temperature range this mass drop is mainly due to these two components, despite lignin decomposition which also contributes to mass loss. Above 400 °C there is no sudden mass loss, but a continuous mass decrease, which is due to decomposition of lignin and it is in agreement with previous studies of lignins with different ash contents that showed that this behavior occurs when the ash content is low [35].
Regarding biochar (PS-C600), the TGA and DTG curves show that there was no mass variation until 400 °C, starting to have some residual mass loss from 400 to 500 °C and afterwards a more accentuated mass fall occurred until 600 °C, with a subsequent stationarity mass loss until 800 °C. For the activated carbon (PS-AC) the peak loss rate occurred around 700 °C, and this loss was lower compared to biochar samples, due to the volatile loss during the activation process.
As mentioned in Section 2.2.6, the FTIR analysis was assessed accordingly and the FTIR bands and functional group assignments are presented in Table 3.
Figure 8 shows the FTIR spectra and data of PS-raw, PS-C600 and PS-AC.
As expected, with increasing temperature, significant changes in the profiles of functional groups between the different samples are verified [41]. For PS-Raw there is a broad band between 3650 and 3250 cm−1, that corresponds to hydrogen bonds. This band confirms the existence of water (H2O) and hydroxyl (-OH), ammonium, or amino functional groups. A narrow band ranging between 2935 and 2860 cm−1 is also visible, revealing the presence of methylene and methyl groups from holocellulose (water-insoluble carbohydrate fraction) and lignin. These bands are associated with transmittance bands related to the asymmetric (νas), symmetric (νs) stretching (3050–2800 cm−1) and bending (δ) (1500–1300 cm−1) vibrations of CH3 and CH2 groups [42].
Transmittance bands of 1200 and 900 cm−1 are related with alcohol and hydroxy compounds (primary alcohols C-O stretch). After pyrolysis, PS-C600, the transmittance of these bands was smoothed. For PS-AC an additional feature, consisting of an enhanced decrease of transmittance after 2000 cm−1, was noticed. This decrease in transmittance follows the production of graphene carbon structures [41]. These results are in agreement with literature, for example that by Myles Gray et al. [17] which demonstrates a decrease in abundance and diversity of functional groups with increasing temperature in biochar production.

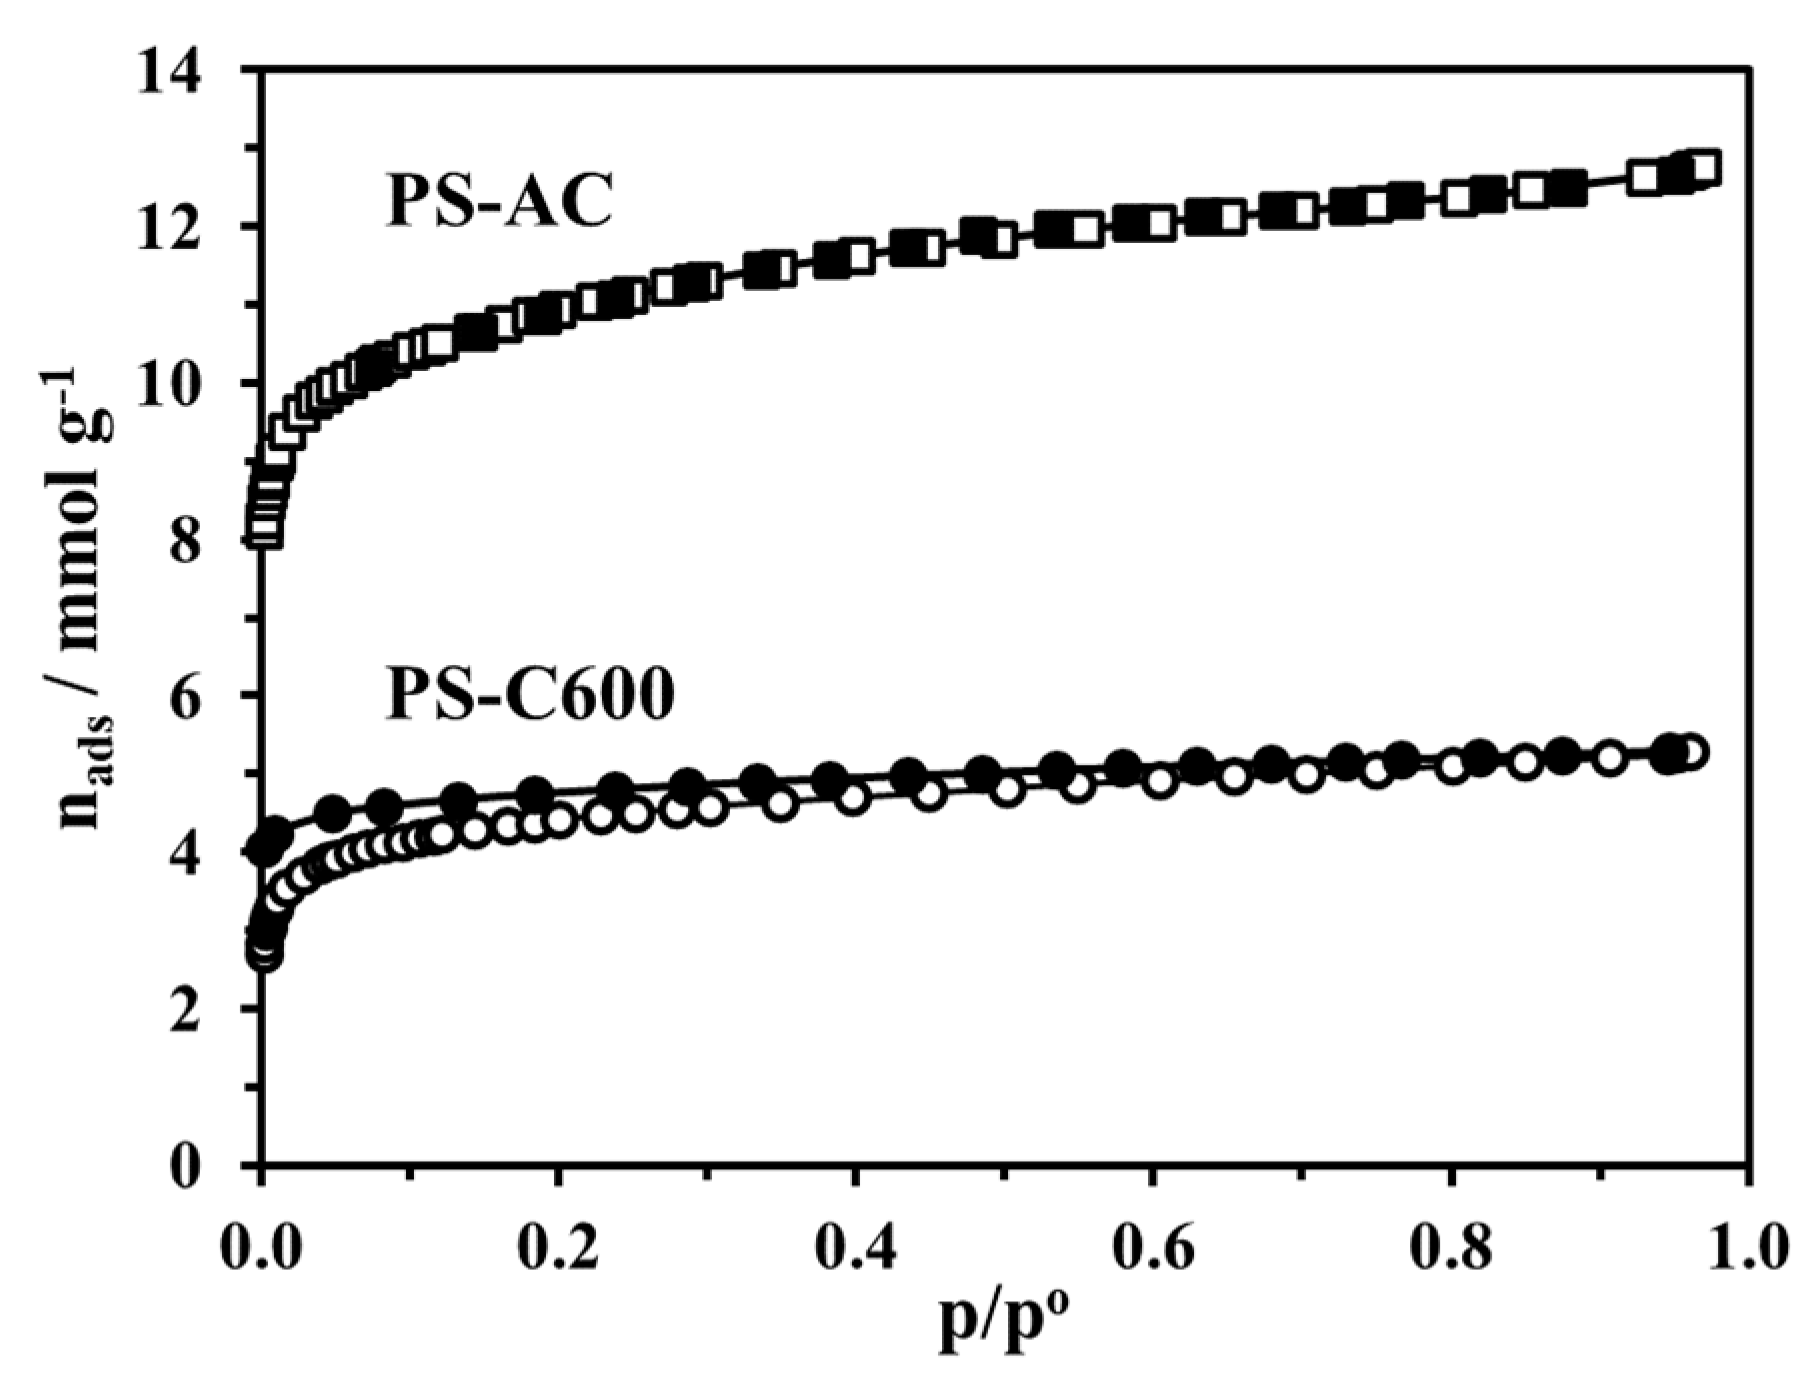
3.2.2. Adsorption Equilibrium and Porous Structure

The adsorption-desorption isotherms of N2 at 77 K of PS-C600 and PS-AC, shown in Figure 9 and the results in Table 4, correspond to type I isotherms according to IUPAC classification [30]. This isotherm profile is typical of micropore filling, thereby revealing that both materials are microporous. The low-pressure hysteresis observed on the isotherm of PS-C600 is usually obtained in non-activated chars and is indicative of the presence of very narrow constrictions of partially blocked micropores. Upon activation, this feature disappears, and the material PS-AC presents a well-developed and open microporosity, resulting in a higher micropore volume as can be seen in Table 4.
The results presented in Table 4 show that the average specific area for raw biomass was marginal, 0.34 m2g−1. The corresponding BET areas for PS-C600 and PS-AC were much higher being 375 m2g−1 and 937 m2g−1, respectively.
The evaluation of porous structure covering a range of pore sizes from 392 μm to 6 nm for PS-raw, PS-C600 and PS-AC substrates was performed with mercury porosimetry analysis (Figure 10), wherein the pore size distribution (mL·g−1) is expressed in logarithm (Log).
For PS-Raw, the largest amount of pores occurred for ranges from 52 μm to 10 μm, while for PS-C600 and PS-AC the corresponding largest amounts ranged between 392 and 250 μm and 32 μm and 6 μm, respectively. The pore size distributions of PS-C600 and PS-AC were correlated by 0.99. Between PS-C600 and PS-Raw the porosity correlations were lower with 0.734, indicating that the higher change in porosity from initial raw biological structure occurred in the carbonization stage. These high correlations, reflecting the biological origins of biomass and biochar, are consistent with studies e.g., carried out by Zhang and You [3], and Wildan and Derbyshire [18].
Table 5 with the averages of the main variables of mercury porosimetry results, shows that biochar (PS-C600) and activated biochar (PS-AC) have, respectively, much higher porosities of 6.63 and 6.37 mL·g−1, by comparison with raw biomass, 2.47 mL·g−1, with the maximum porosity allocated to activated substrate. The transition to activation provided a negligible porosity gain of 4%. This porosity pattern was reflected in bulk density and in porosity both similar in the biochar substrates, with increases of 4% and 0.24%, respectively, in PS-AC by comparison with PS-C600.
Comparing the results of the biochar carbonized at 600 °C with the raw biomass, it can be seen that there was a 37% increase of total volume which is mainly due to the fact that the number of high-end pores (>50 μm, more specifically between 400 and 200 μm) is relatively lower in raw biomass. There is also a reduction of bulk density of biochar by comparison with PS-raw (43%), which comes from the release of volatile matter from the slow pyrolysis process.
Figure 11 shows the SEM images, with a resolution of 100 μm (therefore only macropores are observed) for PS-Raw, PS-C600 and PS-AC revealed an enlargement of tracheids, while maintaining the whole cellular structure, reflecting the increasing macroporosity from carbonization, as reported in Table 5.

3.3. Water Holding Capacity (WHC)

Figure 12 shows the water holding capacity or field capacity for substrates evidencing an increase from 0.4 to 0.9% from sand and biomass and biochars, respectively. This result firstly reflects an advantage of the addition of biochar in sandy soil, taking into account the large period of maintenance of biochar presence in soil by comparison with the correspondent very short period of raw biomass.
For PS-C600 biochar, Pearson’s correlation between the WHC and the total pore volume was high (0.95). This high correlation is in agreement with Zhang and You’s [3] studies for biochars obtained from poplar and pine biomasses. In this context, it can be concluded that for hydrophobic biochars, the high WHC should be related with higher pore volumetry, especially macroporosity. Nevertheless, the higher micropore volume of PS-AC can also account for the highest WHC, considering that this material has a lower macropore volume than PS-C600. On the other hand, the high WHC in less porous raw biomass should be due to retention by hydrophilic functional groups.

3.4. Water Retention Curves

3.4.1. Sand and Biochars

As mentioned in the M&M section, water retention curves, Figure 13, were measured and fitted by Van Genutchen model for the three mixtures of sand and PS-C600 (10%, 50% and 100% on a volume basis). The moisture contents evaluated corresponded to pF 0 for saturation moisture, pF 2 for field capacity, pF 2.5 for an intermediated moisture content and pF 4.2 for wilting point.
In Table 6 the moisture contents for sand-biochar mixtures of 0, 10%, 50% and 100% are displayed, being notorious for the effect of biochar in the higher volumetric water amounts, for the same suction, retained in the mixtures silica-based sand with biochar.
For example, for field capacity (pF 2) and wilting point (pF 4.2), the moisture contents increased respectively from 0.08 to 0.21 and 0.02 and 0.1, between pure sand and pure biochar.
In same way, for each mixture the main moisture decreases occurred between pF 0 and pF 2, and the lowest decreases corresponded to the transition to the pF 0 and pF 4.2, accordingly with Figure 13. For example, for 10% biochar mixture the moisture reduction between these pF values was 116.28%. The lowest correspondent moisture decrease was 20.51% for pure sand. Oppositely, the lower moisture decrease verified between pF0 and pF 4.2 was 5.13% and the higher decrease was 18.60% for pure sand and 10% for biochar mixture, respectively.
The curves for the PS-AC were not studied, due to the low yield of the activation process which led to the reduced amount of the sample to perform the water retention tests.
Van Genutchen model fitting allowed n and α empirical parameters in Equation (5), and the fitting quality of this model was good for sand-biochar mixtures with 10% and 50%, insofar that the measured moisture curves were almost coincident. The Van Genutchen model therefore can be, in the first hand, considered as adequate to simulate the biochar water retention in sandy soils added with biochar [43,44]

3.4.2. Plant Available Water

Table 7 shows that pure biochar produced at 600 °C delivered the higher amount of plant available water, θpaw, of 0.108. This result reflects an increase of water amount of 171% by comparison with pure sand (0.063). The 50% biochar mixture delivered a θpaw value of 0.095, close to the maximum pure biochar. Thereby, biochar can be considered as useful for soil water retention for agricultural purposes. However, the results showed that as pure biochar maybe too expensive, a biochar incorporation of 50% in sandy soil corresponding to a moisture increase of 151%, should guarantee good enough results in water retention.

4. Conclusions

In the present work the main goal was to evaluate the aptitude of biochar obtained from lab carbonization of pinewood biomass for impacting soil moisture relationships considering mixtures of biochar with silica-based sand. Carbonization processes under N2 atmosphere were performed at temperatures of 300 °C, 400 °C, 500 °C and 600 °C. A further physical activation of the biochar produced at 600 °C was carried out under a CO2 flow gas at 800 °C. The biomass and the resulting biochars were characterized by SEM, Fourier Transform Infrared (FTIR), gas adsorption at 77 K and mercury porosimetry, and water retention curves and plant available water. The main conclusions can be summarized as follows:
The FTIR analysis of produced biochars showed a pattern of lower transmittance in bands corresponding to methylene and methyl groups from holocellulose and lignin. The transmittance of activated biochar also showed a decrease in bands with wavenumbers higher than 2000 cm−1 possibly with relation to a change in carbon structure of feedstock;
(i)
The pyrogenic nanoporosity was revealed by IUPAC Type I isotherms indicative of microporosity, more developed in the activated biochar;
(ii)
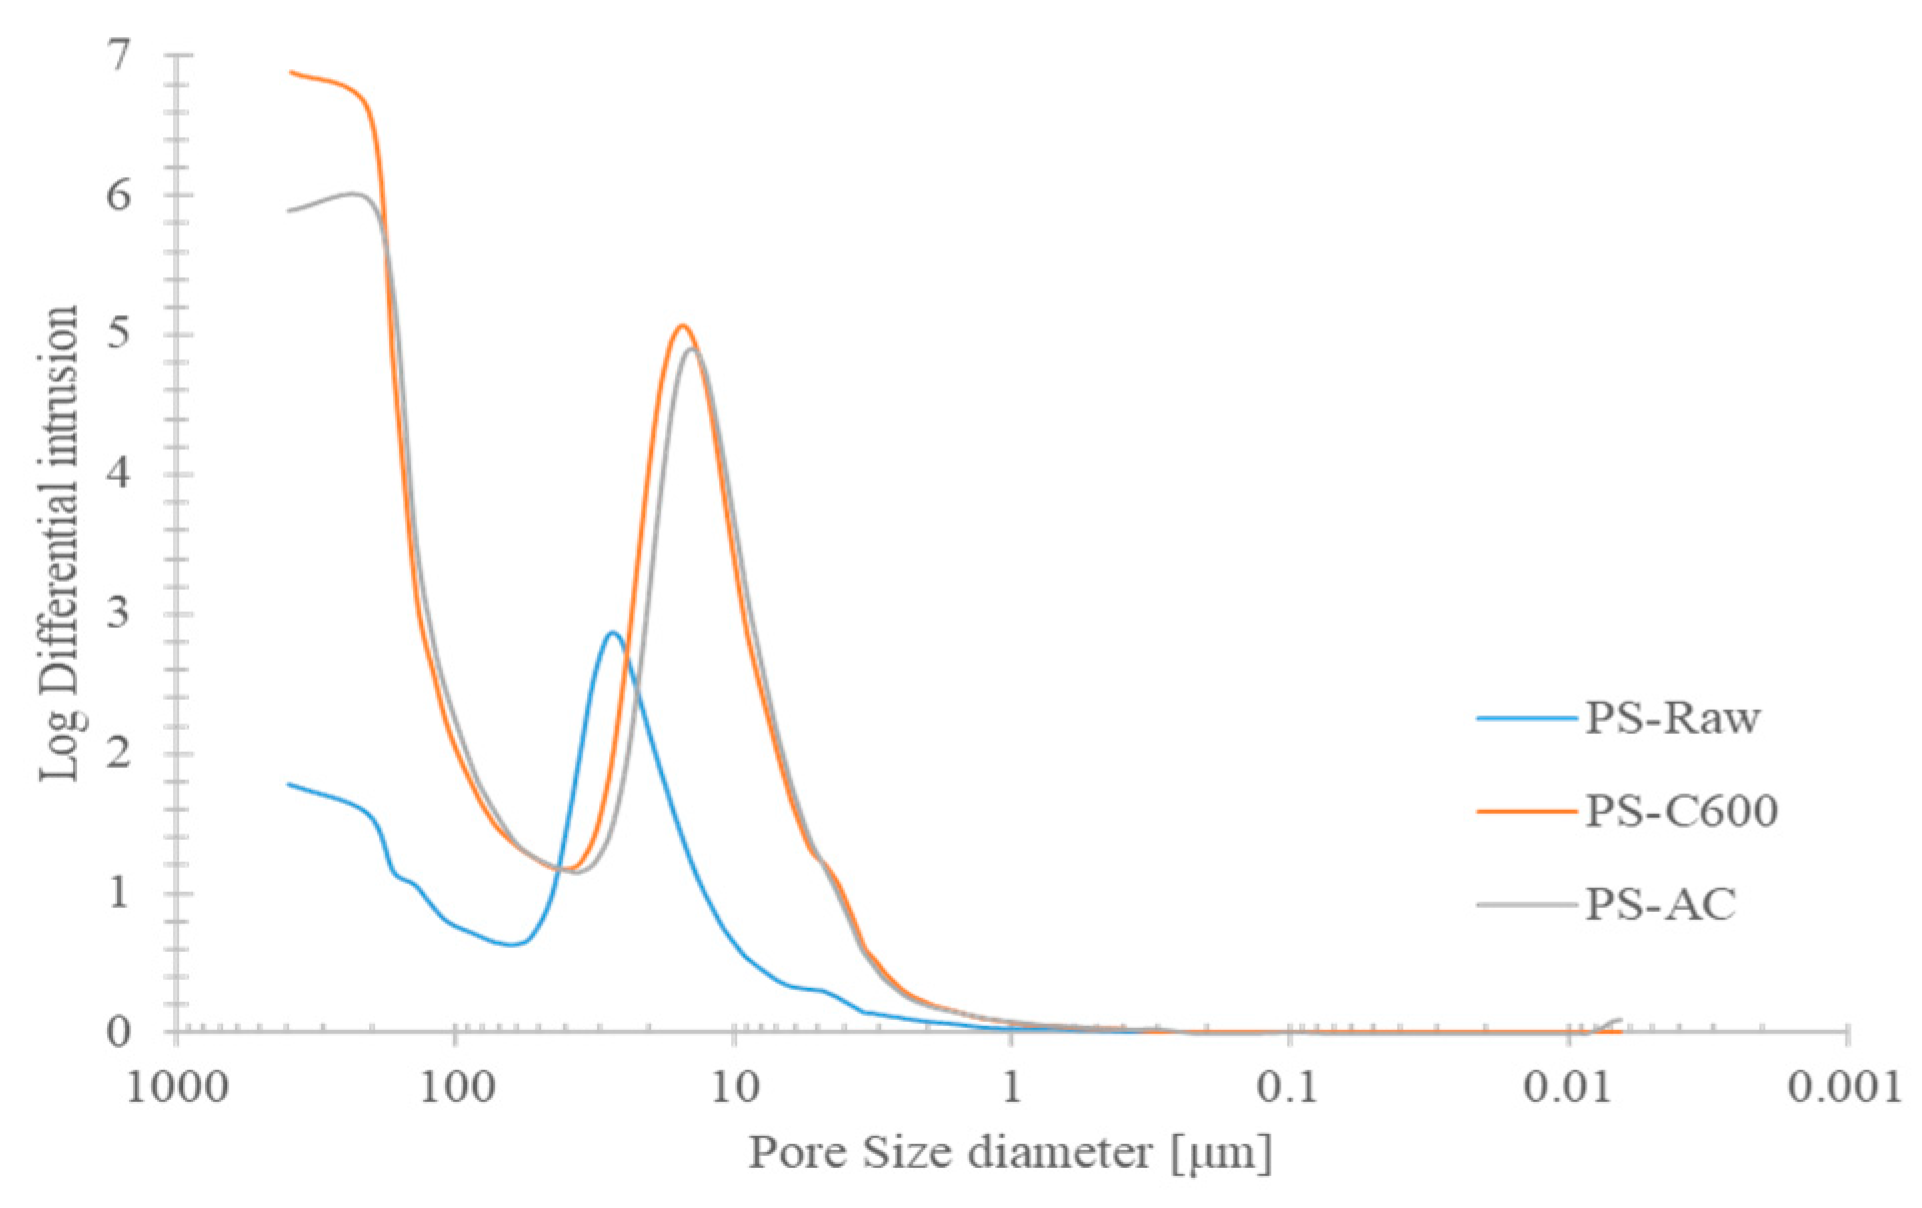
From mercury porosimetry, it was shown that pores between 392 and 250 μm corresponding to a biochar delivered the highest pore volume for water retention. For activated biochar, the largest correspondent porosities respected pore dimensions between 32 μm to 6 μm. These results reflected a major macroporosity increase under carbonization stage by comparison with subsequent physical activation.
(iii)
SEM evaluation showed an enlargement of biological tracheid, safeguarding the whole cellular structure of raw biomass;
(iv)
The Van Genutchen model proved useful to simulate water dynamics in biochar-sand mixtures;
(v)
The biochar-sand mixtures showed a significant improvement in plant available water indicating the potential of biochar as feedstock for the betterment of hydric availability for agricultural purposes.
Complementing these conclusions, future work should be developed in order to generalize this study with implementation of carbonaceous feedstock in agriculture plots under factorial design. In this way, feedback would be delivered to industrial biochar production regarding operational parameters for obtaining feedstock with better physical properties and larger BET surface areas.

Author Contributions

R.V.S.: experimental work, results analysis and visualization, writing and editing original draft; M.A.A.M.: conceptualization, methodology, results analysis and visualization, supervision; C.A.: pF analysis and data processing; M.R.C.: TGA and gas adsorption analysis and data processing; A.R.: conceptualization, methodology, supervision; A.F.F.: conceptualization, experimental work, methodology, results analysis and visualization, supervision writing and editing original draft, corresponding author. All authors have read and agreed to the published version of the manuscript.

Funding

The APC was funded by IDMEC, under LAETA.

Institutional Review Board Statement

Not applicable.

Informed Consent Statement

Not applicable.

Acknowledgments

This work was supported by FCT, through IDMEC, under LAETA, project UIDB/50022/2020. This work received funding support from national funds from FCT, Portugal, through the research unit UIDB/04035/2020 (GeoBioTec). This work received financial support from PT national funds (FCT/MCTES, Fundação para a Ciência e Tecnologia and Ministério da Ciência, Tecnologia e Ensino Superior) through the project UIDB/50006/2020 | UIDP/50006/2020 (LAQV-REQUIMTE). The authors thank the staff of the Laboratório de Física do Solo (MED) for all their help in determining the water retention curves. The authors would like to thank to Bio Green Woods company for the support of providing biochar feedstock and allowing technological knowledge and opinion exchanges.

Conflicts of Interest

The authors declare no conflict of interest.

References

  1. Lei, O.; Zhang, R. Effects of biochars derived from different feedstocks and pyrolysis temperatures on soil physical and hydraulic properties. J. Soils Sediments 2013, 13, 1561–1572. [Google Scholar] [CrossRef]
  2. Masiello, C.; Dugan, B.; Brewer, C.; Spokas, K.; Novak, J.; Liu, Z. Biochar Effects on Soil Hydrology. In Biochar for Environmental Management, Science, Technology and Implementation; Routledge: London, UK, 2021; pp. 543–562. [Google Scholar]
  3. Zhang, J.; You, C. Water Holding Capacity and Absorption Properties of Wood Chars. Energy Fuels 2013, 27, 2643–2648. [Google Scholar] [CrossRef]
  4. Hafeez, A.; Pan, T.; Tian, J.; Cai, K. Modified Biochars and Their Effects on Soil Quality: A Review. Environments 2022, 9, 60. [Google Scholar] [CrossRef]
  5. Ferreira, S.; Monteiro, E.; Brito, P.; Vilarinho, C. Biomass resources in Portugal: Current status and prospects. Renew. Sustain. Energy Rev. 2017, 78, 1221–1235. [Google Scholar] [CrossRef]
  6. McKendry, P. Energy production from biomass (part 1): Overview of biomass. Bioresour. Technol. 2002, 83, 37–46. [Google Scholar] [CrossRef]
  7. Lopez-Capel, E.; Zwart, K.; Shackley, S.; Postma, R.; Strenstrom, J.; Rasse, D.; Budai, A.; Glaser, B. Biochar Properties, Ch.3 in Biochar in European Soils and Agriculture, Science and Practiceo Title; Shackley, S., Ruysschaert, G., Zwart, K., Glaser, B., Eds.; Earthscan from Routledge: London, UK, 2020; ISBN 978-0-367-60604-6. [Google Scholar]
  8. Chia, C.; Downie, A.; Munroe, P. Characteristics of Biochar: Physical and Structural Properties. In Biochar for Environmental Management; Lehmann, J., Stephen, J., Eds.; Routledge: London, UK, 2021; pp. 89–111. ISBN 13:978-0-367-77918-4. [Google Scholar]
  9. Irfan, M. Potential value of biochar as a soil amendment: A review. Pure Appl. Biol. 2017, 6, 1494–1502. [Google Scholar] [CrossRef]
  10. Troeh, F.; Thompson, L. Soils and Soil Fertility; Blackwell Publishing: Iowa, IA, USA, 2005; ISBN 978-0-813-80955-7. [Google Scholar]
  11. Chan, K.Y.; Van Zwieten, L.; Meszaros, I.; Downie, A.; Joseph, S. Using poultry litter biochars as soil amendments. Aust. J. Soil Res. 2008, 46, 437–444. [Google Scholar] [CrossRef]
  12. Downie, A.; Crosky, A.; Munroe, P. Physical Properties of Biochar, Chapter 2. In Biochar for Environmental Management; Lehmann, J., Joseph, S., Eds.; Routledge: London, UK, 2009; pp. 13–30. [Google Scholar]
  13. Nelissen, V.; Ruysschaert, G.; Manka’Abusi, D.; D’Hose, T.; De Beuf, K.; Al-Barri, B.; Cornelis, W.; Boeckx, P. Impact of a woody biochar on properties of a sandy loam soil and spring barley during a two-year field experiment. Eur. J. Agron. 2015, 62, 65–78. [Google Scholar] [CrossRef]
  14. Cross, A.; Zwart, K.; Shackley, S.; Ruysschaert, G. The Role of Biochar in Agricultural Soils. In Biochar in European Soils and Agriculture: Science and Practice; Routledge: London, UK, 2016; pp. 73–98. ISBN 9781134654949. [Google Scholar]
  15. Kinney, T.J.; Masiello, C.A.; Dugan, B.; Hockaday, W.C.; Dean, M.R.; Zygourakis, K.; Barnes, R.T. Hydrologic properties of biochars produced at different temperatures. Biomass Bioenergy 2012, 41, 34–43. [Google Scholar] [CrossRef]
  16. Novak, J.M.; Busscher, W.J.; Watts, D.W.; Amonette, J.E.; Ippolito, J.A.; Lima, I.M.; Gaskin, J.; Das, K.C.; Steiner, C.; Ahmedna, M.; et al. Biochars Impact on Soil-Moisture Storage in an Ultisol and Two Aridisols. Soil Sci. 2012, 177, 310–320. [Google Scholar] [CrossRef]
  17. Gray, M.; Johnson, M.G.; Dragila, M.I.; Kleber, M. Water uptake in biochars: The roles of porosity and hydrophobicity. Biomass Bioenergy 2014, 61, 196–205. [Google Scholar] [CrossRef]
  18. Wildman, J.; Derbyshire, F. Origins and functions of macroporosity in activated carbons from coal and wood precursors. Fuel 1991, 70, 655–661. [Google Scholar] [CrossRef]
  19. Sun, H.; Hockaday, W.; Masiello, C.; Zygourakis, K. Multiple Controls on the Chemical and Physical Structure of Biochars. Ind. Eng. Chem. Res. 2012, 51, 3587–3597. [Google Scholar] [CrossRef]
  20. Chun, Y.; Sheng, G.; Chiou, C.T.; Xing, B. Compositions and Sorptive Properties of Crop Residue-Derived Chars. Environ. Sci. Technol. 2004, 38, 4649–4655. [Google Scholar] [CrossRef] [PubMed]
  21. Fu, P.; Hu, S.; Xiang, J.; Sun, L.; Su, S.; Wang, J. Evaluation of the porous structure development of chars from pyrolysis of rice straw: Effects of pyrolysis temperature and heating rate. J. Anal. Appl. Pyrolysis 2012, 98, 177–183. [Google Scholar] [CrossRef]
  22. Li, W.; Yang, K.; Peng, J.; Zhang, L.; Guo, S.; Xia, H. Effects of carbonization temperatures on characteristics of porosity in coconut shell chars and activated carbons derived from carbonized coconut shell chars. Ind. Crop. Prod. 2008, 28, 190–198. [Google Scholar] [CrossRef]
  23. Marsh, H.; Rodríguez-Reinoso, F. (Eds.) Chapter 4-Characterization of Activated Carbon. In Activated Carbon; Elsevier Science Ltd.: Oxford, UK, 2006; pp. 143–242. ISBN 978-0-08-044463-5. [Google Scholar] [CrossRef]
  24. Novak, J.M.; Lima, I.; Xing, B.; Gaskin, J.W.; Steiner, C.; Das, K.C.; Ahmedna, M.; Rehrah, D.; Watts1, D.W.; Busscher1, W.J.; et al. Characterization of Designer Biochar Produced at Different Temperatures and Their Effects on a Loamy Sand. Ann. Environ. Sci. 2009, 3, 195–206. [Google Scholar]
  25. Ferreira, A.F.; Ribau, J.P.; Costa, M. A decision support method for biochars characterization from carbonization of grape pomace. Biomass Bioenergy 2021, 145, 105946. [Google Scholar] [CrossRef]
  26. Basu, P. (Ed.) Chapter 5-Pyrolysis. In Biomass Gasification, Pyrolysis and Torrefaction, 2nd ed.; Academic Press: Boston, MA, USA, 2013; pp. 147–176. ISBN 978-0-12-396488-5. [Google Scholar]
  27. Sakhiya, A.K.; Anand, A.; Kaushal, P. Production, activation, and applications of biochar in recent times. Biochar 2020, 2, 253–285. [Google Scholar] [CrossRef]
  28. Grima-Olmedo, C.; Ramírez-Gómez, Á.; Gómez-Limón, D.; Clemente-Jul, C. Activated carbon from flash pyrolysis of eucalyptus residue. Heliyon 2016, 2, e00155. [Google Scholar] [CrossRef]
  29. Zhang, T.; Walawender, W.P.; Fan, L.; Fan, M.; Daugaard, D.; Brown, R. Preparation of activated carbon from forest and agricultural residues through CO2 activation. Chem. Eng. J. 2004, 105, 53–59. [Google Scholar] [CrossRef]
  30. Thommes, M.; Kaneko, K.; Neimark, A.V.; Olivier, J.P.; Rodriguez-Reinoso, F.; Rouquerol, J.; Sing, K.S.W. Physisorption of gases, with special reference to the evaluation of surface area and pore size distribution (IUPAC Technical Report). Pure Appl. Chem. 2015, 87, 1051–1069. [Google Scholar] [CrossRef]
  31. Rouquerol, F.; Rouquerol, J.; Sing, K.S.W.; Llewellyn, P.; Maurin, G. Adsorption by Powders and Porous Solids: Principles, Methodology and Applications, 2nd ed.; Elsevier: Amsterdam, The Netherlands, 2014; ISBN 978-0-08-097035-6. [Google Scholar]
  32. Fong, A.; Tuli, A. Determination of Soil Water Characteristic Curve Using 5 Bar Ceramic Pressure Plate Extractor. Standard Operating Procedure Number: METH016.00; California Department of Pesticide Regulation, Environmental Monitoring Branch: Sacramento, CA, USA, 2018. [Google Scholar]
  33. van Genuchten, M.T. A Closed-form Equation for Predicting the Hydraulic Conductivity of Unsaturated Soils. Soil Sci. Soc. Am. J. 1980, 44, 892–898. [Google Scholar] [CrossRef]
  34. Bikbulatova, S.; Tahmasebi, A.; Zhang, Z.; Rish, S.K.; Yu, J. Understanding water retention behavior and mechanism in bio-char. Fuel Process. Technol. 2018, 169, 101–111. [Google Scholar] [CrossRef]
  35. Carrott, P.J.M.; Carrott, M.R.; Guerrero, C.I.; Delgado, L.A. Reactivity and porosity development during pyrolysis and physical activation in CO2 or steam of kraft and hydrolytic lignins. J. Anal. Appl. Pyrolysis 2008, 82, 264–271. [Google Scholar] [CrossRef]
  36. Stehfest, K.; Toepel, J.; Wilhelm, C. The application of micro-FTIR spectroscopy to analyze nutrient stress-related changes in biomass composition of phytoplankton algae. Plant Physiol. Biochem. 2005, 43, 717–726. [Google Scholar] [CrossRef]
  37. Mecozzi, M.; Pietroletti, M.; Tornambè, A. Molecular and structural characteristics in toxic algae cultures of Ostreopsis ovata and Ostreopsis spp. evidenced by FTIR and FTNIR spectroscopy. Spectrochim. Acta A Mol. Biomol. Spectrosc. 2011, 78, 1572–1580. [Google Scholar] [CrossRef]
  38. Ferreira, A.F.; Dias, A.S.; Silva, C.M.; Costa, M. Evaluation of thermochemical properties of raw and extracted microalgae. Energy 2015, 92, 365–372. [Google Scholar] [CrossRef]
  39. Paulo, I.; Costa, L.; Rodrigues, A.; Orišková, S.; Matos, S.; Gonçalves, D.; Gonçalves, A.R.; Silva, L.; Vieira, S.; Bordado, J.C.; et al. Acid-Catalyzed Liquefaction of Biomasses from Poplar Clones for Short Rotation Coppice Cultivations. Molecules 2022, 27, 304. [Google Scholar] [CrossRef] [PubMed]
  40. Goncalves, D.; Orišková, S.; Matos, S.; Machado, H.; Vieira, S.; Bastos, D.; Gaspar, D.; Paiva, R.; Bordado, J.C.; Rodrigues, A.; et al. Thermochemical Liquefaction as a Cleaner and Efficient Route for Valuing Pinewood Residues from Forest Fires. Molecules 2021, 26, 7156. [Google Scholar] [CrossRef]
  41. Liu, Y.; He, Z.; Uchimiya, M. Comparison of Biochar Formation from Various Agricultural By-Products Using FTIR Spectroscopy. Mod. Appl. Sci. 2015, 9, 246–253. [Google Scholar] [CrossRef]
  42. Slaný, M.; Jankovič, L’.; Madejová, J. Structural characterization of organo-montmorillonites prepared from a series of primary alkylamines salts: Mid-IR and near-IR study. Appl. Clay Sci. 2019, 176, 11–20. [Google Scholar] [CrossRef]
  43. Yi, S.; Chang, N.Y.; Imhoff, P.T. Predicting water retention of biochar-amended soil from independent measurements of biochar and soil properties. Adv. Water Resour. 2020, 142, 103638. [Google Scholar] [CrossRef]
  44. Liu, Z.; Dugan, B.; Masiello, C.; Gonnermann, H.M. Biochar particle size, shape, and porosity act together to influence soil water properties. PLoS ONE 2017, 12, e0179079. [Google Scholar] [CrossRef] [PubMed]
Figure 1. Schematic diagram of influence of biochar in soil [9].
Energies 15 05882 g001
Figure 2. Scheme of methodology for biochar production, characterization, and performance evaluation.
Energies 15 05882 g002
Figure 3. (a) Horizontal heating furnace and (b) reactor scheme [from [25]].
Energies 15 05882 g003
Figure 4. Sandbox for pF-determination.
Energies 15 05882 g004
Figure 5. Pressure vessel using a regulated air system [32].
Energies 15 05882 g005
Figure 6. Mass yield curve for a temperature range between 300 °C and 600 °C for pine biomass.
Energies 15 05882 g006
Figure 7. TGA (left) and DTG (right) of PS-Raw, PS-C600 and PS-AC.
Energies 15 05882 g007
Figure 8. FTIR analysis of biomass and biochar.
Energies 15 05882 g008
Figure 9. N2 adsorption-desorption isotherms determined at 77 K on PS-AC (squares) and PS-C600 (circles), with empty and filled symbols corresponding to adsorption and desorption, respectively.
Energies 15 05882 g009
Figure 10. Pore size (mL·g−1) logarithmic distribution evaluated through mercury porosimetry for PS-Raw, PS-C600 and PS-AC, according to the criteria of Soil Science Society of America (SSSA).
Energies 15 05882 g010
Figure 11. SEM images for (a) PS-Raw; (b) PS-C600; (c) PS-AC (resolution of 100 μm).
Energies 15 05882 g011
Figure 12. Water holding capacity of biomasses on volume basis.
Energies 15 05882 g012
Figure 13. WHC for sand and biochar amounts of 0%, 10%, 50% and 100% in mixtures.
Energies 15 05882 g013
Table 1. Breakdown of the percentages by volume used between biomass/biochar and sand.
TestBiomass/Biochar [% Volume]Sand [% Volume]
Water holding Capacity
Water Retention curves
-100%
100%-
50%50%
10%90%
Table 2. Proximate analysis for biomasses and biochar on a dry basis.
Sample TypeVolatile Matter (%)Ash (%)Fixed Carbon (%)Calorific Value [MJ/kg]
PS-Raw86.850.4912.6618.01
PS-C60015.161.3983.4631.86
Table 3. FTIR band assignments [36,37,38,39,40].
Wavenumber (cm−1)Band AssignmentCompounds/Groups
3338OH stretchingHydroxyls groups
2889–2981CH2, CH3 stretchingmethylene and methyl groups from holocellulose and lignin
1731C=O stretchingketones and esters
1720C=O carbonyls in ester groups and acetyl groups in xylanKetones, esters, hemicellulose, and carboxylic acids and esters
1646–1633OH bendingwater
1604C=C aromatic ring vibrationLignin
1599C=C stretchingaromatic ring, lignin
1514C=C aromatic ring stretchingLignin
1461–1444OCH3, -CH2-, and C-H stretchingCarbohydrates, Cellulose, hemicellulose
1369aromatic C–H deformationsyringyl rings (from lignin)
1330C-O syringyl ringLignin
1264–1246Aromatic ring vibrationGuaicyl lignin
1096C-O-C stretchingCellulose, hemicellulose
1020C-O, C=C, and C-C-O stretchingCellulose, hemicellulose, lignin
906Glycosidic linkageCellulose, hemicellulose
896C−O, C=C, and C−C−Ohemicellulose
Table 4. BET area (ABET) of raw biomass and biochars determined by analysis of Kr and N2 adsorption at 77 K, respectively, and volume of N2 adsorbed at p/po = 0.95 (V0.95).
SampleABET [m2g−1]V0.95 [cm3g−1]
PS-Raw0.34-
PS-C6003750.184
PS-AC9370.443
Table 5. Main results of mercury porosimetry for: total intrusion volume, porosity, division between macropores and mesopores according to IUPAC [30], and bulk density.
SampleTotal Pore Volume [mL·g−1]Porosity [%]Macropores (>50 nm) [mL/g]Mesopores (2–50 nm) [mL/g]Cryptopores (<0.1µm) [mL/g] *Bulk Density [g/mL]
PS-Raw2.4776.942.470.0000.000.31
PS-C6006.6388.676.630.0000.000.13
PS-AC6.3788.896.370.0067.00e-030.14
* Pore volume [mL/g] of different pore sizes according to the criteria of Soil Science Society of America (SSSA).
Table 6. Moisture soil contents for the mixtures sand-biochar at pF 0, 2, 2.5 and 4.
PS-C600 0%
Biochar Amount
PS-C600 10% Biochar AmountPS-C600 50% Biochar AmountPS-C600 100% Biochar Amount
θ *% θ
Reduction **
θ *% θ
Reduction **
θ *% θ
Reduction **
θ *% θ
Reduction **
θ-pF 00.39-0.43-0.62-0.88-
θ-pF 20.0820.510.50116.280.1727.420.2123.86
θ-pF 2.50.0410.260.1227.910.1320.970.1719.32
θ-pF 4.20.025.130.0818.600.0812.900.1011.36
* Moisture in cm3/cm3; ** calculations relative to pF0.
Table 7. Plant available water (θpaw) for mixtures of sand and biochar.
CategoryBiochar AmountSampleθpaw(cm3/cm3)% θpaw Increases
Mixtures0%Sand0.063-
Mixtures10%PS-C6000.074117
Mixtures50%PS-C6000.095151
Biochar100%PS-C6000.108171
Publisher’s Note: MDPI stays neutral with regard to jurisdictional claims in published maps and institutional affiliations.

