Article

Flow Characteristics and Heat-Transfer Enhancement of Air Agitation in Ice Storage Air Conditioning Systems

1
NARI Group Corporation (State Grid Electric Power Research Institute), Nanjing 210003, China
2
State Grid Jinhua Power Supply Company, Jinhua 321035, China
3
College of Mechanical Engineering, Tianjin University of Commerce, Tianjin 300134, China
*
Author to whom correspondence should be addressed.
Energies 2022, 15(16), 5918; https://doi.org/10.3390/en15165918
Submission received: 25 July 2022 / Revised: 4 August 2022 / Accepted: 10 August 2022 / Published: 15 August 2022

Abstract

:
A large number of bubbles generated by the air agitation device in an external melting ice storage system can cause the disturbance of the ice–water mixture, which can enhance the heat transfer and contribute to the reduction in energy consumption. The structural design and optimization of the air agitation device in an external melting ice storage system is the key issue for energy savings. In this study, the influence of different orifice spacings and diameters on the distribution of the gas–liquid flow field, gas holdup, heat-transfer coefficient, and power consumption in the ice storage tank was investigated by numerical simulation. The simulated results showed that the heat-transfer coefficient of the ice–water mixture with air bubbles should be 3–5 times higher than the natural convection when the air superficial velocity is 0.03 m/s. The gas holdup was mainly affected by the orifice spacing, and the maximum varied from 5.0% to 8.2%. When the orifice spacing was less than 150 mm, the gas holdup changed a little in the horizontal direction, and the uniformity became worse when the orifice spacing was larger than 180 mm. An orifice diameter larger than 3 mm can improve the heat transfer and cause less air-compressing energy consumption, which decreased by approximately 1.62%.

1. Introduction

Ice thermal storage is an energy reserve technology. When the electricity consumption or cost is low and air conditioning (AC) is not required, ice is generated, and the cold capacity is stored. Conversely, when the electricity consumption peaks, the electricity price is high, and the AC system is required, the stored ice is melted, and the cooling requirement is met through the stored cold reserve. Then, the utilization of energy achieves the conversion in time, and operational costs of the AC system are saved [1,2,3]. This technology combined with others, such as low-temperature air supply, independent fresh air, and large temperature difference air supply, provides wide application prospects for AC systems [4,5,6].
As a high latent heat, nontoxic, and low-priced inorganic phase change material (PCM), ice has obvious advantages in large AC systems of commercial buildings [7]. The main technology involved in ice formation and ice melting, especially heat transfer enhancement in the process of ice formation and melting, needs to be further studied [8]. Ice thermal conductivity, which is only 2.24 W/m K, is very low. Moreover, the ice freezing rate decreases with the increase in ice layer thickness, which seriously influences ice charging and discharging efficiency and the system’s performance [9]. The relatively good heat-transfer performance of the ice melting process, a comparatively low supply water temperature, and a high efficiency in cold utilization [10] have prompted external ice melting systems to be widely applied in practical engineering projects. However, its ice storage rate still needs to be improved, and the layout of the coil in the ice thermal storage tank requires study for achieving the high evenness of ice, which directly affects the ice melting in the ice thermal storage tank. If the ice density is not uniform, dead angles will easily appear in the cold release process, and the return water of the AC system will flow through the way that melts first with the least flow resistance. The inhomogeneity of the heat exchange continuously accelerates the uneven melting over time and results in an uneven ice melting rate. Therefore, in order to enhance the heat-transfer performance in the ice charging and discharging processes, some methods, such as adding another heat-transfer fluid (HTF) into the PCM, have been introduced [11]. It is not easy to completely separate liquid HTF from water, but the gas does not have the restrictions such as those posed by air gas agitation devices [12]. The gas agitation device includes an air pump that provides compressed air from the bottom of the ice storage tank to generate a large number of bubbles. The air bubbles generate a disturbance in the ice–water mixture, increase the heat-transfer coefficient between the ice and water, and improve the ice melting characteristics of the external ice melting system, making the ice melting more uniform and the cooling water temperature more stable. Zhang et al. [13] studied the performance of a dynamic ice making system under different flowrates of air agitation. The results showed that the amount of ice slurry produced increased rapidly and that the quality improved by 5–10 times when the air agitation device was adopted.
When a solid phase exists, these reactors are generally referred to as slurry bubble column reactors. Bubble columns are intensively utilized as multiphase contactors and reactors in the chemical, petrochemical, biochemical, and metallurgical industries to supply low-temperature air (LTA) [14], and an air pump is used to pump compressed air from the bottom of the ice storage tank to generate a large number of bubbles. Belusko et al. [15] introduced LTA into water through a bubble column. It was found that many channels were formed inside the ice. The porous structure dispersed the airflow into isolated bubbles, which produced a foam and increased the heat-transfer area. Due to prolonged contact time between the LTA and PCM, the heat transfer between the PCM and its geometric boundary was strengthened and, therefore, the heat-transfer efficiency was greatly improved. The results showed that when the air flow rate is 25 L/min, the freezing rate should be four times higher than that without LTA. Mehran et al. [16] studied the effect of gas agitation of Si dissolution in molten Al and revealed that larger bubble-induced fluctuating velocities can, in turn, increase the dissolution rate. At lower bulk velocities, the effect of gas agitation is localized around the lance. By increasing the velocity, the effect of gas agitation is transported further into the bath.
Ghashim et al. [12] injected bubbles with different flow rates into a vertical spiral coil heat exchanger and showed that the Nusselt number increased by 64–126%, and the friction coefficient increased by at least 66% because of the air bubble injection. Belusko et al. [15] made a direct contact, phase-change, heat storage system that used air as the heat-transfer fluid and water as the PCM for thermal storage. The heat exchange, volume change, and pumping power consumption were compared with other PCM storage systems. The results showed excellent heat-transfer characteristics and a volume increase of 30% measured, with the potential for significant reductions. Overall, the energy storage effectiveness was found to be above 0.5, comparable to other optimized PCM storage systems.
Mohamed [17] investigated the performance of an ice storage system and stored thermal energy in the solidification of phase change material around a vertical cylindrical surface. The results showed that the stored thermal energy increased by approximately 55–115% with increasing air bubble flow, and the storage time was reduced by 10–35% without stirring.
The thermodynamic evaluations of ice thermal energy storage systems for undertaking the air conditioning cooling load of peak hours in hotel [18], households [19], commercial [20] and office buildings [21] have been carried out. But a secondary heat exchange system must be installed between the cold water of the air conditioning system and the ice storage system, which not only increases the initial investment in the equipment but also makes it difficultly to supply low-temperature water to the air conditioning system; furthermore, it brings difficulties to the safe operation and control of the system. At present, the available research on the design of air agitators and the influence of the air flow rate on the heat-transfer performance in ice thermal storage AC systems is limited. Therefore, further theoretical and experimental research is necessary. An air gas agitation device disperses the air into the bottom of the ice storage tank through the air pump to the filter, connecting pipe, gas distributor, etc. The design of the air column directly affects the fluid’s hydrodynamic behavior, heat-transfer characteristics, and ice thermal storage and melting efficiency in the ice storage tank. Studies have shown that improving the gas uniformity is not only beneficial for increasing gas holdup and the mass transfer rate but also for reducing the pressure drop and fluid flow dead zones. Moreover, the uniformity of the air bubbles will enhance the gas–liquid contact and interphase transfer. Thorat and Joshi [22] reported that the transition gas velocity depends on column dimensions, sparger design and physical properties of the system. However, the effects of these parameters have not been investigated thoroughly in the literature thus far.
In order to better solve the problem of the stable and efficient release of the stored cold capacity when adopting shifting electricity from peak periods to off-peak periods by an ice storage system, air agitation is an effective way to improve the release efficiency of the cooling capacity. Therefore, the rational design of the structure of an air agitation device is the key to solving the problem of uneven distribution in practical applications. Computational fluid dynamics (CFD) simulation technology is a computer application that numerically analyzes the controlling equations of hydrodynamics and combines computer technology with the basic theory of fluid dynamics. At present, CFD simulation technology has been widely used in HVAC engineering, especially with the rapid development of computer technology. The advantages of CFD simulation technology lie in the fact that it does not require a large amount of labor and material resources, and an accurately calculated result can be obtained with high calculation accuracy after determining the corresponding parameters of the researched object, establishing the corresponding physical model, setting the parameters, and selecting the analytical algorithm. It can achieve the same purpose as an experimental test. At present, a large number of studies have researched and evaluated energy conversion and optimization using CFD technology, the use of which is not limited to the microscale [23,24,25] and conventional scale research objects. The studied air agitation device of an ice storage AC system was related to a large-scale object. Therefore, a validated CFD model based on the conservation of mass law, conservation of energy law, and bubble dynamics was adopted to consider the variations in the performance parameters among bubbles ejected from pipes and the PCM by modeling and simulation. The CFD simulation was developed in this study to estimate the influence of an air agitation device with different structures on an ice storage AC system. The orifice spacing and diameter were considered in the simulation in order to evaluate the gas–liquid flow field distribution, gas holdup, heat-transfer coefficient in the ice storage tank, and the power consumption of the air agitation device. The simulation results should be valuable for the design of air agitating devices in ice thermal storage systems and provides a theoretical basis for system application and design.

2. Methodology

2.1. Physics Model

The size of the simulated ice storage tank was 360 (L) × 180 (W) × 2200 (H) mm, and the water depth was taken to be 2 m. The ice storage coil was placed on both sides along the length of the tank, and two orifices were located at the bottom of the ice storage tank. Compressed air was blown into the water through those two orifices. The orifice diameter varied in the range of 1.5–3.5 mm, and the orifice spacing changed in the range of 90–210 mm in the simulations. Its specific structure is shown in Figure 1. The air superficial velocity was set at 0.03 m/s in the calculation.

2.2. Mathematical Model

According to the basic law of controlling fluid flow, three conservation and K-ɛ turbulence equations were established. Appropriate import and export initial conditions and wall and free side boundary conditions were also set so as to establish a three-dimensional dynamic mathematical model of the agitation device. The change in the gas–liquid, two-phase flow field was analyzed when compressed air was pumped through the gas agitation device, and the pattern of bubble and gas disturbance in the ice storage tank was studied. This regime is characterized by the disturbed form of the homogeneous gas–liquid system due to the enhanced turbulent motion of gas bubbles and liquid recirculation, and churn turbulent flow is frequently observed in industrial-sized, large diameter columns [26].
The simulation assumes that the liquid phase is continuous, and the gas phase is incompressible. No mass transfer occurs between the gas and liquid. Since no heat transfer and phase change with the outside of the tank are involved, the fluid flow inside the tank must satisfy the conservation of mass, momentum, and energy. For constant incompressible fluids streams, the quality equation is expressed in Equation (1) [27].
( u x ) x + ( u y ) y + ( u z ) z = 0
where u x , u y , and u z are the velocity components in the X, Y, and Z directions, respectively.
The momentum conservation equation can be written as follows [27]:
ρ d V d t = ρ g p + μ 2 V
where ρ is the fluid density; V is the velocity vector; P is the pressure. The external force of the unit volume fluid is ρ g in the case where only gravity is considered. The power consumption viscosity, μ , is constant.
The energy conservation equation can be written as follows [27]:
ρ C p T t + ρ C p u T + ( K T ) = Q
where ρ is the fluid density; C p is the specific heat; u is the velocity vector; T is the thermodynamic temperature; K is the heat-transfer coefficient.
Several alternatives have been proposed to estimate the effective viscosity of the turbulent liquid phase in the gas–liquid flows. The standard k ε model of turbulence appears to perform satisfactorily [28], and it was used to estimate the effective viscosity of liquid phase as follows.
The turbulence viscosity coefficient is determined by the following formula:
μ T = C μ ρ k 2 ε
where C μ is the constant.
The values of k and ε were obtained directly from the transport equations for the turbulent kinetic energy and the turbulence dissipation rate, which are expressed in Equations (5) and (7), respectively. In two-phase flow, it is imaginable that energy caused by bubble wakes is transferred into turbulent kinetic energy. This can be taken into account by additional turbulence production, which is defined as bubble-induced turbulence (BIT) [29].
ρ k t + ρ u k = x j [ ( μ + μ T σ k ) k ] + P k ρ ε + S k
P k = μ T ( u : ( u + ( u ) T 2 3 ( u ) 2 ) 2 3 ρ k u
ρ ε t + ρ u ε = [ ( μ + μ T σ ε ) ε ] + C ε 1 P k C ε 2 ρ ε 2 k + S ε
where μ T is turbulence viscosity coefficient, with C ε 1 , C ε 2 , σ k , and σ ε being the model constants that were set to the usual values of 1.44, 1.92, 1.0, and 1.3, respectively; S k and S ε are the custom and source items, respectively.

2.3. Grid Generation and Accuracy

In this study, a structured tetrahedral mesh was used to refine the boundary layer, which is shown in Figure 2. The simulation results were significantly related to the number of the calculation mesh; therefore, the appropriate number of grids should be selected. On the premise of ensuring the accuracy of the computing, the local mesh refinement approach was adopted to solve the problem of large airflow change around the orifice. Therefore, the standardized grid was utilized for the overall model and the refined grid for the zone around two orifices. The overall domain unit statistics are shown in Table 1. The grid volume was 0.1296 m and the cell volume ratio was 2.023 × 10⁻⁵. The minimal grid unit quality was greater than 0.1, and the average grid unit quality was 0.71. The residual error tolerance was set to 1% in the simulation. Therefore, the number of computing grids selected was 1.205 × 10⁶.

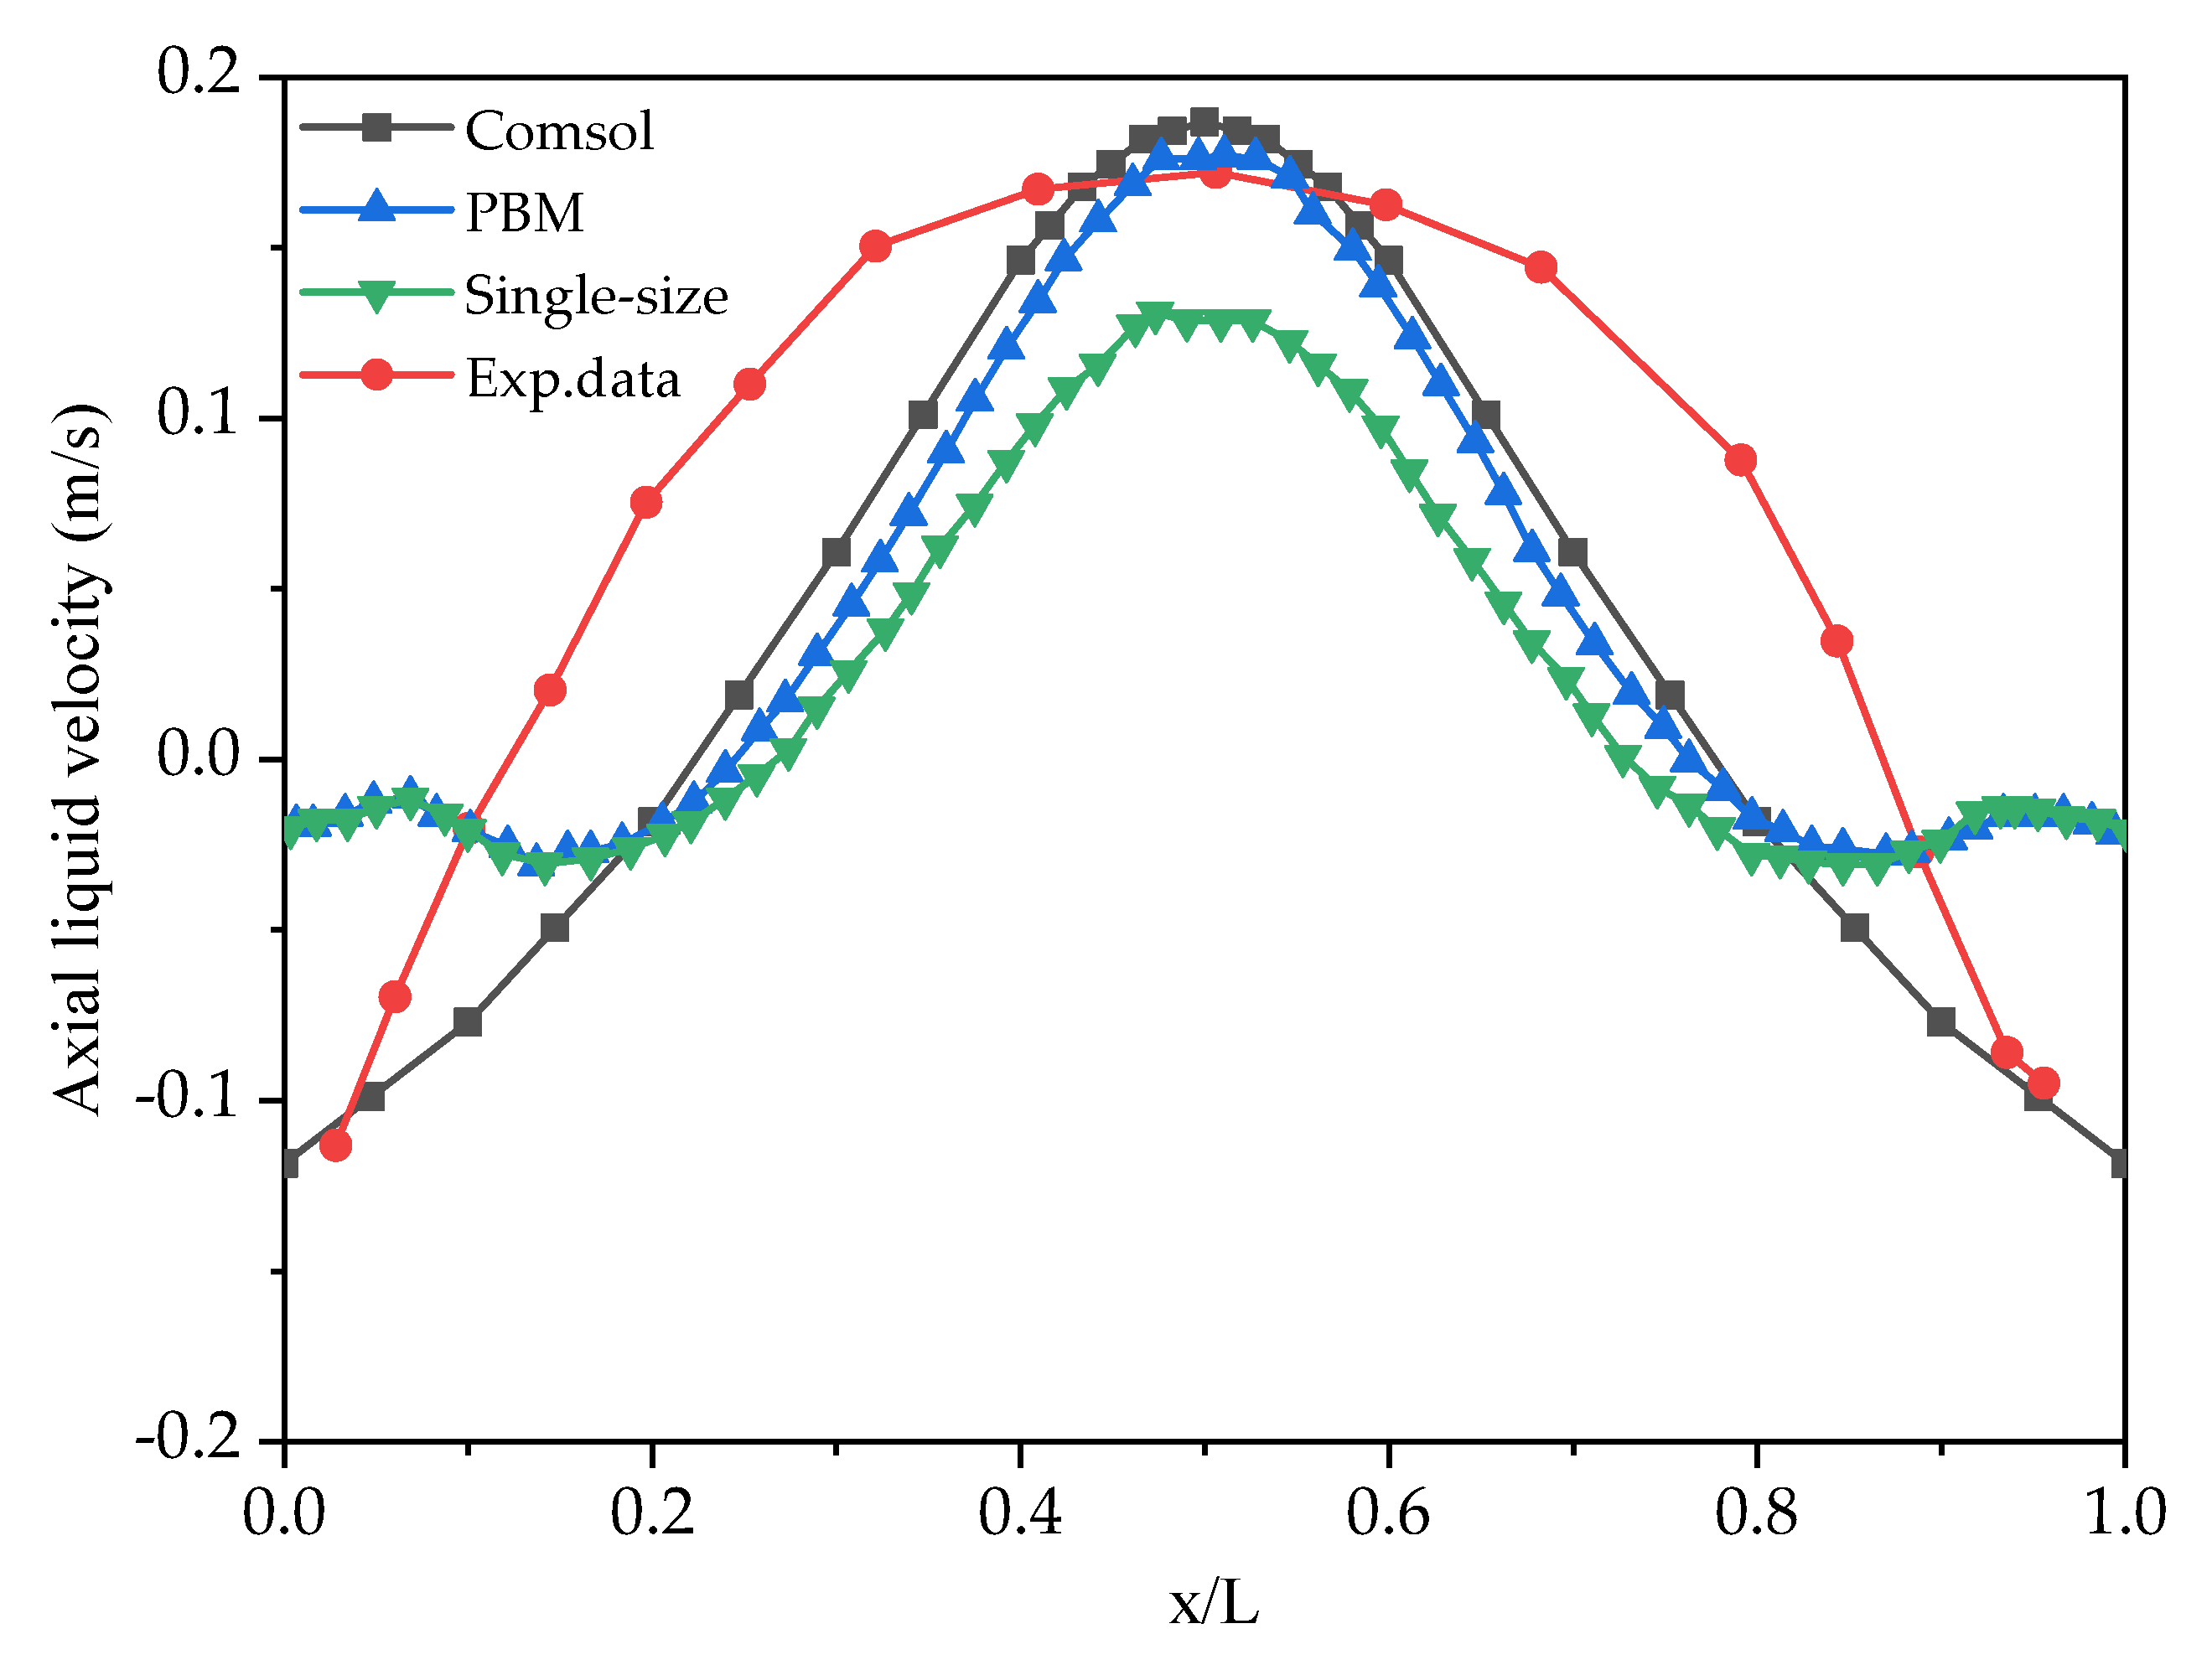
2.4. Comparison of the CFD Model with the Experimental Results

In this section, the axial liquid velocity calculated by the present study was compared with the values obtained in Deen’s study [30], although the geometry of the front part was not exactly the same. According to the experimental data of axial liquid velocity tested by Deen, a separate simulation was carried out to calculate the axial liquid velocity for comparative purposes. The model was proportionally reduced compared to the original model, and it adopted a symmetrical boundary that was filled with water. The simulated unit size is shown in Figure 3. Air was ejected from the orifice at the bottom of the bubble column, and the superficial velocity was 0.005 m/s.
Figure 4 shows the numerical comparison of the axial liquid velocity, calculated using the COMSOL model [31], the single bubble size model, and the population balance model (PBM), to that of Deen [30]. The above three models can be applied to the numerical simulation of gas–liquid, two-phase flow in a bubble column reactor. Compared with that of the other two models, the results of the axial liquid velocity simulated by the COMSOL model in this work were closer to the experimental values, and the variation in the axial liquid velocity was more consistent with the experimental results. At the location of the dimensionless length, x/L = 0.5 (i.e., the center of the bubble column), the radial liquid fluctuation was the largest. The average radial liquid velocity difference between COMSOL-simulated results and the experimental data was less than 8%, indicating that the simulation had high accuracy.

3. Analysis

In order to explore the influence of the orifice spacing and diameter on heat transfer in an ice storage system, the variation of flow in the ice storage tank was simulated using the conditions of a 0.03 m/s superficial velocity, a 1.5–4 mm orifice diameter, and a 90–210 mm orifice spacing.

3.1. Influence of the Orifice Diameter on the Air Velocity Distribution

Figure 5 and Figure 6 show the air velocity variation and a cloud map in the horizontal direction at different orifice diameters, respectively. The orifice diameter had an evident influence on the horizontal air velocity distribution. At a position below 0.3 m, the air velocity in the horizontal direction varied in a “V” shape, and its value was above 0.235 m/s. The maximum value increased slightly with the increase in the orifice diameter, and the change rate was less than 5%. At the positions above 0.6 m, the horizontal gas velocity is almost the same, which reaches approximately 0.24 m/s. The smaller the orifice diameter, the lower the air velocity difference at different heights. At a height of <0.6 m, there was evident gas disturbance, which became stronger with an increase in the orifice diameter.

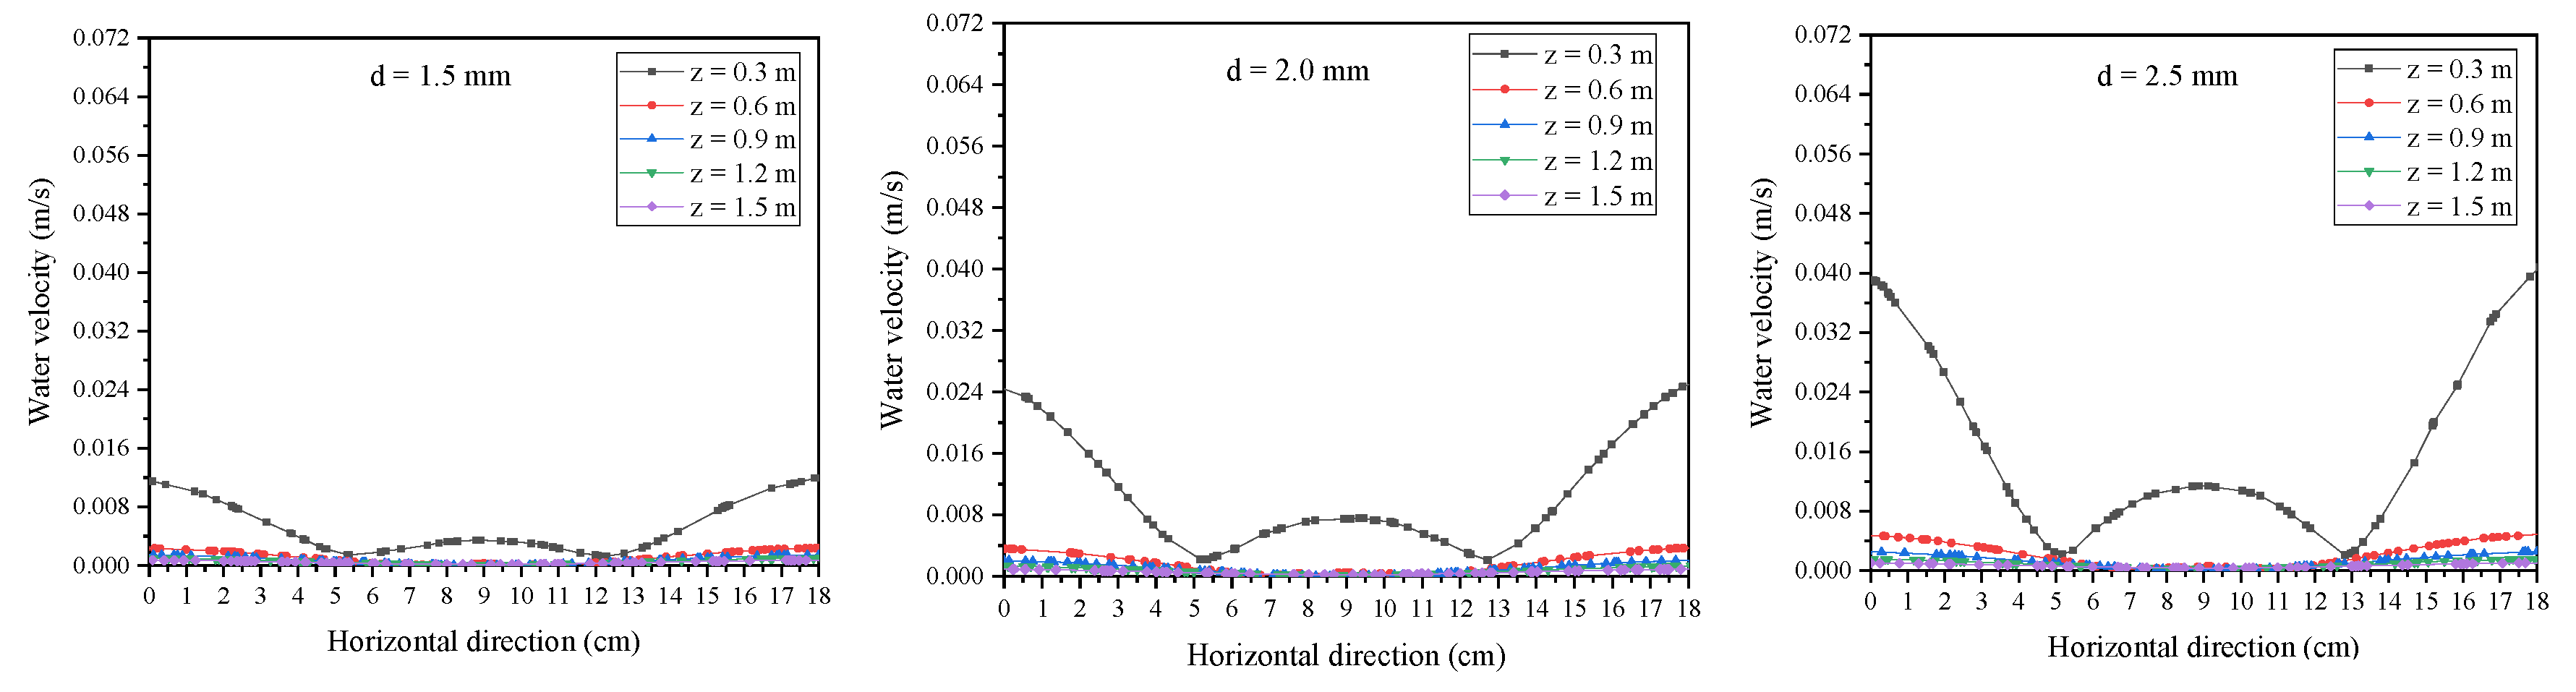
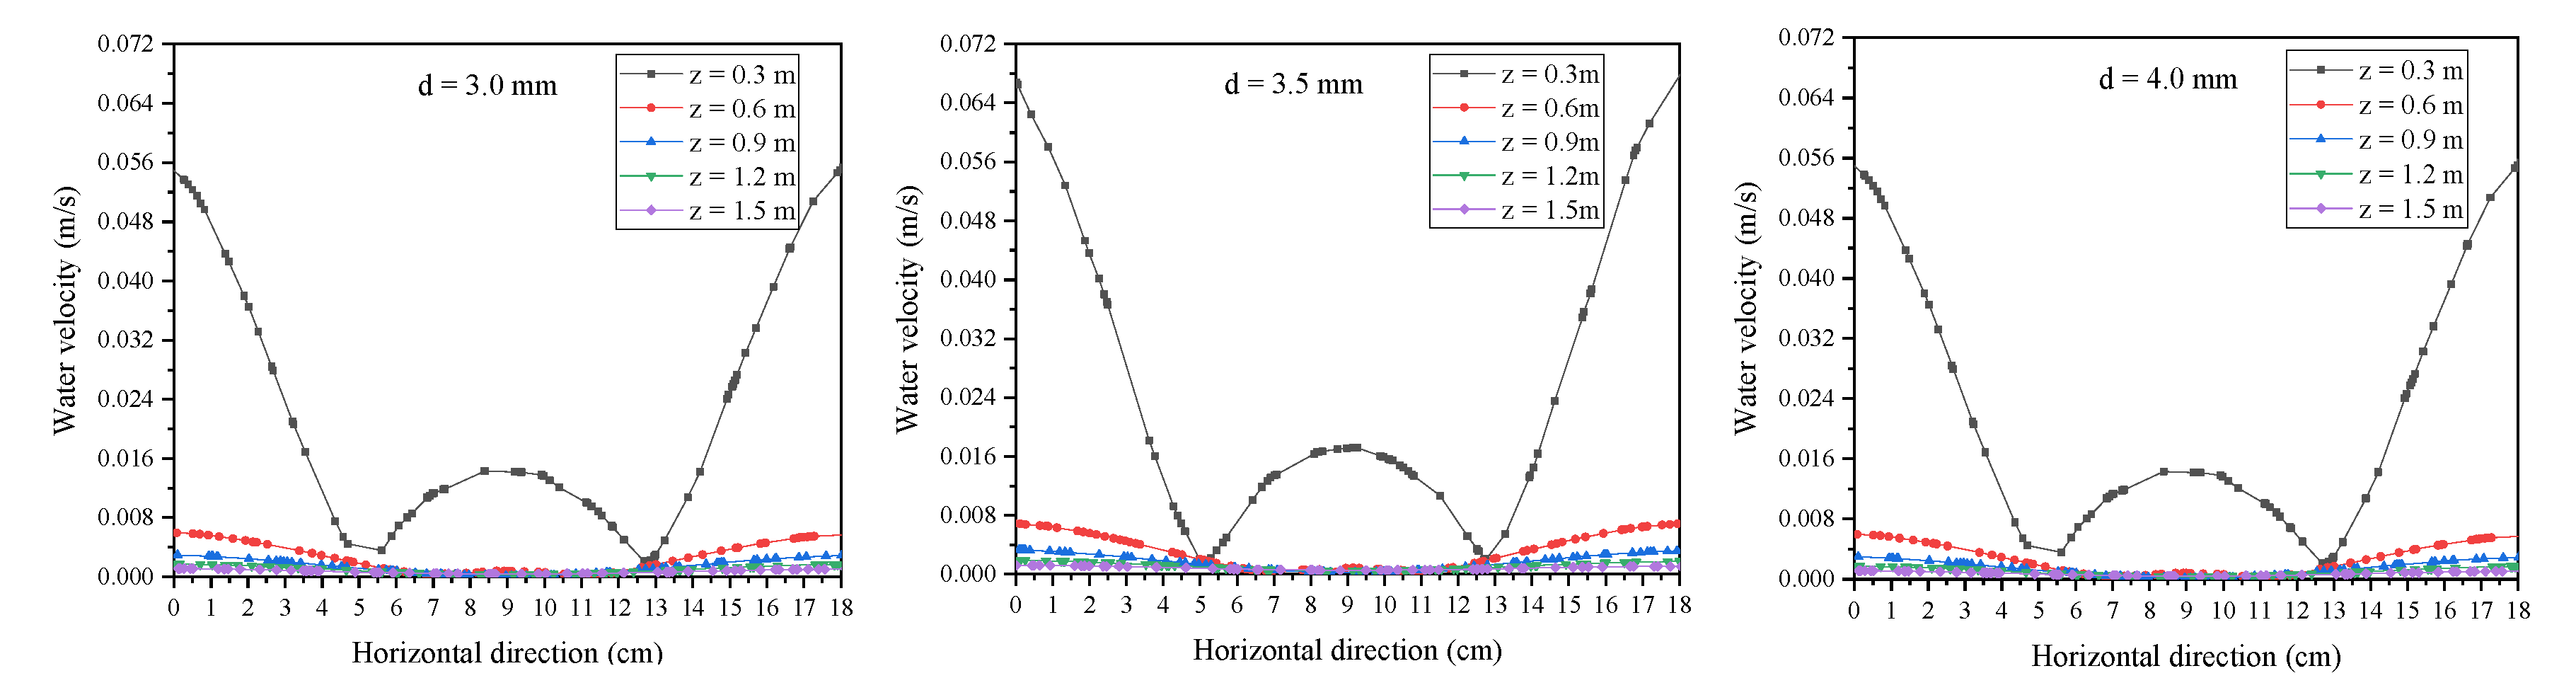
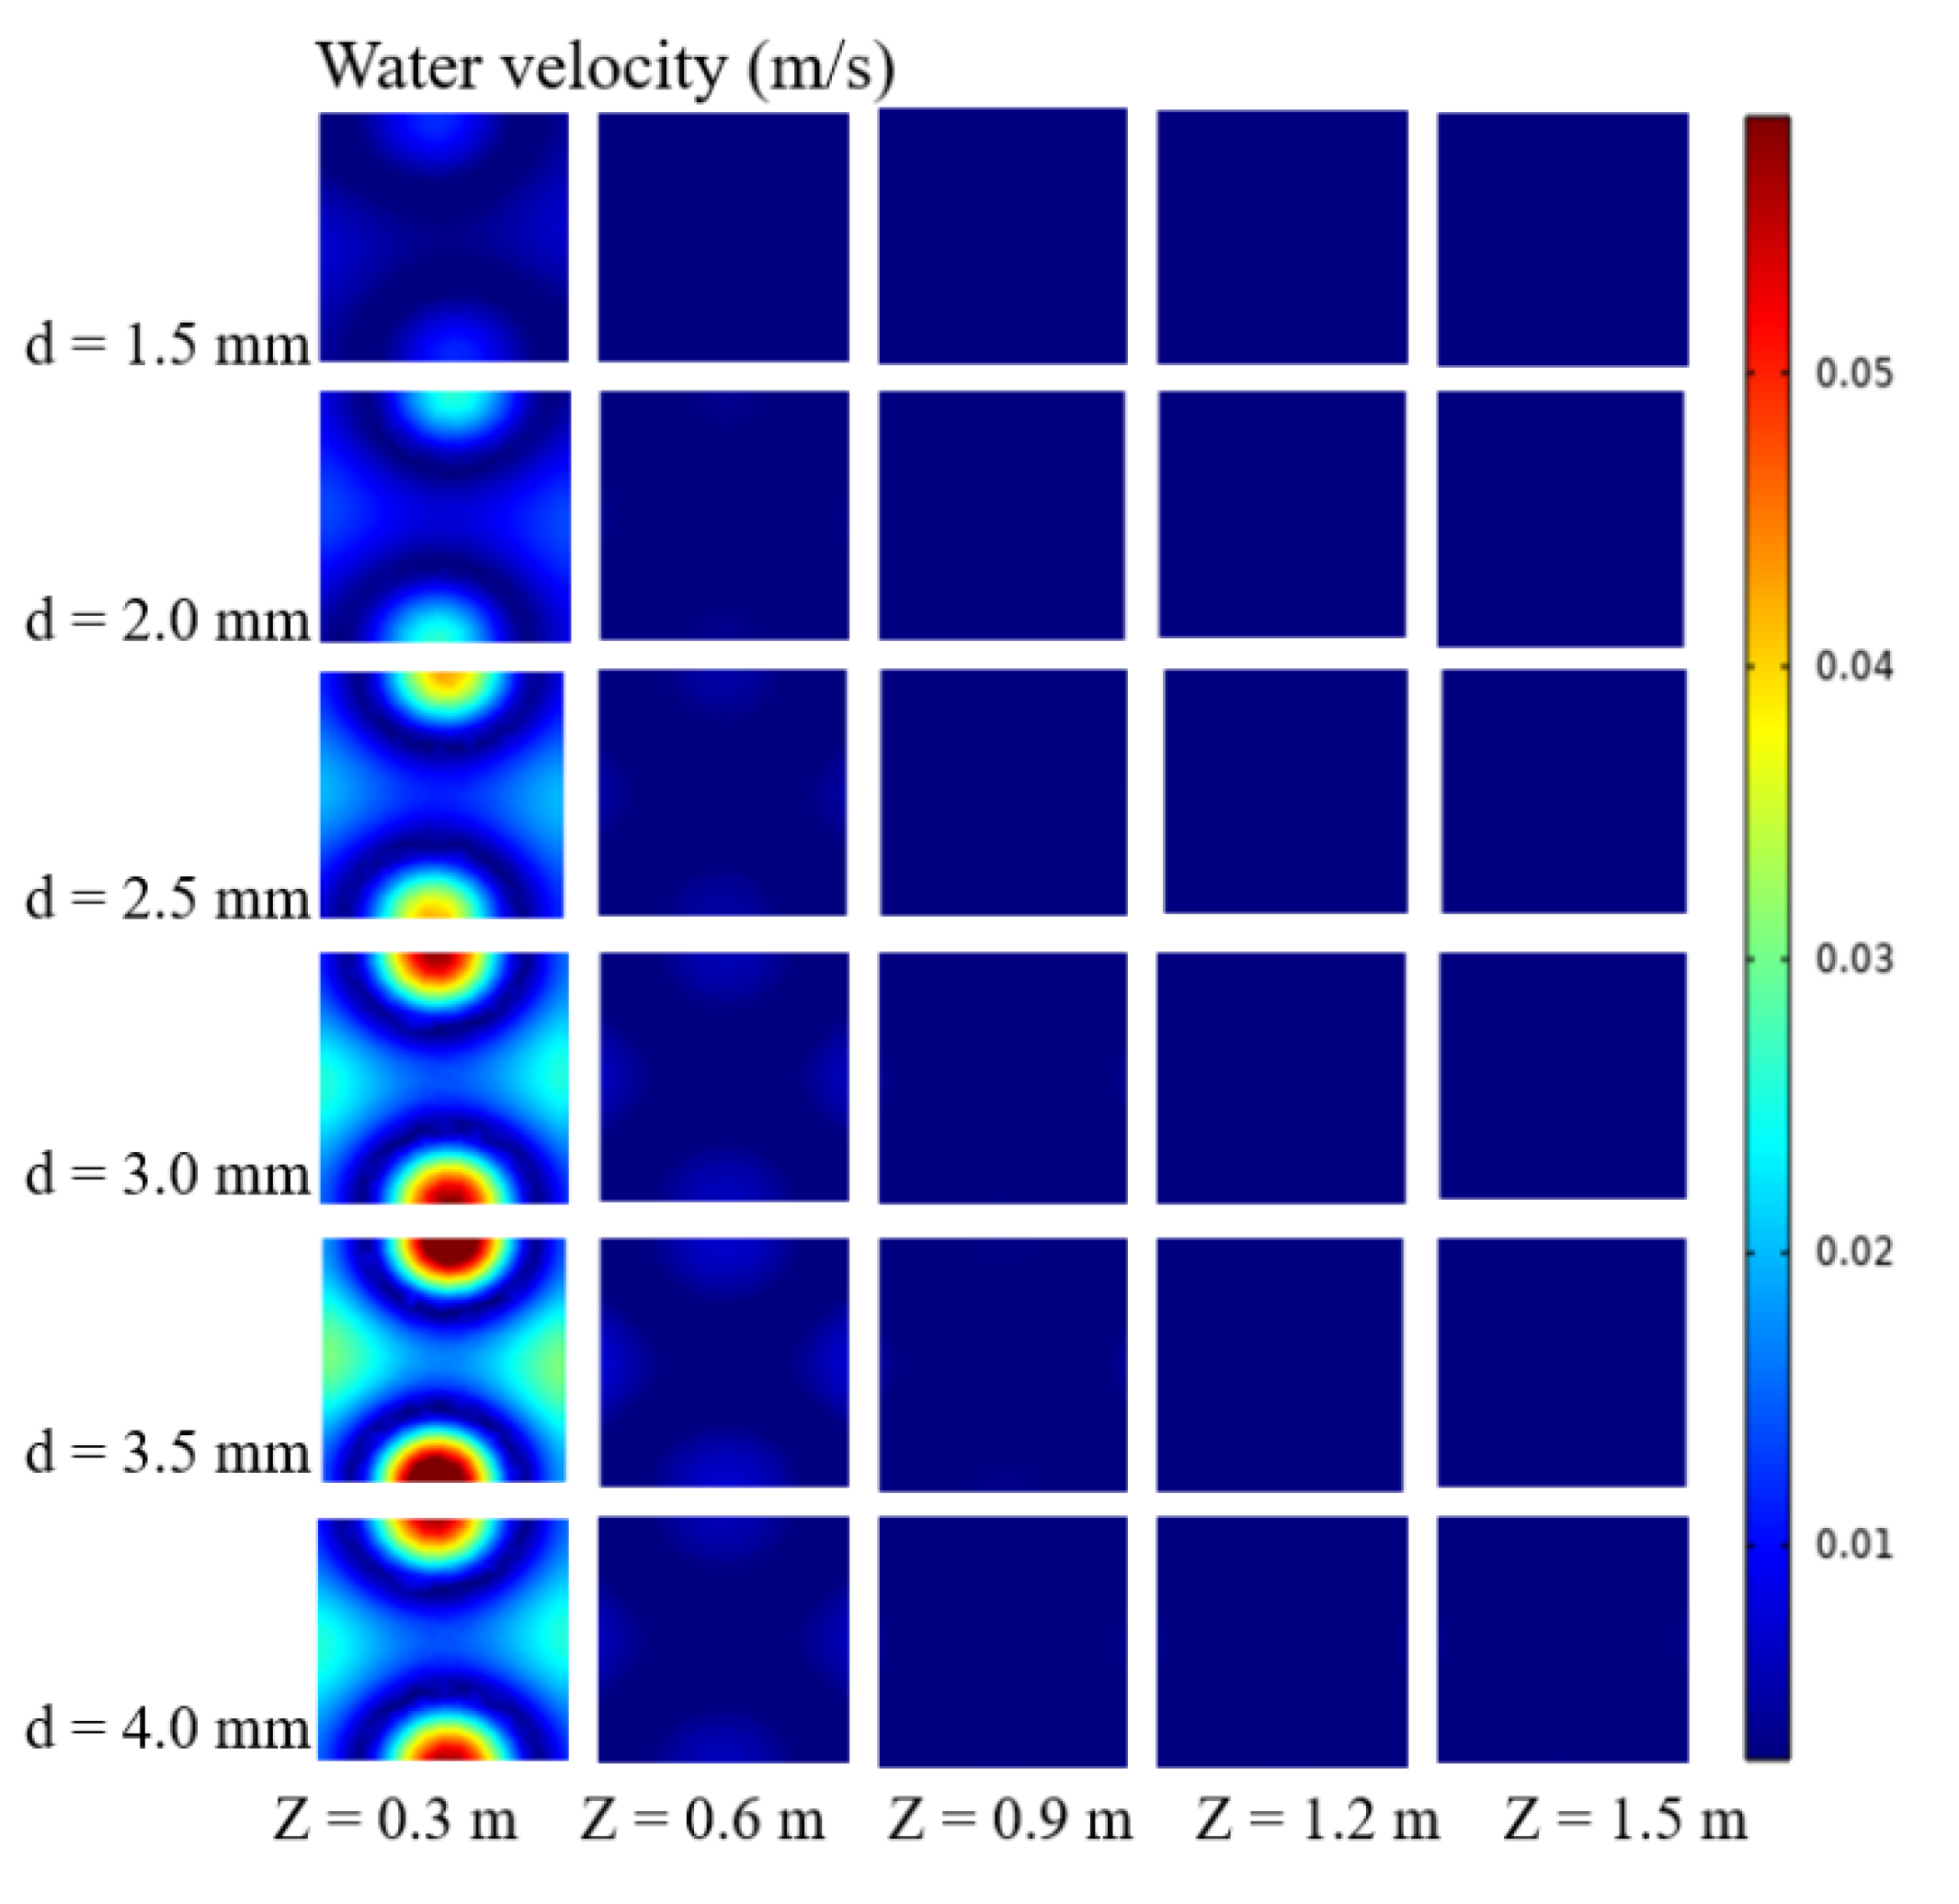
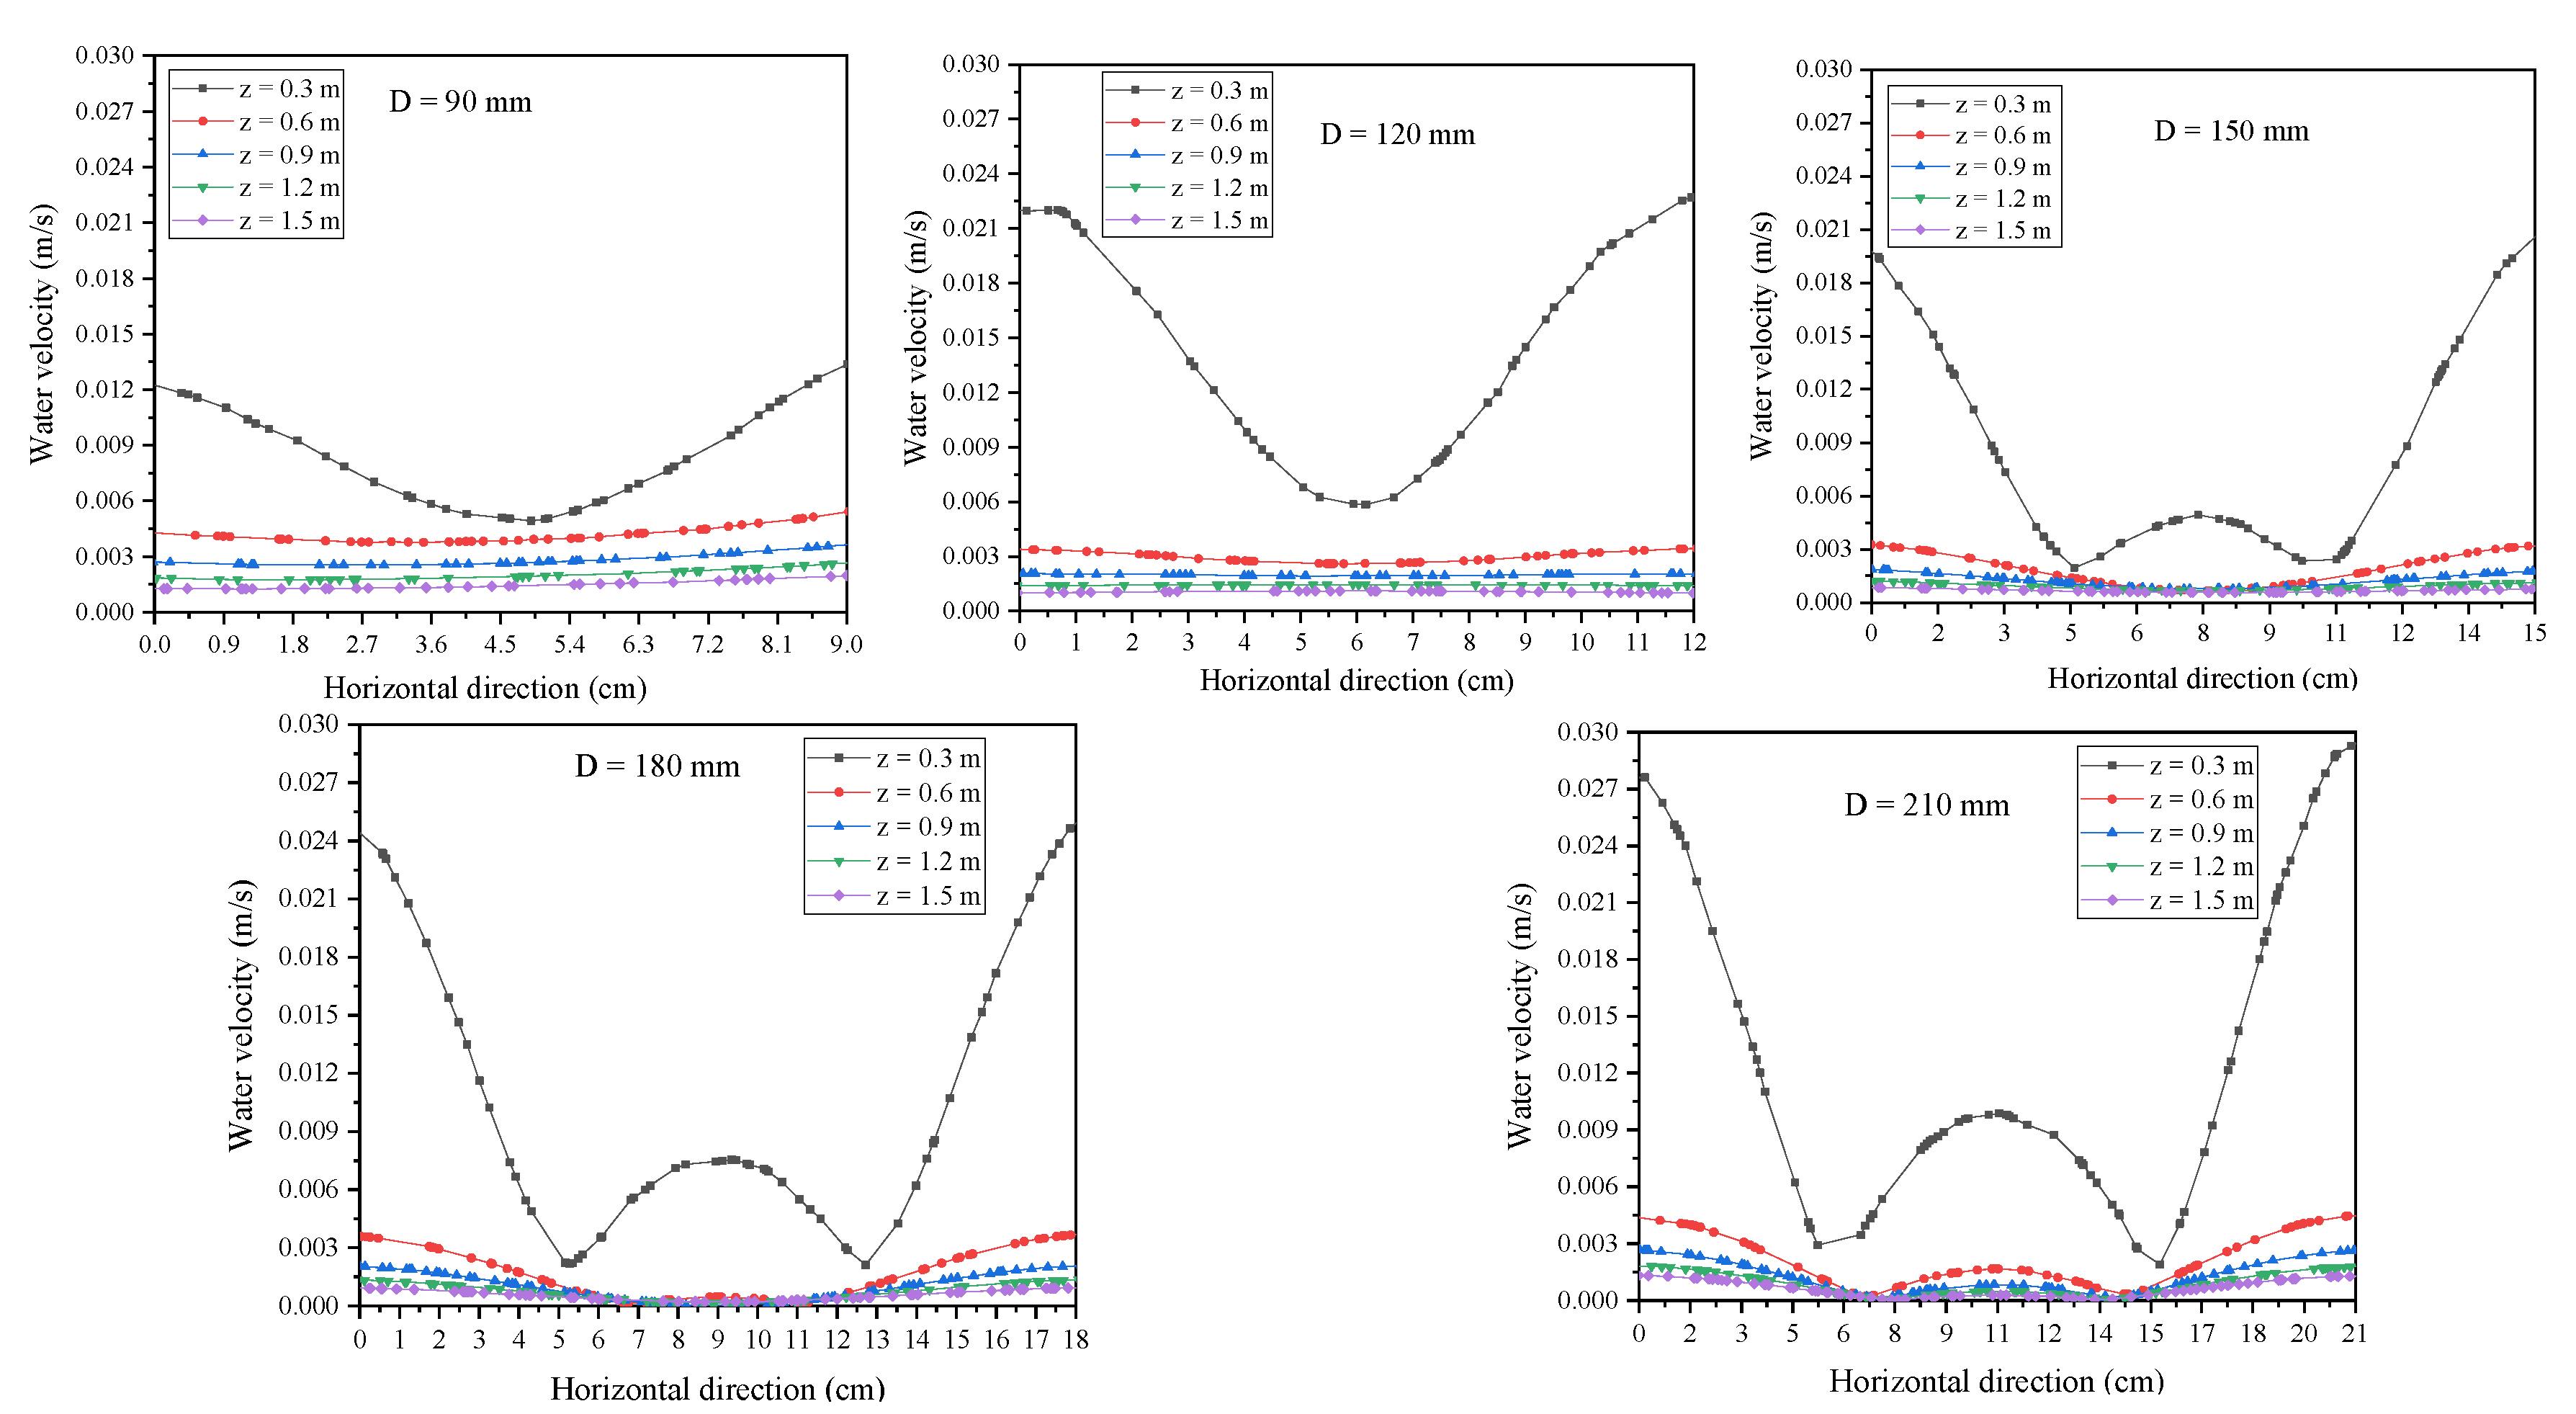
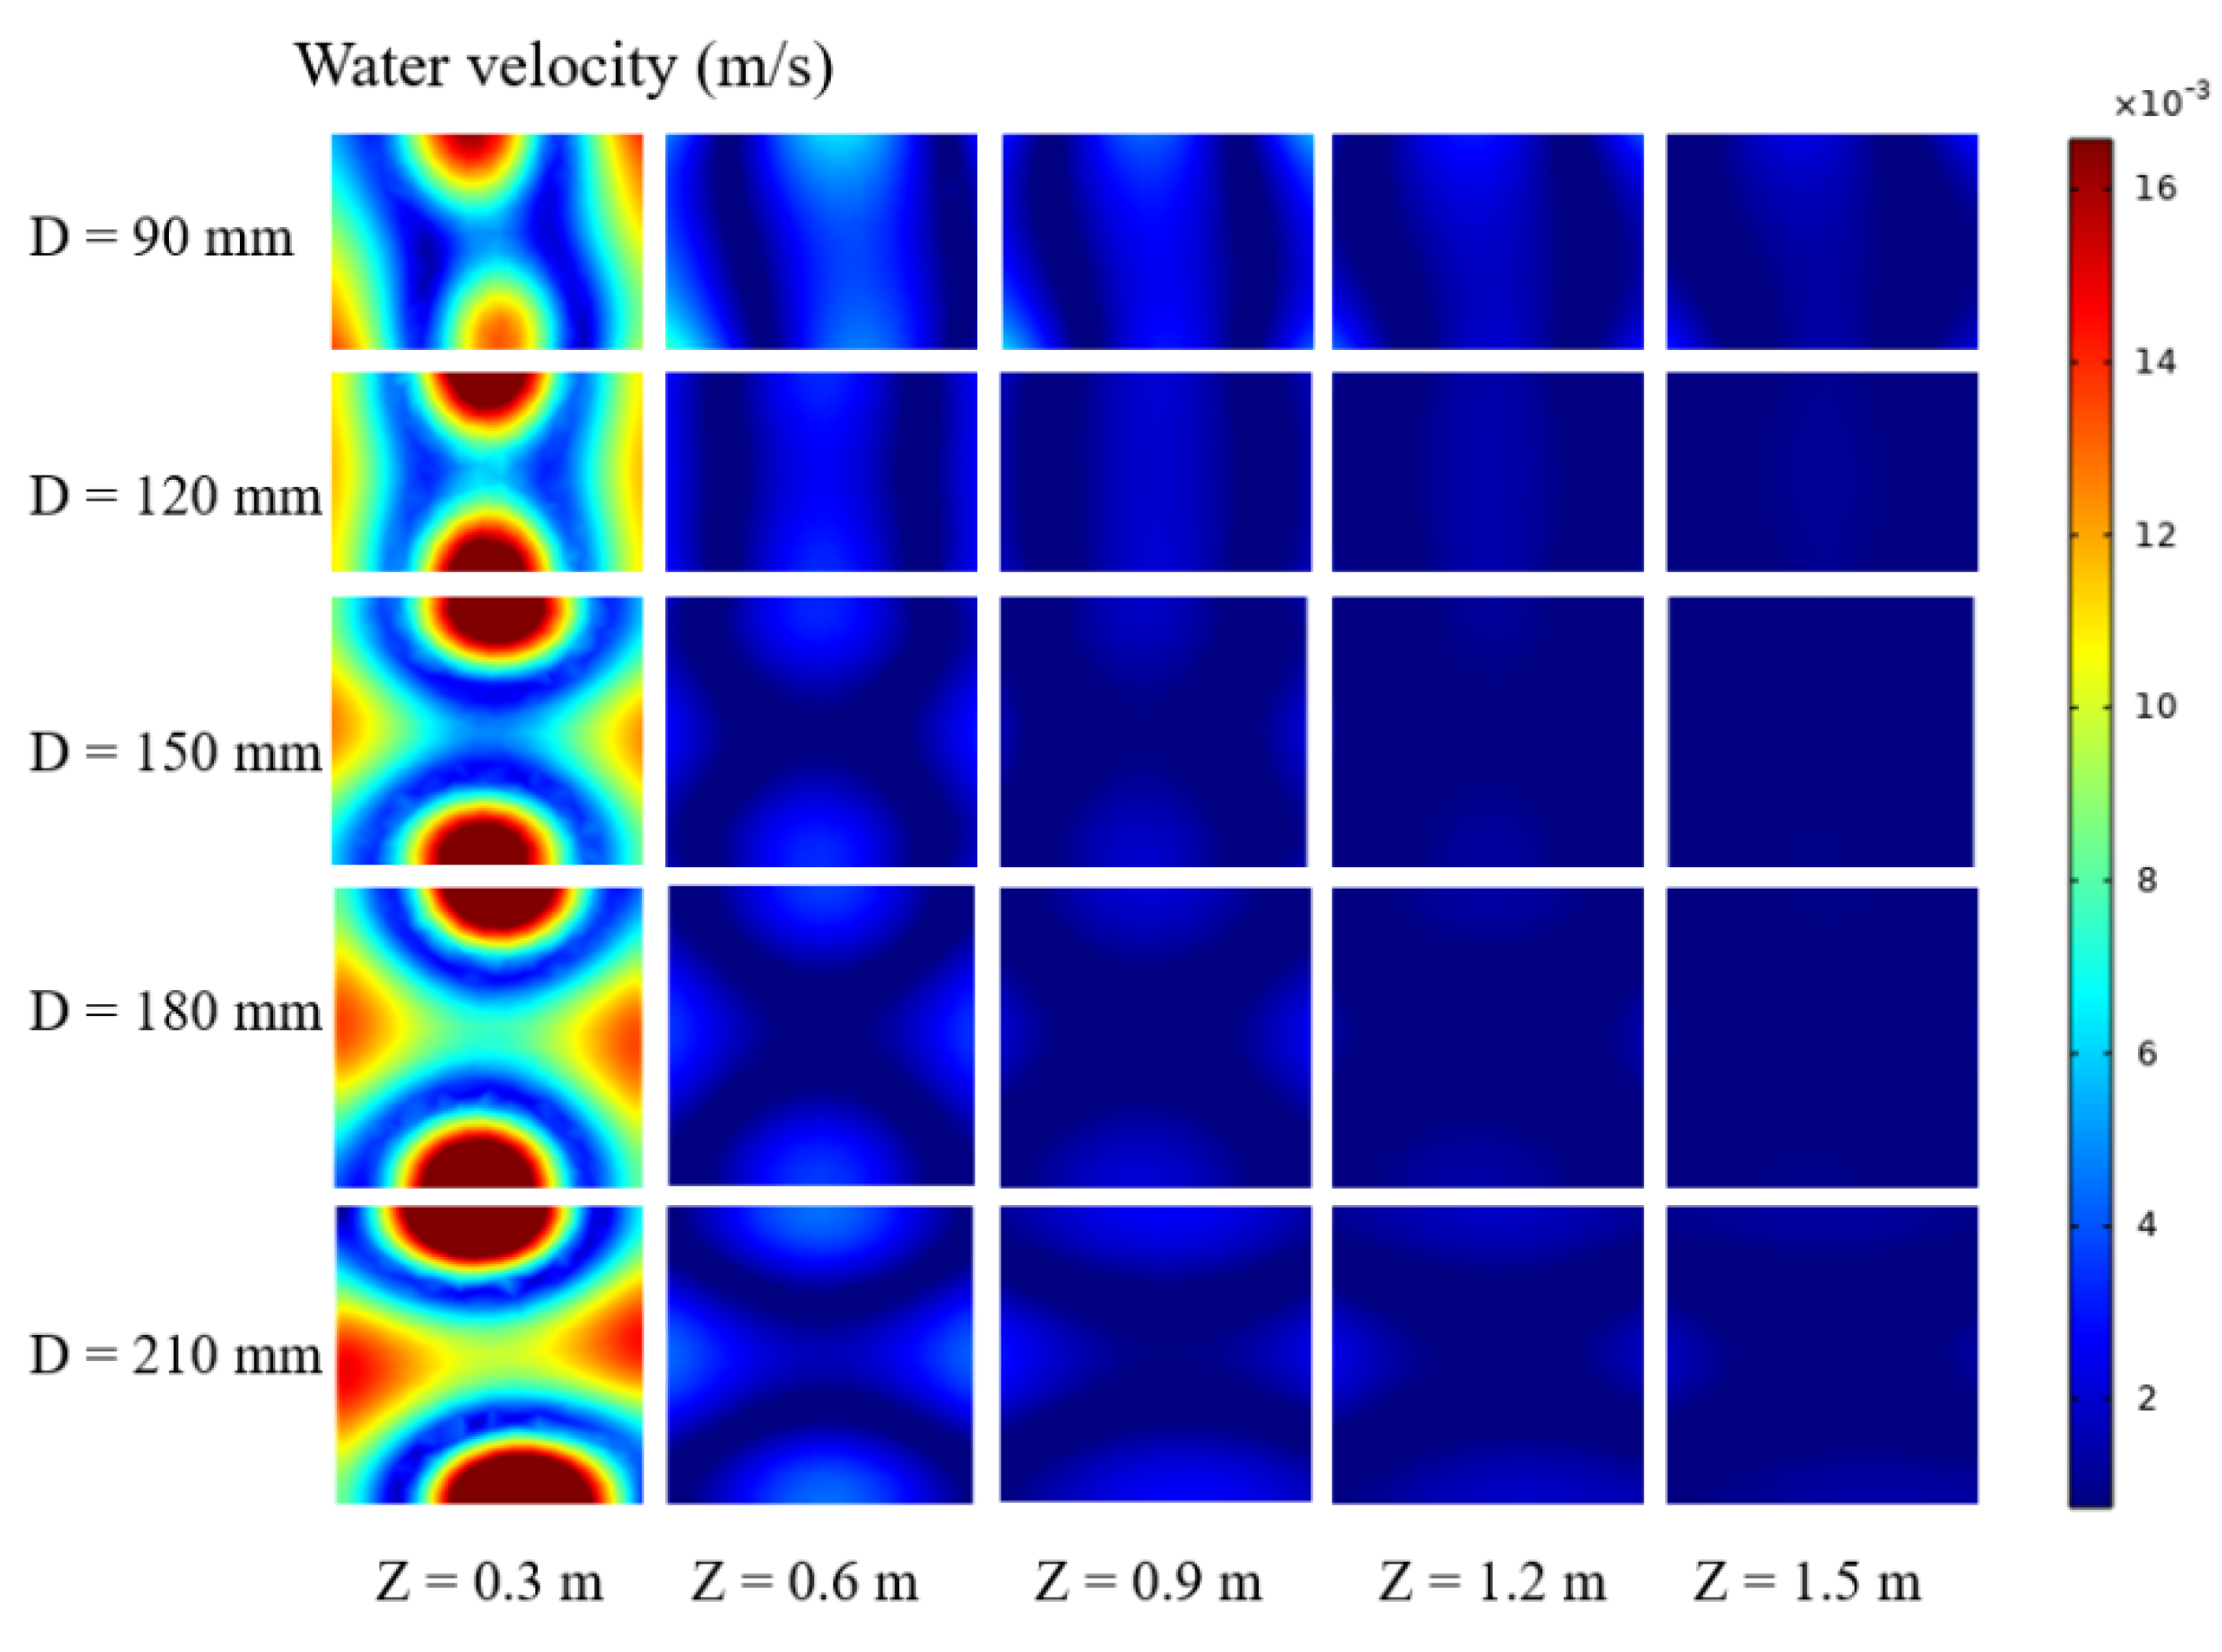
3.2. Influence of the Orifice Diameter on the Water Velocity Distribution

Figure 7 and Figure 8 show the water velocity variation and a cloud map of the variation along the horizontal direction at different orifice diameters, respectively. The variation in water velocity in the horizontal direction was shown as a “W” shape. When the orifice diameter was small, the water velocity was generally low, and the fluid disturbance caused by the air agitation was very subtle whether at the center or boundary. Water disturbance increased with the increase in orifice diameter. The disturbance close to the vent was greater than that at the center. When the diameter was greater than 3 mm, the water velocity could reach a value >0.05 m/s near the vent and approximately 0.016 m/s near the center, which can improve the convective heat transfer between the ice water mixture in the ice storage tank.

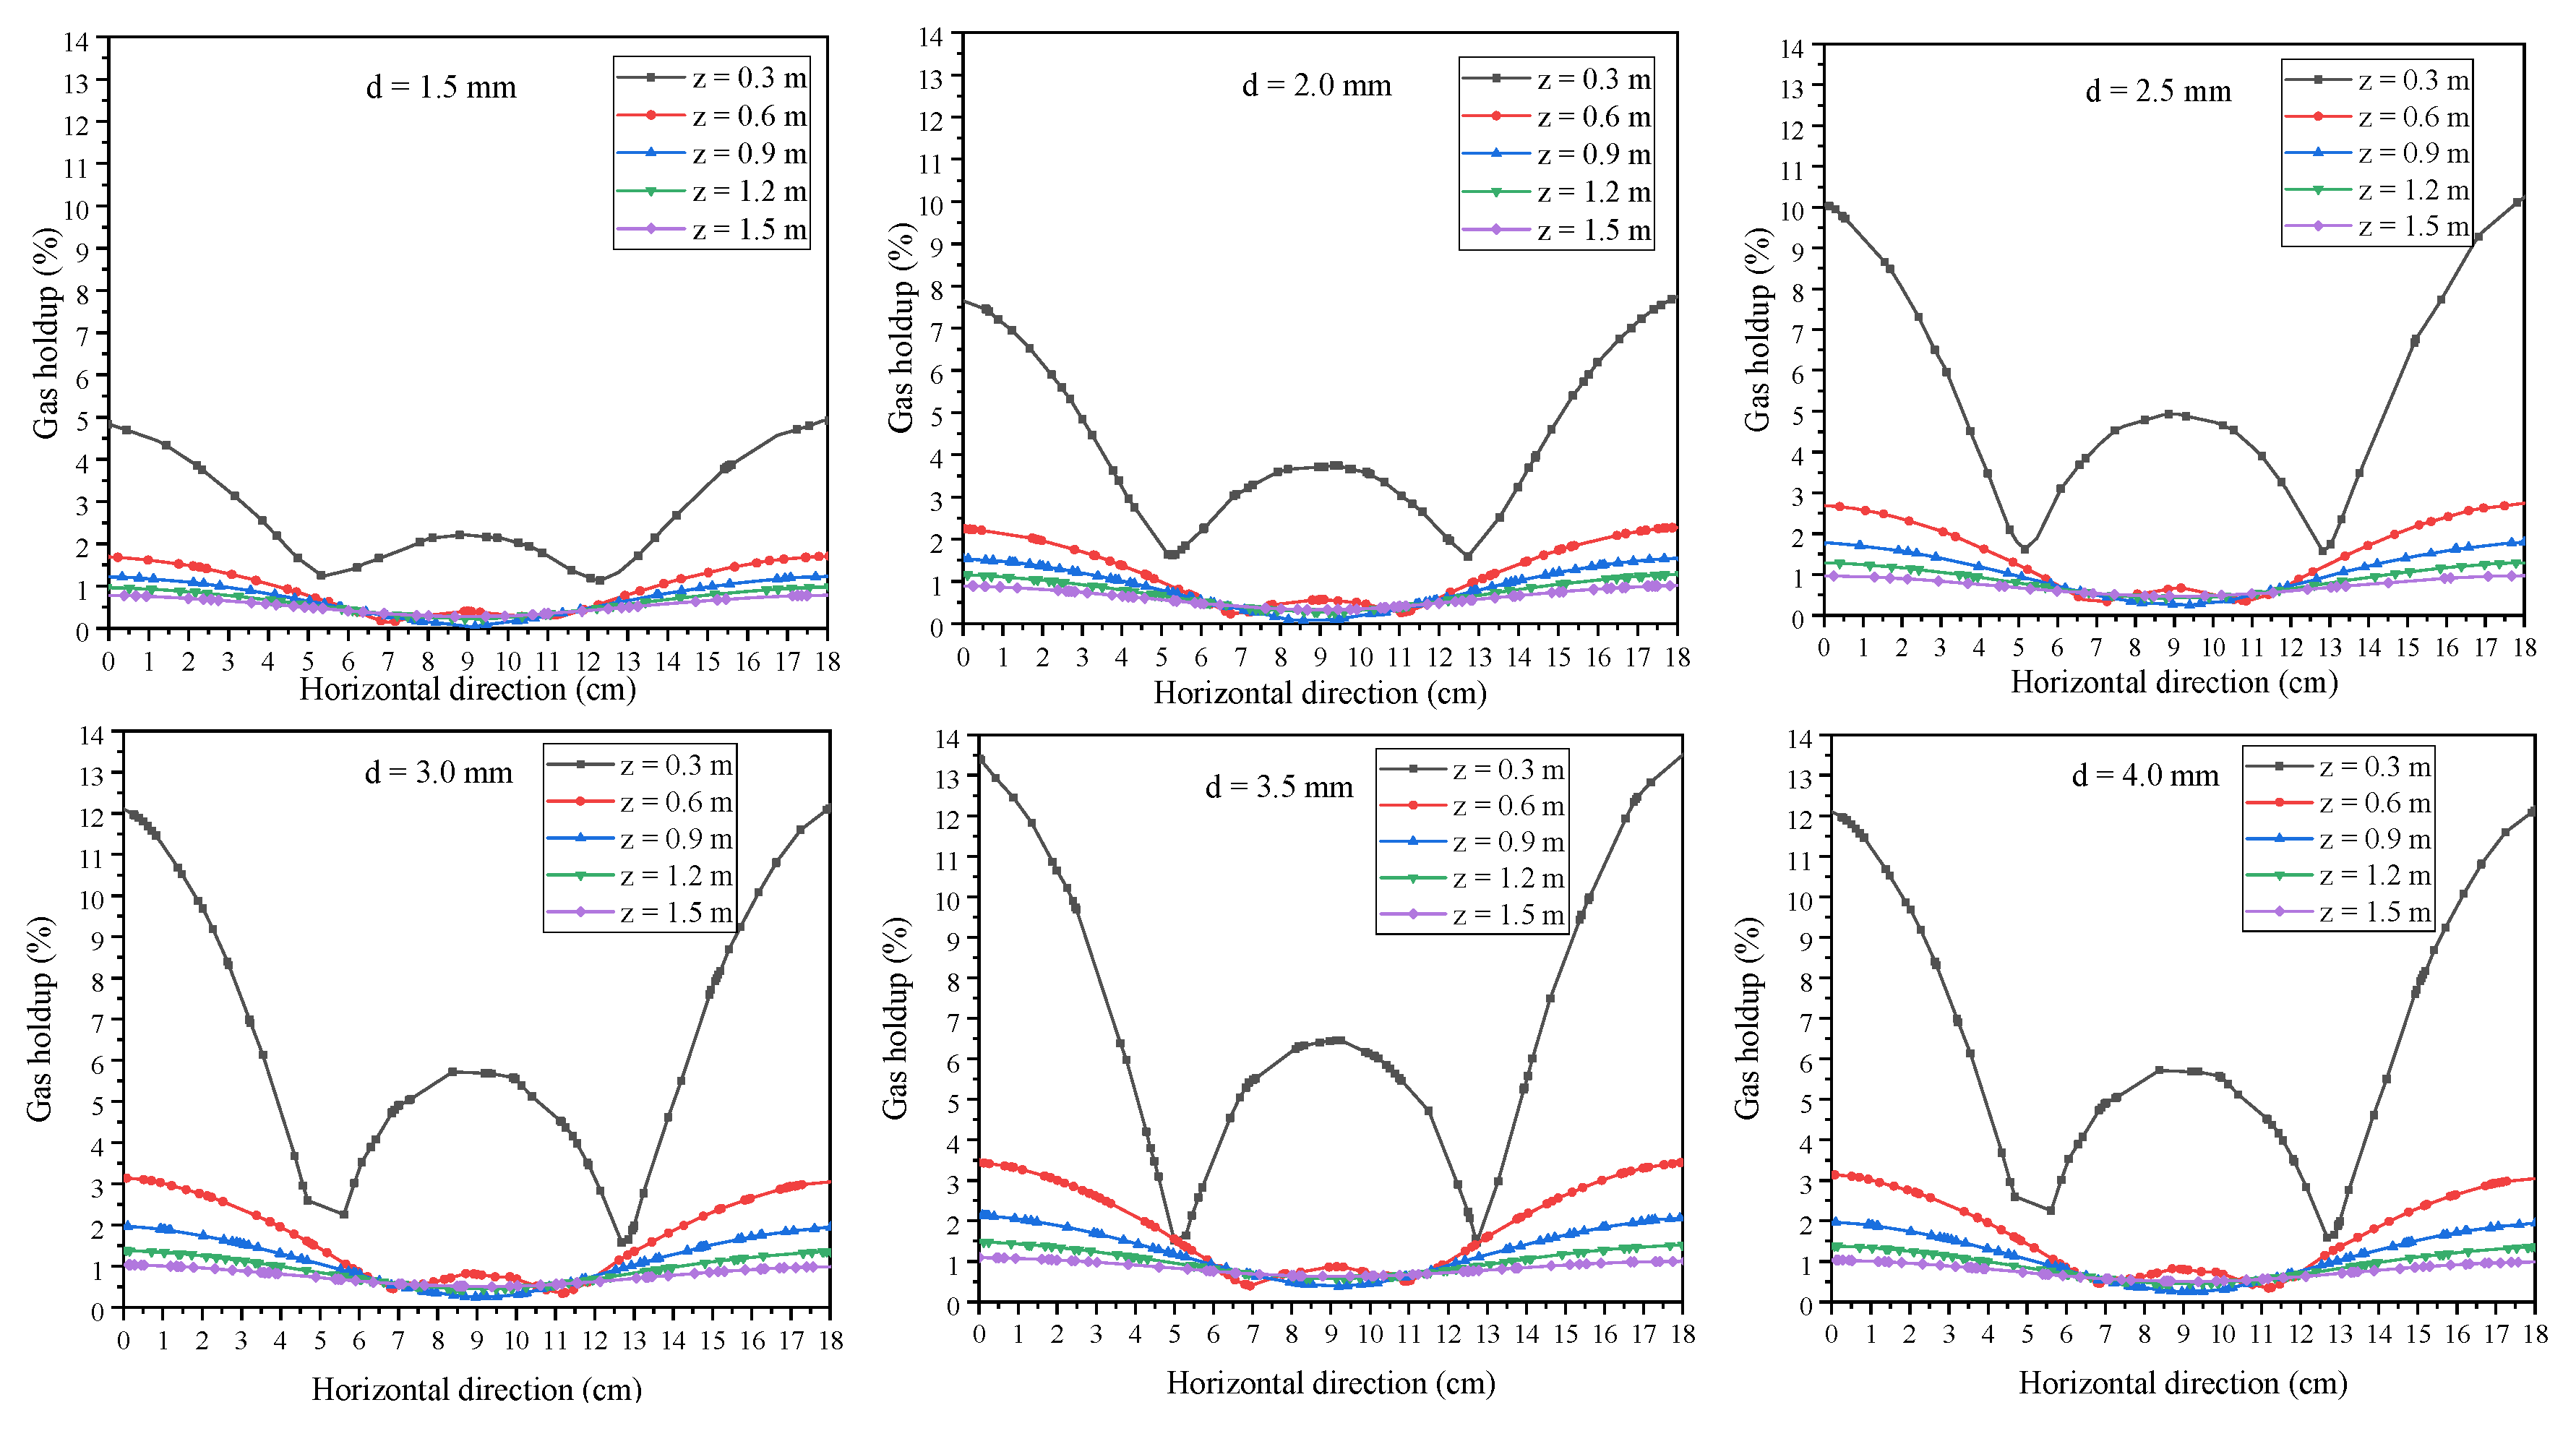
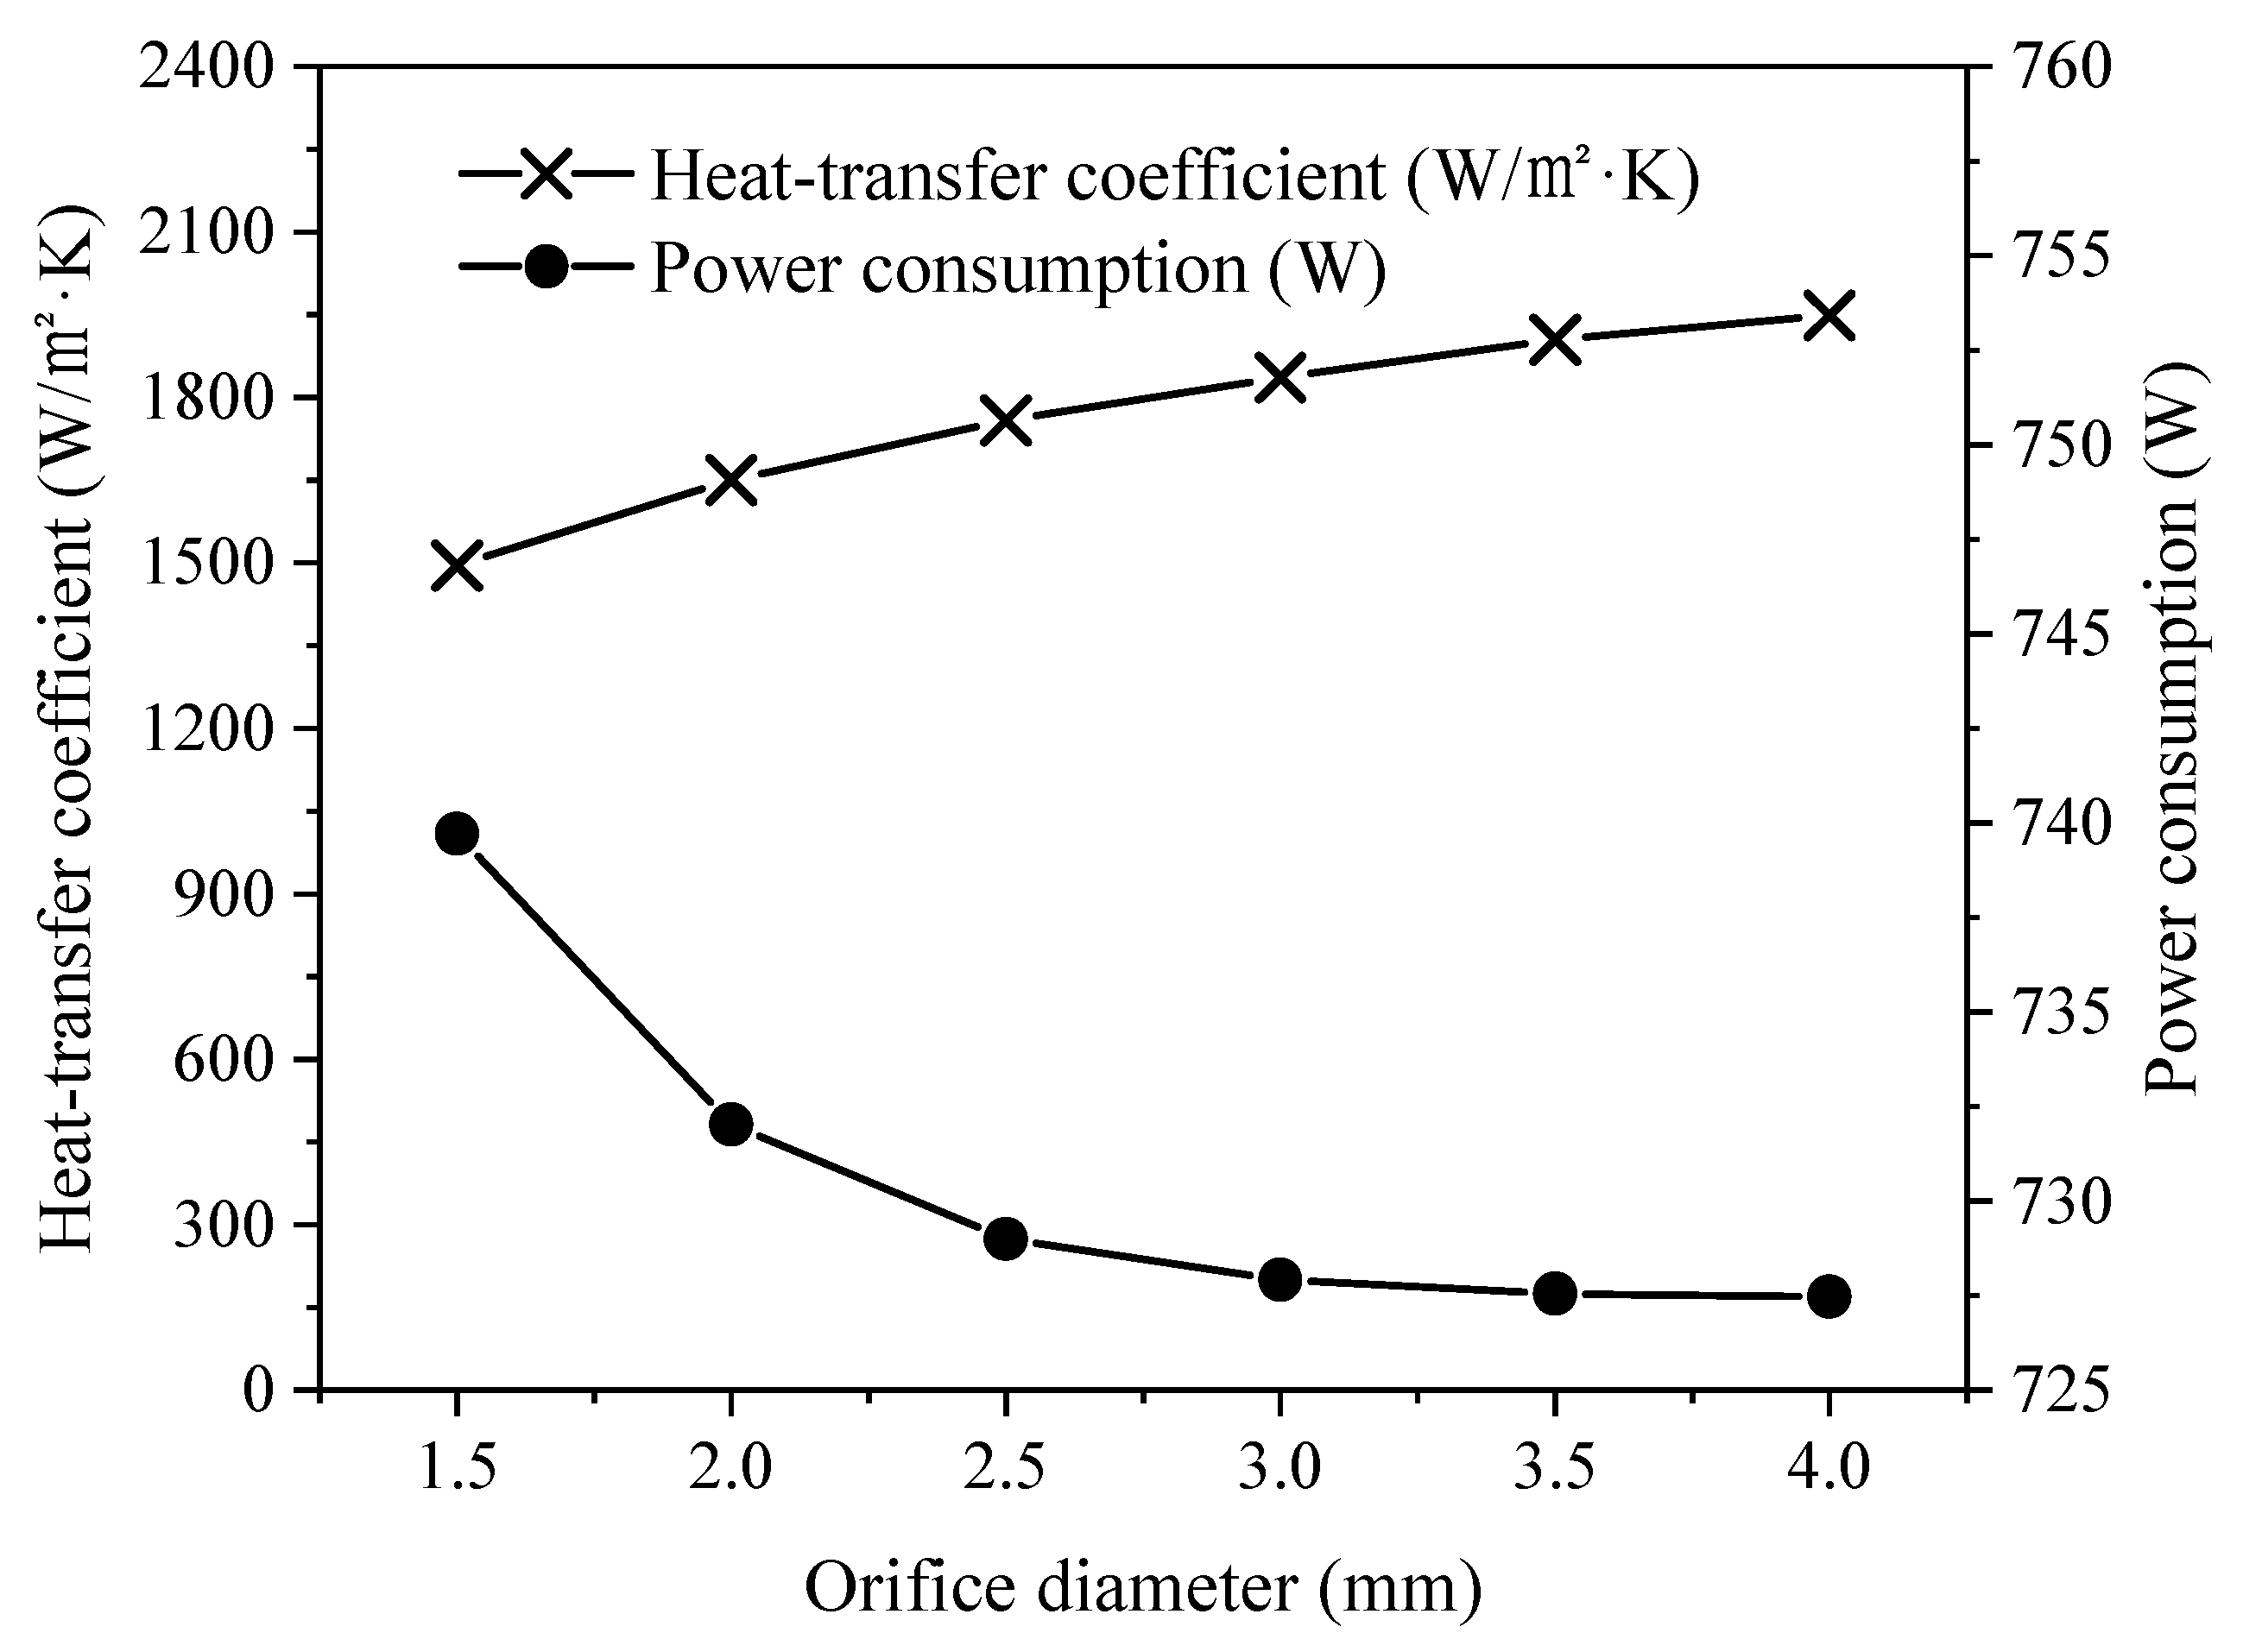
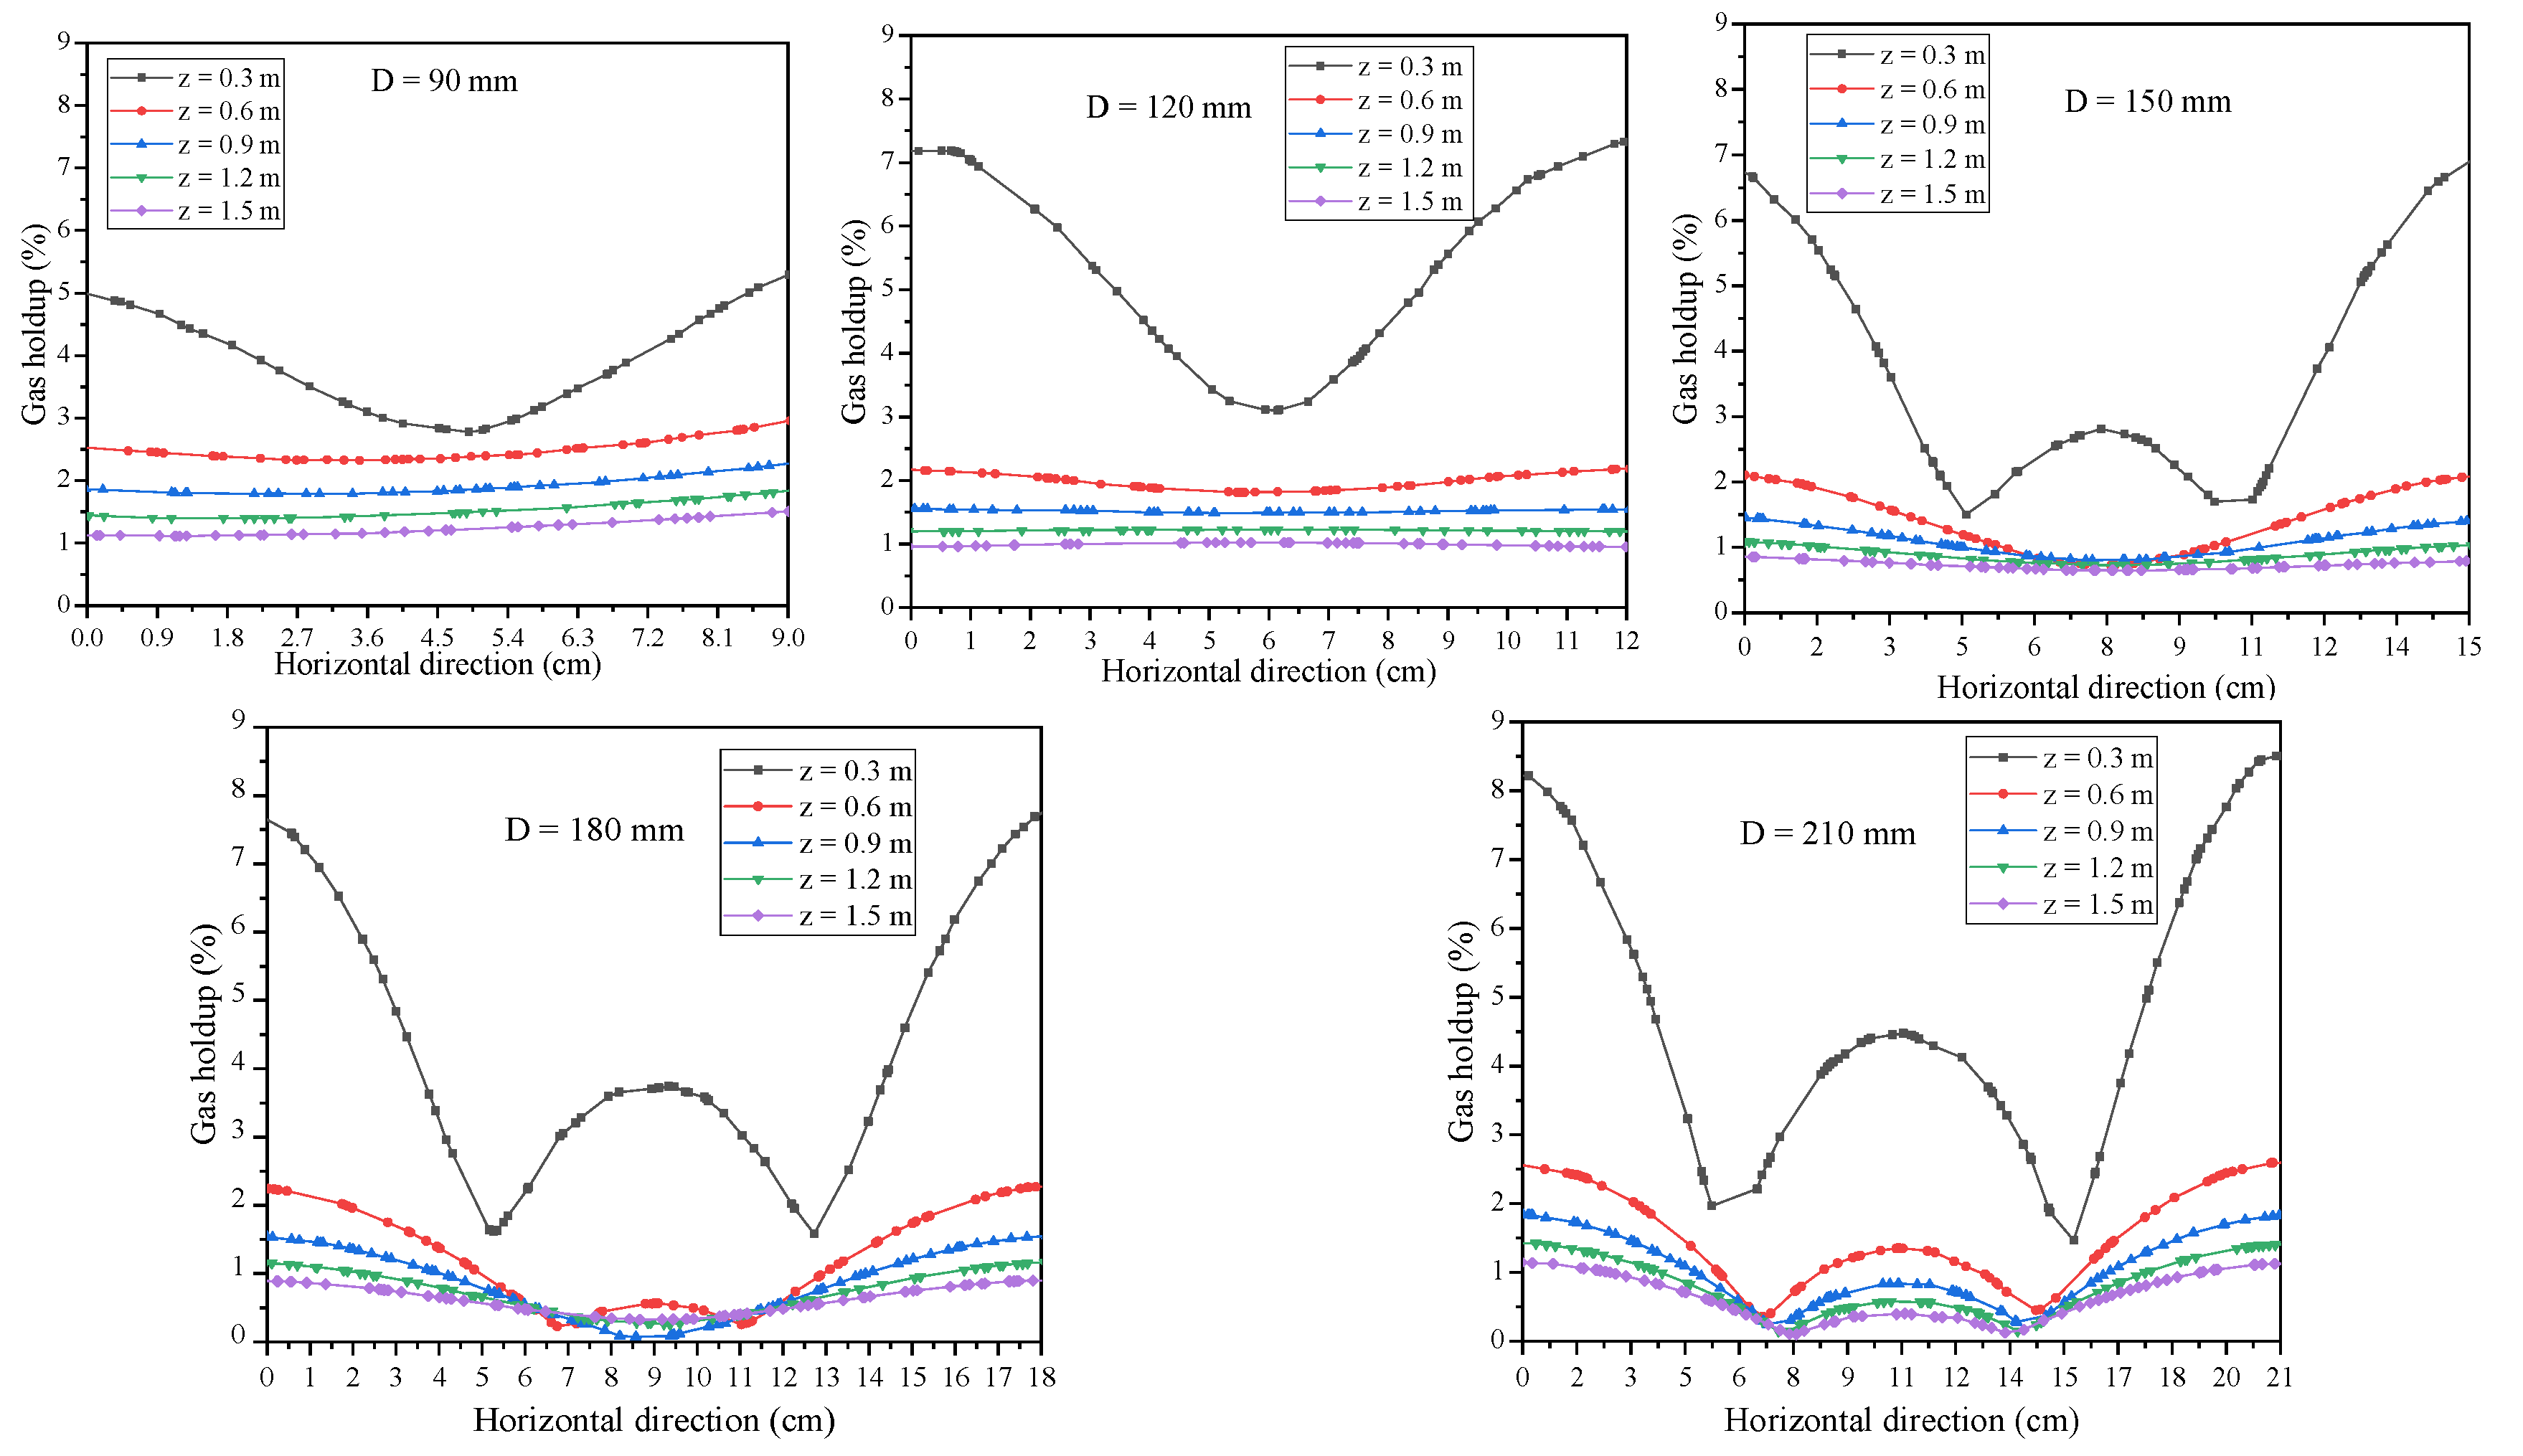
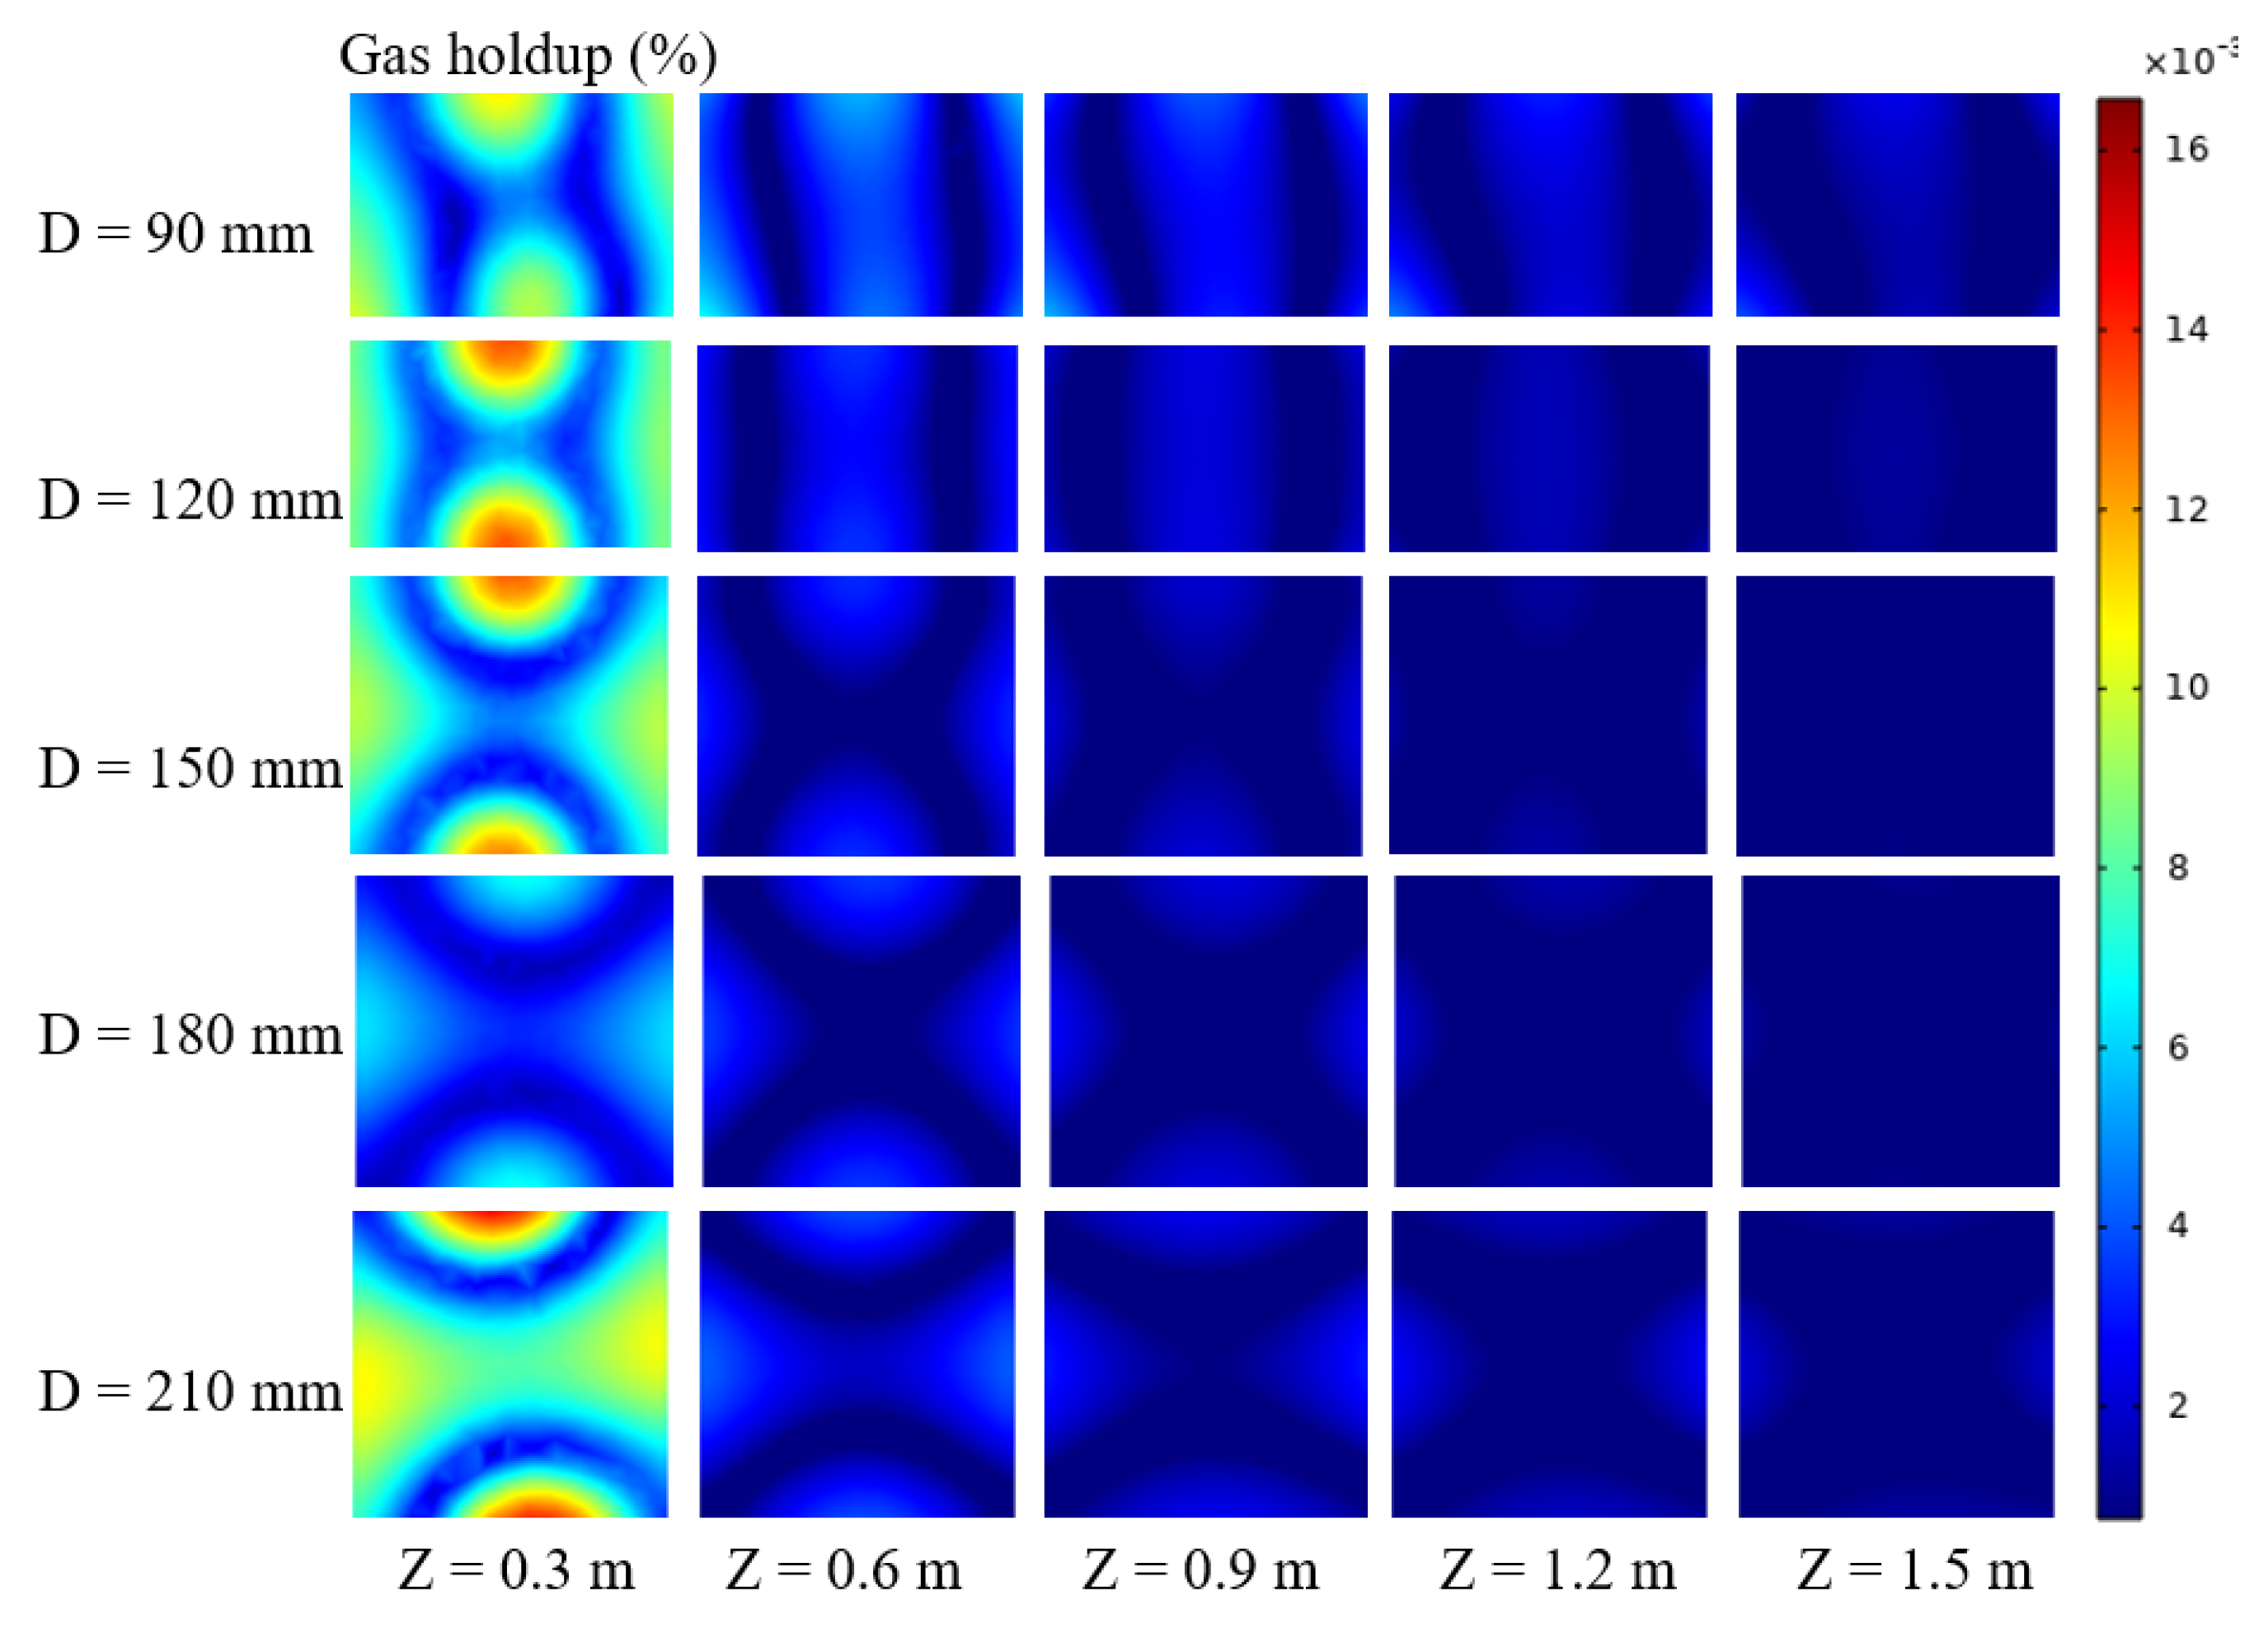
3.3. Influence of the Orifice Diameter on the Gas Holdup Distribution, Heat Transfer, and Power Consumption

Figure 9 and Figure 10 show the gas holdup variation and a cloud map of the variation along the horizontal direction at different orifice diameters, respectively. The gas holdup distribution was consistent with the water velocity variation that increased with an increase in the orifice diameter. The maximum value varied from 5.0% to 13.5%. The gas holdup near the center was lesser than that close to the vent. The gas holdup decreased with an increase in height, and the difference between heights increased with an increase in the orifice diameter. The gas holdup significantly increased the convective heat-transfer coefficient at a low flow rate. The volume flow rate of the gas–liquid mixture increased with the addition of air, which correspondingly resulted in the increase in the velocity of the mixture and the heat transfer. When the orifice diameter was 3–3.5 mm, the gas holdup at the center of the tank was the highest.
Figure 11 shows the heat-transfer coefficient and power consumption change at different orifice diameters. The average heat-transfer coefficient increased with an increase in the orifice diameter, which varied in the range of 1495–1950 W/m2·K. The power consumption of the air compressor decreased with the increase in the orifice diameter, which caused a decrease in throttle loss of gas through the orifice. The power consumption, which was weakened with an increase in size, decreased gradually. When the orifice diameter increased from 1.5 to 4 mm, the power consumption changed to less than 1.62%, which indicates that the effect of the orifice diameter on power consumption was negligible.

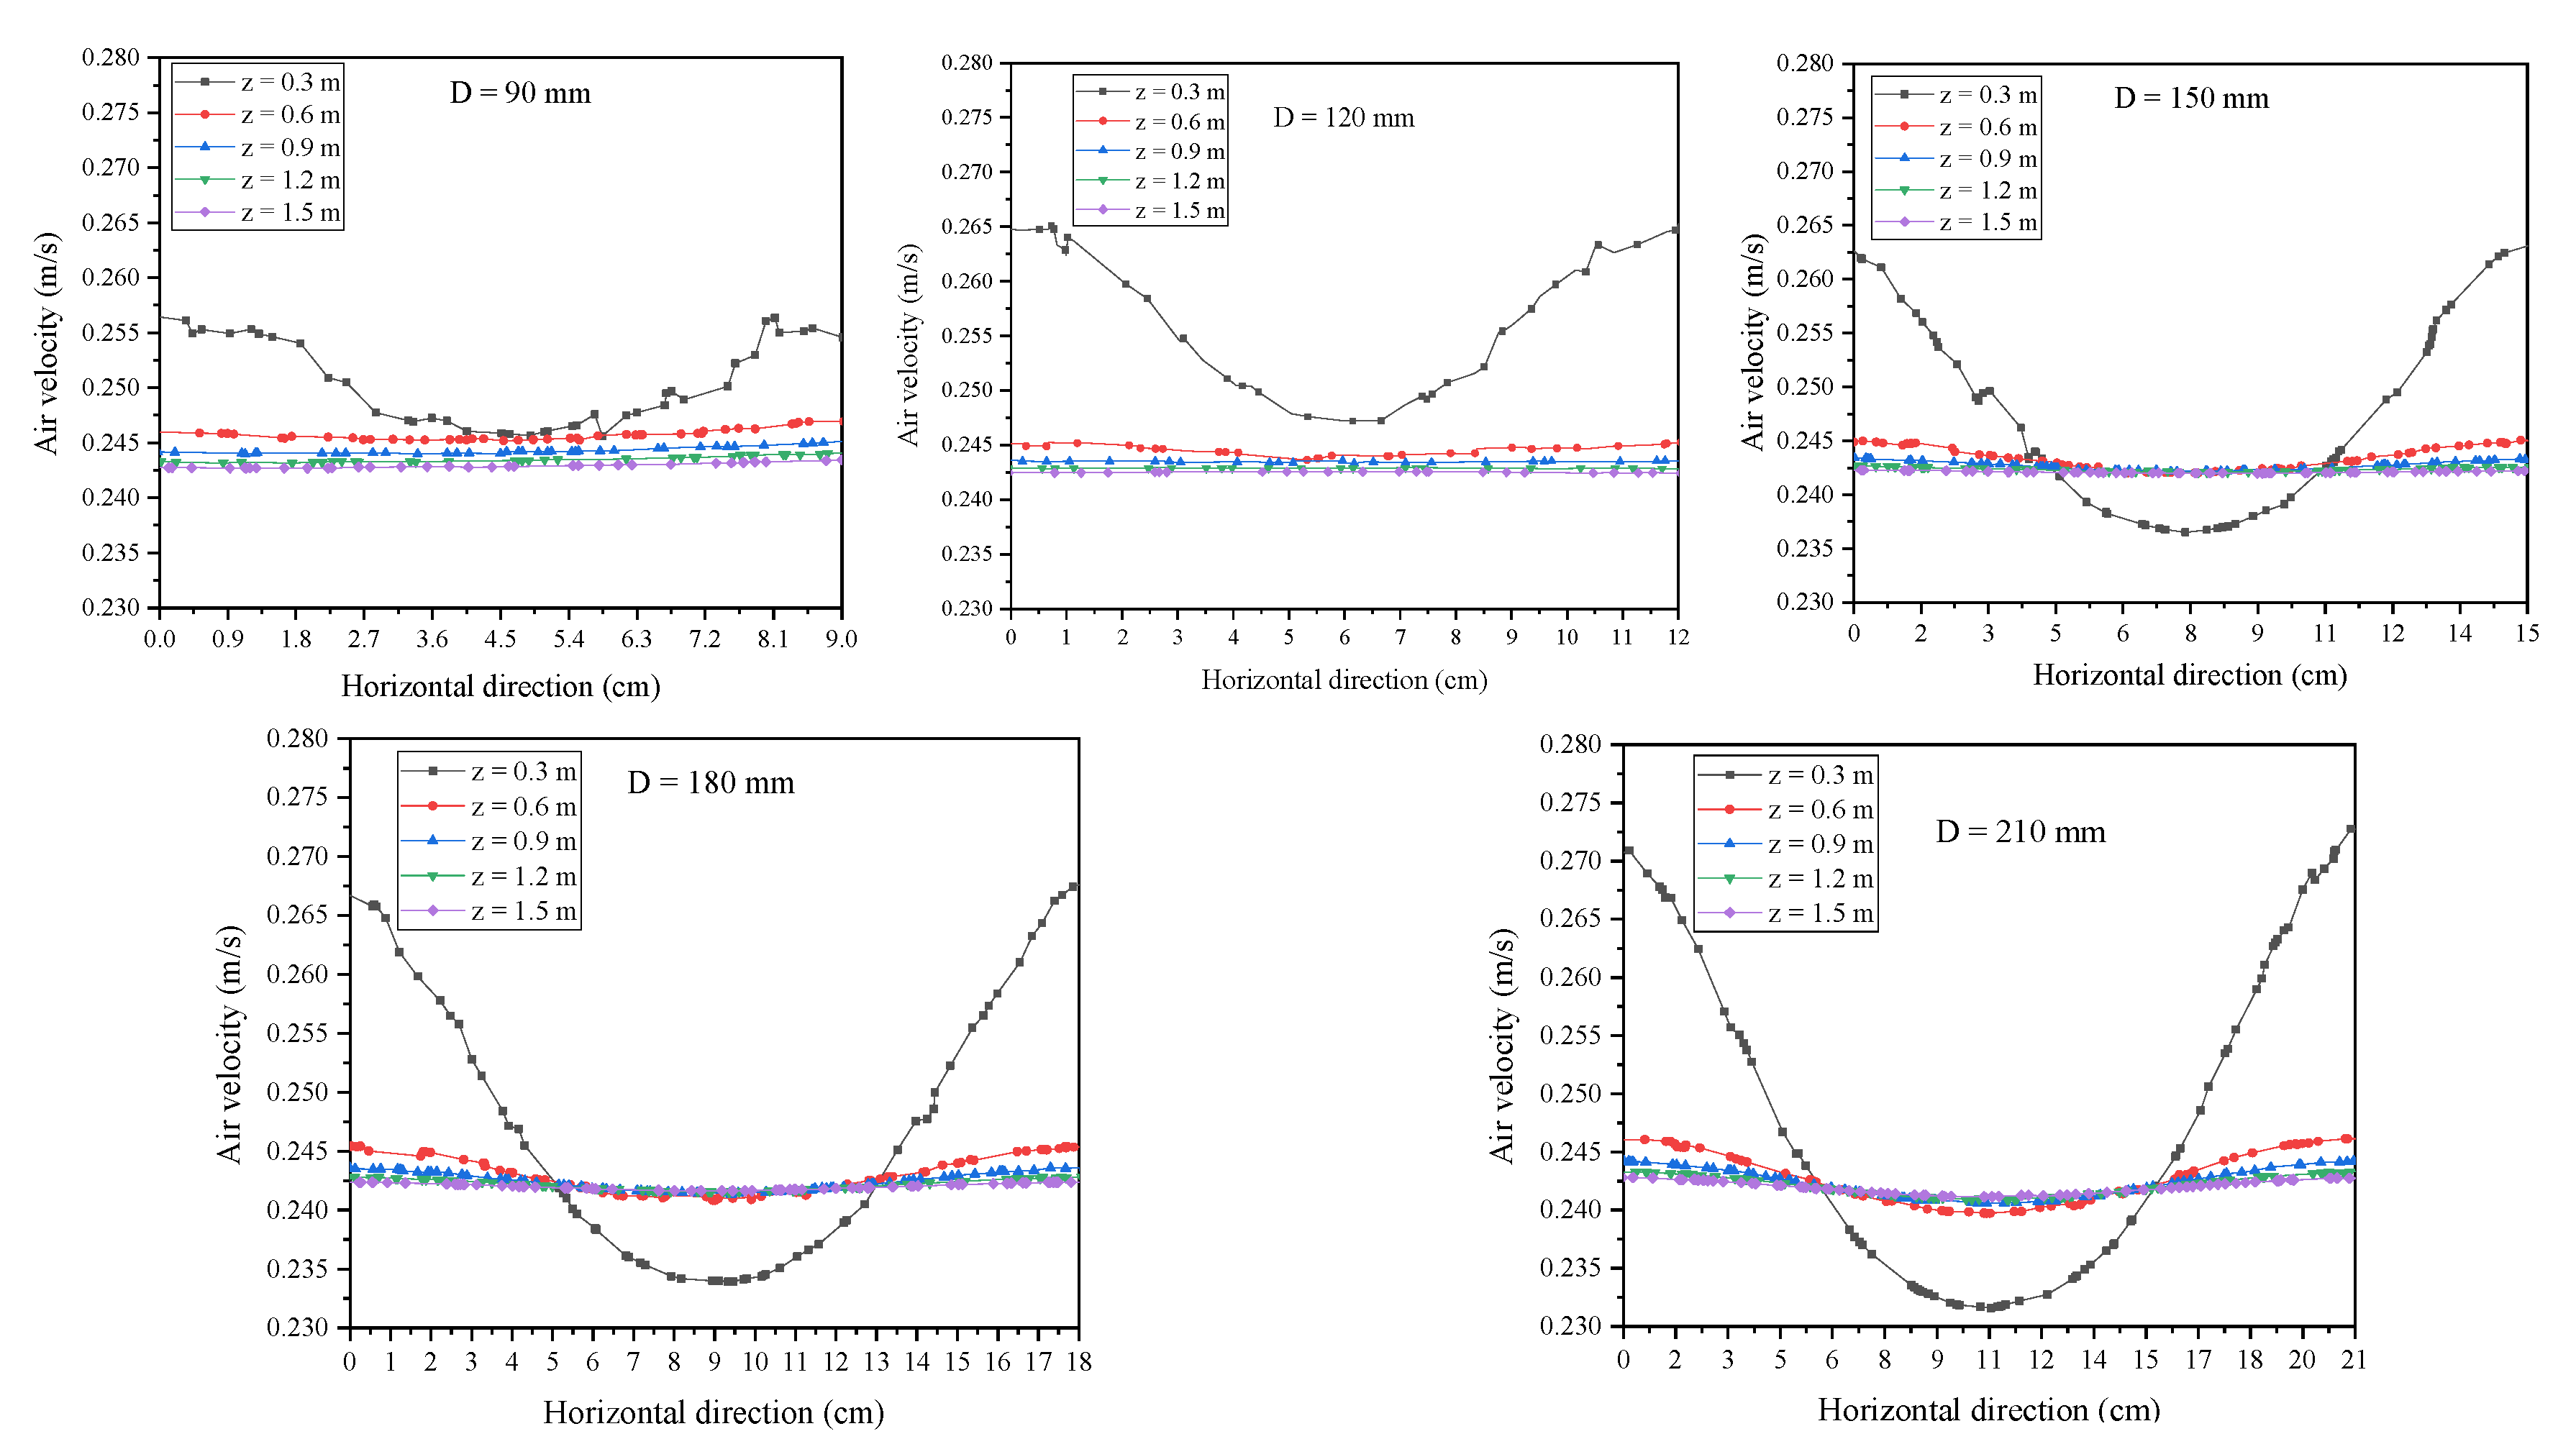
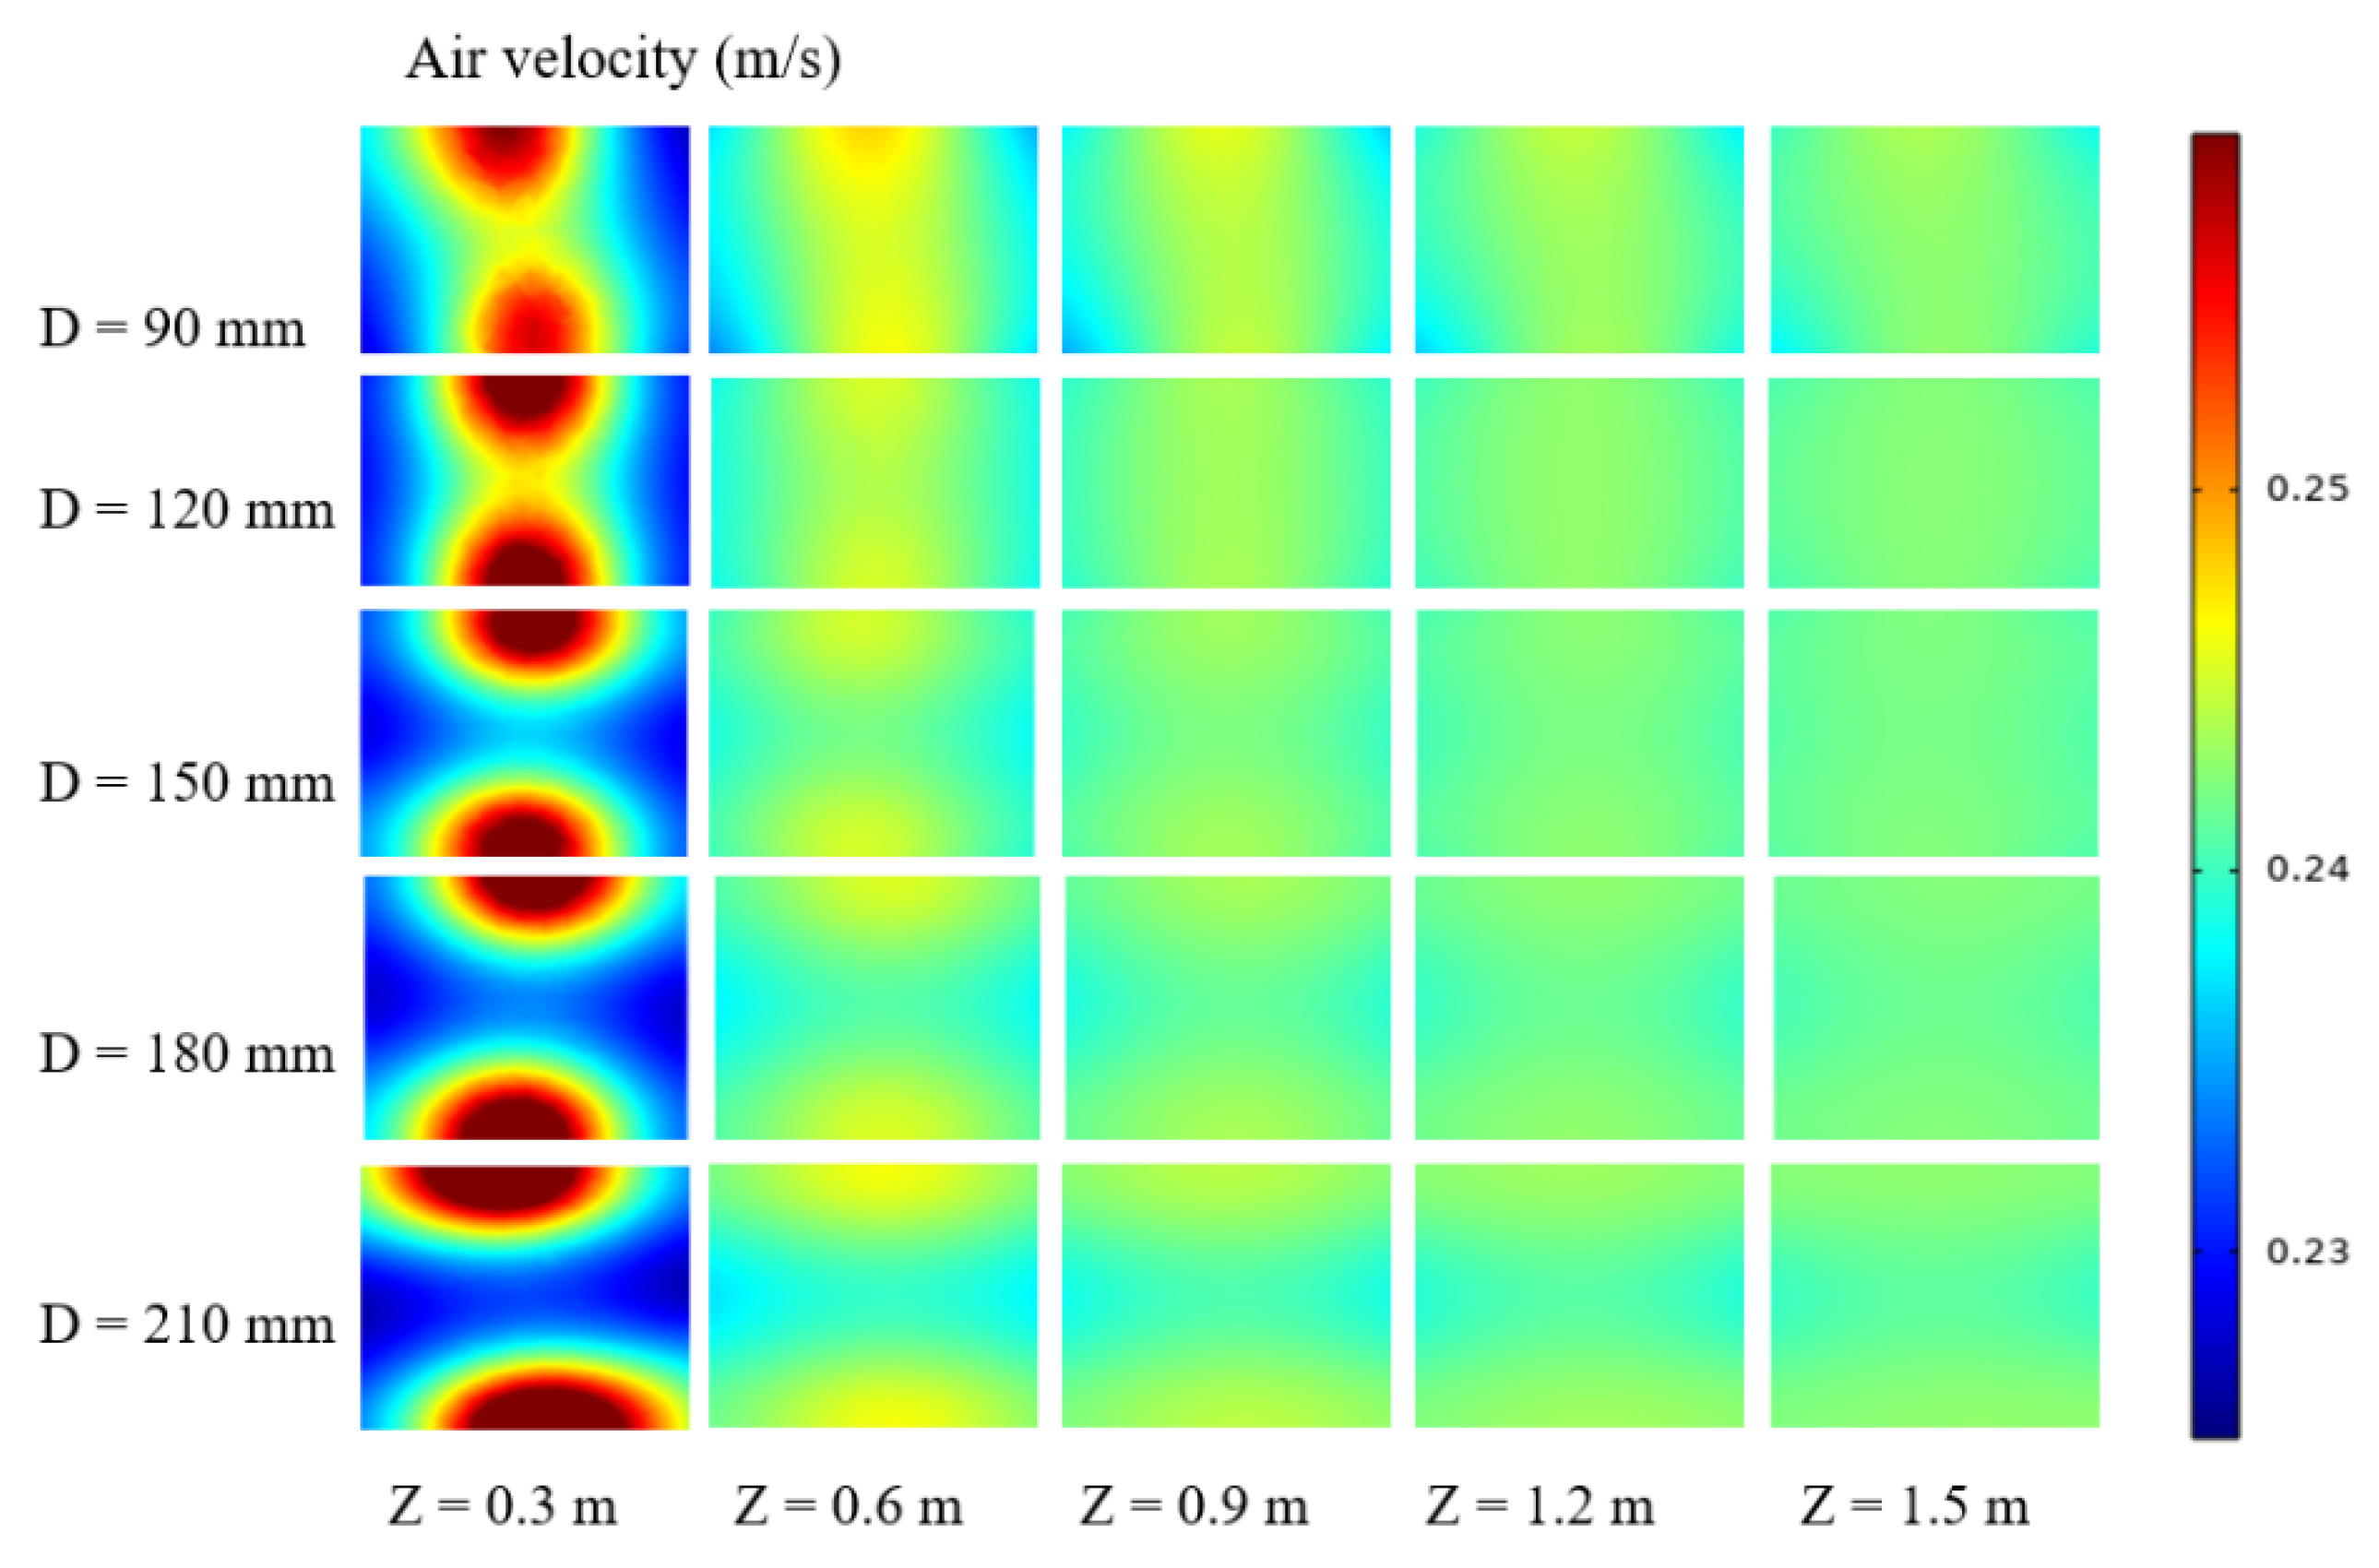
3.4. Influence of the Orifice Spacing on the Air Velocity Distribution

Figure 12 and Figure 13 show the air velocity and a cloud map of the variation along the horizontal direction at different orifice spacings, which varied between 90 and 210 mm, respectively. The air velocities at all levels above 0.6 m were almost the same, which were approximately 0.245 m/s. This showed that the influence of the spacing variation was negligible on heights above 0.6 m and can almost be ignored. The increase in the spacing mainly affected the air velocity below 0.6 m. The air velocity at the vent center was higher than that near the boundary, which presented the symmetry, and the air velocity difference increased with an increase in height. The nonuniform velocity in the horizon reached the maximum at a height of 0.3 m, which varied in the range of 0.257–0.272 m/s. It showed that the orifice spacing had a significant influence on air velocity uniformity at a low water level.

3.5. Influence of the Orifice Spacing on the Water Velocity Variation

Figure 14 and Figure 15 show the water velocity variation and a cloud map of the variation along the horizontal direction at different orifice spacings, respectively. When the orifice spacing was less than 150 mm, the water velocity varied in a “V” shape in the horizontal direction. However, it presented a “W” shape when the orifice spacing was greater than 150 mm. The water velocity decreased with an increase in height. When the spacing was less than 210 mm, the liquid disturbance appeared at a height of >1.5 m, and the nonuniform velocity on the horizon increased with the increase in spacing. The results showed that the spacing between orifices had a significant effect on the water velocity uniformity. Therefore, it is recommended that the spacing between orifices should be less than 210 mm.

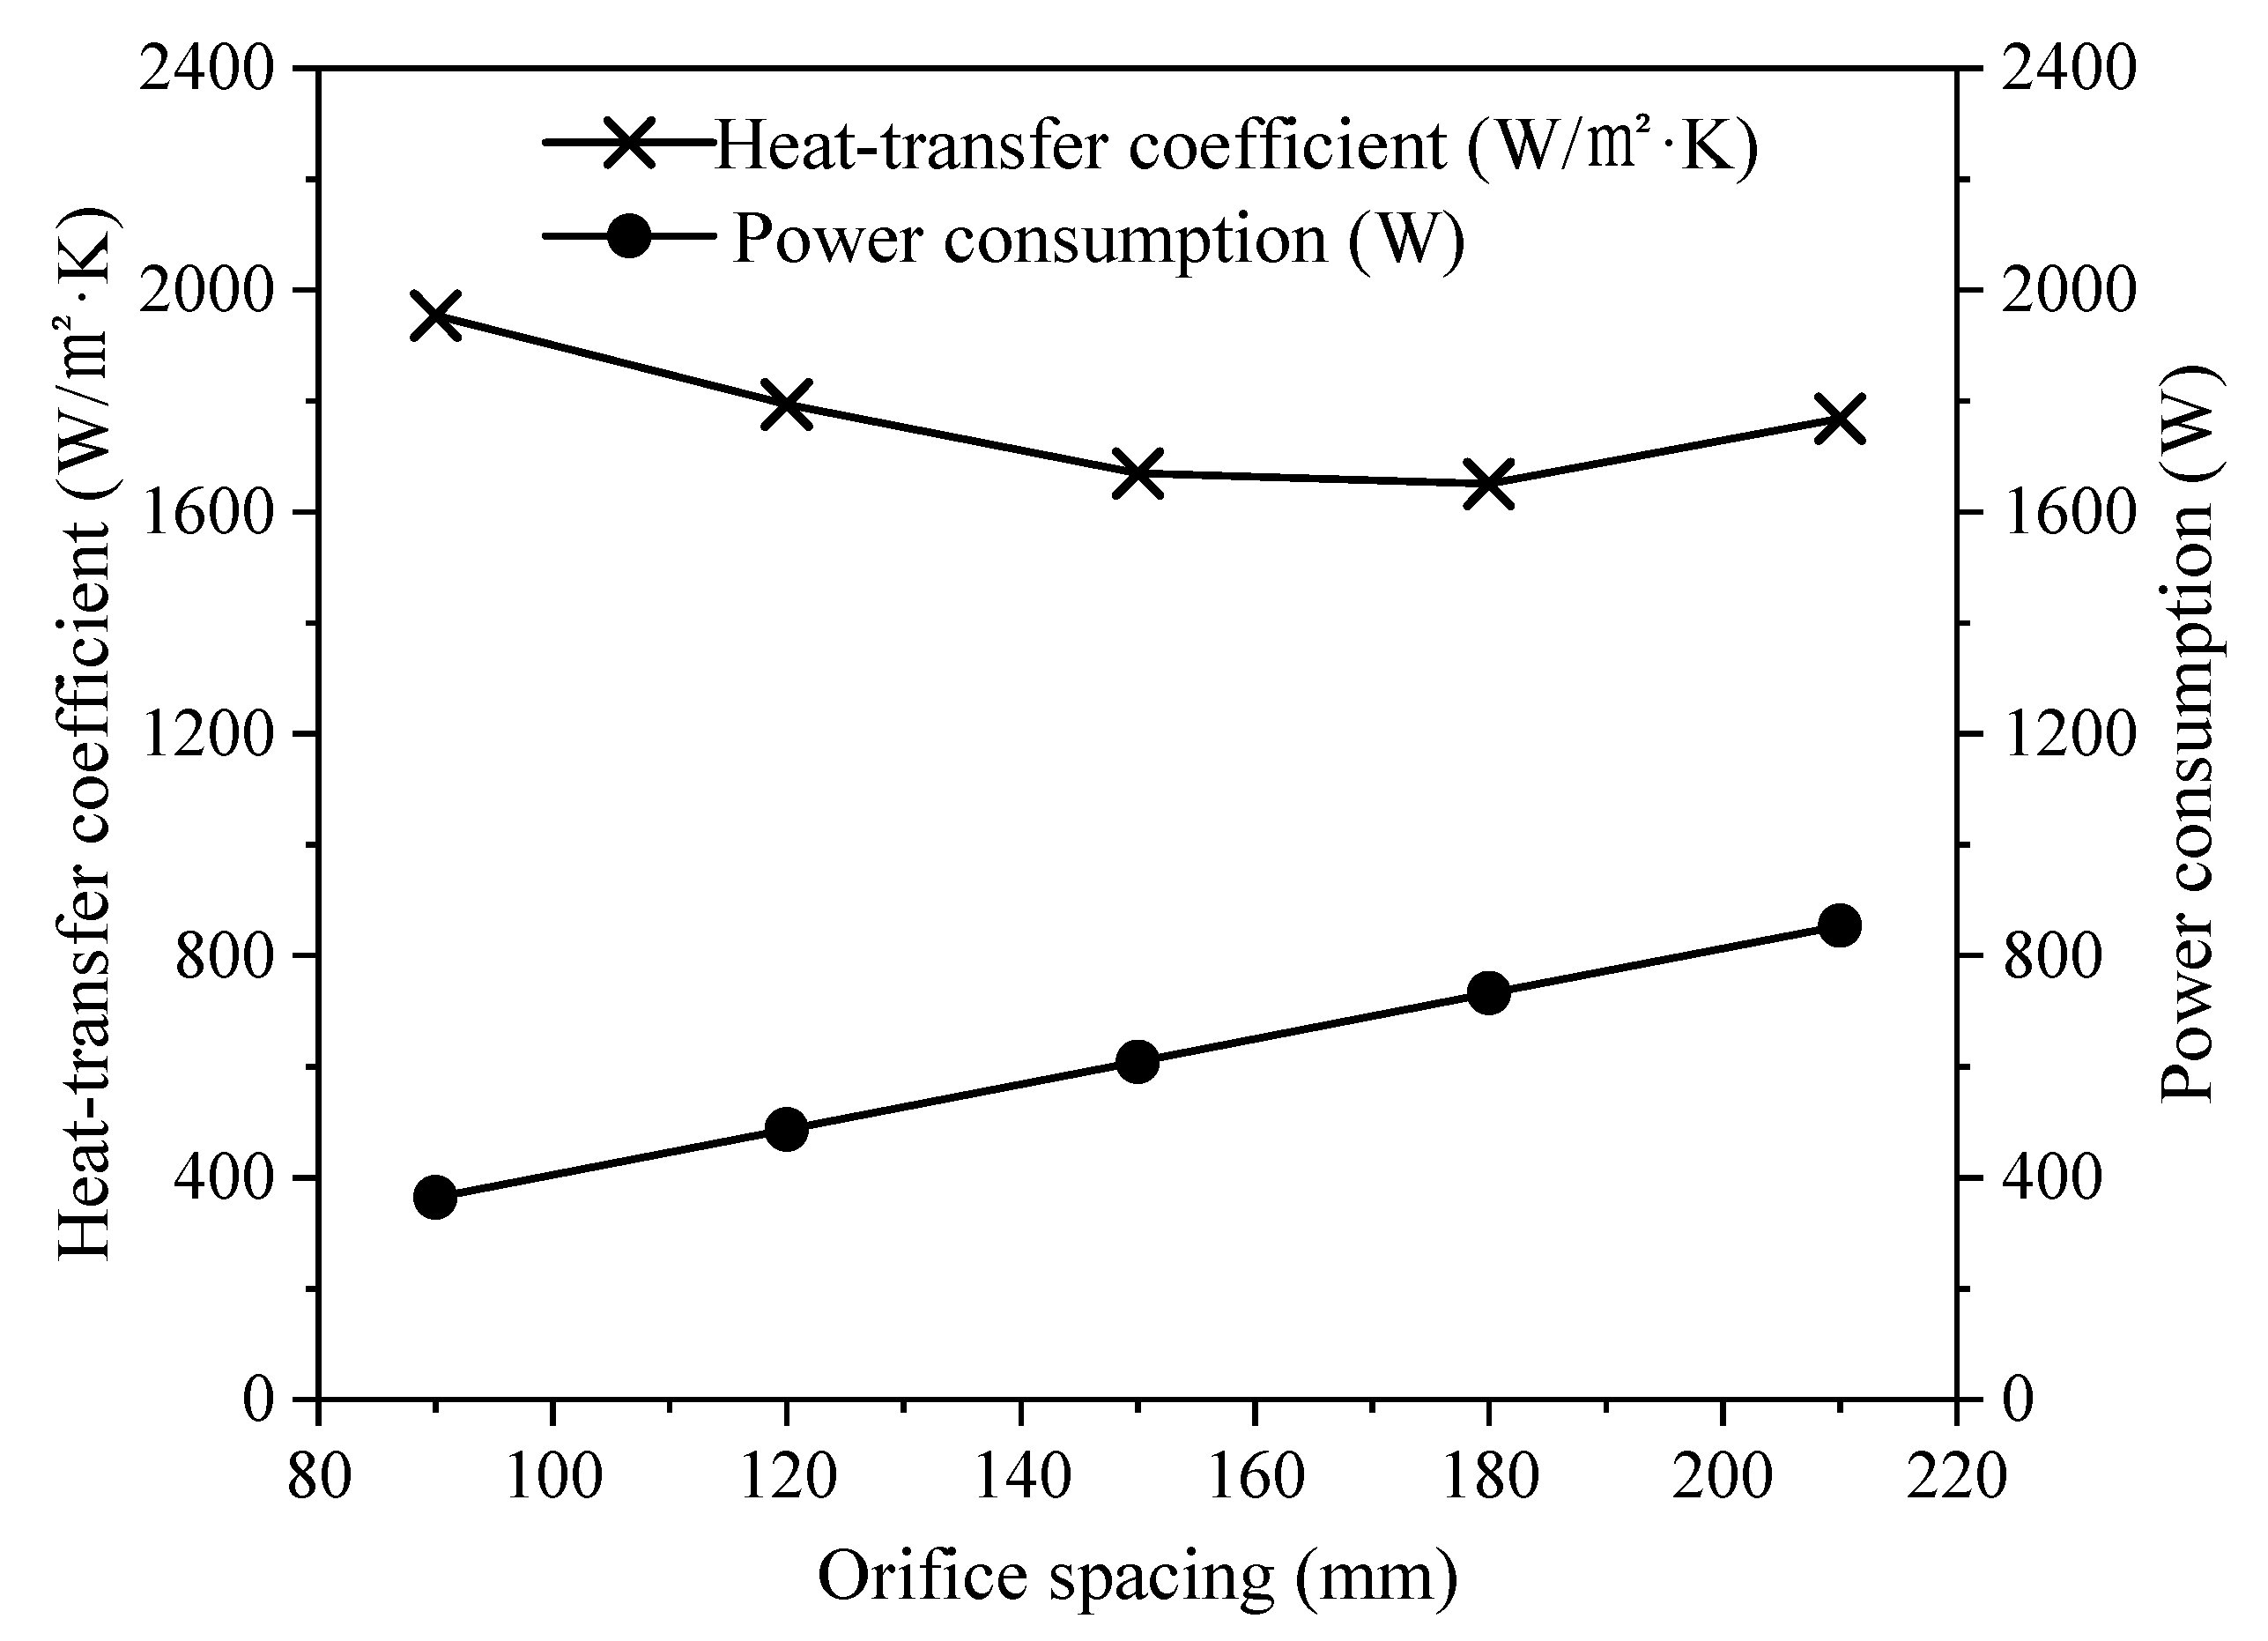
3.6. Influence of the Orifice Spacing on the Gas Holdup, Heat-Transfer Coefficient, and Power Consumption

Figure 16 and Figure 17 show the air holdup variation and a cloud map of the variation along the horizontal direction at different orifice spacings, respectively. Its variation was similar to that of water velocity. The gas holdup increased with the increase in orifice spacing, and the maximum varied from 5.0% to 8.2%. When the orifice spacing was less than 150 mm, the gas holdup changed a little in the horizontal direction, and the uniformity became worse when the orifice spacing was larger than 180 mm. This showed that the influence of the orifice spacing on the gas holdup uniformity was also significant. Therefore, it is recommended that the spacing should not be larger than 180 mm.
Figure 18 shows the heat-transfer coefficient and power consumption change at different orifice spacings. The power consumption was basically proportional to the orifice spacing; when the spacing increased from 90 to 210 mm, the power increased by 1.35 times. When the orifice spacing increased from 90 to 180 mm, the heat-transfer coefficient decreased gradually by 15.5%. Additionally, when the orifice spacing exceeded 180 mm, the convective heat-transfer coefficient tended to rise again. The heat-transfer coefficient roughly changed from 1650 to 1953 W/m2·K, which was enhanced compared with natural convection.

4. Conclusions

During the external ice melting process, the ice storage AC system had an excellent heat-transfer performance that could provide a low water temperature. It has wide application prospects due to the fact of its high efficiency of cold capacity utilization. However, the ice storage rate of the external melting ice storage AC system was still relatively low, which highly requires a reasonable layout design and the optimization of the air agitation device.
This study used numerical simulation technology to estimate the influence of the structure parameters of the air agitation device on the ice storage effect. Air orifice spacing and diameter were considered in the simulation in order to evaluate the gas–liquid flow field distribution in the ice storage tank. The results showed that changes in the structural parameters will have an obvious influence on the air and water velocities, gas holdup, power consumption, and heat-transfer coefficient. The gas holdup maximum value varied from 5.0% to 8.2%. When the orifice spacing was less than 150 mm, the gas holdup changed a little in the horizontal direction, and the uniformity became worse when the orifice spacing was larger than 180 mm. At a height of 0.6 m, the maximum amplitude difference of the gas holdup was four times. A spacing between 150 and 180 mm is recommended. The heat-transfer coefficient in the external melting ice storage tank varied from 1650 to 1953 W/m2·K, which indicates that the heat transfer was enhanced compared with natural convection.
With the increase in the orifice diameter, the average heat-transfer coefficient increased correspondingly and varied between 1495 and 1949 W/m2·K, the largest increase reached 23.3%, which was three to five times that of the natural convection. Additionally, the power consumption decreased with the increase in the orifice diameter, as the throttle loss of air passing through the orifice diameter decreased, and the power consumption decreased by 1.62%. In summary, the orifice diameter is recommended to be approximately 3 mm in order to effectively improve the convective heat transfer in the ice storage tank.

Author Contributions

Conceptualization, X.Y. and Q.W.; methodology, Y.L.; software, Z.L.; validation, X.Y., D.Y. and H.C.; formal analysis, H.C.; investigation, Y.W. and H.Q.; resources, X.Y.; data curation, H.Q. and H.C.; writing original draft preparation, H.Q.; writing review and editing, H.C.; visualization, Q.W.; supervision, X.Y.; project administration, Q.W.; funding acquisition, X.Y. All authors have read and agreed to the published version of the manuscript.

Funding

This research was financially supported by the State Grid Corporation research project (5419-202019385A-0-0-00).

Informed Consent Statement

Not applicable.

Acknowledgments

We would like to thanks the State Grid Corporation research project for its financial support (5419-202019385A-0-0-00).

Conflicts of Interest

There are no conflict of interest to declare.

References

  1. Monsef, H.; Yari, M. Design and analysis of an ice thermal storage system for residential air-conditioning applications. J. Int. J. Exergy 2016, 20, 122–138. [Google Scholar] [CrossRef]
  2. Na, L.; Hong, T.; Hui, L.; Jia, R.; Weng, W. Data analytics and optimization of an ice-based energy storage system for commercial buildings. J. Appl. Energy 2017, 204, 459–475. [Google Scholar] [CrossRef]
  3. Yavorovsky, Y.V.; Sultanguzin, I.A.; Khristenko, B.A.; Kruglikov, D.A.; Chaikin, V.Y. Research and development of ice storage in building energy supply system. J. IOP Conf. Ser. Mater. Sci. Eng. 2021, 1089, 012027. [Google Scholar] [CrossRef]
  4. Ding, Z.; Jiang, Z.; Wang, J.; Wang, D. The heat transfer enhancement of low temperature airflow foam effect in the ice storage charging process. J. Energy Build. 2019, 204, 109447. [Google Scholar] [CrossRef]
  5. Chong, Z.; Luwei, Y.; Wenye, L.; Juan, W.; Jiaxiang, C.; Zhenjun, M. Experimental investigation and life-cycle cost analysis of a cold storage enhanced vacuum cooling system using ice slurry. J. Sustain. Energy Technol. Assess. 2021, 45, 101074. [Google Scholar] [CrossRef]
  6. Ajarostaghi, S.S.M.; Poncet, S.; Sedighi, K.; Delavar, M.A. Numerical Modeling of the Melting Process in a Shell and Coil Tube Ice Storage System for Air-Conditioning Application. J. Appl. Sci. 2019, 9, 2726. [Google Scholar] [CrossRef]
  7. Jian, K.X.; Quan, B.H.; Lei, H. Exergy analysis of large temperature difference series air conditioners in subway stations. J. E3S Web Conf. 2020, 165, 04067. [Google Scholar] [CrossRef]
  8. Kaishing, Y.; Yunsheng, C.; Chiahsing, H.; Minlun, C. Chichuan, Performance of Commercially Open Refrigerated Showcases with and without Ice Storage—A. Case Study. J. Processes 2021, 9, 683. [Google Scholar] [CrossRef]
  9. Bi, Y.; Yu, M.; Wang, H.; Huang, J.; Lyu, T. Experimental investigation of ice melting system with open and closed ice-storage tanks combined internal and external ice melting processes. J. Energy Build. 2019, 194, 12–20. [Google Scholar] [CrossRef]
  10. Bonales, R.S. Thermal conductivity of ice prepared under different conditions. J. Int. J. Food Prop. 2017, 20, 610–619. [Google Scholar] [CrossRef]
  11. Kimura, M.; Urano, S.-I.; Okada, K.; Saeki, T. Study on utilization of cold energy from natural ice—Ice-making efficiency of small ice containers stacked in a cold room. J. Cold Reg. Sci. Technol. 2009, 60, 146–153. [Google Scholar] [CrossRef]
  12. Panchabikesan, K.; Haghighat, F.; Velraj, R. Influence of PCM thermal conductivity and HTF velocity during charging of PCM through the free cooling concept—A parametric study. J. Energy 2019, 21, 48–57. [Google Scholar] [CrossRef]
  13. Zhang, X.J.; Qiu, L.M.; Zhang, P.; Liu, L.; Gan, Z.H. Performance improvement of vertical ice slurry generator by using bubbling device. J. Energy Convers. Manag. 2007, 49, 83–88. [Google Scholar] [CrossRef]
  14. Mokhtari, M.; Chaouki, J. Effect of Solid Loading and Particle Size on the Phase Holdup Distribution and Bubble Behaviour in a Pilot-Scale Slurry Bubble Column. J. Chem. Eng. Sci. 2021, 243, 116732. [Google Scholar] [CrossRef]
  15. Belusko, M.; Sheoran, S.; Bruno, F. Effectiveness of direct contact PCM thermal storage with a gas as the heat transfer fluid. J. Appl. Energy 2015, 137, 748–757. [Google Scholar] [CrossRef]
  16. Ahmadi, M.S.; Argyropoulos, S.A.; Bussmann, M.; Doutre, D. Comparative Studies of Silicon Dissolution in Molten Aluminum Under Different Flow Conditions Part II: Two-Phase Flow. J. Metall. Mater. Trans. 2015, 46, 1290–1301. [Google Scholar] [CrossRef]
  17. Mohamed, M.M. Solidification of phase change material on vertical cylindrical surface in holdup air bubbles. J.-Ternational J. Refrig. 2004, 28, 403–411. [Google Scholar] [CrossRef]
  18. Wu, C.-T.; Tsai, Y.-H. Design of an ice thermal energy storage system for a building of hospitality operation. J. Int. J. Hosp. Manag. 2015, 46, 46–54. [Google Scholar] [CrossRef]
  19. Xu, Y.; Ma, X.; Hassanien, R.H.E.; Luo, X.; Li, G.; Li, M. Performance analysis of static ice refrigeration air conditioning system driven by household distributed photovoltaic energy system. J. Sol. Energy 2017, 158, 147–160. [Google Scholar] [CrossRef]
  20. Arcuri, B.; Spataru, C.; Barrett, M. Evaluation of ice thermal energy storage (ITES) for commercial buildings in cities in Brazil. J. Sustain. Cities Soc. 2017, 29, 178–192. [Google Scholar] [CrossRef]
  21. Rismanchi, B.; Saidur, R.; Masjuki, H.H.; Mahlia, T.M.I. Thermodynamic evaluation of utilizing different ice thermal energy storage systems for cooling application in office buildings in Malaysia. J. Energy Build. 2012, 53, 117–126. [Google Scholar] [CrossRef]
  22. Thorat, B.N.; Joshi, J.B. Regime transition in bubble columns: Experimental and predictions. J. Exp. Therm. Fluid Sci. 2004, 28, 423–4305. [Google Scholar] [CrossRef]
  23. B, H.M.; Marek, K.; Hasan, S. An Overview of Heat Transfer Enhancement Based Upon Nanoparticles Influenced by Induced Magnetic Field with Slip Condition Via Finite Element Strategy. J. Acta Mech. Et Autom. 2022, 16, 200–206. [Google Scholar] [CrossRef]
  24. Bilal, H.M.; Marek, K.; Hasan, S.; Ali, P.A. Mohammad, Simulation of hybridized nanofluids flowing and heat transfer enhancement via 3-D vertical heated plate using finite element technique. J. Sci. Rep. 2022, 12, 11658. [Google Scholar] [CrossRef]
  25. Bilal, H.M.; Marek, K.; Sooppy, N.K.; Wasim, J.; Ali, P.A. A finite element analysis of thermal energy inclination based on ternary hybrid nanoparticles influenced by induced magnetic field. J. Int. Commun. Heat Mass Transf. 2022, 135, 106074. [Google Scholar] [CrossRef]
  26. Hyndman, C.L.; Larachi, F.; Guy, C. Understanding gas-phase hydrodynamics in bubble columns: A convective model based on kinetic theory. Chem. Eng. Sci. 1997, 52, 63–77. [Google Scholar] [CrossRef]
  27. White, F.M. Viscous Fluid Flow, 3rd ed.; McGraw-Hill: New York, NY, USA, 2006. [Google Scholar]
  28. Pfleger, D.; Gomes, S.; Gilbert, N.; Wagner, H.-G. Hydrodynamic simulations of laboratory scale bubble columns fundamental studies of the Eulerian–Eulerian modelling approach. J. Chem. Eng. Sci. 1999, 54, 5091–5099. [Google Scholar] [CrossRef]
  29. Kataoka, I.; Serizawa, A. Basic equations of turbulence in gas-liquid two-phase flow. J. Int. J. Multiph. Flow 1989, 15, 843–855. [Google Scholar] [CrossRef]
  30. Deen, N.G.; Hjertager, B.H.; Solberg, T. Comparison of PIV and LDA Measurement Methods Applied to the Gas-Liquid Flow in a Bubble Column. In Proceedings of the 10th International Symposion on Application of Laser Techniques to Fluid Mechanics, Lisbon, Portugal, 10–13 July 2000. [Google Scholar]
  31. Kailiang, T. CFD Simulation of Gas-Liquid Flow and Mass Transfer Process in Bubble Column Reactor. Ph.D. Thesis, Beijing University of Chemical Technology, Beijing, China, 2020. [Google Scholar] [CrossRef]
Figure 1. Schematic diagram of the simulation unit for modeling.
Energies 15 05918 g001
Figure 2. Local refined mesh of the two orifices.
Energies 15 05918 g002
Figure 3. Simulated unit geometric and grid model for verification.
Energies 15 05918 g003
Figure 4. Comparison of the results of the different models and experimental data.
Energies 15 05918 g004
Figure 5. Air velocity variations along the horizontal direction at different orifice diameters.
Energies 15 05918 g005aEnergies 15 05918 g005b
Figure 6. Cloud map of air velocity variations along the horizontal direction at different orifice diameters.
Energies 15 05918 g006
Figure 7. Water velocity variation along the horizontal direction at different orifice diameters.
Energies 15 05918 g007aEnergies 15 05918 g007b
Figure 8. Cloud map of the water velocity variation along the horizontal direction at different orifice diameters.
Energies 15 05918 g008
Figure 9. Gas holdup variation along the horizontal direction at different orifice diameters.
Energies 15 05918 g009
Figure 10. Cloud map of the gas holdup along the horizontal direction at different orifice diameters.
Energies 15 05918 g010
Figure 11. Heat-transfer coefficient and power consumption changes at different orifice diameters.
Energies 15 05918 g011
Figure 12. Air velocity variation along the horizontal direction at different orifice spacings.
Energies 15 05918 g012
Figure 13. Cloud map of the air velocity variation along the horizontal direction at different orifice spacings.
Energies 15 05918 g013
Figure 14. Water velocity variation along the horizontal direction at different orifice spacings.
Energies 15 05918 g014
Figure 15. Cloud map of the water velocity variation along the horizontal direction at different orifice spacings.
Energies 15 05918 g015
Figure 16. Gas holdup variation along the horizontal direction at different orifice spacings.
Energies 15 05918 g016
Figure 17. Cloud map of the gas holdup variation along the horizontal direction at different orifice spacings.
Energies 15 05918 g017
Figure 18. Heat transfer coefficient and power consumption changes at different orifice spacings.
Energies 15 05918 g018
Table 1. Computed domain cell statistics.
Number of elements1.205 × 106
Grid volume0.1296
Cell volume ratio2.023 × 10−5
Minimal grid unit quality>0.1
Mean cell mass0.71
Publisher’s Note: MDPI stays neutral with regard to jurisdictional claims in published maps and institutional affiliations.

