Article

Experimental Study on the Transient Disturbance Characteristics and Influence Factors of Pantograph–Catenary Discharge

1
Hebei Key Laboratory for Electromagnetic Environmental Effects and Information Processing, Shijiazhuang Tiedao University, Shijiazhuang 050003, China
2
China Railway Signal & Communication Research & Design Institute Group Co., Ltd., Beijing 100070, China
3
National Key Laboratory on Electromagnetic Environment Effects, Army Engineering University of PLA, Shijiazhuang 050043, China
*
Authors to whom correspondence should be addressed.
Energies 2022, 15(16), 5959; https://doi.org/10.3390/en15165959
Submission received: 26 July 2022 / Revised: 12 August 2022 / Accepted: 15 August 2022 / Published: 17 August 2022
(This article belongs to the Special Issue Electromagnetic Compatibility and Power Electronics in Power Systems)

Abstract

:
The transient electromagnetic disturbance generated by arcing discharge between the pantograph and catenary can pose a significant risk to the safe operation of electrified railways. In order to better comprehend its properties, a pantograph–catenary discharge generating device is designed to simulate the discharge phenomenon with moving electrodes in this experimental investigation. The effects of the applied voltage, the gap distance, and the relative motion between the pantograph and catenary on the time- and frequency-domain features of the discharge current and electromagnetic field are investigated. The variation trends of pulse peak current, rise time, pulse repetition frequency, maximum amplitude, and characteristic frequency in the radiation spectrum are retrieved under varying experimental settings, and the effect mechanisms are derived from the physics of gas discharge. A dynamic discharge test is conducted in this study in order to further understand the effect of electrodes’ relative motion on discharge characteristics. The results indicate that lateral sliding motion of the pantograph along the track has a negligible effect on the transient discharge, whereas a faster vertical approaching motion between the pantograph and catenary generates a larger pulse current peak, a steeper rise front-edge, and a higher radiation intensity.

1. Introduction

The pantograph–catenary (PC) system is crucial for the transmission of electricity from overhead contact systems to locomotives in electrified railways [1,2]. The electric current is collected for propulsion via a sliding contact between the contact strip of the pantograph (i.e., a sliding current collector on the train roof) and the catenary wire (i.e., a fixed overhead contact line supplying high voltage). It should be confirmed to avoid detachment between PC electrodes in order to guarantee a continuous and stable power supply [3,4]. In actual operations, however, the contact strip on a pantograph and the catenary wire may separate over short periods due to the mechanical vibrations of the pantograph [5], defects on contact surfaces [6], and inconsistencies in contact [7], which breaks the contact state of the carbon-copper electrode of PC system frequently [8]. At the instant PC separation happens, an electrical arcing discharge emanates from the establishment of a conducting path due to the high voltage breakdown crossing the short air gap.
Pantograph–catenary discharge (PCD) generates transient and intermittent electromagnetic disturbances (EMD) both conducted in power lines and radiated into space, affecting the quality of energy transmission and the service performance of signaling and communication in electrified railways [9]. The increased traction power and more frequent PC contact interruptions in high-speed railways would undoubtedly result in more substantial electromagnetic interference (EMI), making the transient PCD a severe danger to the electromagnetic environment safety of railways [10,11]. The sharp transients generated by PCD frequently interfere with both onboard and trackside equipment that has passed EMI testing prior to delivery, resulting in performance degradation during service.
The pantograph arcing is a highly complex process that involves physics, such as mass and heat transport, EM emission, plasma evolution, and others, and as expected, the discharge phenomenon has a strong relationship to the PC wear condition, train speed, load impedance, air pressure, and airflow [12,13]. From the perspective of the causes of EMI, the arcing discharge between PCs serves not just as a standalone transient pulse in the traction circuit but also as a broadband excitation to the EM environment of the entire railway [14]. Specifically, the fast transient current due to pantograph arcing discharge induces energy radiation into space through the “equivalent antenna” composed of the PC structure and transmission lines, couple into nearby cables and disturb devices operating in the same frequency band, as well as simultaneously trigger other conducted disturbances on the power traction system, such as resonance, stray-current, and overvoltage, thereby causing transient disturbances (in the GHz range) on the radio-based communication services and signaling systems, such as GSM-R, DVB-T, and Balise transmission module (BTM) [15,16,17].
Relevant studies on PC arcing, aimed at scrutinizing the time- and frequency-domain characteristics, have been mainly carried out through on-site measurement campaigns [18,19,20,21] and laboratory experiments [22,23,24,25]. The experiments in Refs. [26,27] have demonstrated that the EM radiation emitted by the arc itself is negligible, whereas that induced by the transient discharge current in the extended circuit is significantly greater, which is of great assistance in explaining the mechanism of the EM emission of PCD. However, there are still some deficiencies in the study of the transient characteristics of EMD generated by PC arcing in response to a change in generating conditions. On-site measurement campaigns make it difficult to carry out the mechanism analyses of EMD generated by PCD under variable conditions, and static pantograph discharge tests in the laboratory make it impossible to determine how the relative motion between the pantograph and the catenary wire affects the EM characteristics of the discharge. In fact, the characteristics of the transient current and EM radiation generated by PC arcing are closely related to the movement of the pantograph, the gap spacing between electrodes and the applied voltage. Nevertheless, it is evident that further study is needed on how the EM properties change during the arcing discharge under these circumstances. In particular, it is currently unknown how driving speed affects electromagnetic radiation. Moreover, it is currently also unknown how driving speed affects transient properties of PCD.
On the other hand, an electric arcing usually occurs due to gas breakdown in electrical devices, such as circuit-breakers (CB) [28] and gas-insulated switchgear (GIS) [29]. However, the pantograph arcing, in contrast to these discharges, has distinct electric and electromagnetic properties because it is closely related to PC interaction. In fact, the arc events can be divided into two types: the drawn arc caused by PC separation and the approaching discharge caused by PC reattachment. The relevant studies have mainly focused on the drawn arc with an emphasis on mechanisms of arc root motion and arc column drift [7,12,30], yet the transient disturbances caused by the approaching discharge have seldom been investigated. By the contrast made by ref. [22], both conducted and radiated EMI generated by the PC approaching transient is much larger than that associated with the PC separation transient which produces comparatively negligible effects.
During a single PC separation event, the electrical channel will be severed after the separation of the PC, and the re-approaching movement of the electrodes with high voltage will result in an air breakdown discharge. It is the physics of electric discharges occurring in the conductive ionizing gas that results in the rapid transient associated with the circuit switch-on event. In contrast, there is no fast transient during PC separating because the drawn arc maintains the continuity of the circuit, and thus no significant current variation occurs. From the perspective of the EM emission, the intensity of radiation field produced by the transient discharge current is proportional to the current derivative dIarc/dt. Therefore, it is easier to generate transient disturbances by the approaching discharge than by the drawn arc caused by PC separation; however, there is still a study gap on the PCD transient features, and the effect mechanisms of various conditions have not been investigated.
In this study, a laboratory experimental setup was employed to create the pulse current and EM radiation generated by pantograph arcing under varying conditions. Time-domain measurements were conducted to examine the influence of parameters, such as the relative motion of the electrode, applied voltage, and gap spacing on the PC transient disturbance characteristics. Based on the experimental data, empirical formulae involving applied voltage and gap distance were suggested for predicting the pulse rate of EM radiation and transient current. In addition, we evaluated the impacts of lateral sliding discharge and vertical approaching discharge on the transient features of the PCD and expounded on the underlying physical reasons using the experimental findings.
The work is organized as follows: In Section 2, we will provide a brief description of the experimental setup and the measurement arrangement. Section 3 presents the characteristics of the recorded current and EM radiation signals, as well as the effects of applied voltage, gap spacing, and PC relative motion on PCD. Section 4 focuses on the mechanism analysis on the experimental results.

2. Experimental Setup and Measurement

The primary issue in designing the experimental apparatus, which we refer to as a pendulum-type moving electrode PCD simulator, was the effect of relative movement between PC on the transient features of approaching discharge. By converting potential energy to kinetic energy, the pendulum carrying the pantograph contact strip slides towards the fixed catenary wire at a specific speed after being released from a considerable height. As the two electrodes move closer to each other, an air breakdown discharge will occur between them, simulating the approaching discharge after PC separation. The experimental setup does not contain a high-power motor or an electric lifter, thereby effectively eliminating environmental EM noise.

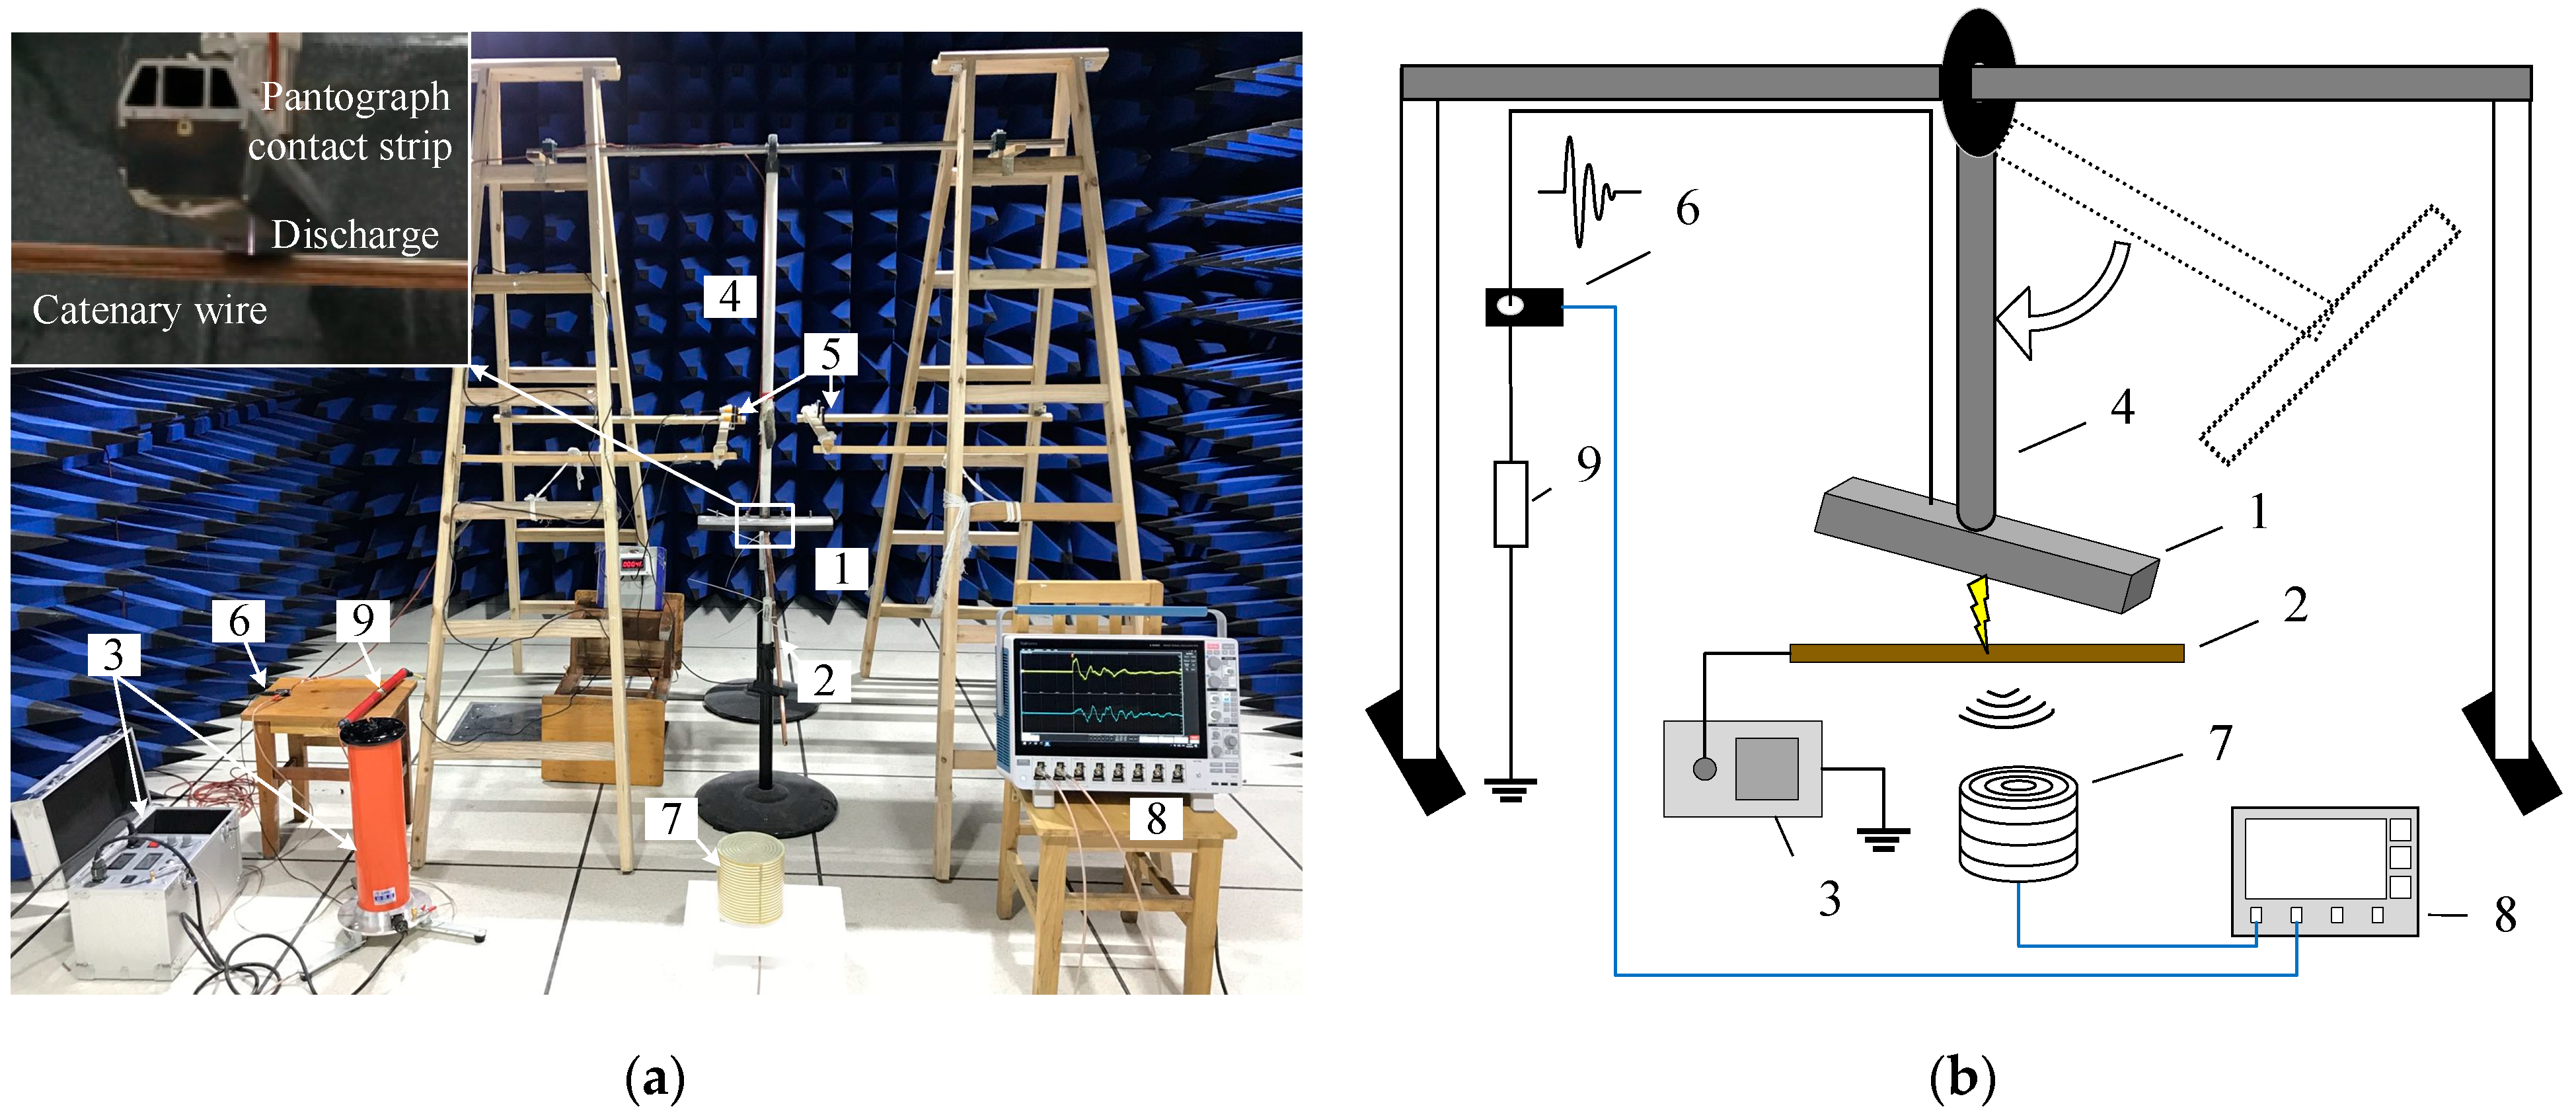
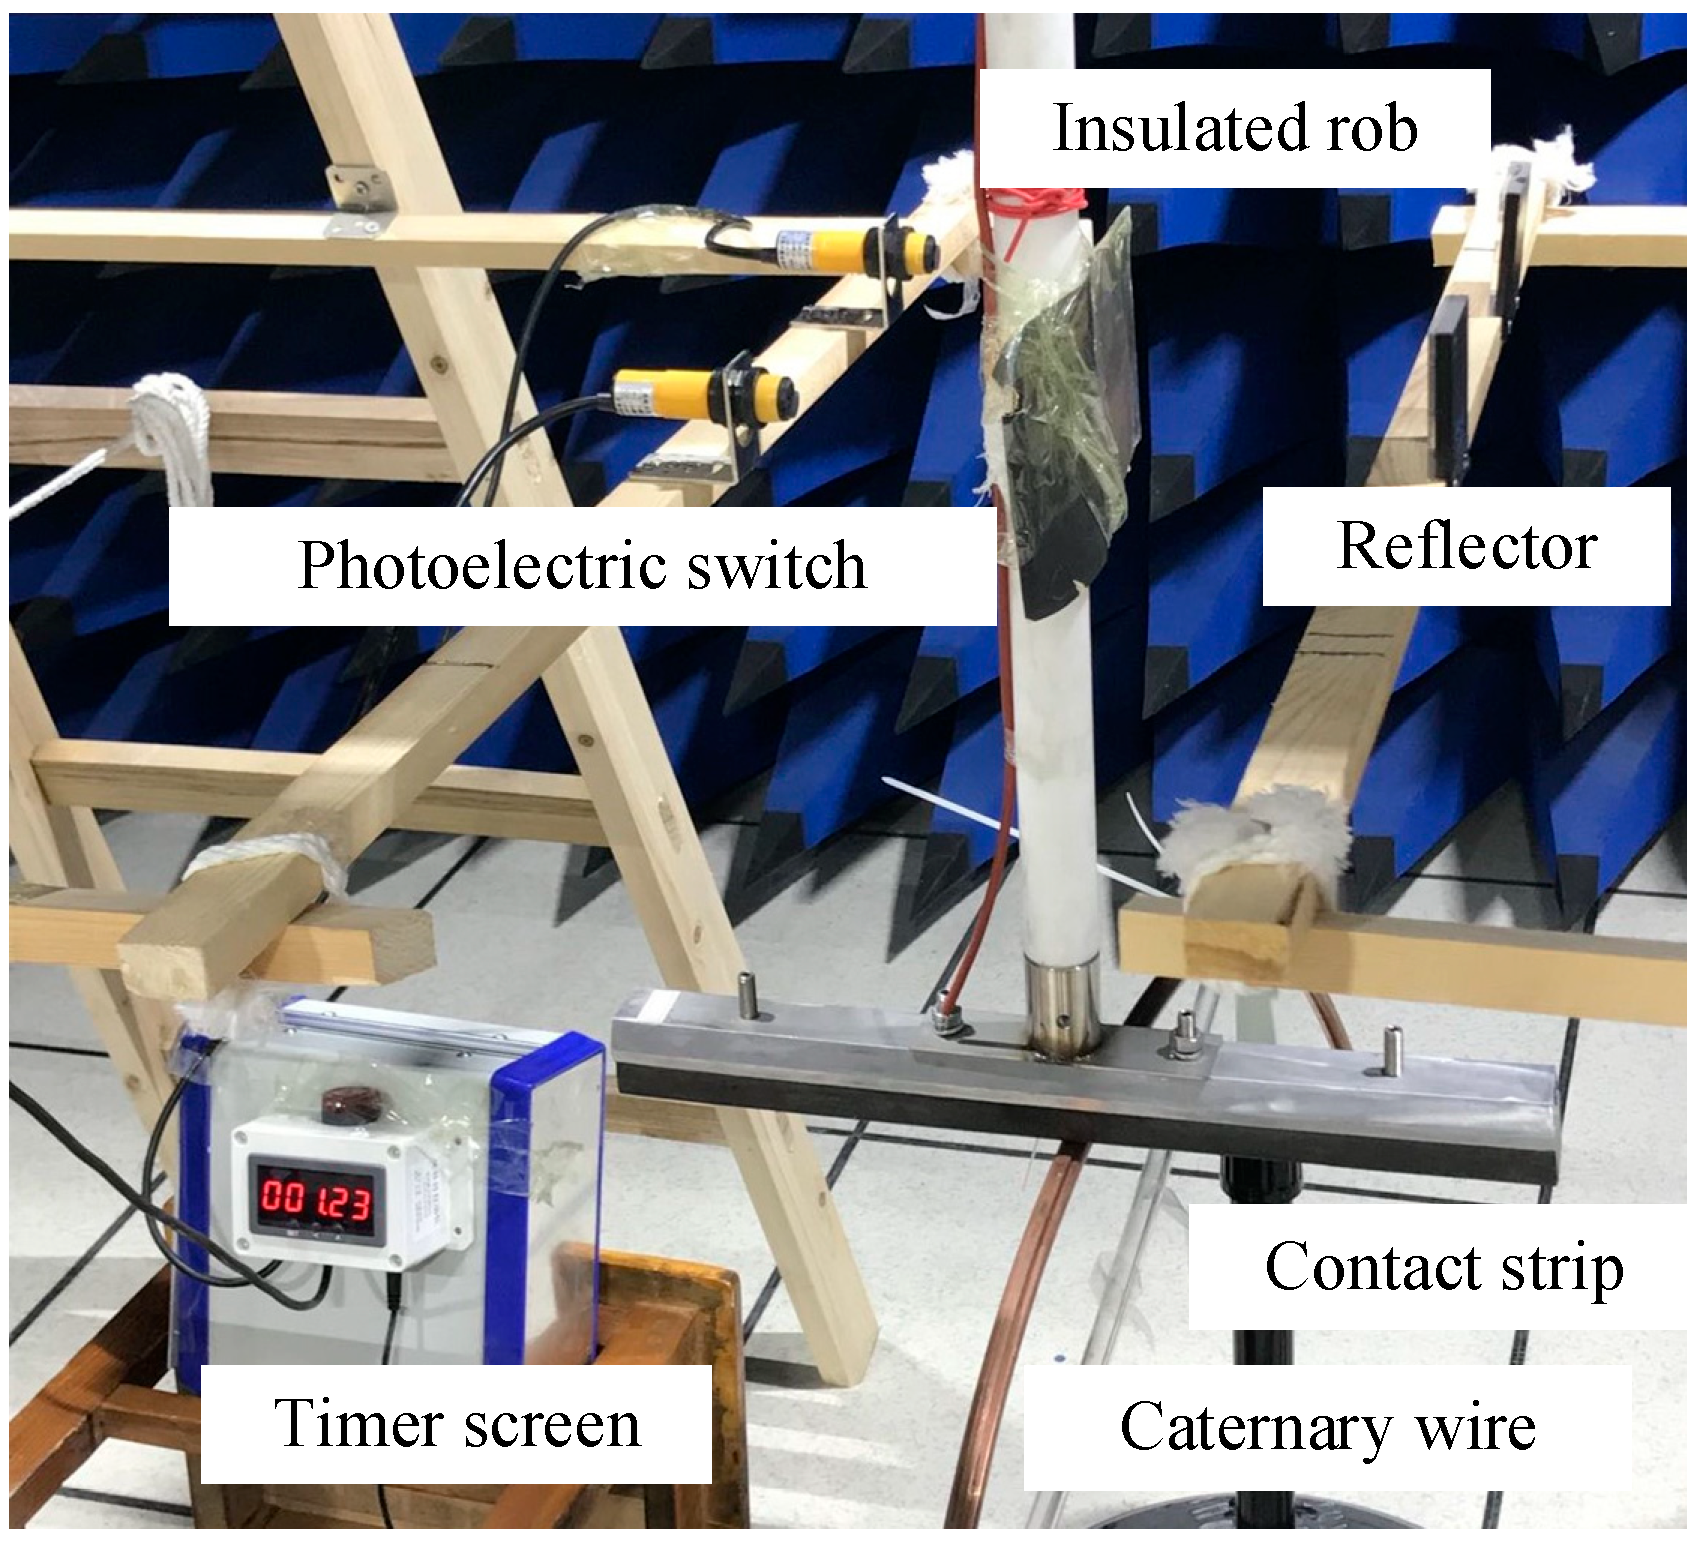
2.1. Construction Details of the Setup

The experimental setup consists of a PC motion pendulum, a discharge circuit, a photoelectric timer, and some measuring instruments. As seen in Figure 1, the whole experiment setup is housed in an ultra-compact chamber which serves for the EM radiation testing. A segmented copper-impregnated metalized carbon contact strip from a pantograph is suspended vertically upside down and affixed centrally to the end of a 1.4-m-long insulated rod. The pantograph strip can be regarded as a pendulum bob, and the insulated rod is used as a pendulum rod, whose other end is connected to ball bearings. A piece of catenary wire made of a Cu–Ag alloy is grounded, and both of its ends are fastened to support with adjustable height. When the insulated pendulum rod is pulled apart at different angles, the contact strip swings down at different heights, resulting in varying sliding speeds between PC. The physical parameters of the pantograph contact strip and catenary wire, which are both in service on high-speed railroads, are presented in Table 1.
A DC voltage source is connected to the catenary wire to provide a high voltage with an adjustable voltage level up to 50 kV. Existing research shows that the arc discharge process is very transient and usually appears as a pulse with a duration of less than 1 μs [31]. That leads to a reasonably small phase change during the transient discharge even in the AC power supply of high-speed rail systems adopting 50 Hz or lower frequency. At the same time, to obtain the influence law of other factors on the discharge, it is necessary to ensure that the voltage on the discharge electrode remains unchanged in the experiment. Therefore, a DC high voltage source was selected as the power source for this test setup. The electric field between the pantograph and catenary exceeds the breakdown field strength when the high voltage on the contact line rises or the pantograph–catenary gap narrows, resulting in a conduction discharge. When a discharge occurs, electricity travels from the power source through the contact copper wire, the arc, the pantograph carbon strip, the wire mounted on the insulated rob and pendulum frame, the current transformer, and the protective resistance before flowing into the earth.
The photoelectric timer is mounted on the side of the pendulum rob, assembled from two sets of retroreflective photoelectric switches and reflective panels, as shown in Figure 2. According to Figure 3, the photoelectric switch’s timing is activated when the contact strip swings downward, obstructing the reflector and entering the testing zone for velocity. Timing will be paused when the contact strip slides past the pendulum’s lowest point and moves outside the velocity testing zone. The two photoelectric switches are separated by 10 cm, and the time difference in the velocity testing zone is shown on the timing screen, which can be utilized to calculate the PC’s relative speed by assuming a constant velocity over the region. The pendulum can replicate various relative PC velocities when it swings downward at different angles, as presented in Table 2.
The measurement system comprises two channels, one of which employs a current measuring probe CT-1 manufactured by Tektronix Company to detect the discharge current and the other monitors the EM radiation behavior with a self-designed antenna. The frequency response range of the current probe is 25 kHz to 1 GHz, with a minimum response time of 0.35 ns. The self-designed single-arm Archimedean spiral antenna (SAAS) antenna, seen in Figure 4a, is employed to gather PCD radiation signals due to its downsizing and ultra-wideband benefits. Figure 4b displays the voltage standing wave ratio (VSWR) of the antenna over the 0 to 1 GHz frequency range. The VSWR rating for the 20 MHz to 1 GHz frequency range is less than 4.3 dB, which satisfies the measurement requirements [32]. The antenna is improved on the basis of the original antenna in ref. [33] by removing the metal back cavity and introducing a three-dimensional spiral arm structure. The current probe and the antenna are connected to a 4 GHz bandwidth, 50 GSa/s sampling frequency Tektronix, MSO64B digital oscilloscope through coaxial cables.

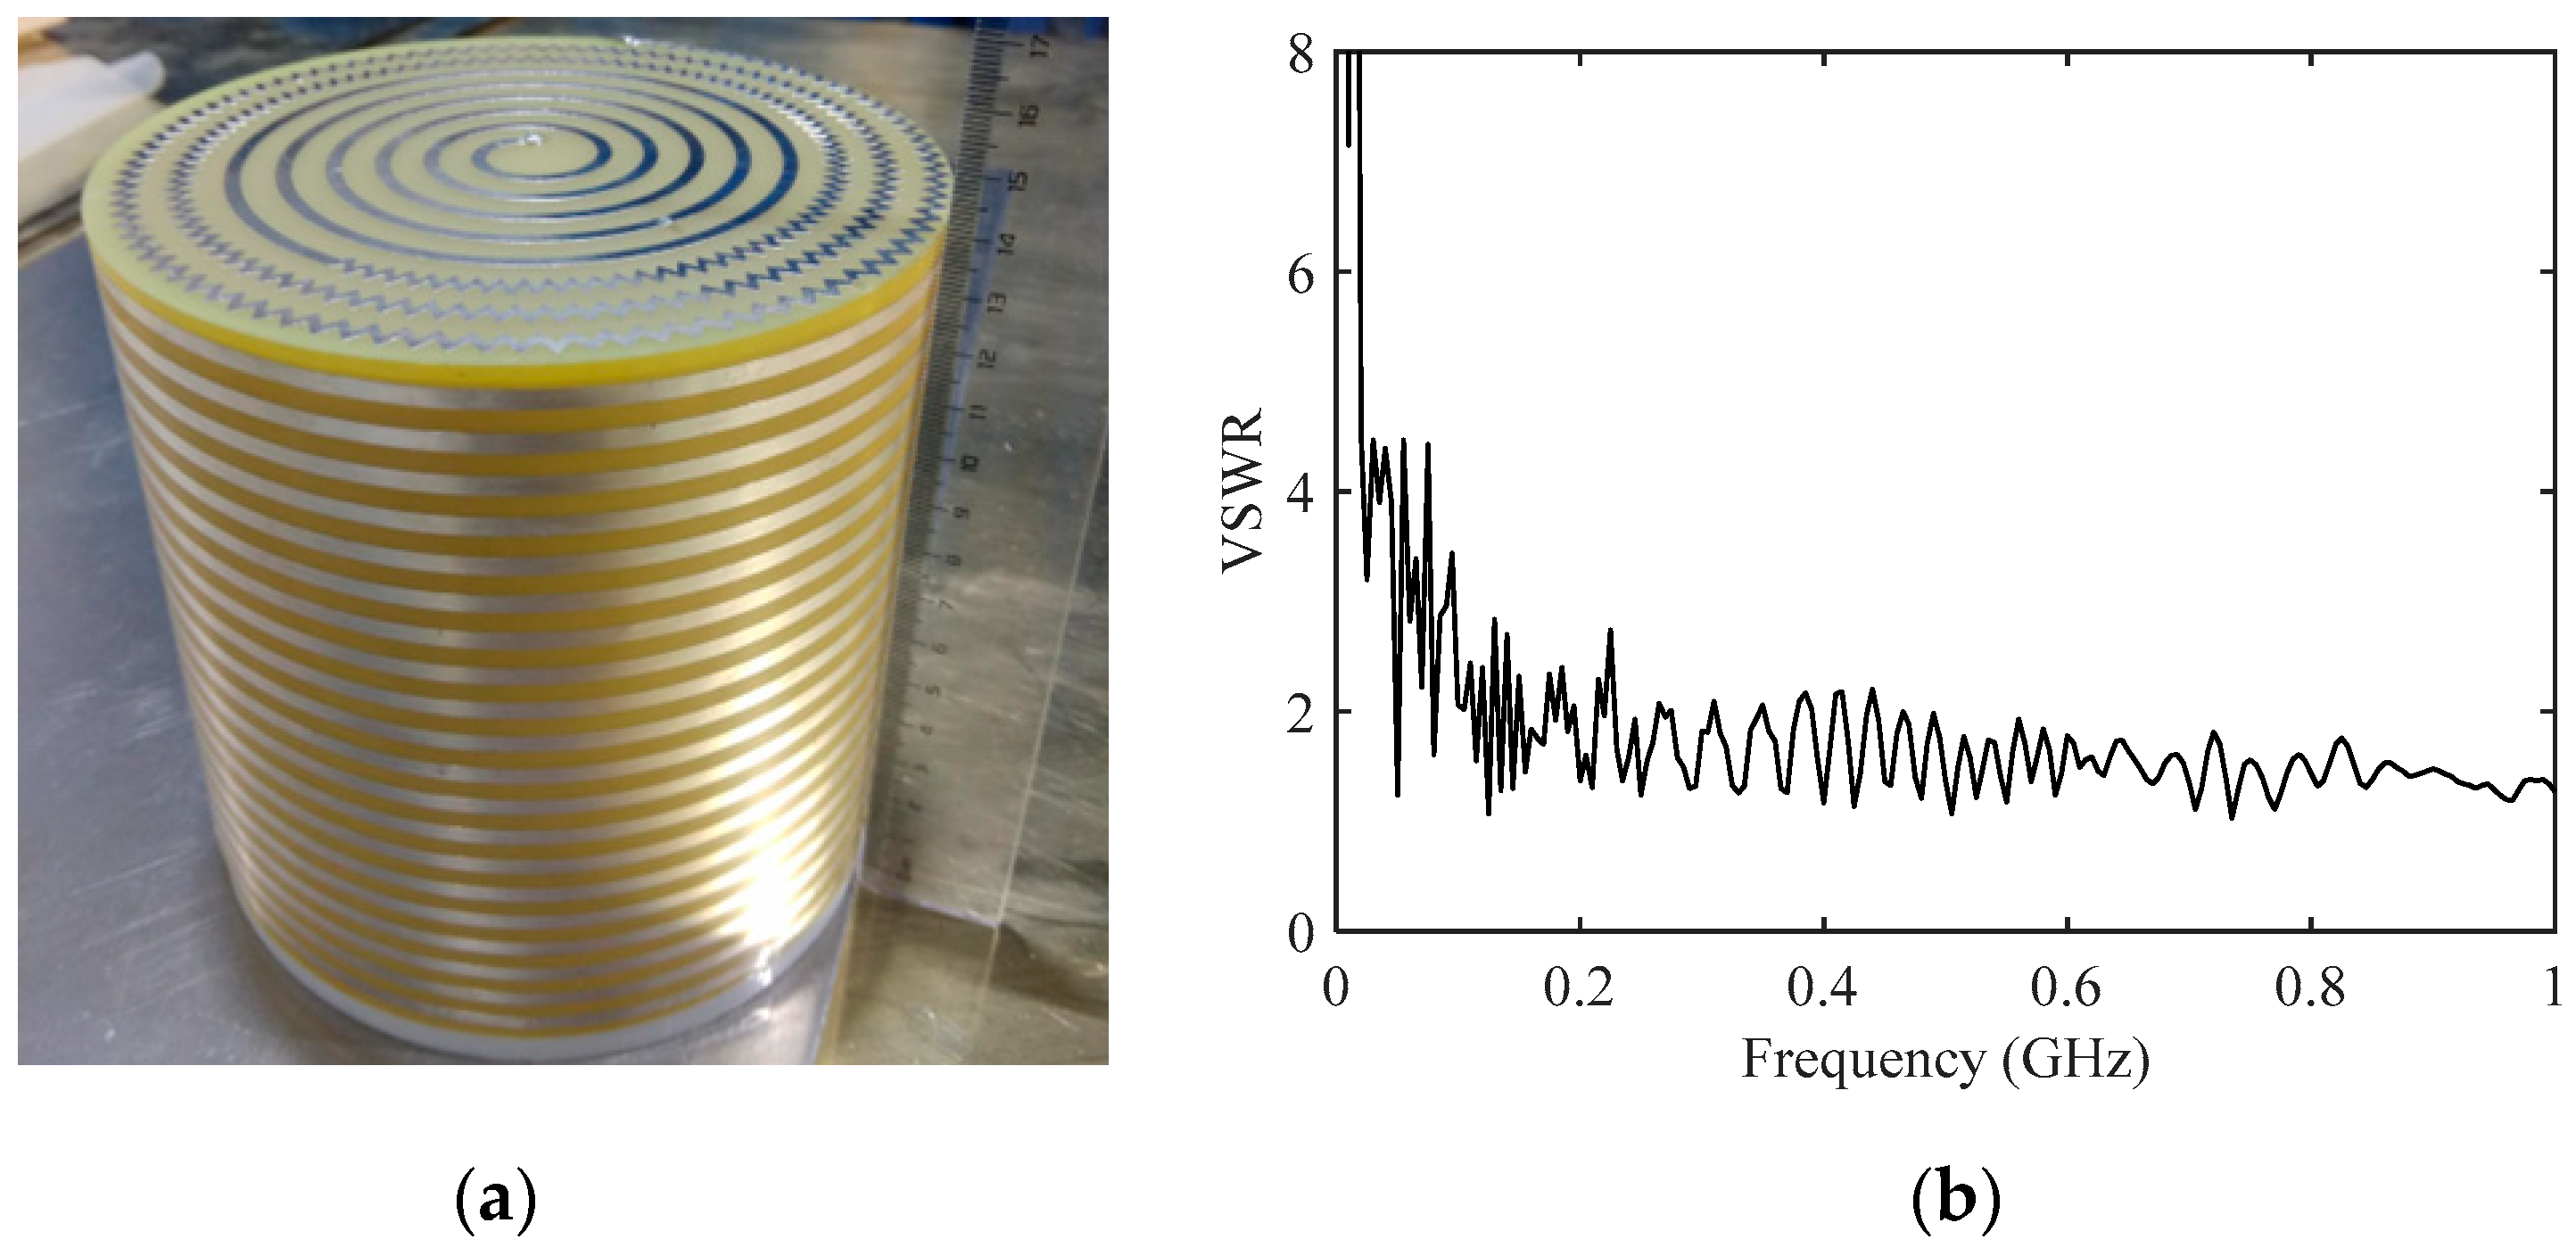
2.2. Measurement Arrangement

In this experiment, the time-domain measurement of the electric and EM characteristics of PCD was conducted. The characteristics of transient pulse current, such as peak amplitude, rise time, and repetition frequency, which are related to the mechanism and effect of radiation emission, were extracted. Radiation spectra were obtained by post-processing with the Fast Fourier Transform (FFT) from signals collected by the SAAS antenna under different conditions.
The experimental variables were set up with regard to the general influence factors of arcing discharge, such as electrodes’ gap distance and applied voltage, and with a focus on PC relative motion, as shown in Table 3. The effects of nine DC source voltage levels, seven PC relative velocities, and six gap lengths on PCD properties were investigated in a series of experiments. Due to the fact that arcing discharge is a very complex physical event with limited reproducibility, all of the testing data was collected utilizing 10 repeated experiments under the same conditions. Additionally, various actions were taken to guarantee consistency, such as maintaining the same ambient temperature of 26 °C and relative humidity of 33% RH throughout the test and polishing the surface of experimental materials prior to each test.

3. Experiment Results

A controlled arcing discharge between pantograph and catenary wire was produced using the experimental setup described above. The time-domain waveforms of discharge current and EM radiation were collected under various settings, and the extracted time- and frequency-domain characteristics were systematically analyzed. In Section 3.1, Section 3.2 and Section 3.3, static discharge tests on PCD were conducted at various voltage levels, gap lengths, and electrode polarities. However, Section 3.4 focuses primarily on the impact of PC movement on discharge characteristics.

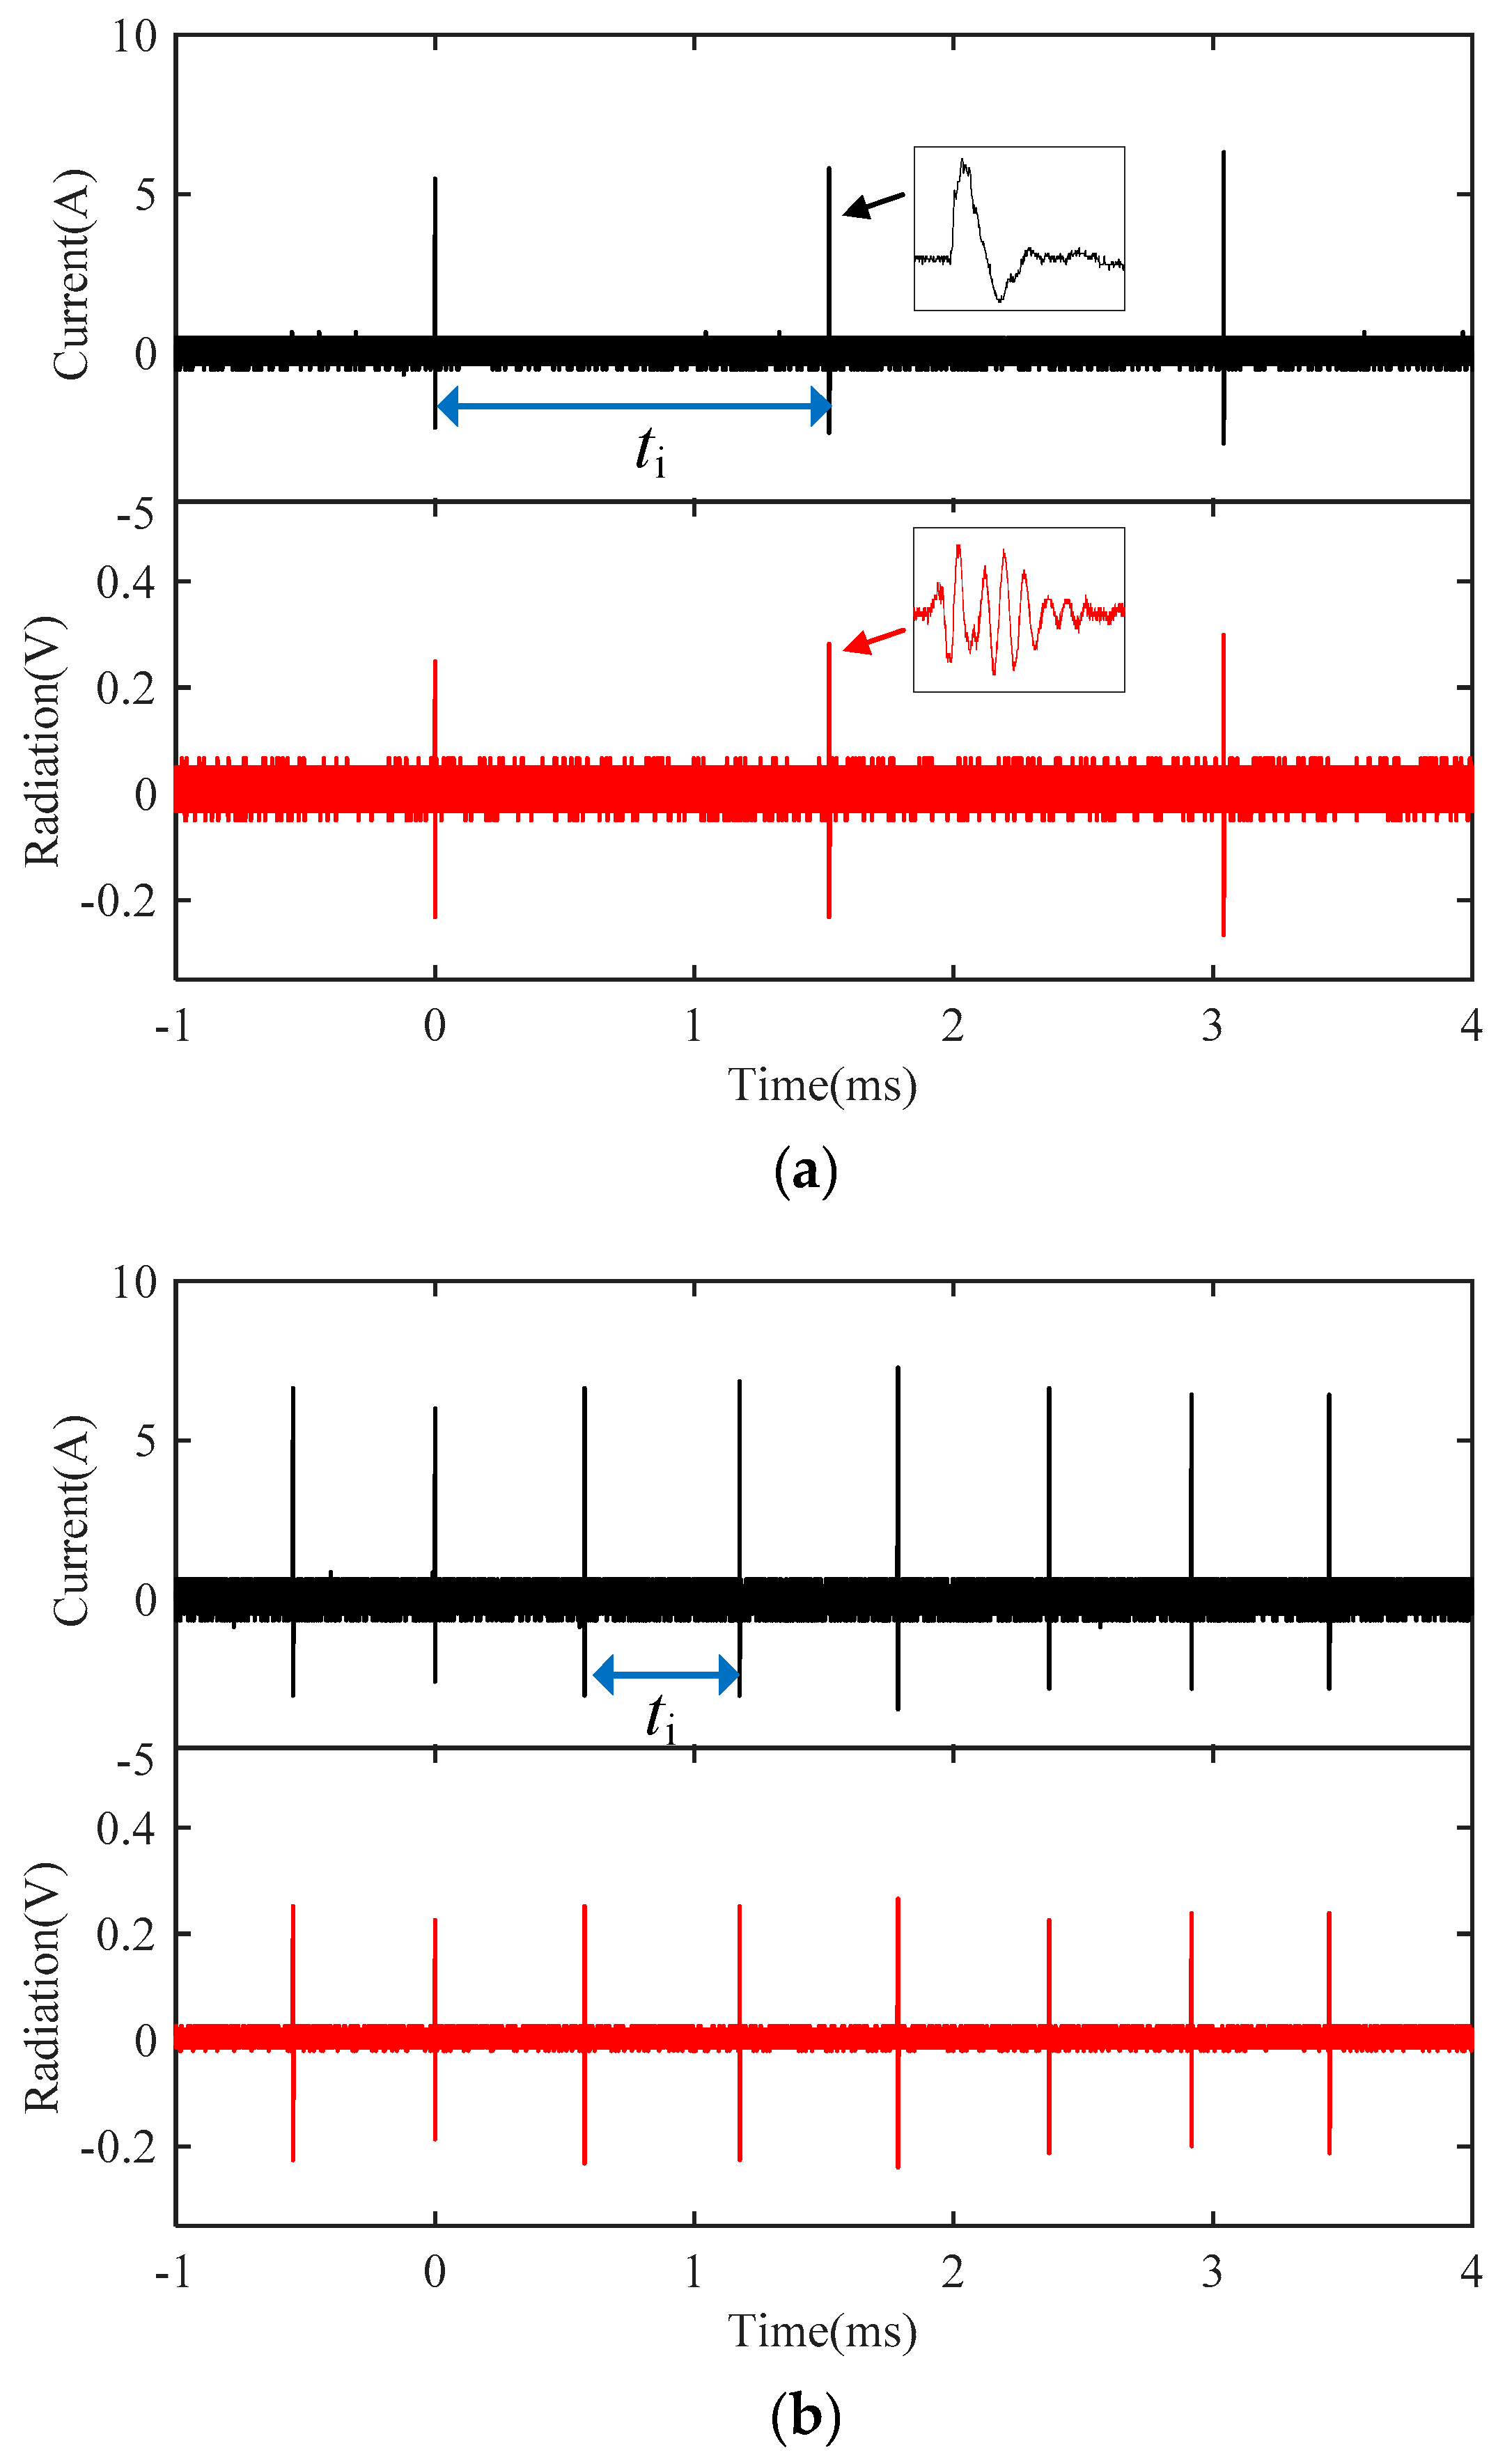
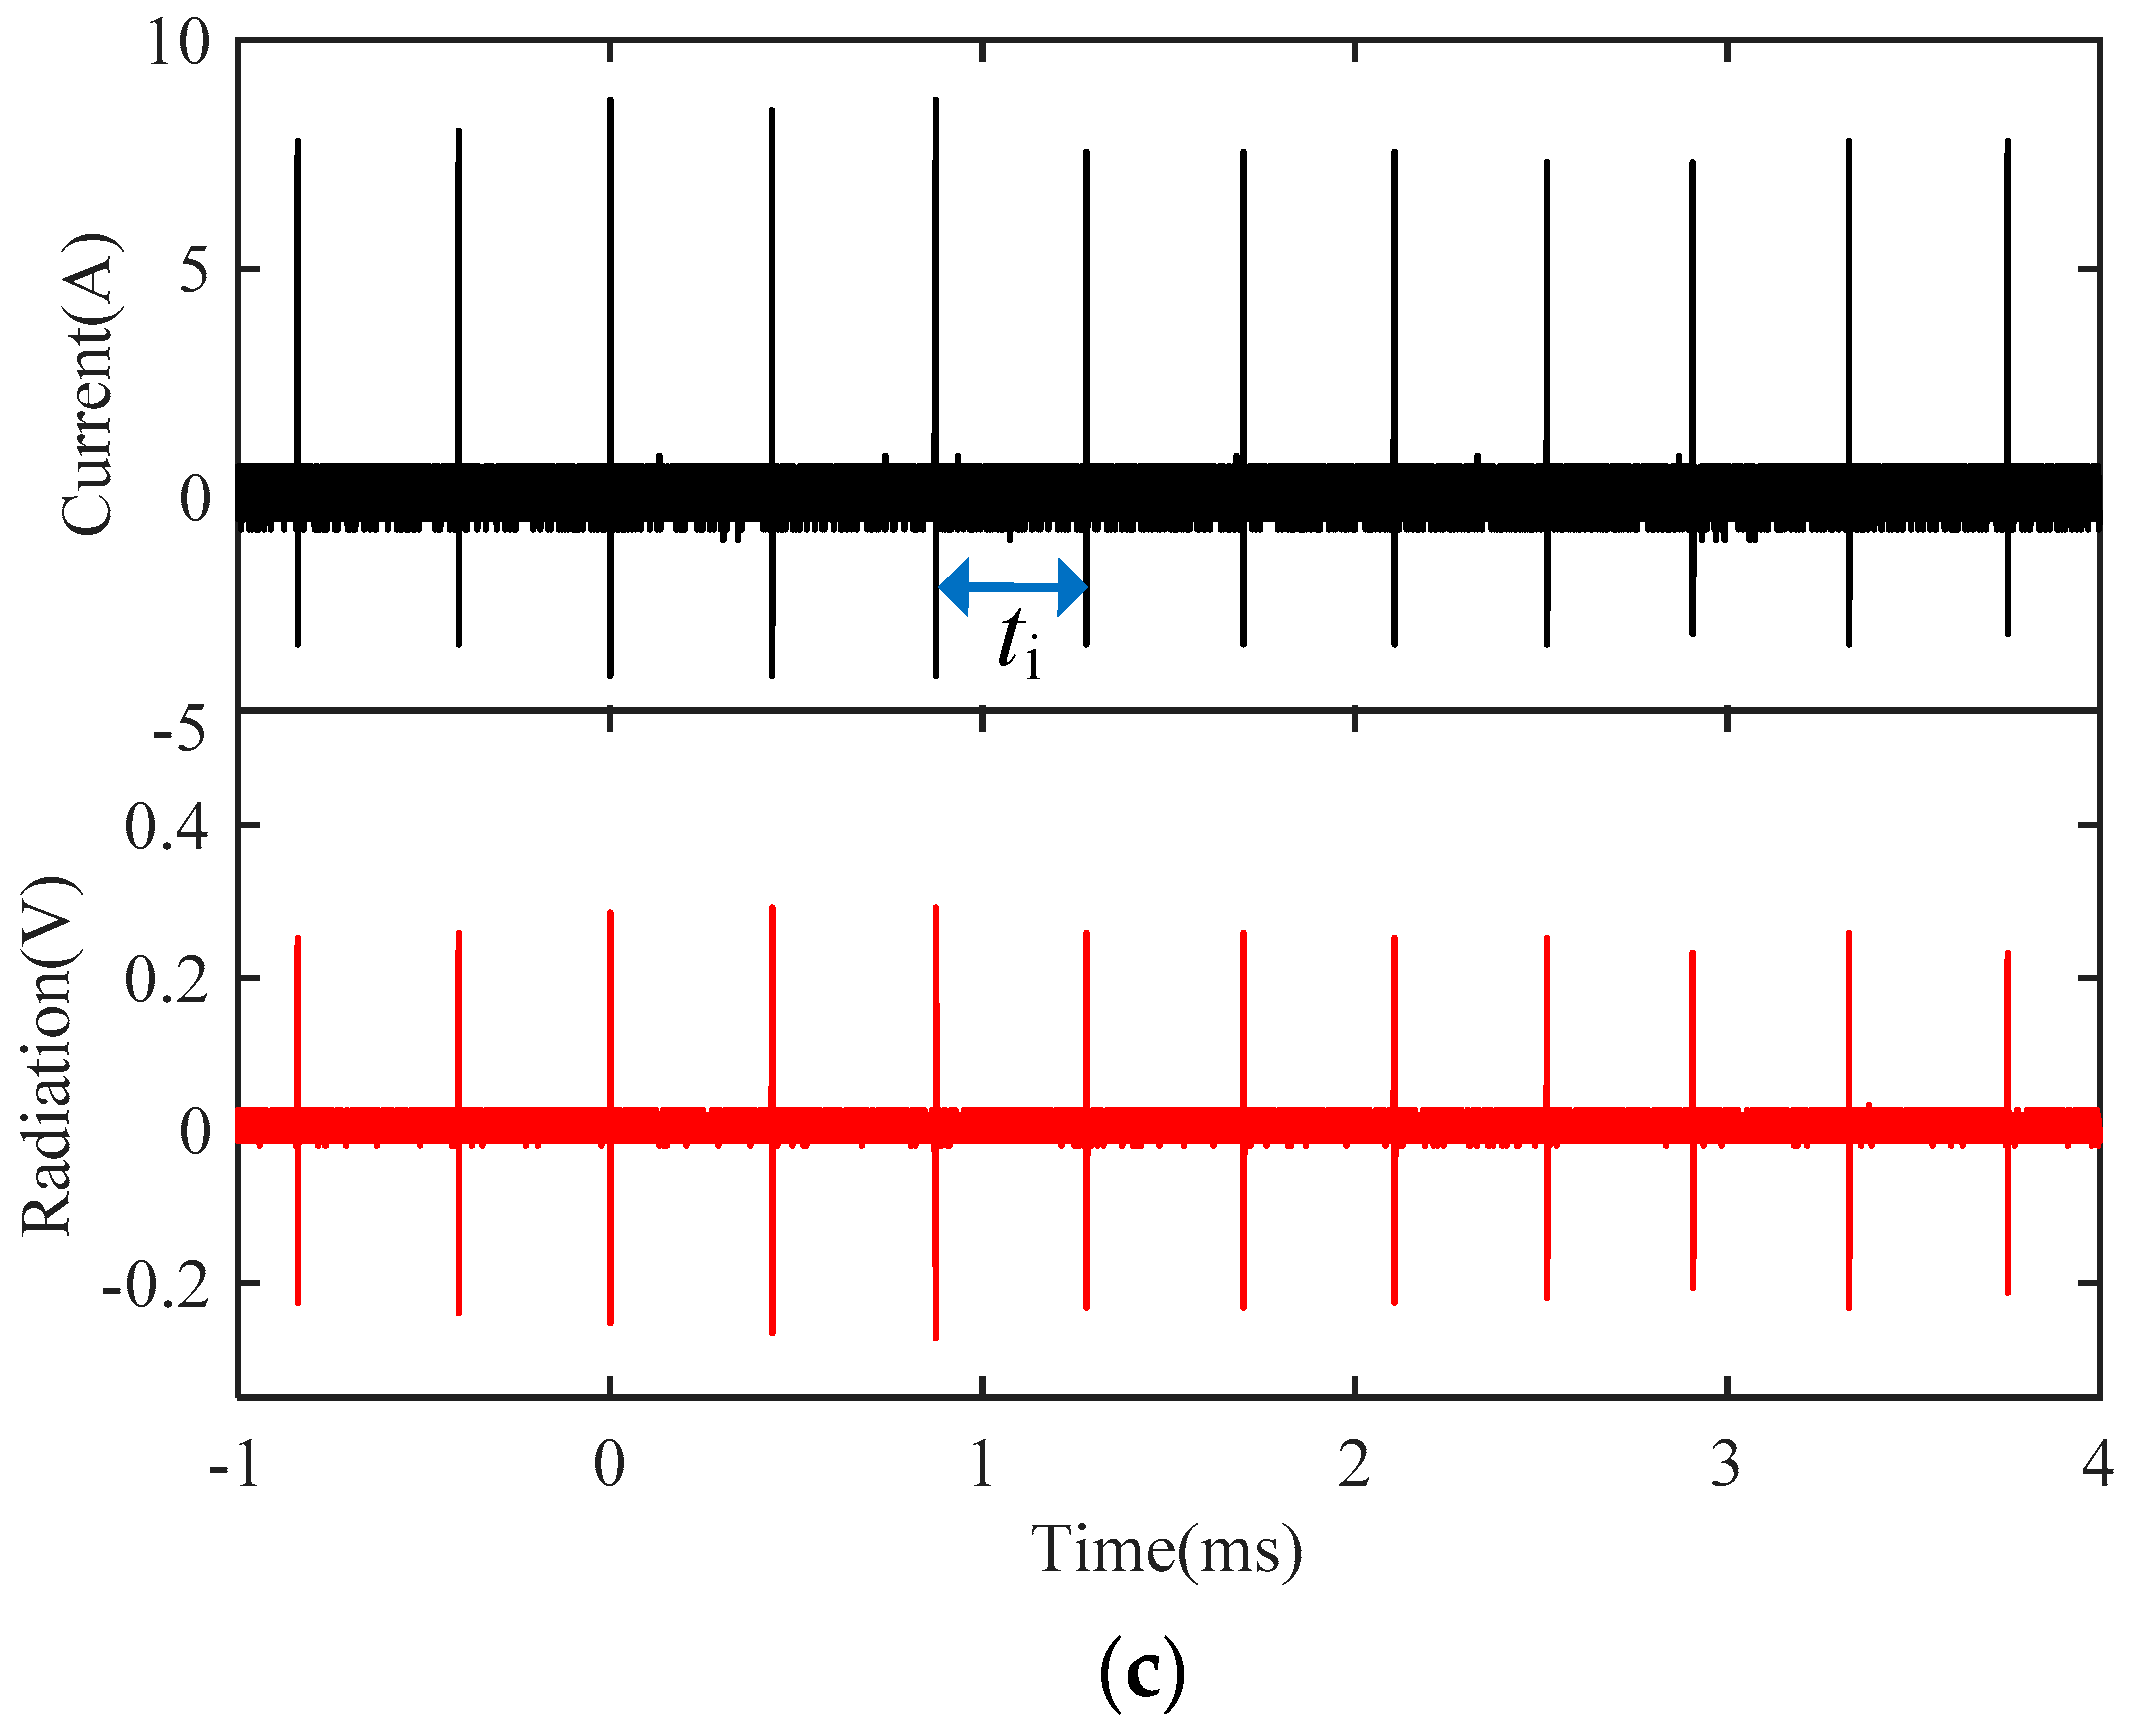
3.1. Basic Characteristics of Discharge Current and EM Radiation

The typical discharge current pulses collected by the current probe and the radiation field signals detected by the SAAS antenna are respectively presented in Figure 5. The waveforms of recorded current and EM radiation are both composed of a succession of bipolar pulses and share some similarities: (a) an initial high-amplitude pulse response of the transient discharge phase; this is followed by (b) a low-frequency oscillation tail that adds distortion. Meanwhile, it is worth noting that there is a one-to-one correlation between the discharge current pulse and the radiation pulse. Evidently, the number of pulses in the fixed acquisition time grows as the applied voltage rises, yet the one-to-one relationship between the pulse current and electromagnetic radiation remains reasonably strong in the time-domain.
Changes in current produce electromagnetic radiation, in accordance with Faraday’s law of electromagnetic induction. The amplitude of the electric field E arc is proportional to the rate of current change, as shown in the following equation [34]:
E arc = 1 4 π ε 0 c 2   d I arc d t = k · I arc ˙
where ε 0 is the dielectric constant of air, c is the velocity of light, and k is the proportion.
During the discharge phase, enormous numbers of space charges, such as electrons, positive ions, and negative ions are produced, transported, and dissipated and the instantaneous discharge current I ( t ) may be calculated using the Shockley–Ramo theorem as:
I ( t ) = e U   V   ( N p v p     N n v n     N e v e ) · E d V
where N p , N n , and N e are the number density of positive ions, negative ions, and electrons, respectively, which are intimately connected to the ionization density; v p , v n , and v e are the velocities of the charged particles, which depend on the distribution of space electric field; e is the absolute value of the electron’s charge; U is the applied voltage; E is the space-charge-free electric field; and V is the volume of the gap space.
Due to the rapid characteristics of space charges’ drift motion and suppression, the PCD current generated during the ionization process exhibits repeating pulse features, as illustrated in Figure 5. Along with the initiation and propagation of the PCD current pulses, the EM waves can be created in accordance with Equation (1). As a result, the one-to-one relationship between discharge current pulse and EM radiation pulse exists as shown in Figure 5.
The peak value, rise time, and repetition frequency of the PCD pulse current are retrieved and statistically evaluated. Figure 6 depicts the magnified waveform of a single current pulse and the definitions of waveform parameters, where A p denotes the pulse peak current, and T r represents the rise time (10% to 90%). The pulse repetition frequency f R may be calculated using the formula:
f R = 1 t i ¯ = t n R
where t i ¯ is the average value of the interval time t i between two successive pulses, as shown in Figure 5; t is the total sampling time; and n R is the count of pulse occurrences.
In this work, the frequency-domain features of EM radiation signals are also explored. The FFT is used to calculate the amplitude spectrum of the radiation pulse captured by the SAAS antenna. Figure 7 depicts an example result together with the frequency spectrum of the background. Multiple peaks exist in the spectrum of the EM radiation emitted by PCD, which spans a broad band up to 1 GHz. The principal amplitudes are found in the frequency ranges of 0–200 MHz, 350–450 MHz, and 850–900 MHz. According to Figure 7, the maximum amplitude of EM radiation in its spectral distribution is near 113 MHz. In certain arc detection and identification studies [32,35], researchers found that in the radiation spectrum, the frequency point corresponding to the maximum amplitude of arcing discharge is relatively stable, which can be used as the main characteristic for arc identification and is therefore named as the characteristic frequency.

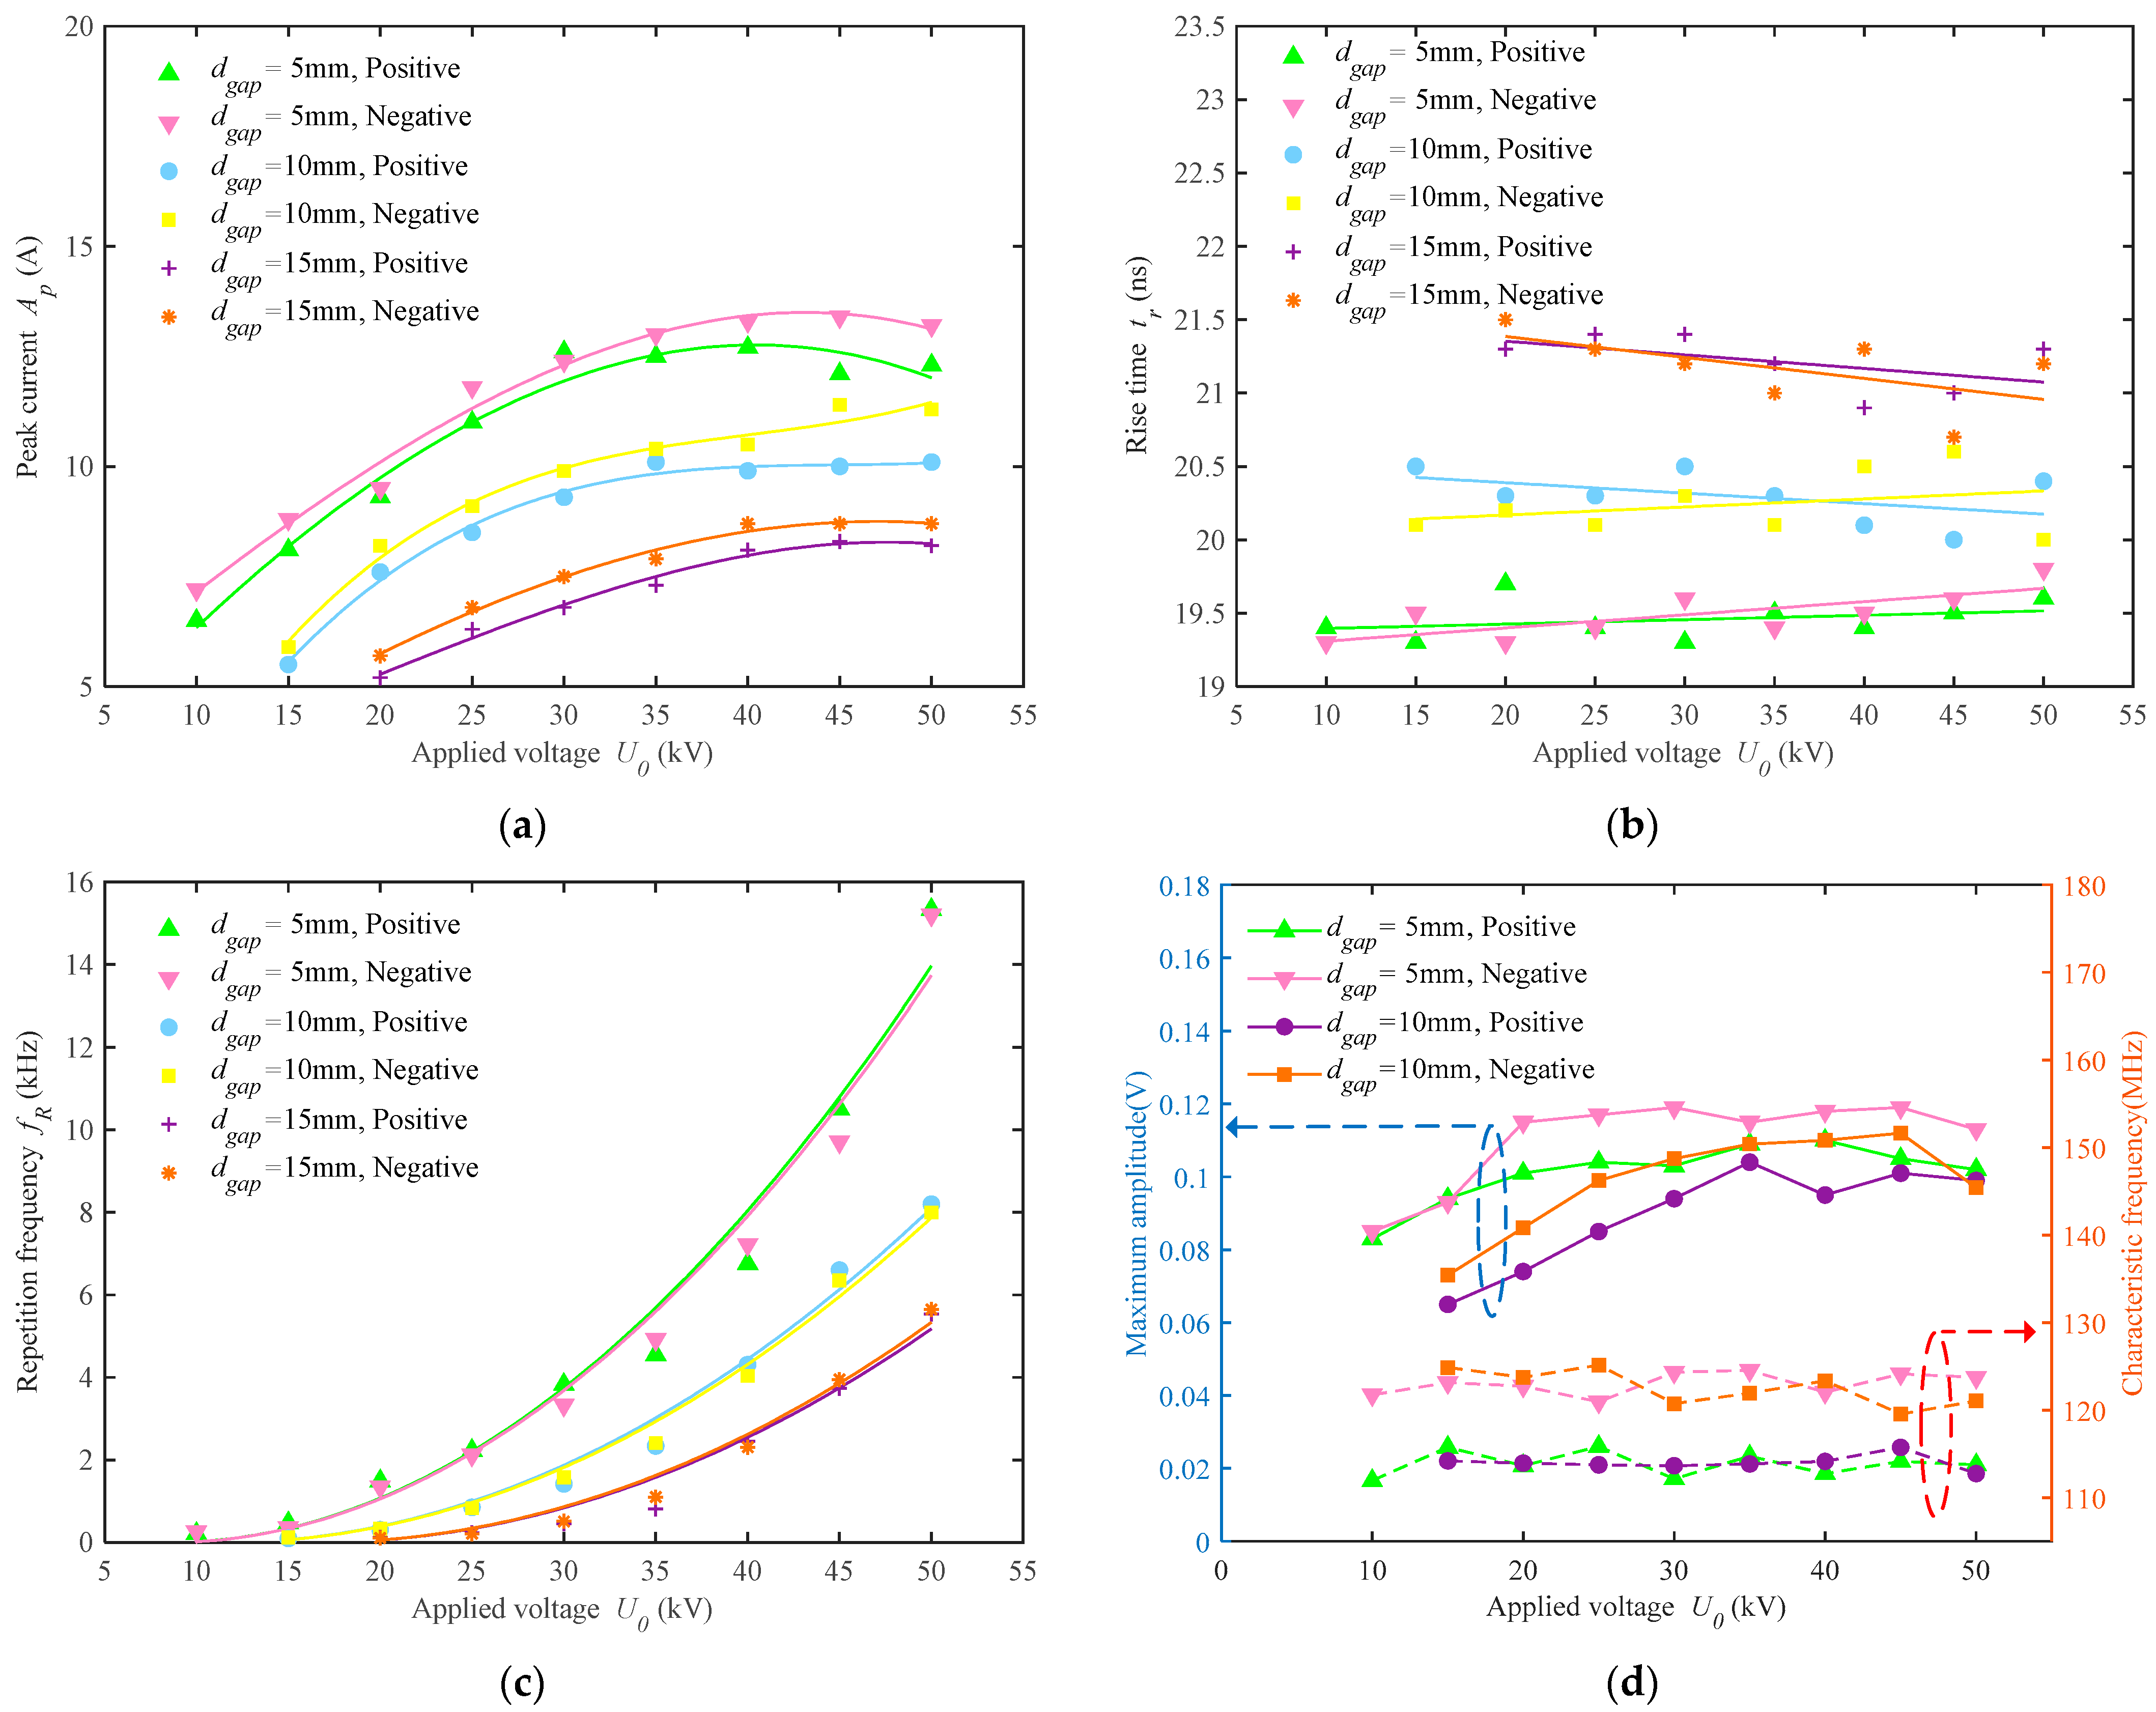
3.2. Effect of Applied Voltage on PCD

The arcing discharge between the pantograph contact strip and the catenary wire is specifically caused by the high voltage that has been applied to the Cu–Ag alloy wire. Therefore, the effect of the applied voltage on PCD characteristics is being investigated. The pantograph contact strip was kept stationary throughout the following experiments in Section 3.2 and Section 3.3. The fluctuations in pulse current parameters and EM spectrum properties with an increase in the applied voltage are depicted in Figure 8a–d.
According to Figure 8a,c, the pulse peak current and repetition frequency exhibit a nonlinear relationship with the applied voltage on the copper wire, while the rise time almost remains constant over the applied voltage fluctuations in Figure 8b. Third and second order polynomial fittings are used in Figure 8a and Figure 8c, respectively, to show the variation trend of the discrete experimental data. With the increase in applied voltage, both the peak amplitude and the repetition frequency increase, the performance of which can be split into two distinct voltage intervals. In the voltage range of 10–35 kV, the pulse peak increased significantly with the applied voltage, primarily due to the occurrence of multi-point discharges caused by the intensifying electric field. In the 35–50 kV range, it appears that the growing trend of peak amplitude takes a temporary pause, but the association between repetition frequency and the applied voltage is more evident. That is, with the increase of the applied voltage, the pulse repetition frequency exhibits quadratic growth and climbs dramatically at 35–50 kV. As the applied voltage grows, the energy put into the arc is larger; meanwhile, the energy released by the arc rises. This increase in energy is manifested in the low voltage range primarily with an increase in pulse frequency as the outlet of energy release, while in the high voltage range primarily with an increase in pulse amplitude.
Additionally, by comparing the pulse peak currents generated with different voltage polarities, it can be seen that the arcing discharge between the carbon contact strip and the Cu-Ag alloy wire is a polarity-dependent phenomenon, which is compatible with the experimental observation in refs. [24,36]. When the negative high voltage is applied to the copper wire, the pulse amplitude is higher than when the positive voltage is applied. For the AC 25 kV 50 Hz supply on railways, the polarity of the high voltage supplied to the copper wire alternates between positive and negative half cycles, resulting the distinct current peak amplitudes.
The phenomenon can be analyzed by using the related theories of gas discharge. The electrons on the cathode surface are first separated from the contact surface as the electric field in the PC’s gap increases owing to an increase in voltage or a reduction in gap distance. The “initial” electrons then collide with molecules in the gap space while being subjected to the strong field, causing the gas molecules to ionize and form electron avalanches, ultimately forming the arcing discharge plasma. Work function refers to the amount of energy necessary for seed electrons on the surface of a solid electrode to overcome the surface barrier and escape from the electrode surface. Different materials have different work functions. Since copper has a lower work function than carbon, electrons are more likely to be expelled from the copper electrode’s surface into the gap area. So, when the copper wire is applied with a negative voltage, more seed electrons are generated. This strengthens the collisional ionization effect and the electron avalanche, hence increasing the discharge current’s amplitude.
As for the frequency-domain characteristics of a single PCD radiation, the variations of the maximum amplitude and characteristic frequency at different applied voltages and gap spacing are depicted in Figure 8d. The maximum amplitude of radiation exhibits an increasing trend in the low voltage range while remaining constant at higher voltages. For 5 mm and 10 mm gap distances, the characteristic frequencies of positive discharge radiation are both close to 113 MHz, whereas the characteristic frequencies of negative discharge radiation are both near 124 MHz. It turns out that the characteristic frequency of radiation is only tied to the polarity of the high voltage applied to the copper wire and seems to be independent of the applied voltage level and gap distance. This observation will be further discussed in Section 4.

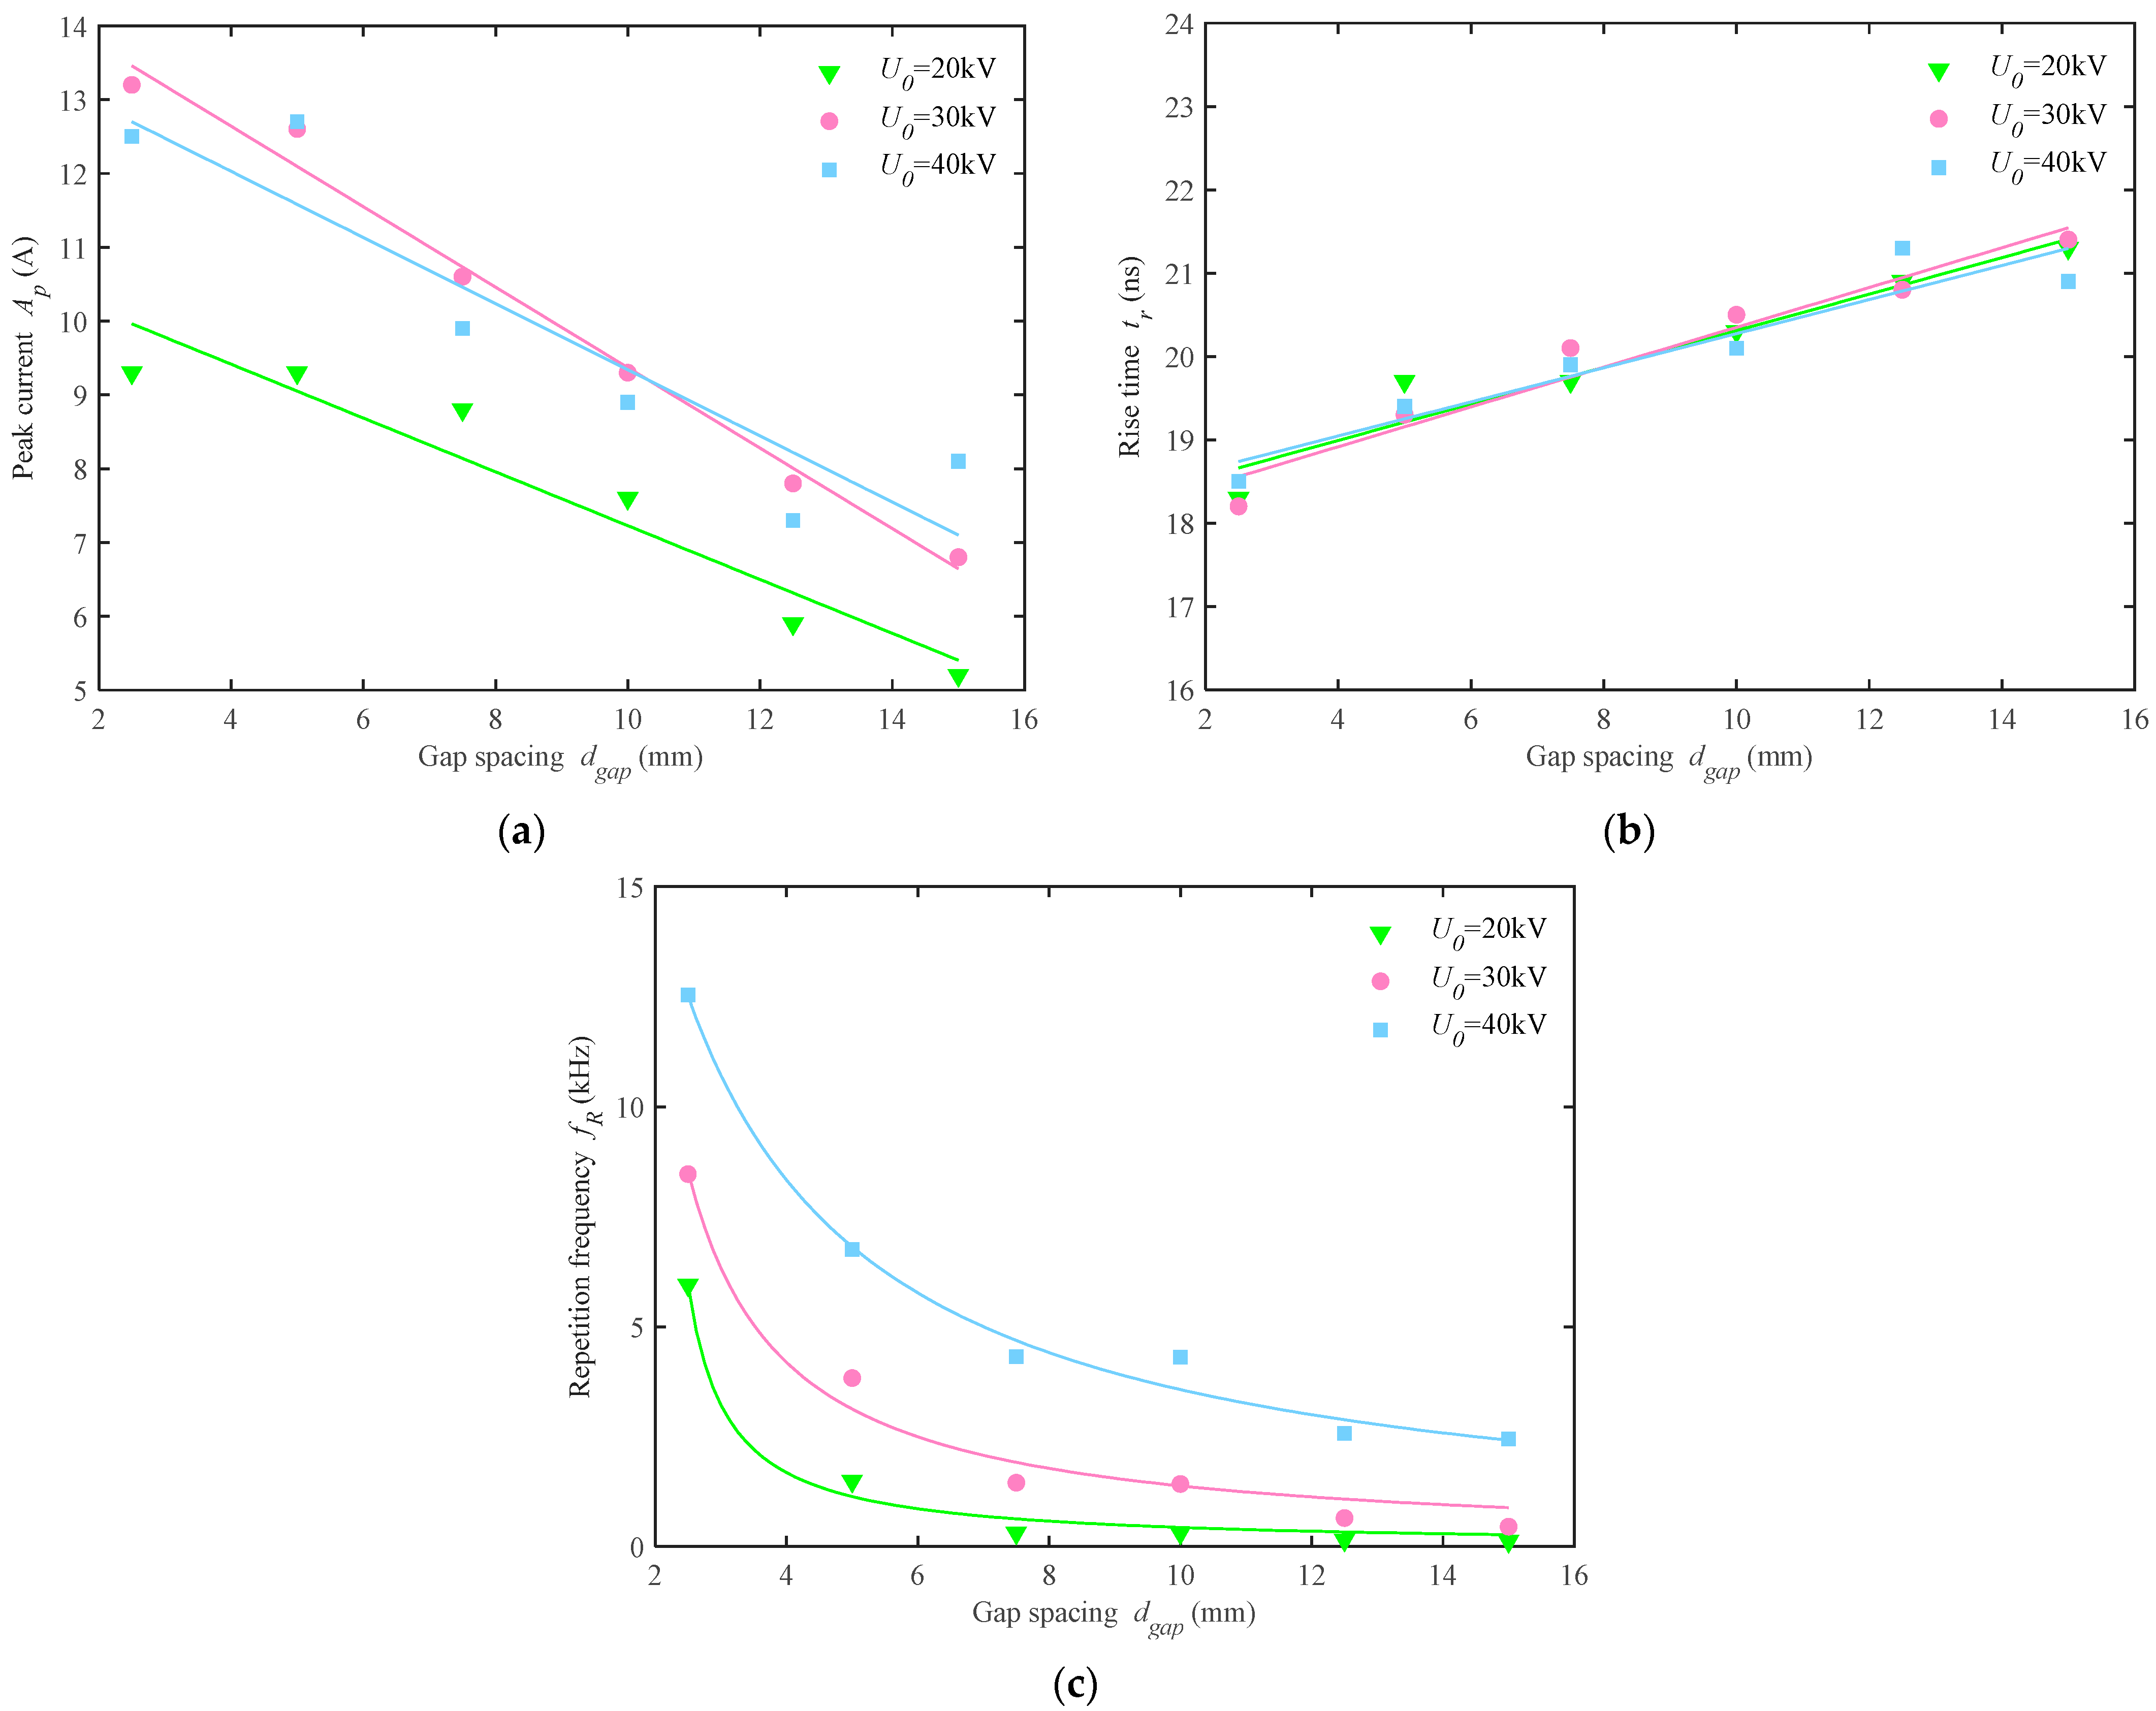
3.3. Effect of Gap Spacing on PCD

The arcing discharge was generated using PC electrodes with six different gap lengths (2.5, 5, 7.5, 10, 12.5 and 15 mm) in order to examine the influence of gap spacing on the parameters of the PCD. According to Figure 9a–c, with the increase of the gap spacing between PC electrodes, the pulse repetition frequency falls dramatically (the variation trend can be fitted by an inverse proportional function), and the peak value of a single pulse drops as well, while the rise time increases slightly. Only the result of positive voltage applied to the copper wire is shown in this section.
The comprehension of the relationship between the discharge gap and the pulse repetition frequency can be aided by space charge effects. The greater d gap allows for longer space charge movement distances, which accumulates more charges and reduces the total electric field. This reduction in the overall electric field weakens the discharge on the conductor surface, which has been shown in Figure 8c and Figure 9c. From a different angle, the average charge velocity is reduced due to a reduction in the total electric field, and the area between PC electrodes can accumulate more charges, which further reduces the total electric field and diminishes discharges on the conductor surface. In a bigger d gap situation, these two factors combine to lead to fewer current pulses.
As demonstrated in Figure 8d, the maximum amplitude in the frequency spectrum for a gap spacing of 5 mm is greater than that of 10 mm, both for the radiation of positive and negative discharges, which is mainly decided by the rate of current change. For the corresponding characteristic frequencies mentioned in Section 3.2, there is no clear separation of the curves for the 5 mm gap and the 10 mm gap, indicating that the gap distance has no direct effect on the characteristic frequency of the radiation pulse, which will be further examined in Section 4.

3.4. Effect of PC Relative Motion on PCD

To explore the impact of train speed on discharge parameters, a dynamic discharge test was carried out by using the pendulum discharge device. The relative motion between PC may be decomposed into two motions: the lateral sliding motion generated by the train’s forward speed and the vertical approach motion caused by the pantographs’ offline rebound. Distinct simulation experiments were conducted for these two distinct pantograph–catenary interactions, which are shown in Figure 10a and Figure 10b, respectively.

3.4.1. Lateral Sliding Motion

Figure 11 depicts the waveforms of single pulses and the spectra of radiation for PCD at various sliding velocities, denoted as vslide, with a 20 kV applied voltage. Seeing that the current waveform and radiation spectra remain essentially identical across the sliding velocity range of 0.79–4.52 m/s, we can conclude that the sliding velocity has no discernible influence on the transient features of PCD. As for the EMI issue of pantograph arcing, the aforementioned experimental findings demonstrate that the train’s forward speed does not directly alter the intensity of EMI.

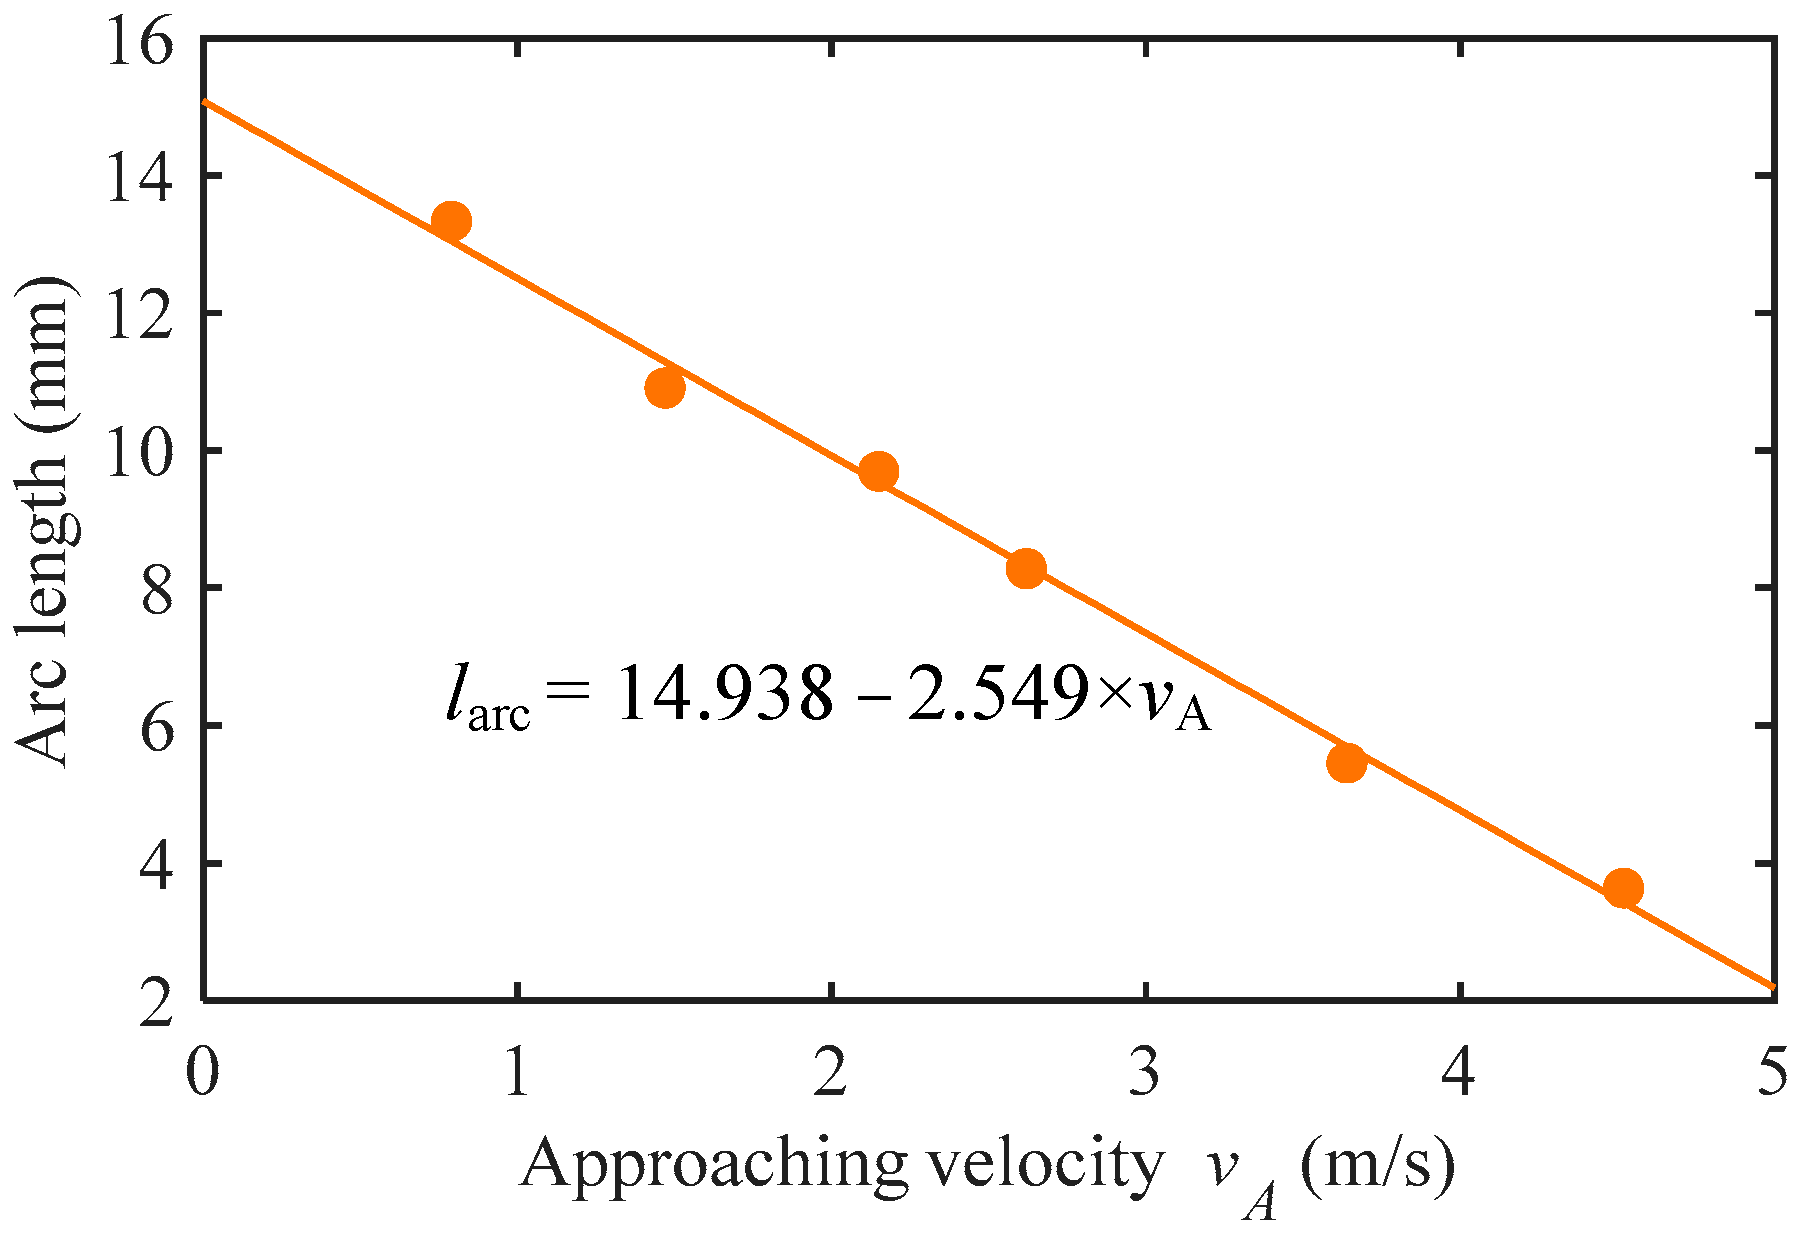
3.4.2. Vertical Approaching Motion

To investigate the effect of the approaching velocity vA on radiation characteristics, we merely modified the pendulum discharge device to simulate the generation of approaching discharge by redeploying a frontal collision between the contact strip and the copper wire at the lowest point of the pendulum, as depicted in Figure 10b. The current waveform and radiation spectrum obtained from the measurements show obvious variations, and the relationships between peak current, rise time, and frequency characteristics with approaching speed are depicted in Figure 12a–c.
As demonstrated in Figure 12a, the peak discharge current values rise with the approaching velocity of the electrodes for various applied voltages. A greater approaching velocity is often thought to be able to lessen multidischarges and the loss brought on by corona discharge during electrode movement [37]. It can be deduced that, at higher charge voltages, an increase in approach speed significantly affects the discharge current. Figure 12b shows that for both high and low voltages, the rise time of the discharge current decreases with approaching velocity. Meanwhile, as shown in Figure 12c, the induced voltage on the antenna for radiation receiving increases with approaching velocity, whereas the characteristic frequency remains in the range of 119–124 MHz under the current experimental conditions.

4. Discussion

4.1. Correlation between Pulse Frequency, Applied Voltage and Gap Distance

The behavior of the PCD pulse repetition frequency with respect to the applied voltage is very similar to that of the Trichel pulse, which is created in narrow gaps [38]. The repetition frequency was expressed using the following equation with the applied voltage as the variable:
f R = K   ( V     V 0 ) 2
In Equation (4), the unit of repetition frequency f R is kHz and the unit of applied voltage V is kV. K is the proportional constant, and V 0 is the coefficient that modifies the value of the applied voltage to more accurately represent the experimental data. The pulse repetition frequency becomes closer to zero as the applied voltage moves closer to V 0 , which implies that V 0 actually represents the breakdown voltage between the pantograph contact strip and the catenary wire. The fitting results are shown in Figure 8c and Table 4. As we can see, the proportion K reduces with the increase of the gap spacing, while the breakdown voltage V 0 increases with that of the gap spacing.
The fitted relation between K and dgap shows a power law:
K = 0.018   ·   d gap 0.513
where dgap is measured in millimeters. Additionally, the result of V 0 and dgap obeys a linear correlation, which is due to the linear relationship between the breakdown field strength and the gap distance.
V 0   =   0.788   ·   d gap + 4.136
Substituting Equations (5) and (6) into Equation (7), we obtain the formula for repetition frequency, which can be expressed as follows:
f R = 0.018   ·   d gap 0.513   ·   ( V     0.788   ·   d gap     4.136 ) 2 .

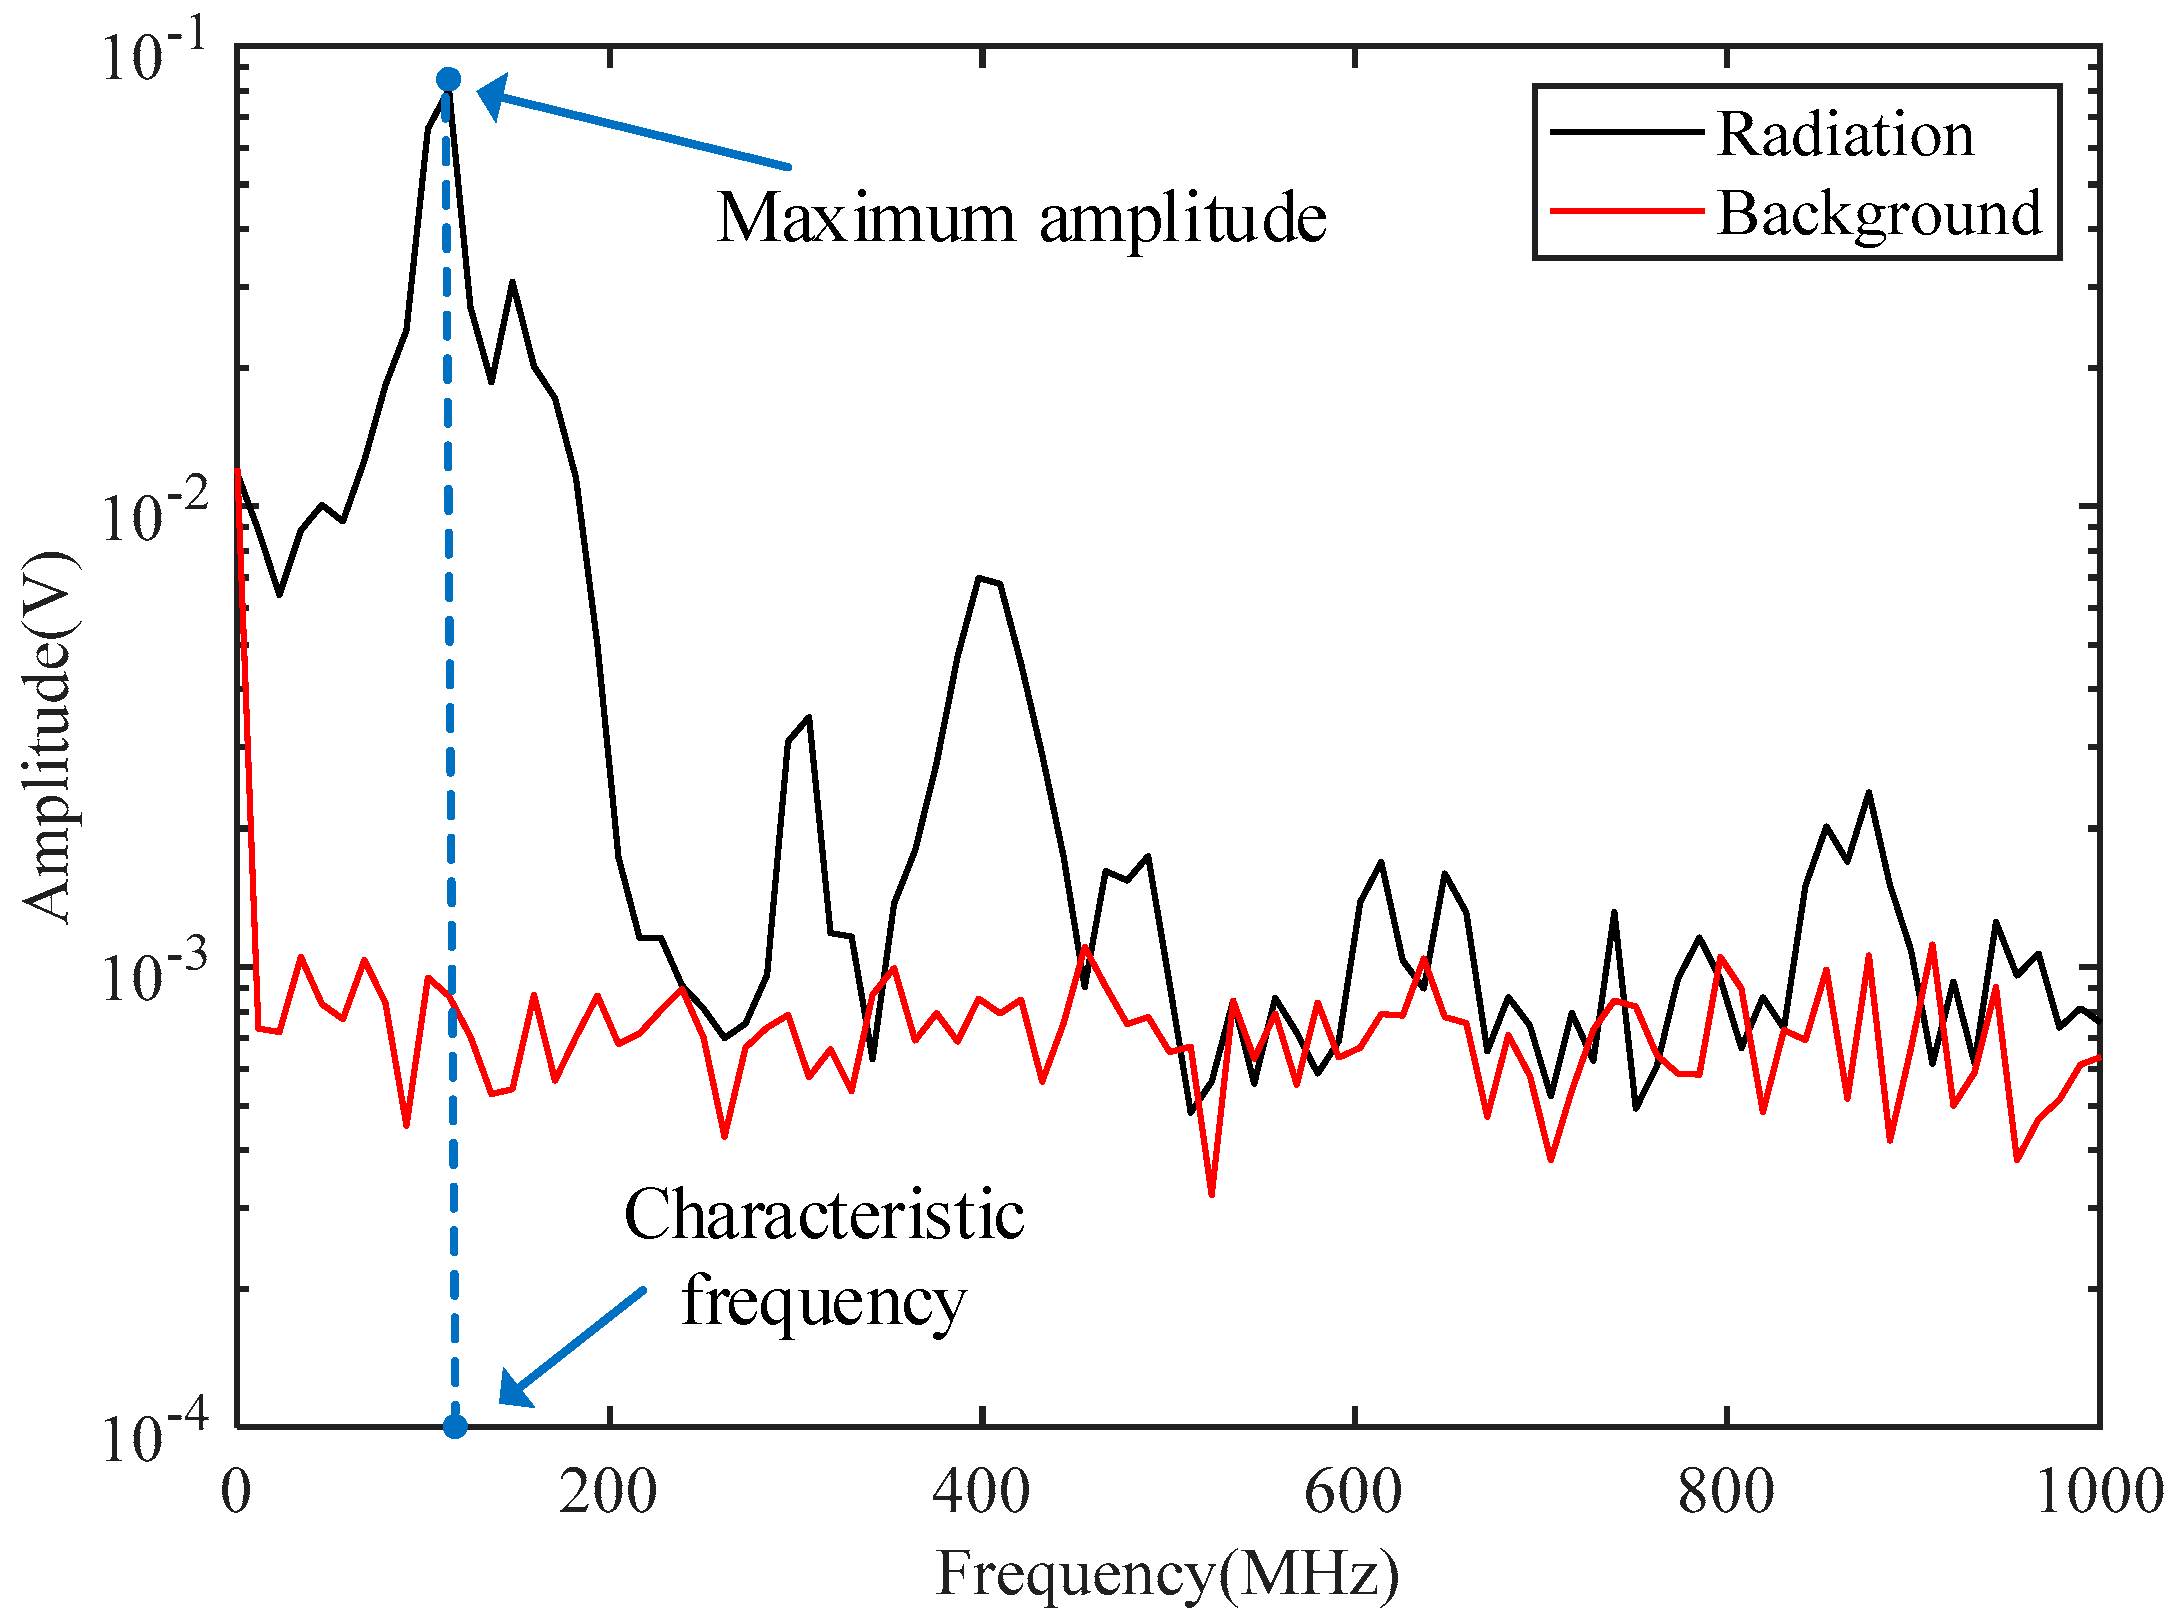
4.2. Analysis on the Characteristics of Electromagnetic Radiation Signals

The main characteristics for discharge EM radiation concerned in this study are the maximum amplitude and the corresponding characteristic frequency in the radiation spectrum. According to the above-mentioned results in Figure 8d and Figure 13, the maximum amplitude mainly relates to the gap spacing and the approaching velocity, whereas the characteristic frequency only relates to the electrode polarity.
It has been known that the radiation of arcing discharge, in general, is dominated by the abrupt arc current changes in the arc dynamics. The amplitude of the electric field Earc is proportional to the current rate of change I arc ˙ , as shown in Equation (1). The correlation between the maximum amplitude in the radiation spectrum and the rise rate of pulse current is shown in Figure 13. The current rise rate is calculated as I arc ˙ = A p / t r (unit: A/ns) with the experiment results presented above. The correlation coefficient is here used to show how the current rise rate relates to the radiation intensity. According to the calculation, the correlation coefficient of the maximum spectrum value and current rise rate with approaching velocity at different voltage levels is 0.97, 0.99, and 0.96, respectively, indicating that there is a strong direct relationship between them.
According to the field Equation (1), once the arc current behavior is known, one could then infer the frequency spectrum of the arc radiation. An arc current model was developed in a previous study [34], assuming that the arc inductance Larc and are resistance Rarc are approximately time-independent during the arc’s lifetime, and the gap between the electrodes is equivalent to a charged capacitor Cpc. The arc current can be calculated in a series RLC differential equation:
d 2 I arc d t 2 + 2 R arc L arc d I arc d t + 1 L arc C pc I arc = 0
The analytical expression of I arc obtained from the above equation is substituted into Equation (1), and the power spectrum of radiation can be approximated by neglecting the arc inductance as follows:
P arc ( ω )     ( A P T ) 2   ω 2 1 + ω 2 T 2
where T = R arc C pc is the current pulse width, and A P is peak current. P arc ( ω ) reaches half its maximum value at a frequency ω = 1 / R arc C pc , so the characteristic frequency can be obtained as follows:
f 0 = 1 2 π R arc C pc
R arc can be presented as R arc = ρ l / A , where l is the arc length, ρ is the arc resistivity, and A is the cross-sectional area of arc. The capacitor C pc between PC can be estimated by C pc = ε 0 A / l .
Therefore, Equation (10) can be expressed as follows:
f 0 = 1 2 π ε 0 ρ
As a result, the frequency with the maximum amplitude of the EM radiation spectrum is greatest depending on the arc resistivity and the air permittivity, while the effects of conditions, such as applied voltage and gap distance, as well as electrodes’ motion, are very limited.
In the test results in [35], the arc plasmas of various electrode materials have varying arc resistivity, which is a result of the different electron and ion densities in the electrode gap. When a negative high voltage is supplied to a copper wire, the densities of charged particles are greater than when a positive high voltage is applied to a copper wire, resulting in a lower arc resistivity and, consequently, a higher characteristic frequency. It can be inferred that the characteristic frequencies of radiation pulses generated by discharge are different when the traction voltage is positive and negative in different half cycles.

4.3. Mechanism of PC Relative Motion Affecting PCD Characteristics

Numerous earlier studies have discussed the impact of PC relative motion on the conduction and radiation effects of pantograph arcing [23,24,25,39]; however, further research is still needed to identify the physical mechanisms behind this impact. Based on the above-mentioned experiment results, this section discusses how the relative motion of the PC electrodes affects the discharge characteristics.
According to earlier research, there are certain links between the train’s speed and pantograph arcing EMI properties, both conducted and radiated. Actually, a faster train speed results in both a faster sliding action and a stronger vibration of PC, which increases the separation displacement. If the pantograph is regarded as a spring vibrator vibrating up and down, then the moving speed of the pantograph will increase as it bounces back and approaches the catenary wire. Therefore, increased moving speed causes not only faster lateral sliding speed but also quicker vertical approaching speed, especially in high-speed railroads.
The differences in discharge characteristics, as shown in Figure 11a,b, are not primarily caused by the lateral sliding velocity between PC. Additionally, the subsequent experiment results confirm that the critical factor affecting the discharge current, and the EM radiation produced by PCD is the approaching speed of PC. As shown in Figure 12a–c, a faster approaching speed results in a larger pulse current amplitude, a steeper front edge, and more intense EM radiation.
We further discuss the physical nature of the effect of approaching velocity on discharge characteristics with the experimental results. By comparing the impact of approaching velocity and gap spacing, it is possible to infer that the increase in approaching velocity and the reduction of gap spacing have a similar influence on the discharge characteristics of PC electrodes. It can be speculated that the velocity of approaching motion affects the discharge characteristics by changing the discharge gap, that is, the arc length.
According to the author of [40], there is a delay in the discharge process, known as the statistical time lag, which is the time interval between when the electric field strength surpasses the breakdown value and when the breakdown really starts. They concluded that arcing discharge did not occur simultaneously with the approaching electrode causing the electrical field to reach the breakdown value. Instead, it occurred after the statistical time lag that allowed the electrode to reduce the arc length prior to discharging.
Based on the above analysis, the time delay is responsible for the effect of approaching velocity on arc length, which has a significant impact on discharge characteristics. We reversely searched for the gap distance of each peak value on the fitted line in Figure 9a based on the peak currents of discharge pulses at various speeds in Figure 12a in order to deduce the change in arc length at various speeds.
Figure 14 establishes the equivalency relationship between approach velocity and arc length, illustrating the linear relationship between approach velocity and equivalent arc length. Based on the above analysis, we know that a faster approach speed shortens the length of the arc, thus changing the discharge characteristics, which proves the hypothesis on the physical nature of the effect of approaching velocity on discharge.

5. Conclusions

In this paper, a pendulum-type moving electrode discharge device is established to simulate the discharge process between pantograph and catenary wire in motion, and a series of time-domain measurements for discharge current and EM field are conducted to obtain the influence of different supply voltages, electrode gap distances, and the relative motion of pantograph and catenary. Through the analysis, the following conclusions can be drawn:
  • The discharge current pulse and the EM radiation pulse have a one-to-one relationship. The repetition frequency increases with the applied voltage and decreases as the gap spacing increases, which obeys the repetition frequency formula given in this paper. The peak current of a single pulse is related to the polarity of the high voltage applied to the catenary wire and has a positive relationship with the applied voltage;
  • The characteristics of EM radiation generated by pantograph discharge are analyzed in this paper. It is found that the maximum amplitude in the radiation spectrum changes in a way that is similar to the rise rate of the pulse current under different experimental conditions. On the other hand, the characteristic frequency stays the same no matter what voltage is applied or how far apart the gaps are and is only affected by the polarity of the high voltage on the copper wire;
  • The influence mechanism of PC electrodes’ relative motion on transient current and EM radiation was investigated. The different effects of the PC lateral sliding velocity and the PC vertical approaching velocity on the discharge characteristics were determined: the lateral sliding velocity has a negligible effect on the transient discharge, whereas a faster vertical approach will increase the pulse current peak, the rise edge steepness, and the radiation intensity. By comparing with the influence of gap distance, the influence mechanism of approaching velocity on discharge characteristics by affecting the arc length was explained.

Author Contributions

M.J. and S.L. contributed to the designation the experiments; M.H. and Y.Y. carried out the experiment; H.L. and S.L. contributed to the analysis on the experimental data; M.J. contributed to drafting the article; W.L. and Q.F. reviewed and edited the whole document and guided the research work. All authors contributed to the approval of the final version. All authors have read and agreed to the published version of the manuscript.

Funding

This research was funded by “the Natural Science Foundation of China”, grant number “61801309” and “51807123”. This work also received funding from the “Rail Transit Electromagnetic Environmental Effect Research and Test Platform Construction Project” by China Railway Signal & Communication Corp, grant number “2020ZX07”.

Institutional Review Board Statement

Not applicable.

Informed Consent Statement

Not applicable.

Data Availability Statement

Not applicable.

Acknowledgments

Many thanks to Hefei Cao, Jiangbo Zhou, and Yingjie Bai for their contributions in experiments and investigations.

Conflicts of Interest

The authors declare no conflict of interest.

References

  1. Midya, S.; Thottappillil, R. An Overview of Electromagnetic Compatibility Challenges in European Rail Traffic Management System. Transp. Res. Part C Emerg. Technol. 2008, 16, 515–534. [Google Scholar] [CrossRef]
  2. Mariscotti, A. Critical Review of EMC Standards for the Measurement of Radiated Electromagnetic Emissions from Transit Line and Rolling Stock. Energies 2021, 14, 759. [Google Scholar] [CrossRef]
  3. Seferi, Y.; Blair, S.M.; Mester, C.; Stewart, B.G. A Novel Arc Detection Method for DC Railway Systems. Energies 2021, 14, 444. [Google Scholar] [CrossRef]
  4. Li, M.; Wen, Y.; Sun, X.; Wang, G. Analysis of Propagation Characteristics of Electromagnetic Disturbance from the Off-Line of Pantograph-Catenary in High-Speed Railway Viaducts. Chin. J. Electron. 2020, 29, 966–972. [Google Scholar] [CrossRef]
  5. Wang, Y.; Liu, Z.; Mu, X.; Huang, K.; Wang, H.; Gao, S. An Extended Habedank’s Equation-Based EMTP Model of Pantograph Arcing Considering Pantograph-Catenary Interactions and Train Speeds. IEEE Trans. Power Deliv. 2016, 31, 1186–1194. [Google Scholar] [CrossRef]
  6. Song, Y.; Liu, Z.; Lu, X. Dynamic Performance of High-Speed Railway Overhead Contact Line Interacting With Pantograph Considering Local Dropper Defect. IEEE Trans. Veh. Technol. 2020, 69, 5958–5967. [Google Scholar] [CrossRef]
  7. Zhou, H.; Duan, F.; Liu, Z.; Chen, L.; Song, Y.; Zhang, Y. Study on Electric Spark Discharge between Pantograph and Catenary in Electrified Railway. IET Electr. Syst. Trans. 2022, 12, 128–142. [Google Scholar] [CrossRef]
  8. Ma, L.; Wen, Y.; Marvin, A.; Karadimou, E.; Armstrong, R.; Cao, H. A Novel Method for Calculating the Radiated Disturbance From Pantograph Arcing in High-Speed Railway. IEEE Trans. Veh. Technol. 2017, 66, 8734–8745. [Google Scholar] [CrossRef]
  9. Leva, S.; Morando, A.P.; Zich, R.E. On the Unwanted Radiated Fields Due to the Sliding Contacts in a Traction System. IEICE Trans. Commun. 2000, 83, 519–524. [Google Scholar]
  10. Tang, Y.; Zhu, F.; Cheng, Y. For Safer High-Speed Trains: A Comprehensive Research Method of Electromagnetic Interference on Speed Sensors. IEEE Instrum. Meas. Mag. 2021, 24, 96–103. [Google Scholar] [CrossRef]
  11. Crotti, G.; Femine, A.D.; Gallo, D.; Giordano, D.; Landi, C.; Luiso, M.; Mariscotti, A.; Roccato, P.E. Pantograph-to-OHL Arc: Conducted Effects in DC Railway Supply System. IEEE Trans. Instrum. Meas. 2019, 68, 3861–3870. [Google Scholar] [CrossRef]
  12. Xu, Z.; Gao, G.; Wei, W.; Yang, Z.; Xie, W.; Dong, K.; Ma, Y.; Yang, Y.; Wu, G. Characteristics of Pantograph-catenary Arc under Low Air Pressure and Strong Airflow. High Volt. 2021, 7, 369–381. [Google Scholar] [CrossRef]
  13. Midya, S.; Bormann, D.; Larsson, A.; Schutte, T.; Thottappillil, R. Understanding Pantograph Arcing in Electrified Railways—Influence of Various Parameters. In Proceedings of the 2008 IEEE International Symposium on Electromagnetic Compatibility, Detroit, MI, USA, 18–22 August 2008. [Google Scholar]
  14. Mariscotti, A.; Giordano, D. Experimental Characterization of Pantograph Arcs and Transient Conducted Phenomena in DC Railways. Acta Imeko 2020, 9, 10–17. [Google Scholar] [CrossRef]
  15. Pous, M.; Silva, F. APD Radiated Transient Measurements Produced by Electric Sparks Employing Time-Domain Captures. In Proceedings of the 2014 International Symposium on Electromagnetic Compatibility, Raleigh, NC, USA, 4–8 August 2014; IEEE: Piscataway, NJ, USA, 2014. [Google Scholar]
  16. Dudoyer, S.; Deniau, V.; Adriano, R.R.; Slimen, M.N.B.; Rioult, J.J.; Meyniel, B.; Berbineau, M.M. Study of the Susceptibility of the GSM-R Communications Face to the Electromagnetic Interferences of the Rail Environment. IEEE Trans. Electromagn. Compat. 2012, 54, 667–676. [Google Scholar] [CrossRef]
  17. Dudoyer, S.; Deniau, V.; Ambellouis, S.; Heddebaut, M.; Mariscotti, A. Classification of Transient EM Noises Depending on Their Effect on the Quality of GSM-R Reception. IEEE Trans. Electromagn. Compat. 2013, 55, 867–874. [Google Scholar] [CrossRef]
  18. Boschetti, G.; Mariscotti, A.; Deniau, V. Assessment of the GSM-R Susceptibility to Repetitive Transient Disturbance. Measurement 2012, 45, 2226–2236. [Google Scholar] [CrossRef]
  19. Romero, G.; Deniau, V.; Simon, E. Impact of the Measurement Methods on the Characterization of Transient Electromagnetic (EM) Interferences above 2 GHz in a Railway Environment. In Proceedings of the 2019 URSI Asia-Pacific Radio Science Conference (AP-RASC), New Delhi, India, 9–15 March 2019. [Google Scholar]
  20. Mariscotti, A.; Marrese, A.; Pasquino, N.; Schiano Lo Moriello, R. Time and Frequency Characterization of Radiated Disturbance in Telecommunication Bands Due to Pantograph Arcing. Measurement 2013, 46, 4342–4352. [Google Scholar] [CrossRef]
  21. Heddebaut, M.; Deniau, V.; Rioult, J. Wideband Analysis of Railway Catenary Line Radiation and New Applications of Its Unintentional Emitted Signals. Meas. Sci. Technol. 2018, 29, 065101. [Google Scholar] [CrossRef]
  22. Tellini, B.; Macucci, M.; Giannetti, R.; Antonacci, G.A. Conducted and Radiated Interference Measurements in the Line-Pantograph System. IEEE Trans. Instrum. Meas. 2001, 50, 4. [Google Scholar] [CrossRef]
  23. Midya, S.; Bormann, D.; Schutte, T.; Thottappillil, R. Pantograph Arcing in Electrified Railways—Mechanism and Influence of Various Parameters—Part I: With DC Traction Power Supply. IEEE Trans. Power Deliv. 2009, 24, 1931–1939. [Google Scholar] [CrossRef]
  24. Midya, S.; Bormann, D.; Schutte, T.; Thottappillil, R. Pantograph Arcing in Electrified Railways—Mechanism and Influence of Various Parameters—Part II: With AC Traction Power Supply. IEEE Trans. Power Deliv. 2009, 24, 1940–1950. [Google Scholar] [CrossRef]
  25. Wei, W.; Wu, J.; Gao, G.; Gu, Z.; Liu, X.; Zhu, G.; Wu, G. Study on Pantograph Arcing in a Laboratory Simulation System by High-Speed Photography. IEEE Trans. Plasma Sci. 2016, 44, 2438–2445. [Google Scholar] [CrossRef]
  26. Tellini, B.; Macucci, M.; Giannetti, R.; Antonacci, G.A. Line-Pantograph EMI in Railway Systems. IEEE Instrum. Meas. Mag. 2002, 4, 10–13. [Google Scholar] [CrossRef]
  27. Li, X.; Zhu, F.; Lu, H.; Qiu, R.; Tang, Y. Longitudinal Propagation Characteristic of Pantograph Arcing Electromagnetic Emission With High-Speed Train Passing the Articulated Neutral Section. IEEE Trans. Electromagn. Compat. 2018, 99, 1–8. [Google Scholar] [CrossRef]
  28. Jiang, R.; Zheng, Y. Series Arc Fault Detection Using Regular Signals and Time-Series Reconstruction. IEEE Trans. Ind. Electron. 2022. [Google Scholar] [CrossRef]
  29. Zhan, H.; Duan, S.; Li, C.; Yao, L.; Zhao, L. A Novel Arc Model for Very Fast Transient Overvoltage Simulation in a 252-KV Gas-Insulated Switchgear. IEEE Trans. Plasma Sci. 2014, 42, 3423–3429. [Google Scholar] [CrossRef]
  30. Zhu, G.; Gao, G.; Wu, G.; Gu, Z.; Wu, J.; Hao, J. Modeling Pantograph–Catenary Arcing. Proc. Inst. Mech. Eng. Part F J. Rail Rapid Transit. 2016, 230, 1687–1697. [Google Scholar] [CrossRef]
  31. Damas, M.C.; Robiscoe, R.T. Detection of Radio-frequency Signals Emitted by an Arc Discharge. J. Appl. Phys. 1988, 64, 566–574. [Google Scholar] [CrossRef]
  32. Gao, G.; Yan, X.; Yang, Z.; Wei, W.; Hu, Y.; Wu, G. Pantograph–Catenary Arcing Detection Based on Electromagnetic Radiation. IEEE Trans. Electromagn. Compat. 2019, 61, 983–989. [Google Scholar] [CrossRef]
  33. Fang, Q.; Jin, M.; Liu, W. Single-Arm Archimedean Spiral Antenna with Broadband Circular Polarization. Int. J. Antenn. Propag. 2021, 2021, 6623468. [Google Scholar] [CrossRef]
  34. Kim, C.J. Electromagnetic Radiation Behavior of Low-Voltage Arcing Fault. IEEE Trans. Power Deliv. 2009, 24, 416–423. [Google Scholar] [CrossRef]
  35. Xiong, Q.; Ji, S.; Liu, X.; Li, X.; Zhu, L.; Feng, X.; Gattozzi, A.L.; Hebner, R.E. Electromagnetic Radiation Characteristics of Series DC Arc Fault and Its Determining Factors. IEEE Trans. Plasma Sci. 2018, 46, 4028–4036. [Google Scholar] [CrossRef]
  36. Midya, S.; Bormann, D.; Schutte, T.; Thottappillil, R. DC Component From Pantograph Arcing in AC Traction System—Influencing Parameters, Impact, and Mitigation Techniques. IEEE Trans. Electromagn. Compat. 2011, 53, 18–27. [Google Scholar] [CrossRef]
  37. Yuan, Q.; Liu, S.; Zhang, X.; Wu, Z.; Wei, M. The Effect of Approach Speed and Charge Voltage on an Air Discharge. IEEE Trans. Electromagn. Compat. 2010, 52, 985–993. [Google Scholar] [CrossRef]
  38. Li, Z.; Zhang, B.; He, J.; Xu, Y. Influence of Gap Spacing on the Characteristics of Trichel Pulse Generated in Point-to-Plane Discharge Gaps. Phys. Plasmas 2014, 21, 1–7. [Google Scholar] [CrossRef]
  39. Guo, F.; Wang, Z.; Zheng, Z.; Zhang, J.; Wang, H. Electromagnetic Noise of Pantograph Arc under Low Current Conditions. Int. J. Appl. Electrom. 2017, 53, 397–408. [Google Scholar] [CrossRef]
  40. Pommerenke, D. On the Influence of the Speed of Approach, Humidity and Arc Length on ESD Breakdown. In Proceedings of the ESD Forum, Grainau, Germany, 2–3 December 1993. [Google Scholar]
Figure 1. The overall layout of the experiment: (a) Experiment photograph; (b) Simplified schematic. 1—pantograph contact strip, 2—catenary wire, 3—high voltage source, 4—insulated pendulum rod, 5—photoelectric timer, 6—current transformer, 7—antenna, 8—oscilloscope, 9—protective resistance.
Energies 15 05959 g001
Figure 2. Photoelectric timer details.
Energies 15 05959 g002
Figure 3. Schematic of velocity testing.
Energies 15 05959 g003
Figure 4. The self-designed SAAS antenna employed in receiving PCD radiation signals: (a) Physical appearance; (b) VSWR.
Energies 15 05959 g004
Figure 5. Waveforms of discharge current and EM radiation at different applied voltages within 5 ms under sampling rate of 12.5 GSa/s: (a) 20 kV, (b) 30 kV, and (c) 40 kV.
Energies 15 05959 g005aEnergies 15 05959 g005b
Figure 6. Definitions of waveform parameters of the pulse current.
Energies 15 05959 g006
Figure 7. Amplitude spectra for the radiation pulse and the background EM noise.
Energies 15 05959 g007
Figure 8. Variation of the PCD pulse characteristics for different gap spacings with the applied voltage (the pantograph is kept stationary): (a) Peak current; (b) Rise time; (c) Repetition frequency; (d) Maximum amplitude and characteristic frequency in radiation spectrum.
Energies 15 05959 g008
Figure 9. Variation of the PCD pulse characteristics with the gap spacing (the pantograph is kept stationary): (a) Peak current; (b) Rise time; (c) Repetition frequency.
Energies 15 05959 g009
Figure 10. Experimental schemes for sliding discharge and approaching discharge: (a) PCD generated by sliding motion of PC; (b) PCD generated by approaching motion of PC.
Energies 15 05959 g010
Figure 11. Variation of the PCD pulse characteristics at different sliding velocities: (a) Discharge current waveform; (b) EM radiation spectrum.
Energies 15 05959 g011
Figure 12. Characteristics of single pulse current and EM radiation at different approaching velocities: (a) Peak current; (b) Rise time; (c) Maximum amplitude and characteristic frequency in radiation spectrum.
Energies 15 05959 g012aEnergies 15 05959 g012b
Figure 13. Correlation of the discharge current and radiation voltage.
Energies 15 05959 g013
Figure 14. Relation between approaching velocity and equivalent arc length.
Energies 15 05959 g014
Table 1. Properties of experimental materials.
PropertiesExperimental Materials
Carbon Contact StripCu-Ag Alloy Catenary Wire
Type NumberDSA200CTA120
Resistivity (Ω·mm2·m−1)11.830.017 7
Density (g·cm−3)2.388.94
Cross-sectional area (mm3)700120
Length (m)0.41
Table 2. The relative velocity of PC corresponding to different swing angles.
Swing AngleTime Difference (s)Relative Speed (m/s)
15°0.330.79
30°0.181.47
45°0.122.15
60°0.12.62
90°0.073.64
135°0.064.52
Table 3. Experimental conditions.
Controlled ParametersSymbolsValues
Applied voltage U 0 10, 15, 20, 25, 30, 35, 40, 45, 50 kV
Gap spacing d gap 2.5, 5, 7.5, 10, 12.5, 15 mm
HV electrode polarity P Copper wire as Anode
N Copper wire as Cathode
PC relative velocity v 0, 0.79, 1.47, 2.15, 2.62, 3.64, 4.52 m/s
Table 4. Numerical fitting results of K (kHz/kV2) and V0 (kV).
PolarityPositiveNegative
Gap
Spacing dgap
KV0KV0
5.0 mm0.00818.5230.00808.491
7.5 mm0.00619.9130.006110.122
10.0 mm0.005711.4970.005912.521
12.5 mm0.005013.6450.004913.452
15.0 mm0.004616.5090.004316.489
Publisher’s Note: MDPI stays neutral with regard to jurisdictional claims in published maps and institutional affiliations.

