Article

Emission of Nitric Oxide during the Combustion of Various Forms of Solid Biofuels in a Low-Power Heating Device

by
Artur Kraszkiewicz
,
Artur Przywara
* and
Stanisław Parafiniuk
Department of Machinery Exploitation and Management of Production Processes, Faculty of Production Engineering, University of Life Sciences in Lublin, Głęboka 28, 20-612 Lublin, Poland
*
Author to whom correspondence should be addressed.
Energies 2022, 15(16), 5960; https://doi.org/10.3390/en15165960
Submission received: 25 July 2022 / Revised: 13 August 2022 / Accepted: 15 August 2022 / Published: 17 August 2022
(This article belongs to the Section I2: Energy and Combustion Science)

Abstract

:
In this study, in terms of the mechanisms of nitric oxide (NO) emissions, research was carried out to consider the impact of physical and chemical properties of wood and herbaceous biomass processed into pellets and briquettes in the course of the combustion process (in individual phases) in a low-power heating device. Combustion tests in the grate heating device showed statistically significant differences in the combustion process and thus carbon monoxide (CO), nitric oxide (NO), and sulfur dioxide (SO2) emissions in the fuel form and the combustion phase. In terms of assessing the ecological and energy parameters of the combustion process, the nitrogen content in biomass was not the most important factor indicating the formation of NO emissions. Usually, the strongest correlations were observed with the formation of NO emissions in the first phase of combustion, which was related to the emissions of CO and SO2. In the second and third flame phases, a significant reduction in NO emissions was observed, which was poorly positively dependent on the nitrogen contained in the fuel. In addition, it has been shown that the fuel geometric features greatly influence NO content in the exhaust gases in the first combustion phase. It is also indicated that further research is required, considering the possibility of reducing volatile flue gas fractions, which will lead to the development of low-emission and highly efficient biofuel combustion technologies in low-power heating devices.

1. Introduction

The increasingly faster process of eliminating fossil fuels in the energy sector favors the increased interest in biofuels produced from biomass, the use of which, especially near heating, is becoming a priority in the functioning of the European Union (EU) [1]. This approach is part of numerous strategies to improve the natural environment, including documents such as the European Green Deal, EU Energy Policy, or Poland’s Energy Policy [2,3,4]. In addition, it fits in with the concepts of broad social impact related to sustainable production and economy without waste (Zero Waste), simultaneously combining economic, social, environmental, and ethical goals [5].
The use of plant biomass as an energy carrier is vital due to the zero balance of the carbon cycle (C) in nature. It plays a critical role in reducing carbon dioxide (CO2) emissions and creates an alternative to fossil fuels as a renewable energy source. The use of biofuels must benefit the environment regarding CO2 emissions and other components of exhaust gases. At the same time, there are certain aspects of biomass combustion in low-power heating devices, which indicate the possibility of emissions during the combustion of solid biofuels in the scope of suspended dust (PM) and nitrogen oxides (NOx) [6,7,8].
During research on many types of plant biomass, often processed into various forms of solid biofuels in terms of their usefulness for energy purposes in various periods of growth [9,10,11], storage time [12], and terms of the impact of biomass properties on the combustion process [13,14], the following chemical and physical properties were most often used: moisture content, volatile matter, ash and its properties, higher heating value—lower heating value, elemental composition corresponding to the content of carbon, hydrogen, nitrogen, sulfur, and oxygen. As presented in the works of Theerarattananoon et al. [15] and Skonecki et al. [16], their geometrical features are also important, such as particle size, bulk, and bulk density.
In terms of the combustion process, the amount of energy produced, and the emissivity of biofuels, the most critical are their chemical properties expressed in carbon, hydrogen, nitrogen, sulfur, and oxygen content. In plant biomass, the carbon content is kept at about 40–55% [11,14]. Obernberger et al. [17] indicate that the share of carbon in wood-based fuels (including bark) is more significant than those for herbaceous biofuels. According to the equations, the approximation indicates a greater concentration of energy per unit of wood mass. Higher hydrogen content also increases the amount of energy in the fuel, but in the biomass, the hydrogen content is very even and usually ranges from 5 to 6%. Nitrogen and sulfur in biomass are present in much smaller amounts, at a few percent [14]. An increase in carbon and hydrogen content positively affects its energy value. In contrast, an increase in the share of nitrogen contributes to a reduction in energy value. A higher nitrogen concentration occurs in the bark, young wood of short rotation crops (willow and poplar), and herbaceous biomass, e.g., rape or grass straw [14,17].
As indicated by the work of Ozgen et al. [6] and Nussbaumer [7], during fuel combustion, nitrogen contained in it is almost completely converted to the gaseous form of nitrogen (N2) and nitrogen oxides (NOx)—nitric oxide (NO), nitrous oxide (N2O), and nitrogen dioxide (NO2). In these studies [6,7] and others [17,18,19,20], it was also shown that nitrogen oxide formation is differentiated and dependent on the boiler type and the fuel type. It is also essential that nitrogen oxides can be produced in three different reaction pathways. The first, thermal, concerns the formation of these compounds due to nitrogen reacting with reactive oxygen species at temperatures > 1300 °C [21,22,23]. Due to the relatively low temperature in solid biofuel combustion installations (about 800–1200 °C), thermal NOx formation is only temporary and of little importance. The second path relates to the formation of NOx from fuel oxidation (in a series of basic reaction steps). It is the most critical mechanism for forming nitrogen oxides in biomass combustion. Thus, NOx emission increases with the fuel’s nitrogen content [6,24,25], which is also significant when using nitrogen-containing biomass fuels [11,13,14,26]. The third path considers such events as automatic fuel feeding, the geometry of the boiler chamber, and the type of combustion technology. They are the main variables influencing NOx formation [27,28].
According to Nussbaumer [7], problems with excessive NOx emissions appear at the weight share of nitrogen from 0.6%. It is especially true of cereal straw, grasses, and fruit residues. According to Obernberger et al. [17], an effective reduction in these pollutants can be achieved by an optimized combustion process, with adequate mixing between the fuel and air, sufficient retention time (>1.5 s) at high temperature (>850 °C), and a low excess air ratio. A staged combustion of these fuels also reduces thermal NOx and SO2 emissions [29]. Eskilsson et al. [30] state that the combustion process should compromise nitrogen oxides, combustion hydrocarbons, and carbon monoxide emissions. Reducing excess air can help reduce NOx emissions and increase carbon monoxide (CO) emissions. It also increases efficiency, since a significant excess of air helps to reduce losses due to incomplete combustion.
Nussbaumer [7] also reports that pollutants such as NOx and particulates are formed due to fuel components such as N, K, Cl, Ca, Na, Mg, P, and S. Hence, biomass-powered heating devices exhibit relatively high NOx emissions and submicron particulate matter. Obaidullah et al. [31] report that the combustion of biomass fuels in small heating devices is an essential source of the emission of particles smaller than 1 μm.
Nevertheless, in addition to the chemical characteristics, the physical characteristics of biofuels are also significant. In terms of energy obtained from biofuels, the moisture content of the fuel is critical, which, in connection with the higher heating value, is expressed as a lower heating value. The moisture content in biofuels can be reduced and normalized in seasoning or producing compact fuels [8,32]. The processing of biomass and the production of formed fuels mainly affect their geometrical features such as particle size (length, diameter) and density. There are reports in the literature showing the influence of geometrical features on the combustion process [33,34], but they do not refer to the emerging emissions of CO, NOx, and SO2.
The combustion process and the generated emissions depend not only on the fuel used but also on the type of heating device. In single-family housing, individual heat sources (fireplaces, stoves, boilers) of low power up to 20 kW are most often used. This group of traditional heating devices is characterized by manual, periodic fuel dosing on the grate and ignition from the bottom, which translates into higher CO, NOx, and SO2 emissions. In modern devices with effective control systems for the concentration of combustion products, the presence of pollutants can be reduced to a level close to zero. While most of the problems arising from the operation of such devices, also in terms of maintaining the low emission regime, can be managed, the problem arises in the field of NOx emissions, especially using biofuels based on herbaceous biomass to power them. Many studies indicate concerns with such emissions, regardless of the combustion technique [6]. At the same time, they indicate a significant differentiation of NOx emissions in individual combustion phases [35,36,37]. Many biomass-powered household appliances do not apply NOx reduction methods, such as air staging, selective catalytic reduction (SCR) techniques, and catalysts, which significantly reduce NOx, especially in high-power heating appliances [27,38,39].
Additionally, regarding the social impact of NOx emission reduction, it should be noted that a large part (40%) of the environmental impact of modern wood-fired heating devices may be related to NOx emission [6,7]. In his research, Bowman [40] already indicates the importance of monitoring and reducing NOx emissions to the atmosphere because nitrogen oxides contribute to photochemical smog, the formation of acid rain precursors, ozone destruction in the stratosphere, and global warming. In his opinion, over the past 150 years, the global emission of nitrogen oxides to the atmosphere has been steadily increasing. A significant proportion of nitrogen oxide emissions are attributed to the combustion of biomass and fossil fuels. Increasingly stringent regulations on NOx emissions are being implemented in many industrialized countries. These regulations have contributed to and continue to drive the development of NOx control techniques. The standards are set at 200 mg·m−3, and in these restrictive versions, even 100 mg·m−3 is very difficult to meet by devices powered by herbaceous biomass [41,42,43,44]. It is also essential, according to Jarosiński [45], that nitrogen oxides (NO and NO2) are not distinguished following the regulations during measurements, but only determined in the form of NOx, but knowing their actual relationship to the intended NOx emission in the exhaust gas would be interesting from the standpoint the possibility of influencing the further course of this composition, as well as due to the influence of individual oxides on the environment. In most fossil fuel combustion appliances, the measured NOx emissions in the exhaust gas contain more than 90% NO and relatively minor NO2. The differences in the chemical activity of various nitrogen compounds also affect the environment.
All the essential aspects mentioned herein relating to the use of formed biofuels in domestic heating appliances refer to their selected physical and chemical characteristics or the type of heating appliance in question. In this study, an attempt was made to verify the impact of the fuel geometric features with chemical features on the course of the combustion process (recognizing its phases) and the generated emission, with particular emphasis on NO emissions.
Therefore, the aim of the research was in the aspect of nitric oxide emissions, to consider the impact of physical and chemical properties of wood and herbaceous biomass processed into pellets and briquettes on the combustion process (in individual phases) in a low-power heating device.

2. Materials and Methods

2.1. Characteristics of Raw Materials and Fuel

Six plant materials were selected for the research. It was primarily herbaceous biomass such as wheat, rye, oat straw, Fagopyrum, and meadow hay. In addition, birch sawdust was also used in the research. The mentioned biomass is generally available in Poland in the Lubelskie Voivodeship as by-materials of agricultural and forestry production. Pellets and briquettes are often produced and used as biofuels in home heating devices. The raw materials obtained for the research were processed into pellets (P) and briquettes (B). Before the compaction process, their types were ground in an amount of 100 kg in a hammer mill using sieves with a hole diameter of 10 mm. Furthermore, using the classical dryer-weight method following the EN ISO 18134-3:2015 standard (weighing accuracy 0.0001 g) [46], their moisture was measured, which, if necessary, by drying at room temperature or humidifying with water, was found to be about 16–18% as optimal in the thickening process [47,48]. The shredded material in each group of raw materials was divided into two parts, which were pelleted and briquetted. Pelleting took place in a granulator with a flat matrix with an opening diameter of 8 mm and a thickness of 28 mm, rotational speed of 2 rolls 11.6 rad·s−1, and pelleting capacity of 80–100 kg·h−1. On the other hand, briquetting was carried out in a hydraulic briquetting machine with a 50 mm thickening sleeve diameter, compaction pressure of 100 bar and obtaining a capacity of 40–50 kg·h−1. The technical parameters of these machines were presented in previous publications [35,48,49].
The moisture content (MC) of the produced biofuels was analyzed according to the same method as the moisture content in the raw materials. The carbon (C), hydrogen (H), and nitrogen (N) content was determined by an automatic analyzer according to the instrumental method CEN/TS 15104:2006 [50] (the accuracy of the determination: C—0.5%; H—0.3%; N—0.15%), while the sulfur (S) content (accuracy 0.15%) was determined by the PN-G-04584:2001 method [51]. Other technical parameters of the produced fuels, such as the content of volatile matter (VM—accuracy 0.3%), ash (AC—accuracy 0.1%), and higher heating value (HHV—accuracy 0.01 MJ kg−1) converted to the lower heating value (LHV), were determined with the following methods: PN-G-04516:1998 [52], EN ISO 18122:2016 [53], EN ISO 18125:2017 [54]. Physical parameters, such as the dimensions of the produced biofuels and their density, were determined based on measurements: diameter (D—accuracy 0.1 mm) and length (L—accuracy 0.1 mm) directly with a caliper of individual fuel pellets, according to EN ISO 16127:2012 [55]. On this basis, their volume (Vf) was calculated from the formula for the volume of the cylinder and the its surface is (Sf). Knowing the mass of individual granules or briquettes and their volume, their density (VD) was calculated as the ratio of mass to volume and expressed in kg·m−3. Additionally, the following equation was used to calculate the geometric properties index (GPI), which, by its definition, considered the basic geometric features of fuels [33]:
G P I = V D V f S f 2
where: GPI—geometrical properties index (kg·m−1); VD—biofuel density (kg·m−3); Vf and Sf—respectively, volume (m3) and surface (m2) of the fuel particles.
All the determinations mentioned above and measurements were performed in working conditions, in triplicate, and their values are presented in the tables.

2.2. Biofuel Combustion Experiments

The measuring system used during research on the combustion of produced briquettes and pellets consisted of a grate boiler with a nominal thermal power of 10 kW and 80% efficiency. A rectangular water jacket surrounded the combustion chamber with dimensions of 0.26 × 0.3 × 0.45 m. During the tests, the water temperature at the boiler outlet ranged from 70 °C to 90 °C. The average temperature difference between the outlet and return was lower by 10 K to 25 K. The air to the boiler was fed under the grate thanks to a fan, which boiler controller adjusted to work with a constant blowing speed of 1 m·s−1, which was measured at the entrance to the combustion chamber with an airflow meter with a measurement accuracy of ±0.1 m·s−1. Considering the dimensions of the rectangular air supply duct, it was about 12 m3·h−1. Such settings for this combustion chamber guaranteed an optimal excess of air in the range of 1.2–1.6. The boiler was connected to a 3 m high chimney with an internal diameter of 130 mm.
The diagram of the test stand with the sampling system is shown in Figure 1.
The fuel collected for the tests, the dimensions of which are given in Table 1, was combustion periodically in 1 kg portions. The process was carried out from the moment of ignition initiation by placing the fuel on a stabilized layer of heat until the end of the reaction, which was assumed to reduce the temperature of the exhaust gases to 200 °C. It corresponded to stabilized conditions corresponding to everyday use with refueling in this type of device. The exhaust gases were taken from the chimney (Figure 1).
The combustion process timing and the measurements of the composition and temperature of the exhaust gases were carried out throughout the entire combustion process. The measuring probe was connected to the exhaust gas dryer, from which the exhaust gases were sent to the exhaust gas analyzer. A portable exhaust gas analyzer based on infrared sensors (NDIR) for the following gases was used during the tests: CO2, CO, NO, and SO2. For this device, the relative measurement accuracy for each measured exhaust gas component was 3%. The measurement of O2 in the exhaust gas was carried out with an electrochemical probe with an accuracy of 5%. In the exhaust gas sampling probe, there was a K-type thermocouple with which the temperature was measured—accuracy of measurement ±2 °C.
The results recorded during the tests were sent from the analyzer to a PC, which was used to verify the distribution of the results in the EXCEL spreadsheet. Combustion phases were determined based on changes in CO and CO2 emissions as specified in the works [34,37,38]: I—combustion start characterized by the flameless emission of volatile matter of the fuel up to the maximum CO content, II—essential combustion, which is manifested by the presence of a flame and rapid burning of volatile matter to a minimum of CO in the exhaust gas, III—afterburning of fuel, which is characterized by the disappearance of the flame and combustion of fuel residues in the heating layer and a renewed increase in CO emissions. Three repeated measurements were made in each variant, detailing the arithmetic means for phases.
The following relationship was used to calculate the air/fuel ratio (λ) [7]:
λ = 20.95 20.95 O 2
where
  • O2—oxygen content by volume in dry gas (%)
Using the quotient of the mass of the burnt portion of fuel to the time of its combustion, the fuel demand was calculated, expressed in kg·h−1. The obtained CO, NO, and SO2 concentrations in the flue gas are shown in graphs as emissions of the dry flue gas volume flow with 10% oxygen and standard conditions (mg·m−3) at 0 °C and 1013 mbar according to the guidelines contained in the PN-EN 303-5:2012 standard [56].
The results of the research were statistically analyzed in the STATISTICA 13.1 program. The compliance of the results with the normal distribution was verified with the Shapiro–Wilk test. On the other hand, the assessment of the homogeneity of the variance was performed with the Brown–Forsyth test. Then, in individual phases, ANOVA was performed for factor systems, where the grouping factors were the raw materials from which the agglomerates were made (wheat straw, rye, oat straw, Fagopyrum straw, meadow hay, and sawdust), as well as the form of the agglomerate—pellets and briquettes. On the other hand, the Pearson correlation test described the relationship between individual variables. Statistical significance was set at p < 0.05.

3. Results

The physical and chemical parameters of the biofuels are presented in Table 1.
Two processes of compacting raw materials into pellets and briquettes were carried out during the research, resulting in a significant increase in density to values ranging from 926 (pellets made of birch sawdust) to 1130/1132 kg·m−3 (pellets made of wheat straw/briquettes made of hay). The basic differences of these biofuels resulted from a different compaction process, which resulted in a significant diversification of their dimensions (diameter and length of particles), creating two groups of pellets and briquettes. The pellets with the same diameter of 8 mm were about 30 mm long. Only the birch sawdust pellets were shorter, as their average length was 11 mm. On the other hand, in the group of briquettes, the diameter of which was 50 mm, the length was more varied and ranged from 15 to 30 mm for biofuels from herbaceous biomass, and for the sawdust product, it was even less than 50 mm. Additionally, at the GPI values, both within pellets and briquettes, products from wood raw materials differ from other biofuels produced. At the same time, the values of this indicator for briquettes were from 6 times (biofuels made from wheat straw) to even 30 times (biofuels from birch sawdust) higher than for pellets. The thickening process also reduced and stabilized the moisture content in the agglomerate to the level of about 10%—Table 1. However, in terms of chemical properties, a little diversification was observed the collected raw materials in terms of volatile matter content (the range of these values ranged from less than 68% to slightly over 73%) and carbon content (the range of these values was less than 44% to just over 49%) and hydrogen content (their range was from 5.22% to 5.95%). It is worth noting here that the maximum values were for birch sawdust. Furthermore, the collected raw materials differed in terms of nitrogen content (0.22–1.4%), sulfur content (0.06–0.61%) and ash content (1.3–9.2%). The proportions of hydrogen carbon, nitrogen, and ash determine the higher heating value and the lower heating value relating to the moisture content. During the research, the values of this parameter ranged from 15.47 (oat straw) to 16.34 MJ·kg−1 (birch sawdust)—Table 1.
The combustion parameters of the produced solid biofuels are shown in Table 2.
The observed differences in the registered parameters were visible due to the use of pellets and briquettes made of various herbaceous materials and wood biomass for the tests. The combustion process was carried out in the same heating device with the same combustion chamber and the same settings of the fan supplying air at the same speed of 1 m·s−1 (12 m3·h−1). The differentiation of the combustion process in the scope of two forms of fuel resulted in a much greater demand for fuel for the combustion of pellets than for briquettes. The variability of the combustion process also translated into the CO2 content in the exhaust gas and its temperature. In the first phase of pellet combustion, in most cases, a much lower CO2 content in the flue gas was noticed, which also translated into lower flue gas temperatures than in the same briquette combustion phase. On the other hand, when burning wooden raw materials (briquettes and especially pellets), these parameters’ values were observed to indicate no problems with starting the combustion of these biofuels. The differences between pellets and briquettes in the next second combustion phase were less noticeable, and only Fagopyrum biofuels combustion was the worst. On the other hand, the third phase of combustion in terms of these parameters was very diverse and resulted from the advancement of the course of the previous phases—Table 2. The variability of the combustion course of various forms and types of fuel is also observed based on the lambda index, which is indirectly dependent on CO2. In the first phase of combustion, excess air is visible for oat and Fagopyrum straw pellets, which means that the ignition of these fuels is more complicated. In the second phase, in most cases, the lambda values fluctuated around 2; however, the issues with combustion visible in the first phase for oat and Fagopyrum straw pellets were also visible for briquettes. Regarding this indicator, the third combustion phase was also the result of the course of the earlier phases; differences concerning the others were visible for Fagopyrum and wheat straw—Table 2.
The average values of the registered CO emissions during combustion of prepared solid biofuels in individual combustion stages are shown in Figure 2.
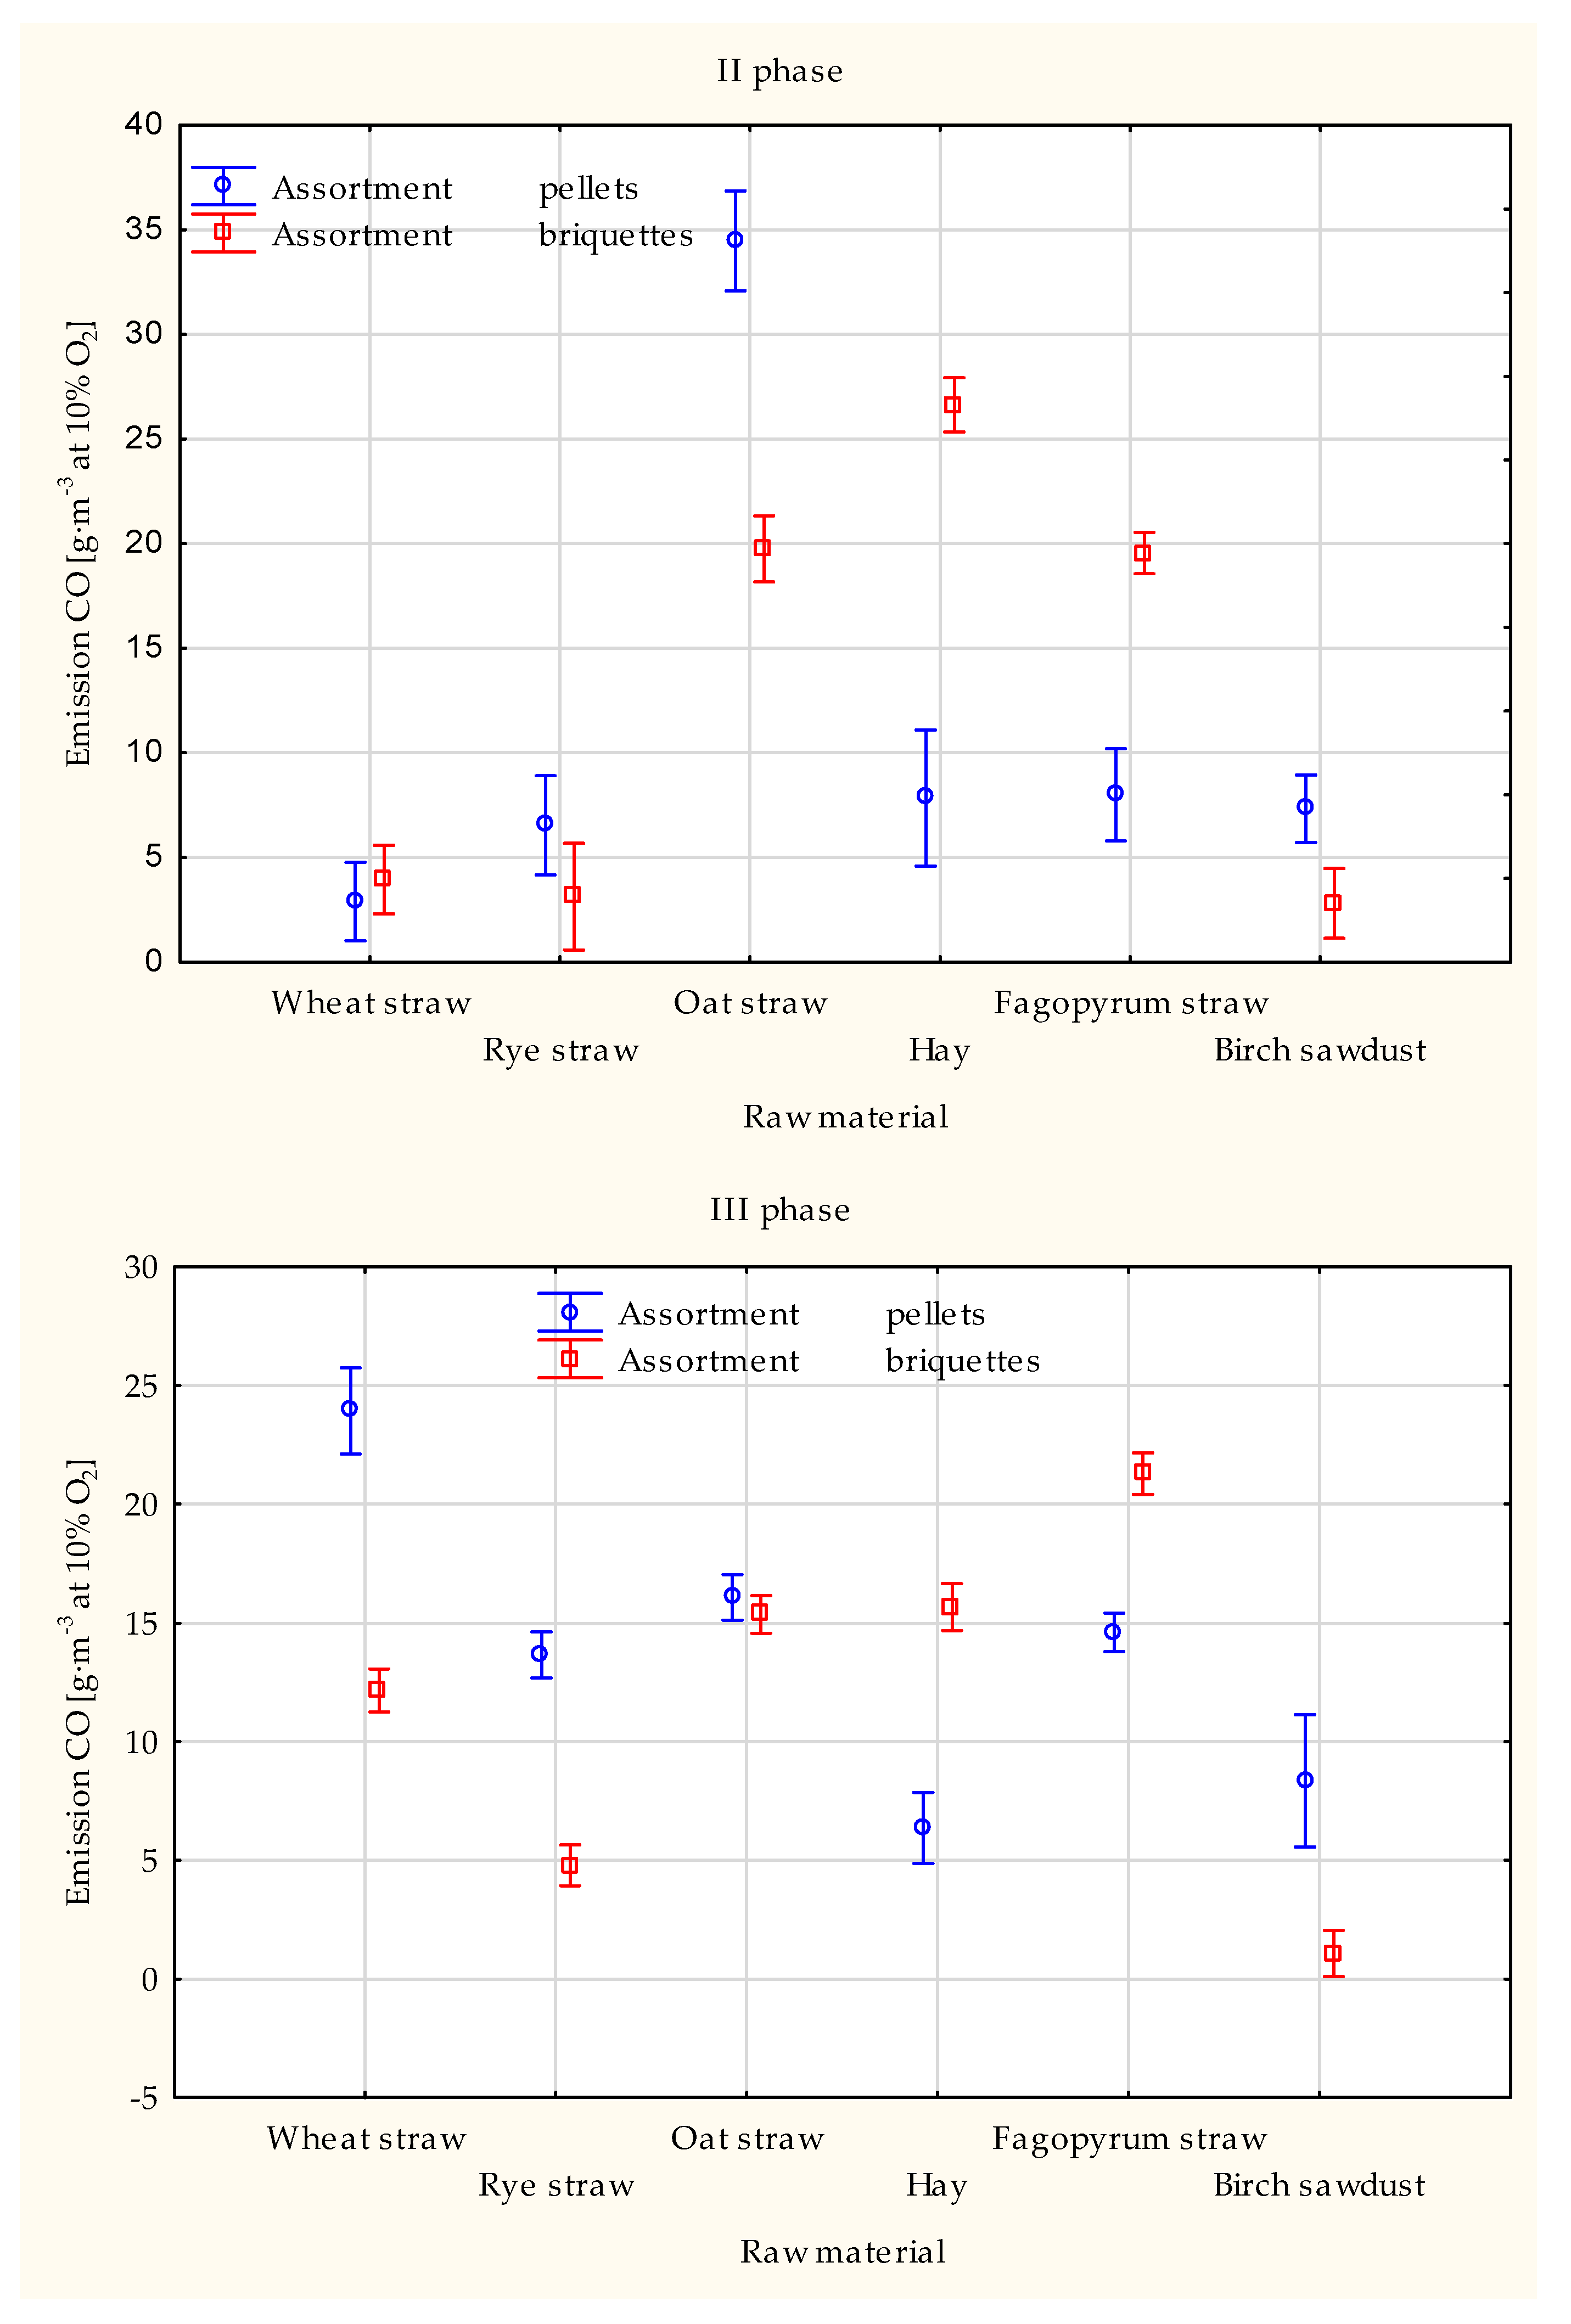
During the combustion tests, the emission of carbon monoxide was the highest in the first combustion phase. It was significantly reduced in phase II and increased again in phase III. The first phase shows a significant disproportion between wood pellets and other biofuels. There is a visible tendency towards higher CO emissions during pellets’ combustion than briquettes in this phase. In phase II, these relationships are blurred. Higher emissions are noticeable when burning oat straw pellets and briquettes, hay briquettes, and Fagopyrum straw briquettes. On the other hand, the differentiation between the raw materials is more significant in the third combustion phase. In most cases, the CO emission in this phase is more significant during the combustion of pellets than when briquettes are combustion. The increase in CO emissions in phase III, after the flame has gone out, indicates the presence of the deposit of non-combustible biomass residues with volatile parts, which evaporate during this time. Perhaps the constant air flow through the bed during the test was already too high in this part and reduced the flame. It was also observed that briquettes made of oat straw, hay, and Fagopyrum straw combustion were much worse, slower, and had a more visible lower flame than other biofuels. For them, the CO emission in Phase II was much higher, but in Phase III, the difference from other biofuels decreased—Figure 2.
These results indicate problems related to the volatile compounds characteristic of biomass fuels, which translates into higher CO values, especially in phase 1, when burning, on the grate. Additionally, ignition and flame propagation in the bed is much more difficult with fuels in the form of pellets made of herbaceous biomass than with briquettes. Wood biofuels ignite more quickly, but difficulties in accessing oxygen mean that they emit more CO. Under the test conditions of pellet combustion, they were the most minuscule granules. The subsequent phases II and III in terms of CO emissions result from the ignition efficiency and the speed of controlling the flame in the deposit, thus burning the deposit.
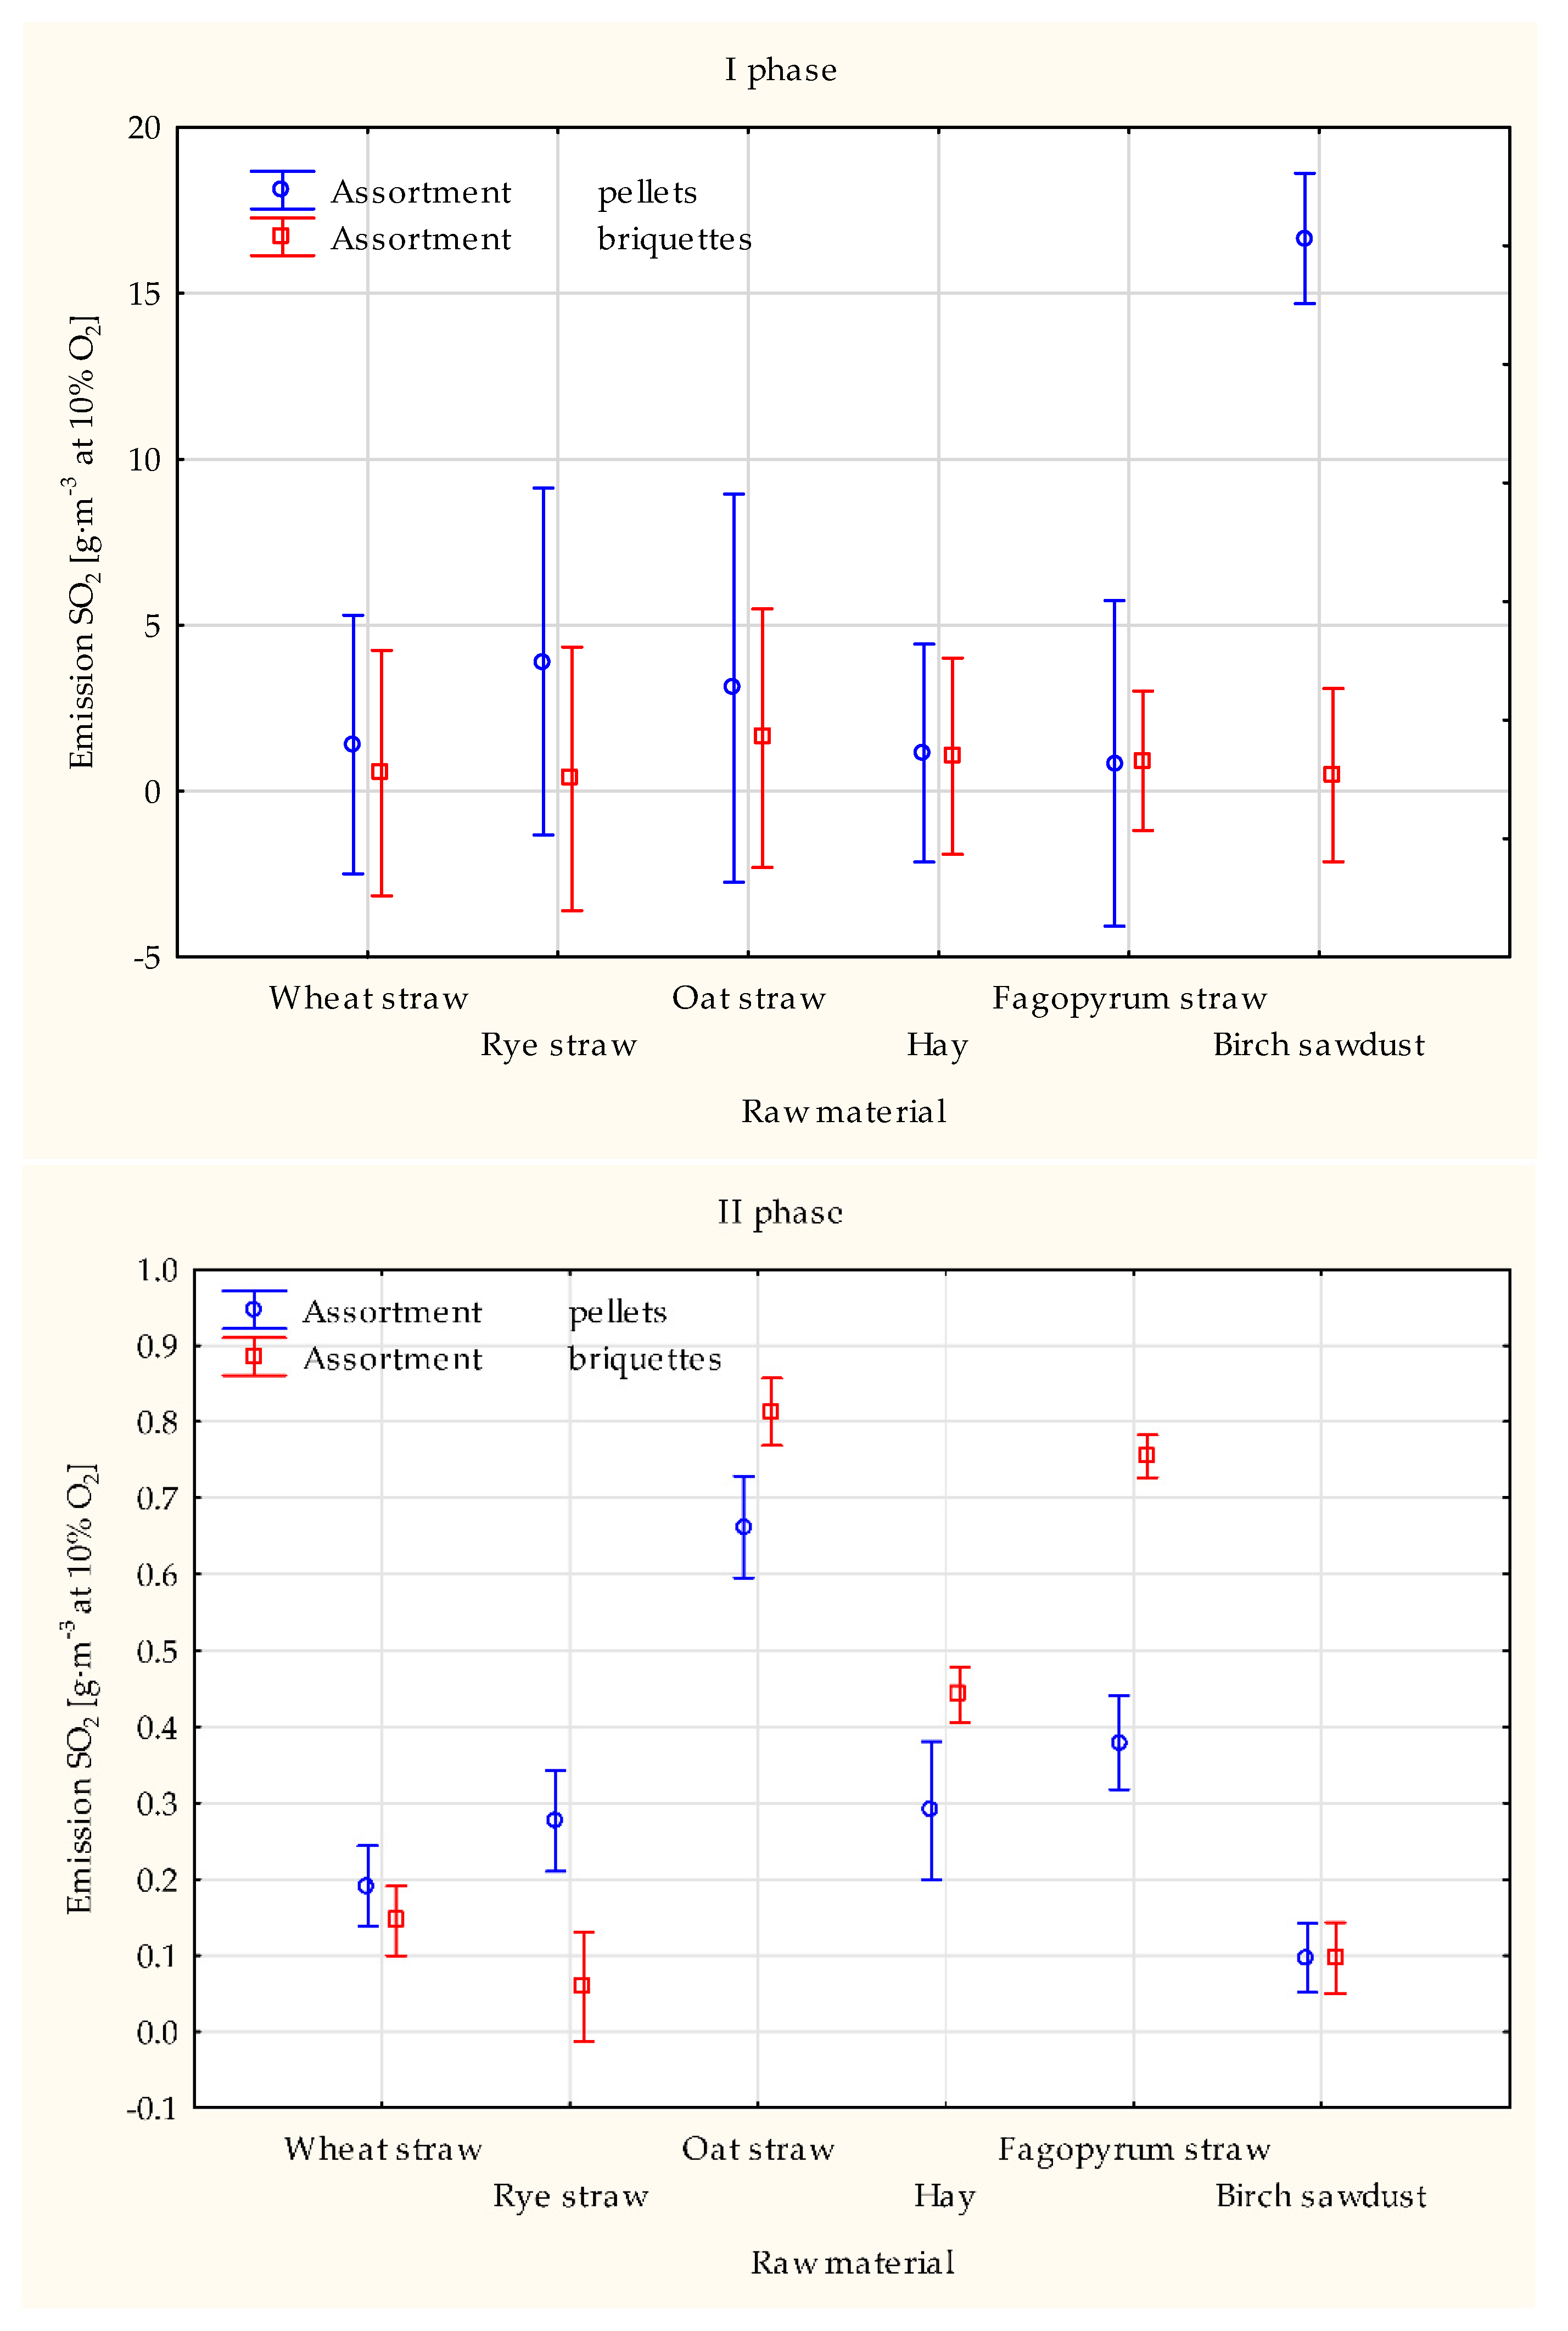
The average values of the registered SO2 emission during the combustion of the prepared solid biofuels in individual combustion phases are shown in Figure 3. During combustion tests, sulfur dioxide emission, similarly to CO emission, was the highest in the first phase of combustion; then, in phases II and III, it was significantly reduced. Furthermore, a significant disproportion between wood pellets and other biofuels is visible in the first phase. At this stage, there is a clear tendency towards higher SO2 emissions during the combustion of pellets than briquettes. In phase II, these relationships are blurred. Higher emissions are noticeable during the combustion of pellets and briquettes made of oat straw, hay, and Fagopyrum straw. On the other hand, the differentiation between the raw materials is more significant in the third combustion phase. In most cases, the SO2 emission is more significant during briquettes combustion than when pellets are combustion—Figure 3.
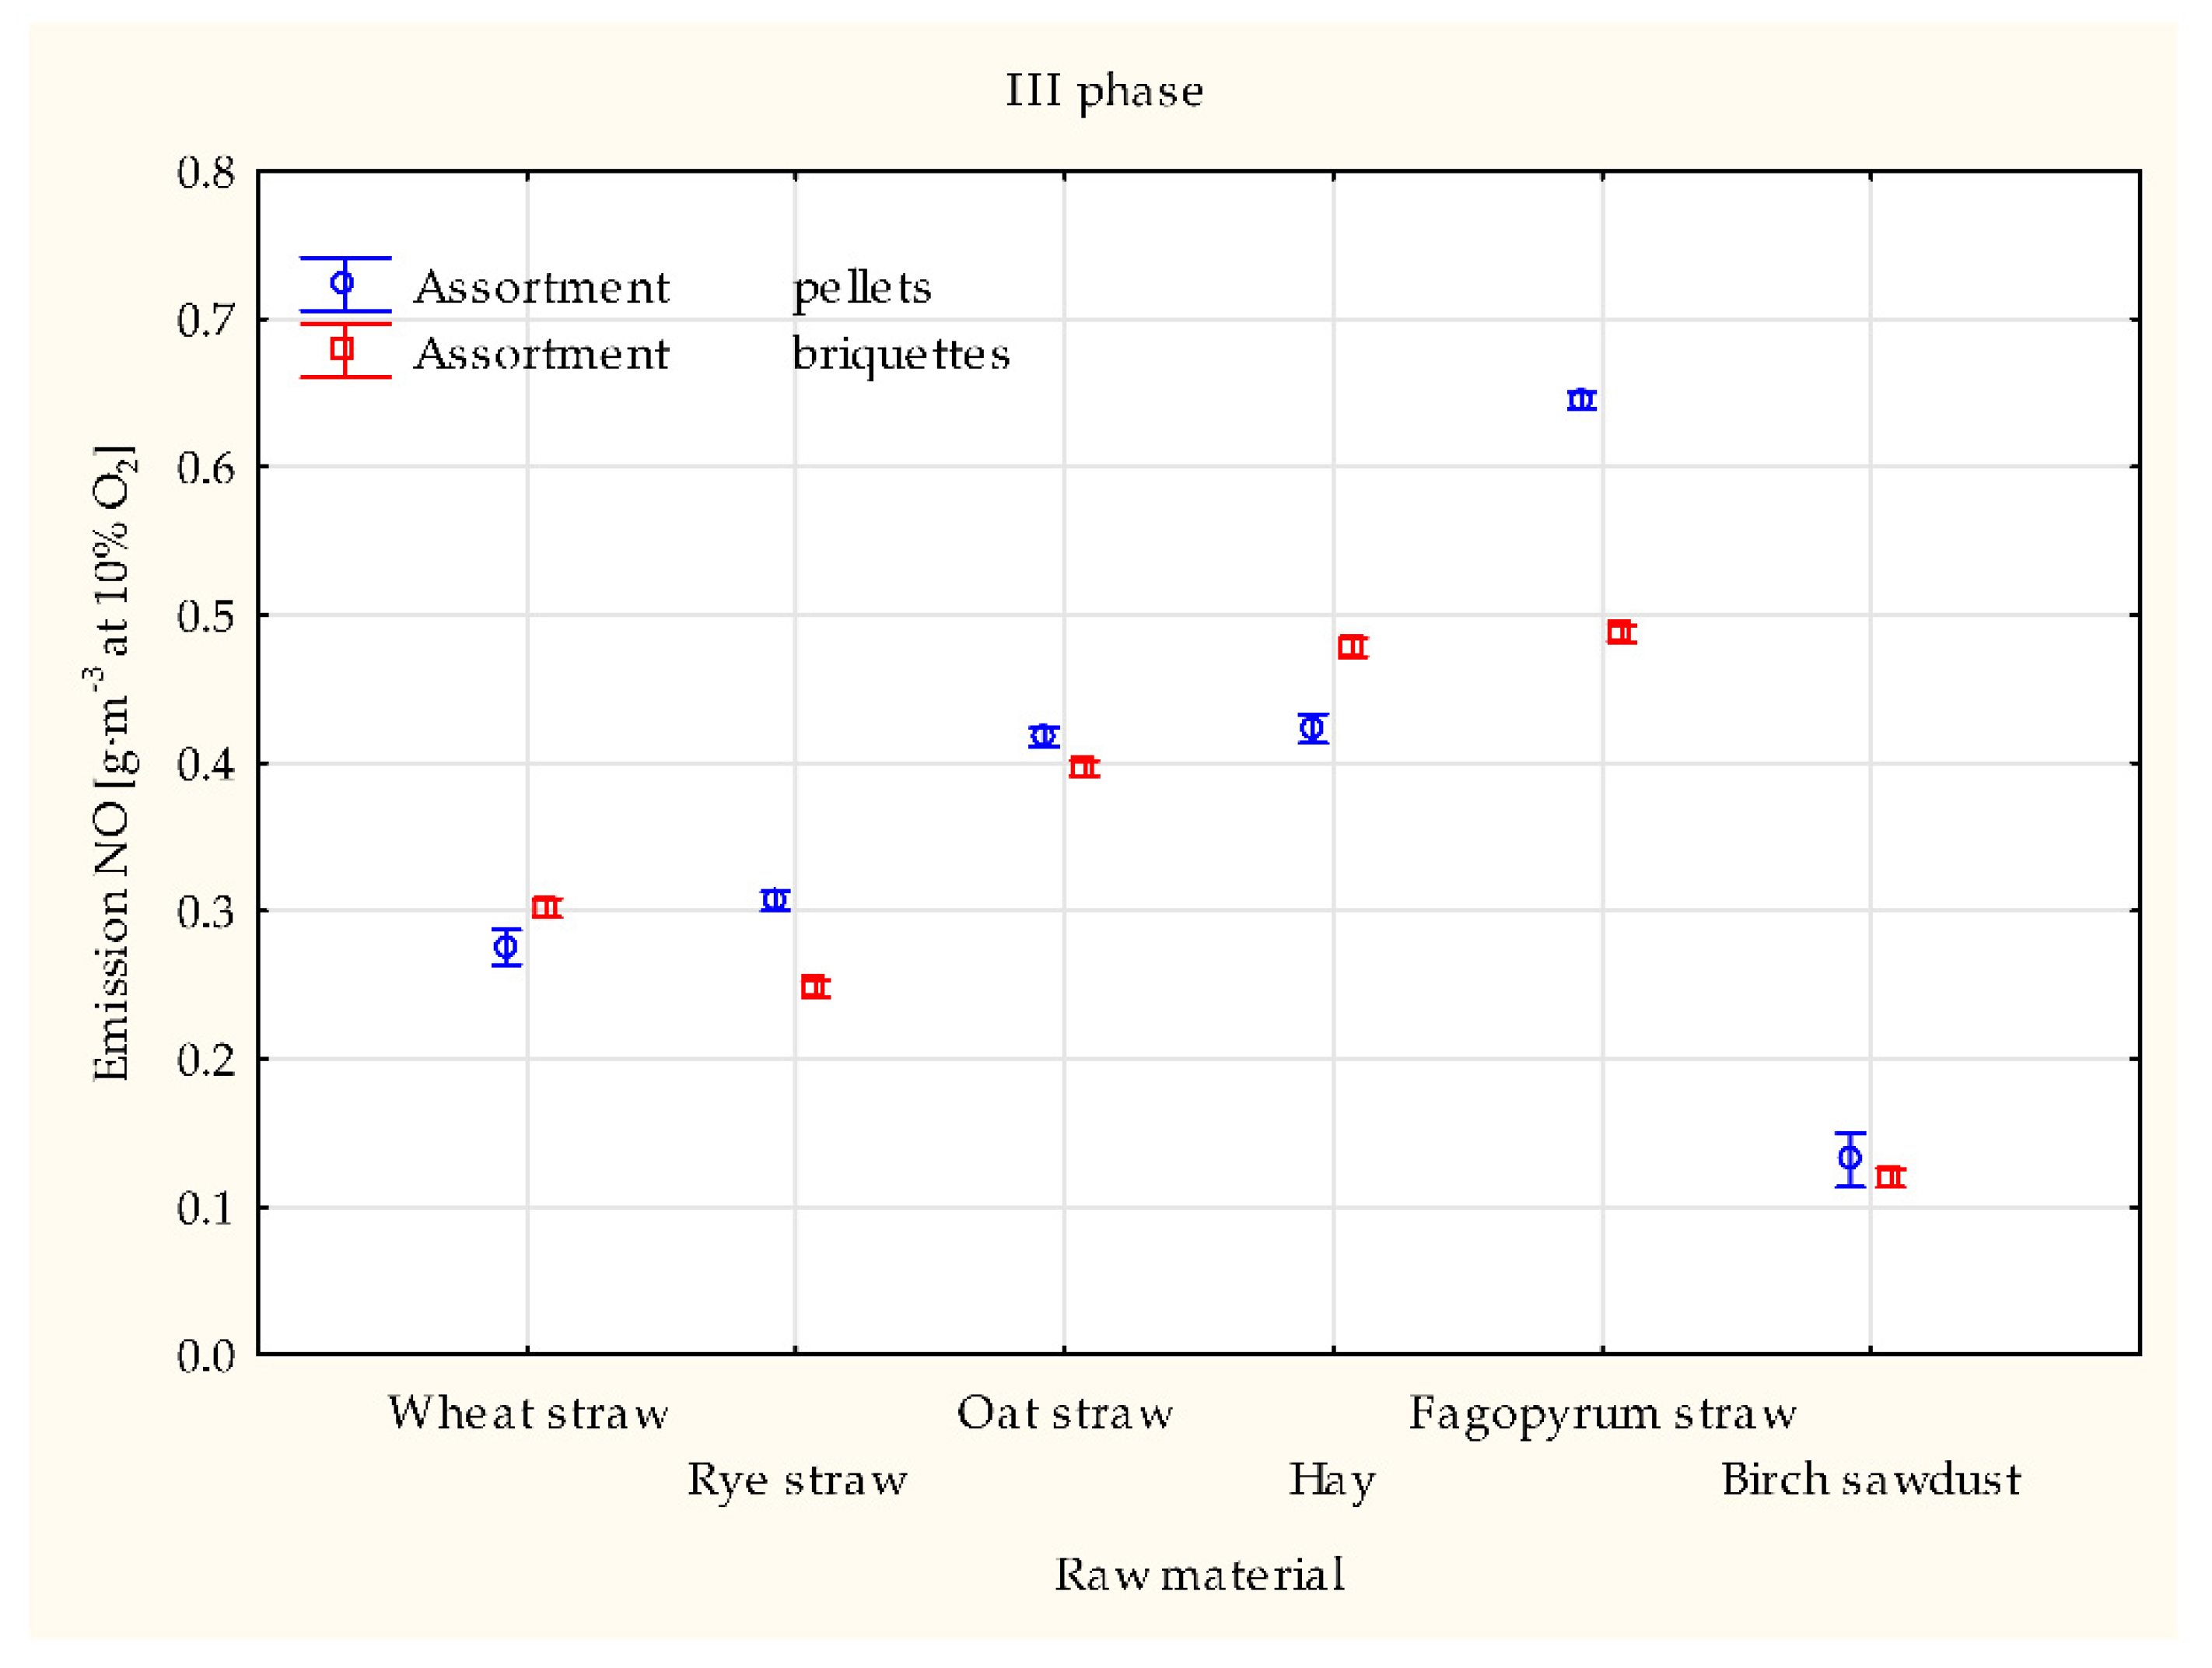
The average values of the registered NO emission during the combustion of prepared solid biofuels in the individual combustion phases are shown in Figure 4.
During combustion tests, nitric oxide emissions were the highest in the first combustion phase, similar to other CO and SO2 emissions. In phases II and III, they were significantly reduced. Moreover, a significant disproportion between wood pellets and other biofuels is visible in the first phase. Difficulties in airflow may cause it through the bed due to the smallest particle size distribution of these pellets, resulting in increased CO, SO2, and NO emissions. Additionally, at this stage, there is a visible tendency towards higher NO emissions during the combustion of the remaining pellets (in addition to Fagopyrum straw pellets) than of briquettes, which can be caused by the oxidation of volatile nitrogen species formed under the same conditions as CO. In phase II, these relationships are blurred. Higher emissions are noticeable during the combustion of pellets and briquettes made of oat straw, hay, and Fagopyrum straw. For these raw materials, the nitrogen compounds not released in phase 1 are probably formed in phase 2. It is worth noting that under the test conditions for wood biofuels, in phase II, NO emissions are the lowest. In the third combustion stage, the differences between the raw materials are similar to those in stage II. Still, between pellets and briquettes, the differences decrease. Observing these relationships, it is not difficult to notice that the emission of Fagopyrum is different from these relationships. Problems with ignition and the course of the combustion process in phases I and II for pellets Fagopyrum are transferred to phase III—Figure 4.
The ANOVA statistical analysis for factorial systems at the significance level of 0.05 showed significant differences between the raw materials and their shape in the form of pellets or briquettes for all registered exhaust gas components.
The relationships between the individual CO, NO, and SO2 concentrations in the flue gas and the chemical composition of the tested biofuels expressed as Pearson’s correlations are shown in Table 3.
The analyzed CO, NO, and SO2 concentrations in the flue gas in connection with the chemical composition are characterized by a significant differentiation of the obtained values of the Pearson correlation coefficients. In the analyzed exhaust gas components group, special attention was paid to NO and SO2 emissions in the fuel’s nitrogen and sulfur content. The relationship between NO vs. N in individual phases is, in most cases, positive. Only in phase I for pellets was it moderately negative. On the other hand, the relation of SO2 vs. S was much more diverse and weaker, especially in the second and third phases of pellet combustion. At the same time, no clear trends were observed between pellets and briquettes. Regarding the impact of chemical features on the recorded values of CO, SO2 and NO gases in the exhaust gas, attention is focused on the volatile matter content in the fuel. These relationships for pellets in the first phase were positively and quite strong. However, in the remaining phases, they lost their importance. The relationship of CO, NO, and SO2 content in the exhaust gas with the geometrical features of fuels, expressed by the GPI index, is similar in the distribution of the individual combustion phases. In this respect, negative, strong dependence is visible for pellets in the first combustion phase—Table 3.
The relationships between the individual CO, NO, and SO2 concentrations in the flue gas and the parameters describing the course of the combustion process of the tested biofuels expressed as Pearson’s correlations are shown in Table 4.
In the scope of all registered obtained CO, NO, and SO2 concentrations in the flue gas, in connection with the combustion course expressed by the temperature of exhaust gases and the content of CO2, Pearson’s correlations, in most cases, indicate positive relationships. On the other hand, there is a negative correlation with excess air. It is important that quite a strong positive relationship was observed in the first phase of combustion between NO vs. CO and NO vs. SO2. Additionally, it was observed that these relations are the strongest in the group of pellets. In the remaining stages of combustion, these relationships were weaker.

4. Discussion

The biofuels used for the research were characterized by different chemical and physical properties, among which there were different geometrical features. When assessing their values, a specific deviation from the remaining group of herbaceous biofuels is observed for biofuels made from birch sawdust. However, the physical and chemical properties of these raw materials and biofuels made from them were comparable to those in the literature [10,11,12,13,14].
Under the test conditions, a significant diversification of the course and effects of combustion between the raw materials and pellets and briquettes in the group of one raw material was observed. During the tests, the following elements were distinguished: first stage of ignition, second stage of flame combustion, and third stage of afterburning of a portion of the fuel. The lowest emission was recorded during the second phase, Wherein the CO values in most cases were higher than allowed in the third class of PN-EN 303-5: 2012 [56]—the results were satisfactory only for wood biofuels and biofuels made of wheat or rye straw, but only during a stable combustion process in phase II. In terms of NO emissions, a slightly higher total gas emission was noticeable during the combustion of pellets than during the combustion of briquettes. However, this relationship lost its importance when analyzing these values in individual fuel batch combustion phases. It can be seen that the NO emission factors for each fuel change depending on the duration of a particular combustion stage. Increased NO emission values exceeded the normative values given in the EcoDesign Directive [41]. However, in phase II, the lowest NO emission was observed, meeting the requirements of this standard, resulting from the combustion of pellets and wood briquettes.
The correlation between the NO content in the flue gas and the N content in the fuel in the second phase of pellet combustion was positive and the strongest. In the remaining cases, the strength of connections was weak, and in phase I, for pellets, it even took the opposite value—Table 3. Looking for explanations of these dependencies in the literature, Ozgen et al. [6] indicate that the release of NOx during biomass combustion is governed by a combination of fuel nitrogen, carbon, and ash content. First of all, as commonly indicated in the literature, NOx emissions from the combustion of fossil or biomass fuels are positively correlated with the nitrogen content in the fuel [8,17,18,37,38,57,58,59]. Nussbaumer [7] even states that problems with excessive NOx emissions appear at the weight share of nitrogen from 0.6%, which applies mainly to cereal straw, grasses, and fruit residues. The nitrogen content in the biofuels used in this study was diversified. The biomass of meadow hay concerning the wood biomass was over six times higher. On the other hand, the limit value of 0.6% of nitrogen, above which increased emissions may appear, was exceeded for wheat, rye, Fagopyrum, and hay straw. Under the conditions of our research, the observed differences in NO content in the exhaust gas did not show a strong relationship with the nitrogen content in the fuel, which was confirmed by the Persona correlation analysis. For wood pellets, it was even a negative relation—Table 4. It indicates a more critical, different emission mechanism in the test conditions. It might be presumed that significant NO emissions are due to the formation of these oxides due to high temperatures. However, according to Lamberg [60], the thermal oxidation of nitrogen from the atmosphere in biomass boilers is small in scale. It does not play a significant role due to relatively low combustion temperatures (below 1300 °C). Under the test conditions in the first phase of combustion, there were no such high temperatures, as evidenced indirectly by the temperature of the exhaust gases—Table 2.
Another vital aspect of NO formation, as reported by Ozgen et al. [6] after [61], concerns solid biofuels obtained from waste biomass of agricultural origin, which have a high content of volatile substances and a low content of bound carbon. Ozgen [6] indicates that the oxidation of fuel nitrogen begins with the pyrolysis of the biomass material when part of the fuel is released as tar and then converted to volatile nitrogen compounds (ammonia (NH3), hydrogen cyanide (HCN), and slightly isocyanic acid (HNCO)), which then oxidize in the presence of excess oxygen to NO. Our research showed that NO emission is much higher during the first combustion phase when the increased CO emission occurs. This mechanism of NO formation from volatile substances includes strong positive correlations between the content of volatile matter and the emission of CO, NO, and SO2 in the first phase of pellet combustion. During the burning of briquettes in phase I, this relationship is insignificant and often negative. Additionally, Mentes et al. [62] report that several factors influence the CO in the exhaust gas, but there is no clear, strong relationship between CO and CO2, as observed during their research. In this combustion phase, more energy is released per unit time, and a shortage of air leads to CO and NOx emissions. This relationship is in line with the observed appearance of NO in the first combustion phase, simultaneously with CO. Additionally, there are increased emissions of SO2 in this phase—Table 4.
In the studies of Yang et al. [63], it was noticed that the heating value and the particle size primarily influenced the CO concentration in the exhaust gases leaving the bed, considering the changes in the combustion stoichiometry—during the tests, expressed as the CO2 content in the exhaust gas and λ. Higher heating values and smaller particle sizes result in high CO emissions. The research also revealed such dependencies CO emission was higher for pellets. The GPI index expressed the geometric properties of the particles during the tests. Lower values of this index increase the combustion rate, as described in the studies by Ito et al. [33] and Kraszkiewicz [34]. During these tests, strong negative relationships between the GPI index and CO, SO2, and NO content in the flue gas were observed in the first phase of pellet combustion. The higher combustion rate and the tighter arrangement of particles in the bed result in periodic oxygen deficiencies and thus increased emissions.
Additionally, referring to the combustion system used during the own research, combustion of solid fuels on the grate causes uncontrolled emissions of CO and NO to the atmosphere in the initial phase of combustion, immediately after the fuel portion is placed on the heating layer. Though these relations described in the literature are often mutually exclusive. For example, Czech et al. [64], during the tests of wood pellets combustion in the top-feed boiler (25 kW) with regulated secondary air, showed that the average NOx emission factors were almost equal for the boiler start-up phase and optimal operating conditions. At the same time, some authors of other studies reported higher NOx emission values for the flame phase (II) concerning ignition (I) and afterburning (III) [35,36]. They confirmed these observations as consistent with nitrogen in the fuel and its release mechanisms during afterburning, where the dominant feature is char-N conversion [37] with lower NOx formation concerning the volatile nitrogen fractions conversion path. During the research, two NO formation paths were observed from fuel nitrogen, which partly ends up in the volatile matter and partly remains bound in the fuel. Hence, the conditions allowing for releasing volatile components from the deposit favor such emissions. Nevertheless, in the context of the two forms of biofuels used during the research (pellets and briquettes), the airflow and distribution through such deposits, resulting from geometric properties, is noticeable, which translates into the duration of individual combustion phases and recorded emissions of CO, SO2 and NO.

5. Conclusions

During this research, the fuel used was pellets and briquettes, different in form and geometric features. In addition, the raw materials used to produce them vary in terms of chemical properties. The standardization of fuels made it possible to normalize the moisture content and geometric features within a given fuel assortment. On the other hand, compaction does not affect the chemical composition of the fuel. The combustion tests in the grate heating device showed a significant diversification of the combustion process. From a practical perspective, the combustion of biofuels made of herbaceous biomass or wood biofuels in a grate boiler periodically fed with fuel requires a detailed approach to the air supply settings to obtain the lowest CO emission. Referring to the combustion phases, at the beginning of the delivery of a new portion of fuel, there may be significant periodic emissions, which are reduced as the flame develops. Some biofuels made from oat straw or Fagopyrum straw can even be difficult to efficiency burn. In terms of assessing the ecological and energy parameters of the combustion process, specified by the new requirements of the EcoDesign Directive, during this research the nitrogen content in biomass was not the most important factor indicating the formation of NO emissions. Significant concentrations of NO in the exhaust gas were observed in the first phase of combustion, which was also associated with significant concentrations of CO and SO2 in the exhaust gas. In the second flame phase, a significant reduction in NO content in the exhaust gas was observed, which was positively dependent on the nitrogen contained in the fuel. On the other hand, in the third phase of combustion, NO content in the exhaust gas was observed, which may depend on the nitrogen accumulated in part of the burning fuel and did not turn into the volatile matter in the first phase. Hence, the formation of nitrogen compounds in the context of the combustion of pellets and briquettes is also related to the geometric features of the fuel and thus the air flow through the bed and the course of flame combustion. Pellets (especially wood pellets, which are characteristic in the test conditions—the smallest dimensions) have smaller spaces between the granules, which favors blocking oxygen access, not burning volatile matter. For users of grate devices who want to replace hard coal quickly, it is recommended to use primarily wood briquettes and wheat or rye straw. Briquettes made of oat straw, meadow hay, and Fagopyrum require more combustion process monitoring to reduce possible emissions. On the other hand, pellets should be combustion in devices adapted to their geometrical features, e.g., in retort burners. However, differences in NO emissions when burning biofuels of various forms in terms of the relationship with other combustion parameters, including temperature and airflow, require further research, considering the possibility of burning volatile flammable fractions, which will lead to the development of low-emission and highly efficient biofuel combustion technologies in low-power heating devices.

Author Contributions

Conceptualization, A.K., A.P. and S.P.; Data curation, A.K., A.P. and S.P.; Formal analysis, A.K., A.P. and S.P.; Investigation, A.K., A.P. and S.P.; Methodology, A.K., A.P. and S.P.; Resources, A.K., A.P. and S.P.; Validation, A.K., A.P. and S.P.; Writing—Original draft, A.K., A.P. and S.P.; Writing—Review and editing, A.K., A.P. and S.P. All authors have read and agreed to the published version of the manuscript.

Funding

This research was funded by the Polish Ministry of Science and Higher Education as part of the statutory work number TKR/S/4/2021-2022.

Institutional Review Board Statement

Not applicable.

Informed Consent Statement

Not applicable.

Data Availability Statement

Restrictions apply to the availability of these data. Data is collected at University of Life Sciences in Lublin, Lublin, Poland.

Conflicts of Interest

The authors declare no conflict of interest.

References

  1. Malico, I.; Pereira, R.N.; Gonçalves, A.C.; Sousa, A.M.O. Current status and future perspectives for energy production from solid biomass in the European industry. Renew. Sustain. Energy Rev. 2019, 112, 960–977. [Google Scholar] [CrossRef]
  2. A European Green Deal. Striving to Be the First Climate-Neutral Continent. Available online: https://ec.europa.eu/info/strategy/priorities-2019-2024/european-green-deal_en (accessed on 28 March 2022).
  3. Polityka Energetyczna Unii Europejskiej. Available online: https://www.europarl.europa.eu/factsheets/pl/sheet/68/polityka-energetyczna-zasady-ogolne (accessed on 8 March 2022).
  4. Polityka Energetyczna Polski do 2040 r. Available online: https://www.gov.pl/web/klimat/polityka-energetyczna-polski (accessed on 14 January 2022).
  5. Bogusz, M.; Matysik-Pejas, R.; Krasnodębski, A.; Dziekański, P. The Concept of Zero Waste in the Context of Supporting Environmental Protection by Consumers. Energies 2021, 14, 5964. [Google Scholar] [CrossRef]
  6. Ozgen, S.; Cernuschi, S.; Caserini, S. An overview of nitrogen oxides emissions from biomass combustion for domestic heat production. Renew. Sustain. Energy Rev. 2021, 135, 110113. [Google Scholar] [CrossRef]
  7. Nussbaumer, T. Combustion and Co-combustion of Biomass: Fundamentals, Technologies, and Primary Measures for Emission Reduction. Energy Fuels 2003, 17, 1510–1521. [Google Scholar] [CrossRef]
  8. Demirbas, A. Potential applications of renewable energy sources, biomass combustion problems in boiler power systems and combustion related environmental issues. Prog. Energy Combust. Sci. 2005, 31, 171–192. [Google Scholar] [CrossRef]
  9. Baran, D.; Kwaśniewski, D.; Mudryk, K. Wybrane właściwości fizyczne trzyletniej wierzby energetycznej. Inżynieria Rol. 2007, 8, 7–12. [Google Scholar]
  10. Eisenbies, M.H.; Volk, T.A.; Patel, A. Changes in feedstock quality in willow chip piles created in winter from a commercial scale harvest. Biomass Bioenergy 2016, 86, 180–190. [Google Scholar] [CrossRef]
  11. Krzyżaniak, M.; Stolarski, M.J.; Szczukowski, S.; Tworkowski, J. Thermophysical and chemical properties of biomass obtained from willow coppice cultivated in one- and three-year rotation cycles. J. Elem. 2014, 1, 161–175. [Google Scholar] [CrossRef]
  12. Graham, S.; Ogunfayo, I.; Hall, M.R.; Snape, C.; Quick, W.; Weatherstone, S.; Eastwick, C. Changes in mechanical properties of wood pellets during artificial degradation in a laboratory environment. Fuel Process. Technol. 2016, 148, 395–402. [Google Scholar] [CrossRef]
  13. Jenkins, B.M.; Baxter, L.L.; Miles, T.R., Jr.; Miles, T.R. Combustion properties of biomass. Fuel Process. Technol. 1998, 54, 17–46. [Google Scholar] [CrossRef]
  14. Demirbas, A. Combustion characteristics of different biomass fuels. Prog. Energy Combust. Sci. 2004, 30, 219–230. [Google Scholar] [CrossRef]
  15. Theerarattananoon, K.; Xua, F.; Wilson, J.; Ballard, R.; Mckinney, L.; Staggenborg, S.; Vadlani, P.; Pei, Z.J.; Wang, D. Physical properties of pellets made from sorghum stalk, corn stover, wheat straw, and big bluestem. Ind. Crops Prod. 2011, 33, 325–332. [Google Scholar] [CrossRef]
  16. Skonecki, S.; Gawłowski, S.; Potręć, M.; Laskowski, J. Właściwości fizyczne i chemiczne surowców roślinnych stosowanych do produkcji biopaliw. Inżynieria Rol. 2011, 8, 253–260. [Google Scholar]
  17. Obernberger, I.; Brunner, T.; Bärnthaler, G. Chemical properties of solid biofuels–significance and impact. Biomass Bioenergy 2006, 30, 973–982. [Google Scholar] [CrossRef]
  18. Juszczak, M. Concentration of carbon monoxide and nitrogen oxides from a 25 kW boiler supplied periodically. Chem. Process Eng. 2014, 35, 163–172. [Google Scholar] [CrossRef]
  19. Kjällstrand, J.; Olsson, M. Chimney emissions from small-scale burning of pellets and fuelwood-examples referring to different combustion appliances. Biomass Bioenergy 2004, 27, 557–561. [Google Scholar] [CrossRef]
  20. Olsson, M.; Kjällstrand, J. Low emission from wood burning in an ecolabelled residential boiler. Atm. Env. 2006, 40, 1148–1158. [Google Scholar] [CrossRef]
  21. García, R.; Pizarro, C.; Lavín, A.G.; Bueno, J.L. Spanish biofuels heating value estimation. Part II: Proximate analysis data. Fuel 2014, 117, 1139–1147. [Google Scholar] [CrossRef]
  22. Fenimore, C.P. Formation of nitric oxide in premixed hydrocarbon flames. Symp. (Int.) Combust. 1971, 13, 373–380. [Google Scholar] [CrossRef]
  23. Miller, J.A.; Bowman, C.T. Mechanism and modelling of nitrogen chemistry in combustion. Prog. Energy Combust. Sci. 1989, 15, 287–338. [Google Scholar] [CrossRef]
  24. Leckner, B.; Karlsson, M. Gaseous emissions from circulating fluidized bed combustion of wood. Biomass Bioenergy 1993, 4, 379–389. [Google Scholar] [CrossRef]
  25. Nussbaumer, T. Verbrennung und Vergasung von Energiegras und Feldholz. In Jahresbericht 1994 zum Gleichnamigen Forschungsprojekt; Jahresbericht; Bundesamt für Energiewirtschaft: Bern, Switzerland, 1994. [Google Scholar]
  26. Boman, C.; Pettersson, E.; Westerholm, R.; Boström, D.; Nordin, A. Stove performance and emission characteristic in residential wood log and pellet combustion. Part 1: Pellet stoves. Energy Fuels 2011, 25, 307–314. [Google Scholar] [CrossRef]
  27. Liu, H.; Chaney, J.; Li, J.; Sun, C. Control of NOx emissions of a domestic/small-scale biomass pellet boiler by air staging. Fuel 2013, 103, 792–798. [Google Scholar] [CrossRef]
  28. Van Loo, S.; Koppejan, J. Handbook of Biomass Combustion and Co-Firing, 1st ed.; London Imprint Routledge: London, UK, 2007; pp. 266–272. [Google Scholar]
  29. Hinckley, J.; Doshi, K. Emission Controls for Small Wood-Fired Boilers; United States Forest Service, Western Forestry Leadership Coalition: Edgewater, CO, USA, May 2010. [Google Scholar]
  30. Eskilsson, D.; Rönnbäck, M.; Samuelsson, J.; Tullin, C. Optimisation of efficiency and emissions in pellet burners. Biomass Bioenergy 2004, 27, 541–546. [Google Scholar] [CrossRef]
  31. Obaidullah, M.; Bram, S.; Verma, V.K.; De Ruyck, J. A Review on Particle Emissions from Small Scale Biomass Combustion. Int. J. Renew. Energy Res. 2012, 2, 147–159. [Google Scholar] [CrossRef]
  32. Niedziółka, I.; Zuchniarz, A. Analiza energetyczna wybranych rodzajów biomasy pochodzenia roślinnego. MOTROL 2006, 8A, 232–237. [Google Scholar]
  33. Ito, H.; Tokunaga, R.; Nogami, S.; Miura, M. Influence of Biomass Raw Materials on Combustion Behavior of Highly Densified Single Cylindrical Biomass Briquette. Combust. Sci. Technol. 2022, 194, 2072–2086. [Google Scholar] [CrossRef]
  34. Kraszkiewicz, A. Influence of Geometrical Features of Solid Biofuels on the Implementation of the Combustion Process. Combust. Sci. Technol, 2022; in print. [Google Scholar] [CrossRef]
  35. Bhattu, D.; Zotter, P.; Zhou, J.; Stefenelli, G.; Klein, F.; Bertrand, A.; Temime-Roussel, B.; Marchand, N.; Slowik, J.G.; Baltensperger, U.; et al. Effect of stove technology and combustion conditions on gas and particulate emissions from residential biomass combustion. Environ. Sci. Technol. 2019, 53, 2209–2219. [Google Scholar] [CrossRef]
  36. Fachinger, F.; Drewnick, F.; Gieré, R.; Borrmann, S. How the user can influence particulate emissions from residential wood and pellet stoves: Emission factors for different fuels and burning conditions. Atmos. Environ. 2017, 158, 216–226. [Google Scholar] [CrossRef]
  37. Mitchell, E.J.S.; Lea-Langton, A.R.; Jones, J.M.; Williams, A.; Layden, P.; Johnson, R. The impact of fuel properties on the emissions from the combustion of biomass and other solid fuels in a fixed bed domestic stove. Fuel Process. Technol. 2016, 142, 115–123. [Google Scholar] [CrossRef]
  38. Houshfar, E.; Skreiberg, Ø.; Løvås, T.; Todorovic, D.; Sorum, L. Effect of excess air ratio and temperature on NOx emission from grate combustion of biomass in the staged air combustion scenario. Energy Fuels 2011, 25, 4643–4654. [Google Scholar] [CrossRef]
  39. Houshfar, E.; Løvås, T.; Skreiberg, Ø. Experimental Investigation on NOx Reduction by Primary Measures in Biomass Combustion: Straw, Peat, Sewage Sludge, Forest Residues and Wood Pellets. Energies 2012, 5, 270–290. [Google Scholar] [CrossRef]
  40. Bowman, C.T. Control of combustion-generated nitrogen oxide emissions: Technology driven by regulation. Symp. (Int.) Combust. 1992, 24, 859–878. [Google Scholar] [CrossRef]
  41. Directive 2009/125/EC of the European Parliament and of the Council of 21 October 2009 Establishing a Framework for the Setting of Ecodesign Requirements for Energy-Related Products. L285/10–L285/35. 2009. Available online: https://eur-lex.europa.eu/legal-content/EN/ALL/?uri=CELEX%3A32009L0125 (accessed on 18 March 2022).
  42. Decreto del Ministero dell’Ambiente e della Tutela del Territorio e del Mare n. 186. Regolamento Recante la Disciplina dei Requisiti, delle Procedure e delle Competenze per il Rilascio di una Certificazione dei Generatori di Calore Alimentati a Biomasse Combustibili Solide. Available online: https://www.reteambiente.it/normativa/30664/ (accessed on 30 March 2022).
  43. Ciupek, B.; Judt, W.; Gołoś, K.; Urbaniak, R. Analysis of Low-Power Boilers Work on Real Heat Loads: A Case of Poland. Energies 2021, 14, 3101. [Google Scholar] [CrossRef]
  44. Pełka, G.; Wygoda, M.; Lubo´n, W.; Pachytel, P.; Jachimowski, A.; Paprocki, M.; Wyczesany, P.; Kotyza, J. Analysis of the Efficiency of a Batch Boiler and Emissions of Harmful Substances during Combustion of Various Types of Wood. Energies 2021, 14, 6783. [Google Scholar] [CrossRef]
  45. Jarosiński, J. Techniki Czystego Spalania; WNT: Warszawa, Polish, 1996; pp. 277–294. [Google Scholar]
  46. EN ISO 18134-3:2015; Solid Biofuels—Determination of Moisture Content—Oven Dry Method—Part 3: Moisture in General Analysis Sample. Polish Committee for Standardization: Warsaw, Poland, 2015.
  47. Lisowski, A.; Dąbrowska-Salwin, M.; Ostrowska-Ligęza, E.; Nawrocka, A.; Stasiak, M.; Świętochowski, A.; Klonowski, K.; Sypuła, M.; Lisowska, B. Effects of the biomass moisture content and pelleting temperature on the pressure-induced agglomeration process. Biomass Bioenergy 2017, 107, 376–383. [Google Scholar] [CrossRef]
  48. Zawiślak, K.; Sobczak, P.; Kraszkiewicz, A.; Niedziółka, I.; Parafiniuk, S.; Kuna-Broniowska, I.; Tanaś, W.; Żukiewicz-Sobczak, W.; Obidziński, S. The use of lignocellulosic waste in the pro-duction of pellets for energy purposes. Renew. Energy 2020, 145, 997–1003. [Google Scholar] [CrossRef]
  49. Niedziółka, I.; Szpryngiel, M.; Kachel-Jakubowska, M.; Kraszkiewicz, A.; Zawiślak, K.; Sobczak, P.; Nadulski, R. Assessment of the energetic and mechanical properties of pellets produced from agricultural biomass. Renew. Energy 2015, 76, 312–317. [Google Scholar] [CrossRef]
  50. CEN/TS 15104:2006; Solid Biofuels. Determination of Total Content of Carbon, Hydrogen and Nitrogen. Instrumental Methods. British Standards Institute: London, UK, 2011.
  51. EN PN-G-04584:2001; Solid Fuels—Determination of Total and Ash Sulfur Content by Automatic Analyzers. Polish Committee for Standardization: Warsaw, Poland, 2001.
  52. PN-G-04516:1998; Solid Fuels-Determination of Volatile Matter Content by Weight Method. Polish Committee for Standardization: Warsaw, Poland, 1998.
  53. EN ISO 18122:2016; Solid Biofuels—Determination of Ash Content. Polish Committee for Standardization: Warsaw, Poland, 2016.
  54. EN ISO 18125:2017; Solid Biofuels. Determination of Calorific Value. Polish Committee for Standardization: Warsaw, Poland, 2017.
  55. EN ISO 16127:2012; Solid Biofuels—Determination of Length and Diameter of Pellets. Polish Committee for Standardization: Warsaw, Poland, 2012.
  56. PN-EN 303-5:2012; Heating Boilers for Solid Fuels with Manual and Automatic Fuel Hopper of Nominal Power Up to 300 kW. Terminology, Requirements, Testing and Marking. Polish Committee for Standardization: Warsaw, Poland, 2012.
  57. Speth, K.; Murer, M.; Spliethoff, H. Experimental investigation of nitrogen species distribution in wood combustion and their influence on NOx reduction by combining air staging and ammonia injection. Energy Fuels 2016, 30, 5816–5824. [Google Scholar] [CrossRef]
  58. Jach-Nocoń, M.; Pełka, G.; Luboń, W.; Mirowski, T.; Nocoń, A.; Pachytel, P. An Assessment of the Efficiency and Emissions of a Pellet Boiler Combusting Multiple Pellet Types. Energies 2021, 14, 4465. [Google Scholar] [CrossRef]
  59. Khodaei, H.; Guzzomi, F.; Yeoh, G.H.; Regueiro, A.; Pati, D. An experimental study into the effect of air staging distribution and position on emissions in a laboratory scale biomass combustor. Energy 2016, 118, 1243–1255. [Google Scholar] [CrossRef]
  60. Lamberg, H. Small-Scale Pellet Boiler Emissions–Characterization and Comparison to Other Combustion Units. In Report Series in Aerosol Science n:o 156; Academic Dissertation: Kuopio, Finland, 2014; Volume 156, Available online: https://www.atm.helsinki.fi/faar/reportseries/rs-156.pdf (accessed on 27 April 2022).
  61. Werther, J.; Saenger, M.; Hartge, E.U.; Ogada, T.; Siagi, Z. Combustion of agricultural residues. Prog. Energy Combust. Sci. 2000, 26, 1–27. [Google Scholar] [CrossRef]
  62. Mentes, D.; Sajti, S.Z.; Koós, T.L.; Póliska, C.S. Optimizing the combustion processes of a small scale solid fuel fired boiler. Int. J. Eng. Manag. Sci. 2019, 4, 358–369. [Google Scholar] [CrossRef]
  63. Yang, Y.B.; Ryu, C.H.; Khor, A.; Yates, N.E.; Sharifi, V.N.; Swithenbank, J. Effect of fuel properties on biomass combustion. Part II. Modelling approach identification of the controlling factors. Fuel 2005, 84, 2116–2130. [Google Scholar] [CrossRef]
  64. Czech, H.; Pieber, S.M.; Tiitta, P.; Sippula, O.; Kortelainen, M.; Lamberg, H.; Grigonyte, J.; Streibel, T.; Prévôt, A.S.H.; Jokiniemi, J.; et al. Time-Resolved analysis of primary volatile emissions and secondary aerosol formation potential from a small-scale pellet boiler. Atmos. Environ. 2017, 158, 236–245. [Google Scholar] [CrossRef]
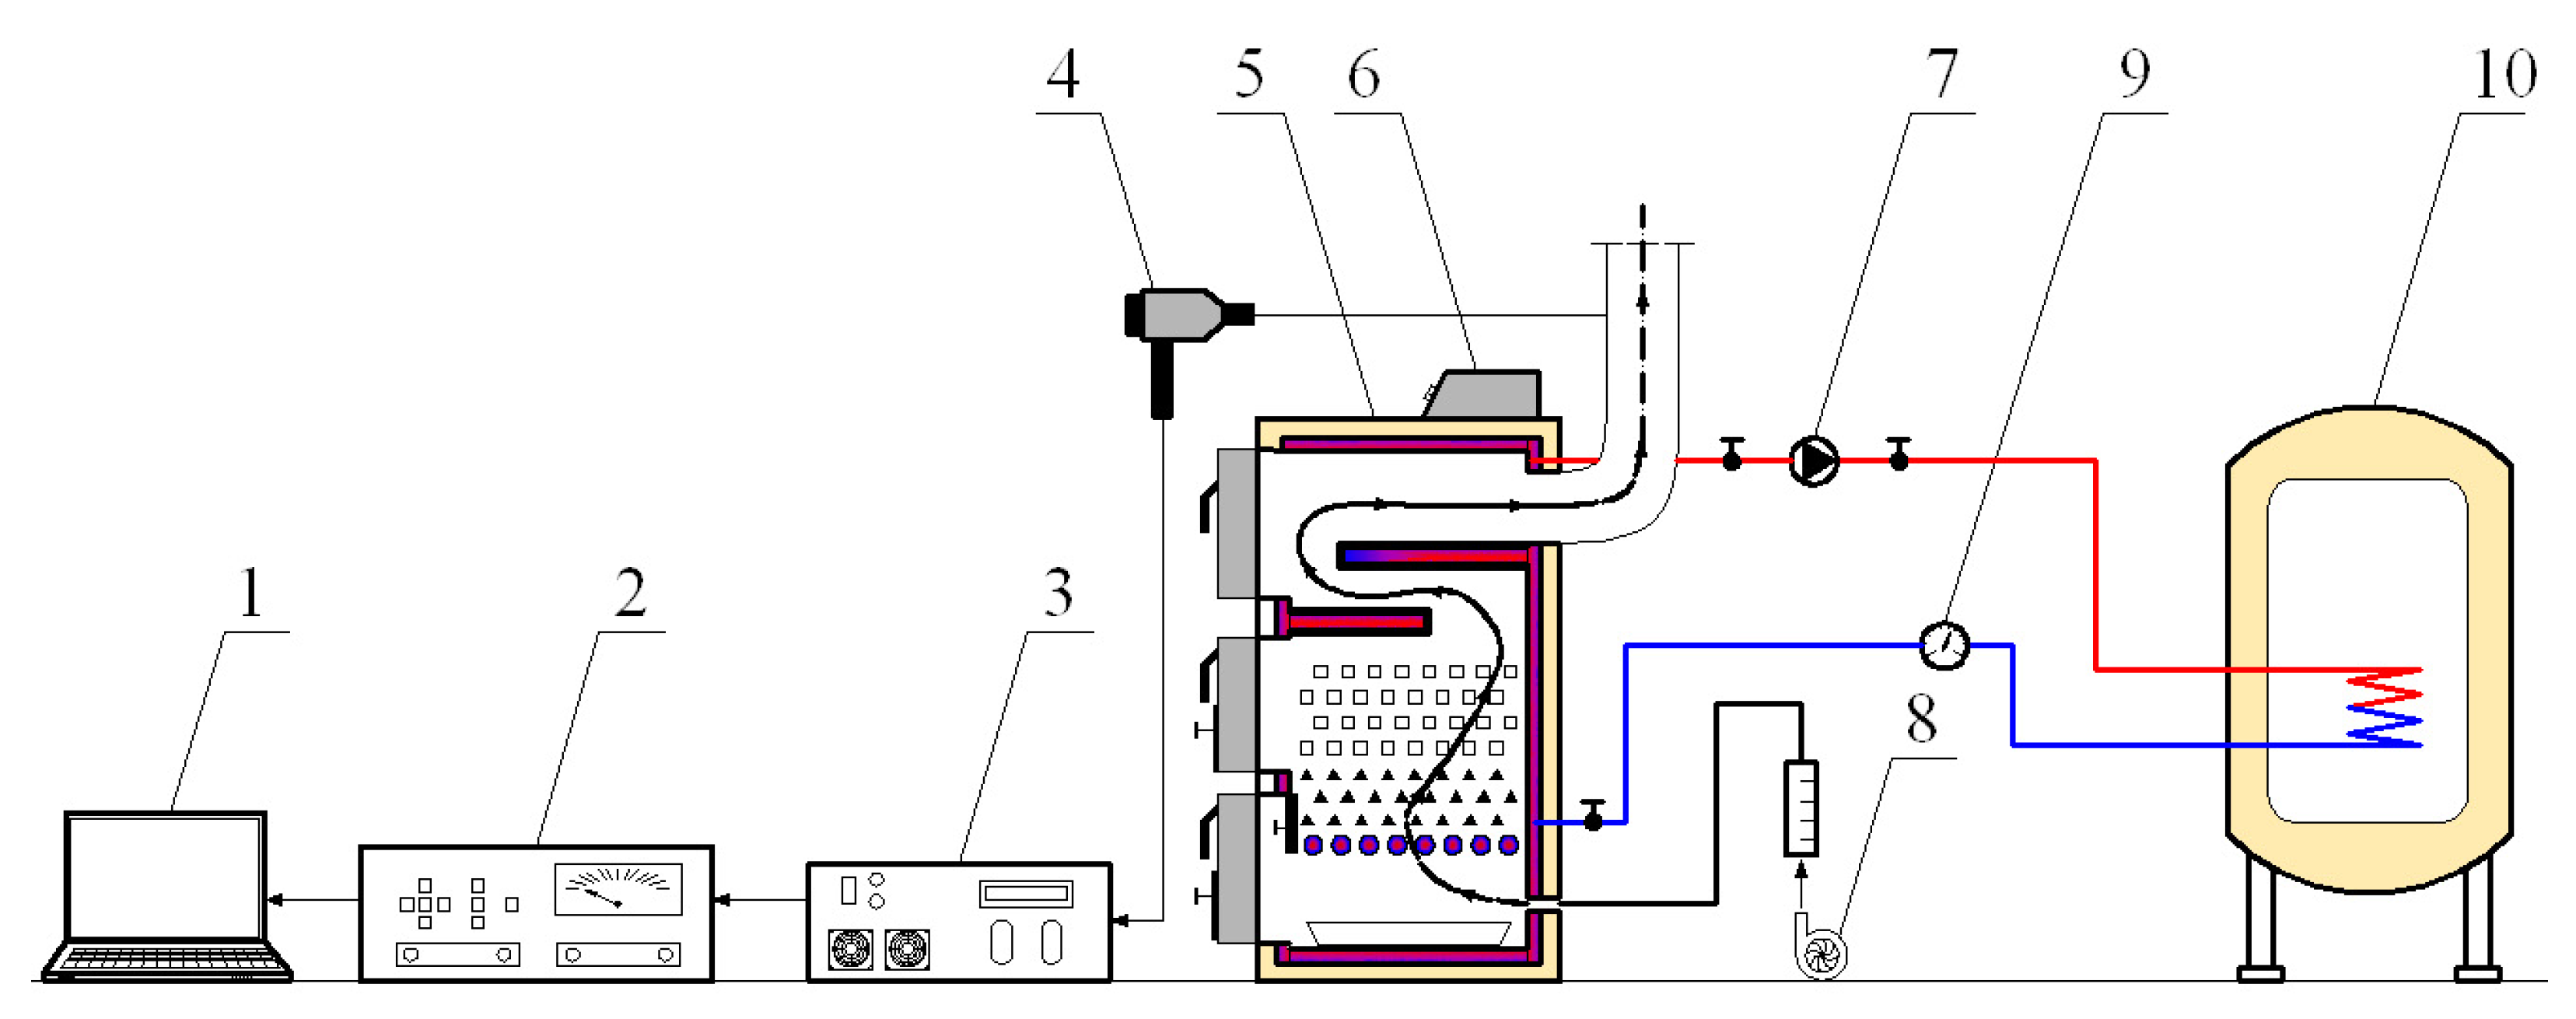
Figure 1. Diagram of measuring system: 1—computer, 2—NDIR gas analyzer, 3—dryer flue gas, 4—probe, 5—boiler, 6—microprocessor-based controller boiler, 7—pump, 8—air fun, 9—water flow rate meter, 10—heat exchanger receiving thermal energy from the boiler. Source: own study.
Energies 15 05960 g001
Figure 2. Emission CO in I, II and III phase combustion.
Energies 15 05960 g002aEnergies 15 05960 g002b
Figure 3. Emission SO2 in I, II and III phase combustion.
Energies 15 05960 g003aEnergies 15 05960 g003b
Figure 4. Emission NO in phase I, II, and III combustion.
Energies 15 05960 g004aEnergies 15 05960 g004b
Table 1. Selected physical and chemical properties of produced pellets and briquettes.
Raw MaterialSortmentL
mm
D
mm
MC
%
VD
kg·m−3
GPI
kg·m−1
VM
%
C
%
H
%
N
%
S
%
LHV
MJ·kg−1
AC
%
Wheat strawP32.3810.5511300.003670.73475.790.780.0616.292.3
B15.55010.419460.0217
Rye strawP28.9810.4110340.003272.2347.955.920.850.1216.283.4
B18.75010.288560.0245
Oat strawP34.1810.5310160.003369.5343.75.220.440.0715.476.45
B25.25010.4010040.0295
HayP31.789.7010630.003468.246.15.851.40.6116.266.2
B23.4509.4711320.0413
Fagopyrum strawP29.4089.9010800.003367.944.45.560.880.1315.489.2
B31509.809980.0478
Birch
sawdust
P11.289.799260.002073.3549.085.950.220.116.341.3
B48.7509.809960.0680
Table 2. Selected parameters describing the course of the combustion process.
Raw MaterialAssortmentFuel Consumption [kg·h−1]Content CO2 in Exhaust Gas
[%]
Air Excess Coefficient
λ
[−]
Exhaust Gas Temperature (Tgas)
[°C]
I
Phase
II
Phase
III
Phase
I
Phase
II
Phase
III
Phase
I
Phase
II
Phase
III
Phase
Wheat strawP3.960.767.711.1329.362.9224.62122423184
B3.412.518.055.418.802.594.25117292248
Rye strawP4.640.606.884.4832.903.917.7893419322
B3.764.839.428.144.902.102.80227329328
Oat strawP4.440.762.644.21166.4313.945.3757168294
B2.711.743.264.0612.376.195.1468134180
HayP4.430.955.335.9023.424.203.5071280295
B3.072.074.062.8910.554.837.4292192158
Fagopyrum strawP3.380.120.661.78205.2730.1013.922036111
B2.070.801.441.5827.5215.1013.4946119138
Birch
sawdust
P4.253.669.033.3028.942.256.17301576267
B3.542.817.377.666.962.812.58124278310
Table 3. Pearson correlation coefficient for the relationship between combustion products and physic or chemical properties biofuels.
VariablesCombustion Phase
IIIIII
PBPBPB
CO vs. C0.8300.1050.336−0.121−0.371−0.541
CO vs. H0.6040.2360.1200.030−0.512−0.529
CO vs. N−0.7720.438−0.5730.525−0.3720.126
CO vs. S−0.3780.663−0.0600.704−0.0760.040
CO vs. VM0.834−0.0700.474−0.308−0.054−0.375
CO vs. VD−0.8690.448−0.6250.670−0.3980.175
CO vs. GPI−0.913−0.203−0.594−0.147−0.056−0.387
SO2 vs. C0.7170.0190.141−0.4730.295−0.617
SO2 vs. H0.522−0.0970.065−0.5150.235−0.640
SO2 vs. N−0.6780.048−0.0640.1370.0640.073
SO2 vs. S−0.3470.3280.0060.2640.0680.158
SO2 vs. VM0.7230.0930.174−0.3220.333−0.356
SO2 vs. VD−0.7540.2840.0320.413−0.3220.381
SO2 vs. GPI−0.797−0.1850.023−0.209−0.208−0.264
NO vs. C 0.685−0.1620.0970.278−0.1050.119
NO vs. H0.495−0.2120.1830.210−0.0960.061
NO vs. N−0.6520.2370.4240.1500.1760.074
NO vs. S−0.3270.1250.1510.0510.397−0.071
NO vs. VM0.691−0.0580.0040.269−0.0920.062
NO vs. VD−0.725−0.1260.481−0.215−0.213−0.325
NO vs. GPI−0.766−0.6700.458−0.8130.052−0.510
Caption: units CO, SO2, and NO given as g·m−3; C, H, N, S, and VM given as %; VD given as kg·m−3; GPI given as kg·m−1.
Table 4. Pearson correlation coefficient for the relationship between combustion products and parameters describing the course of the combustion process.
VariablesCombustion Phase
IIIIII
PBPBPB
CO vs. Tgas0.6120.3230.444−0.2370.163−0.634
CO vs. CO2 0.5610.3760.328−0.1780.110−0.542
CO vs. λ−0.330−0.387−0.335−0.170−0.4020.177
SO2 vs. Tgas0.4850.2440.304−0.4360.580−0.407
SO2 vs. CO2 0.3880.3360.246−0.3210.578−0.304
SO2 vs. λ−0.265−0.470−0.361−0.078−0.563−0.407
NO vs. CO0.8510.596−0.1660.0930.170−0.245
NO vs. SO20.9920.7250.3300.0790.4530.200
NO vs. Tgas0.3960.4290.3540.6620.7630.648
NO vs. CO2 0.2940.5210.5010.7130.9210.682
NO vs. λ−0.248−0.322−0.531−0.638−0.679−0.563
Caption: units CO, SO2, and NO given as g·m−3; Tgas given as °C; CO2 given as %.
Publisher’s Note: MDPI stays neutral with regard to jurisdictional claims in published maps and institutional affiliations.