Review

Contributions of Solar Photovoltaic Systems to Environmental and Socioeconomic Aspects of National Development—A Review

1
Fort Hare Institute of Technology, University of Fort Hare, Alice 5700, South Africa
2
Research Group on Data, Artificial Intelligence, and Innovations for Digital Transformation Johannesburg Business School, University of Johannesburg, Johannesburg 2006, South Africa
*
Author to whom correspondence should be addressed.
Energies 2022, 15(16), 5963; https://doi.org/10.3390/en15165963
Submission received: 13 May 2022 / Revised: 9 July 2022 / Accepted: 22 July 2022 / Published: 17 August 2022
(This article belongs to the Special Issue Trends and Prospects in Photovoltaic Systems)

Abstract

:
Presently, the world is undergoing exciting haste to install photovoltaic (PV) systems in industry, residential/commercial buildings, transportation, deserts, street lights, and many other applications. Solar photovoltaic energy systems are clean and reliable energy sources that are unlimited, unlike their fossil fuel counterparts. The energy market is rapidly growing globally with newly and cumulative installed capacities of about 37.6 GW and 139.6 GW, accounting for 53% and 55%, respectively, in 2017, making it one of the fastest-growing industries. The cumulative photovoltaic installations are projected to have reached 600 GW worldwide and are projected to reach 4500 GW by 2050 because of the strategies and policies of many countries. In 2021, more than three-quarters of the developed countries are now home to one solar installation. This article evaluates a critical and extensive review of the contributions of solar photovoltaic systems to national development. The approach follows all steps, starting with capturing photovoltaics on the Earth’s surface, then price reduction, load management, and socioeconomic impact of solar photovoltaic systems. From the study, it is found that the policies and strategies adopted by the leading countries, such as tax credits, capital subsidies, net-metering, VAT reduction, feed-in tariffs (FiTs), and renewable portfolio standards (RPS), have significantly helped in more installations. Additionally, the significant drop in photovoltaic module prices from 4731 $/W in 2010 to 883 $/W in 2020 has boosted the move for more installations. Based on the findings, approximately 10 million permanent employments would be put in place by advancing solar power across the globe annually.

1. Introduction

1.1. Rationale and Background

Energy is an indispensable commodity that pilots the socioeconomic development of any nation. Nowadays, studies have revealed that nearly 80% of the global energy demand is being delivered through fossil fuels such as crude oil, natural gas, and coal [1,2]. Little did we know that the fossil fuel being extensively utilized for energy production regrettably gives rise to greenhouse gases, a pollutant in the environment [3], and floods, wildfires, and heatwaves [4,5,6]. However, as the human population rises, the need for fossil fuels and electricity dependency have increased exponentially. Hence, an alternative to energy remains a way to curb the impending dangers related to the deterioration caused by fossil fuels. Over the years, many countries have resorted to renewable energy to solve the lingering power issues and thereby obtain a clean environment. However, fossil fuels remain the major source of power, contributing to about 40% of electricity globally. Nevertheless, there are still serious campaigns in the global community concerning the future potential of renewable energy resources (RES). With this serious awareness and ongoing research, it is evident that fossil fuels, such as coal, will be unattainable as the prime source of energy in a few years, as it was predicted in 2008 that the 40% of electricity generation that comes from fossil fuels will drop to 37% by 2035 [7]. This declination is brought forth because safety in the environment becomes necessary, and because of the priority to reduce greenhouse gas emissions by carbon (Energy World, 2015). Numerous experts, such as, for instance, the World Energy Council (WEC), the International Energy Agency (IEA), and the US Energy Information Administration (EIA), have presented their future energy demands in various projections such as in 2020, 2030, and 2050, respectively [8].
Several countries have initiated their energy management program in other development by implementing several sociopolitical policies [9,10,11]. For instance, in 2004, the World Energy Council collaborated with the French Environment and Energy Management Agency (ADEME) to present energy strategies of 65 nations, deliberated and assessed since 1992 [12]. The central importance has been placed on environmental conservation by the EU [13,14]. Similarly, in the US, improving national energy safety has been of critical emphasis where rules to apply or direct these strategies and policies were taken as law and continuously inaugurated. The Energy Independence and Security Act of 2007 was also made a law on 19 December 2007 by President George Bush [15]. This works in conjunction with the Renewable Fuels Mandate, which allows a rise in the application of renewable fuels by 500%. Therefore, it demands that fuel manufacturers attain a capacity of 36 billion gallons in 2022. Likewise, Japan leads globally regarding energy expended per unit GDP of growth. Their fundamental rules regarding energy preservation and the environment have been inaugurated for more than 30 years. On 22 June 1979, Act no.49 was initiated regarding the rational application of energy [15]. The Japanese cabinet in 2006 authorized the New National Energy Policy and established an energy efficiency of an additional 30% by 2030. Specifically, the targets were to set energy safety procedures that Japan could rely on, and equally formed the basis for sustainable development by means of the broad and combined resolution of energy and environmental concerns.
Other nations such as Spain, the US, India, Germany, Italy, and China contributed major functions in the world’s energy markets. The portion of the total renewable energy (excluding hydro) is 31 GW, 86 GW, 24 GW, 71 GW, 29 GW, and 90 GW, respectively. However, the world’s yearly energy consumption has risen to 10 terawatts (TW), which is projected to increase up to 30 TW by 2030 [16,17]. PV power generation schemes can achieve this needed energy. It is estimated that solar PV systems will provide a quantity of nearly 345 GW of electricity by 2020 and 1081 GW by 2030 [18]. In March 2015, the installed solar grid capacity was recorded as 3743 MW, while it was 6762 in March 2016 and increased to 8062 MW in July 2016 [19]. In 2012, for instance, renewable energy had shared a total of about 1470 GW, almost 16.7% of the global energy consumption. In the same vein, this energy resource has not only presented above 26% of the global generating capacity but equally supplied about 21.7% of electricity in the same year [20].
Henceforth, the use of RES, especially solar PV, is a necessity. PV technology, however, stands a better chance among all the renewable energy sources to protect the environment due to its cleanliness [21,22]. Moreover, this technology is a more beneficial, efficient energy resource than other renewable technologies. For instance, solar PV technology remains a significant motivator for electrification in rural regions in developing countries [23]. However, solar PV systems are mechanisms that transform solar radiation into electric currents through a solar cell. A solar PV power plant can be configured as an off-grid or grid-connected solar PV system [24]. The design of off-grid PV systems is gaining popularity in the global market. In fact, the current situation reports that there are more and more innovative and efficient solutions to catch up with the rising commercial demand. The simple design of PV systems can consist of only a PV module and load or be constructed as big power plants with a peak power of numerous megawatts (MW). It might equally have the capacity to deliver both AC and DC loads with reserved power.
The solar energy available can easily be converted straightaway into direct current (DC), resulting in an added advantage in PV cell applications. Furthermore, applying solar energy is much simpler than fossil fuel production and requires a lesser workforce [25]. The essential aspect of using solar PV systems is providing power to isolated houses or communities, irrigation, and water supply. This is more advantageous in relation to other pumping mechanisms that generate intolerable sound in the environment during production.
Moreover, solar energy remains the most abundant among renewable energy resources and the prevalent prospective energy resources globally. The present-day technology can use the available sunlight to generate an average of 1700 kWh energy yearly [26]. It is noticed that the total power reaching the Earth’s surface can feed the current energy needed more than 10,000 times [27]. The significant energy generation from solar-established technologies presents an uncommon function the rest of the renewable counterparts could not adapt. For instance, it is easier to utilize a micro-solar system in a single building than biomass combustion or a wind turbine system. The extra energy generated in a single building could be delivered straight to the national grid [28]. Thus, solar energy is turning out to be a suitable candidate for policymakers and developers in the quest to decrease their carbon footprint [29]. In the form of photons, solar energy produces a surplus quantity of solar radiation that must be continuously tapped to overcome the world’s energy requirements. Hence, the greater the availability of the sun, the more energy is produced. Thus, solar energy is best generated in subtropical areas such as China and Hong Kong, where solar ir-radiation is average [30]. In Europe, for instance, the amount of solar ir-radiance is, on average, 1200 W/m2 annually, whereas it is found to be about 1800 to 2300 W/m2 in the Middle East [31]. In 2014, more than 100 countries boosted their PV capacity by close to 139 GW, making PV the world’s fastest-growing renewable energy source [32].

1.2. Related Literature Survey

In another development, some researchers have successfully incorporated tetrabutylammonium (TBA) into methylammonium lead iodide (MAPbI3) perovskite thin film [33]. Their work essentially increases the morphology and stability of MAPbI3 for PV applications. In the same vein, substantial research has been executed to expand the efficiency of the existing energy conversion mechanisms [29,34,35,36] to generate efficient energy conversion structures [34,37,38,39], and depending on RES [40], including solar PV [41,42], wind energy [43], biomass energy [44], geothermal [35], solar thermal [42], and hydro [45]. Additionally, the study on converting methane to aromatics, hydrocarbons, and olefins to a promising fuel has shown a huge impact on PV systems [46]. A huge aspect of these works has taken renewable energy systems to a height that motivated advanced nations to convert their present energy portfolio to additional renewable energies, hence advocating for a global declination of fossil fuels. The Paris Agreement has advocated for a global declination of the use of fossil fuels (UNFCC, 2015), but in reference to the IRENA’s 2017 Climate Safe Energy Solutions report, to efficiently attain such great aims and adequately limit the adverse influences on climate change, total decarbonization of energy practices has to be attained in less than half a century.
Several researchers have performed related studies on various solar systems under different environmental influences [47,48,49,50]. The research paper of [51] has deliberated on the environmental effects of organic photovoltaics (OPVs) in relation to some pointers, including, for example, energy payback time (EPBT), cumulative energy demand (CED), as well as several greenhouse gas (GHGs) discharges. Nevertheless, their studies were restricted merely to OPVs, without other technologies, and needed development on environmental viability [51]. In the same way, the study of [52] has analyzed mostly CO2 discharges and EPBT of PV technology. On the other hand, the analysis needed to evaluate the module’s technical characteristics and the balance of system (BOS) devices was merely restricted to the PV module, without other system devices, and was not able to study the evolving PV technologies; furthermore, it was merely restricted to CO2 discharges, disregarding other environmental factors [52]. Currently, the analysis of [53] regarding some of the studies on solar energy technologies reveals that solar pond CSP and CdTe PVs have the least possible GHGs discharges throughout their lifespan. However, the study could not deliberate on the impact of some system devices and also disregarded developing PV technologies; furthermore, the study was restricted to GHG discharges [53]. Other studies have focused on the efficiencies, economic sustainability, and utilization of solar technologies in broad terms [54,55,56,57,58], influences of a particular element in a system such as PV module or a definite PV technology [59,60,61], thermal and electrical storage technologies [62,63,64], and solar thermal collectors [65,66,67].
Moreover, country-based life cycle assessments (LCAs) evaluating the influences of various solar technologies and relating the impacts of connection and manufacturing locality were analyzed [68]. Although the study [69] disregards a universal database while relating various technologies, that is essential for the reliable worldwide preparation of LCAs [70]. Likewise, the studies [71] ignored several solar technologies while relating several connections and manufacturing localities. On the other hand, solar PV technology fluctuates at an unparalleled rapidity and is initiated to the market even quicker. The power producers, policymakers, and consumers are engrossing the technology mainly on the assessment of the producers, as it is inspiring to determine the long-term performance, dependability, and influence on the environment of the freshly initiated technologies, over their lifespan, under real-life situations [72].

1.3. Contributions

The present study mainly centers on the contributions of solar PV technology to environmental and socioeconomic aspects as a vital tool for national development. Herein, the needed policy structure is scarce in the literature and slightly ignored by the researchers. This article endeavors to fill the gap in the existing literature by presenting the solar PV employment opportunities, which are rising from 1.36 million jobs in 2012 to 3.75 million jobs in 2019. In addition to serving as the taproot for nation-building, it also allows the energy finances, consumers, policymakers, and project developers to make an informed decision. With an installed solar PV module, prices drastically reduced by more than two-thirds from 4731 $/W in 2010 to 883 $/W in 2020. The present study highlighted how solar radiation attenuates the earth’s surface and compared the environmental impact of fossil fuels and solar PVs in different regions. This will assist in developing our knowledge more on the accountability of solar energy in meeting the demand for energy in future. Rules related to applying this innovative technology as a key factor for job opportunities have not been performed in these reviewed articles; hereafter, they can serve as a future research direction.

1.4. Organization of the Paper

Following the introduction, this paper is organized as follows: Section 2 presents the attenuations of solar radiations reaching the Earth. Section 3 highlights the contributions of solar PV to national development, and Section 4 discusses the importance of solar PV compared to fossil fuels. PV power generation and electrical loads managements are explored in Section 5. The socioeconomic impact of PV technology is explored in Section 6, while Section 7 is the policies adopted that helped to boost PV systems. Finally, the conclusions are set out in Section 8.

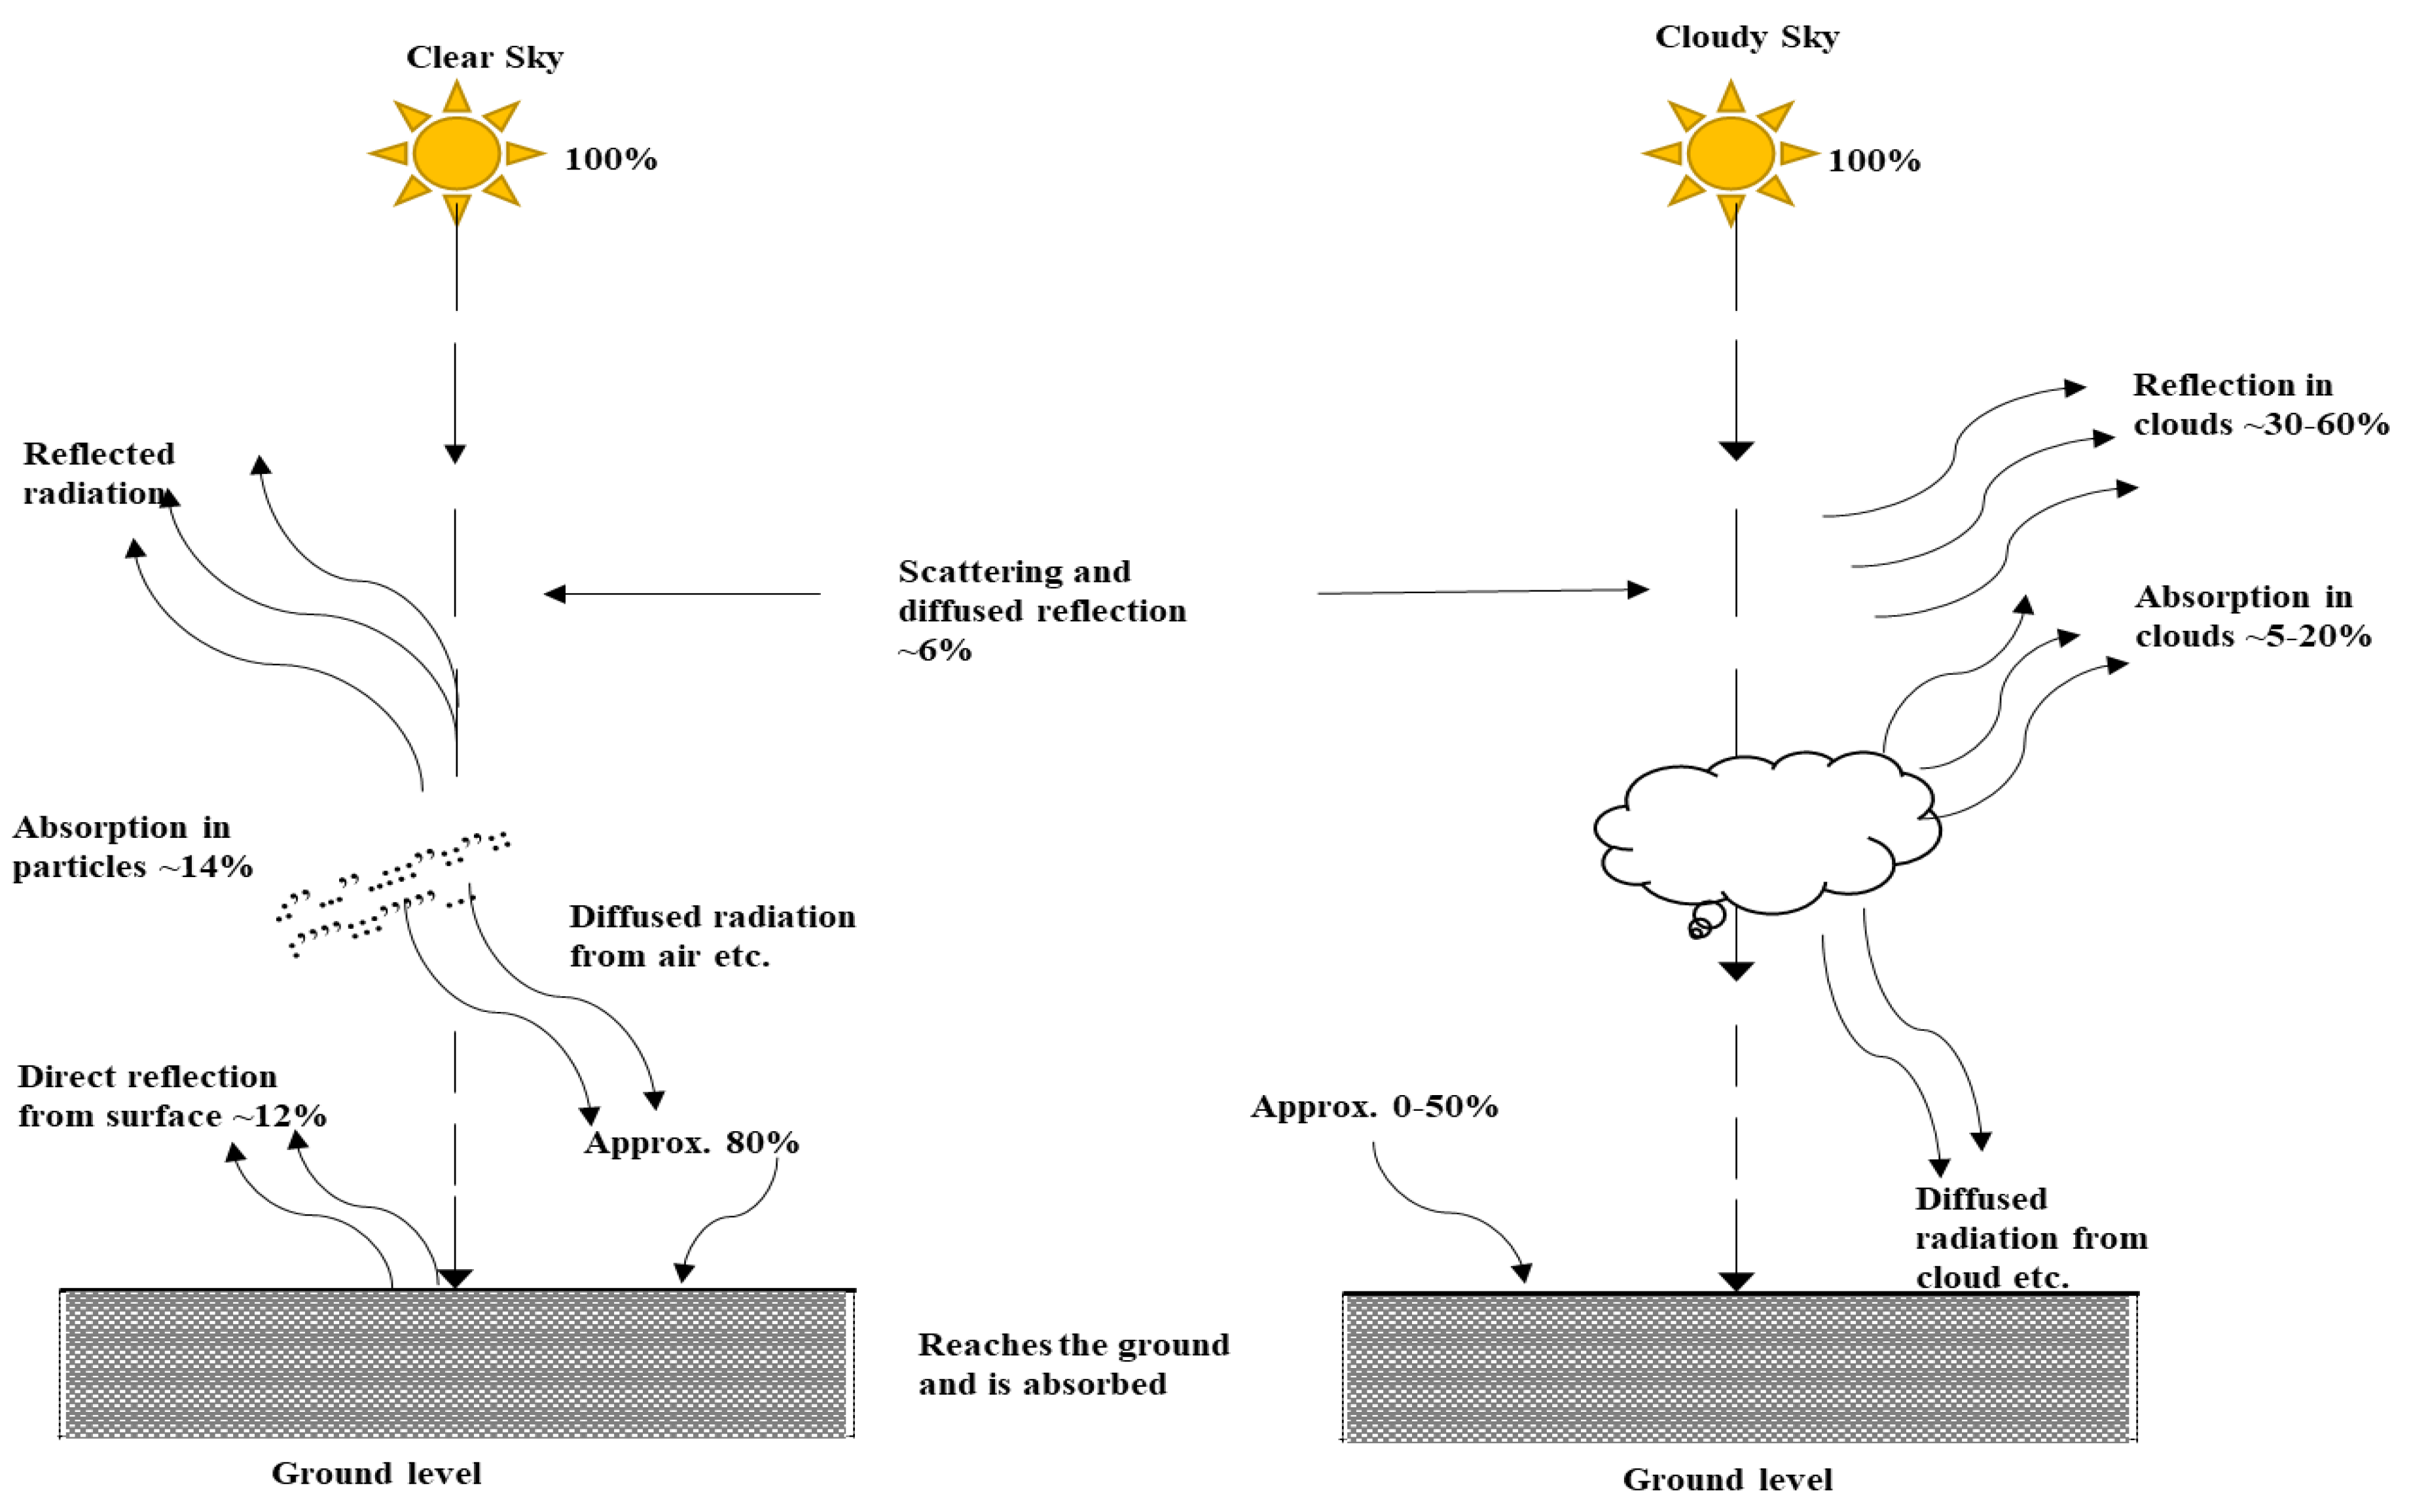
2. The Attenuation of Solar Radiation Reaching the Earth on Horizontal Surfaces

Solar radiations are affected by factors such as the hour of the day, the season of the year, and solar angles: the sun’s altitude angle, azimuth angle, zenith angle, and declination angle [73]. Moreover, the solar flux hitting the PV module or solar collector comprises the direct-beam radiation, diffuse radiation in the atmosphere, and reflected radiation. Figure 1 demonstrates the atmospheric effects of solar radiation on clear-sky and cloudy-sky days. The combination of the diffused, the direct beam, and the reflected radiations make up the total radiation for a clear sky [74].
The solar radiation that finds its way to the Earth’s atmosphere is partly diffused and partly absorbed. Furthermore, the solar radiation that reaches the Earth’s surface uninterrupted, in a straight line from the sun, is termed direct solar radiation. In the form of electromagnetic wave, the solar radiation strikes a particle, such as, for example, dust and clouds, and it is partially distributed in all directions as diffuse solar radiation.
However, with regards to Equations (1)–(14) [75,76], summarized below, the total hourly solar radiation ( I t h ) that strikes a horizontal surface may be used for the calculation of the daily global radiation (H) as follows:
I t h = r . H 3.6
r = I t h H = Π 24 ( a + b cos ( ω ) ) [ cos ( ω ) cos ( ω s ) sin ( ω s ) Π 180 ω s cos ( ω s ) ]
where ω s = sunset hour angle (degree) and is given in Equation (3).
ω s = cos 1 ( tan ( ϕ ) tan ( δ ) )
ω = the sun’s hour angle (degrees) and is presented in in Equation (4).
ω = ( 360 24 ) × ( h 12.0 )
h = time of the day in (hr).
a and b are calculated using Equations (5) and (6), respectively.
a = 0.409 + 0.5016 sin ( ω s 60 )
b = 0.6609 + 0.4767 sin ( ω s 60 )
ϕ = site latitude (degree), whereas δ = angle of declination and is given in Equation (7).
δ = 23.45 sin [ 360 ( 284 + n 365 ) ]
n = day number.
However, the diffuse component H d could be estimated from Equation (8).
H d = H { 0.775 + 0.00606 ( ω s 90 ) [ 0.505 + 0.00455 ( ω s 90 ) ] cos ( 115 K T 103 ) }
K T is the clearness index and is given in Equation (9).
K T = H H o
H o = extraterrestrial radiation on a horizontal surface and given using Equation (10).
H o = 24 x 3600 I s c π ( 1 + 0.033 cos 360 n 365 ) x ( cos φ cos δ sin ω + π ω 180 sin φ sin δ )
I s c = solar constant = 1367 W/m2.
Additionally, the hourly values of diffuse solar radiation could be found using Equation (11).
I d = H d 24 Π cos ( ω ) cos ( ω s ) sin ( ω s ) Π ω s 180 cos ( ω s )
The direct beam component of solar radiation on the horizontal component, however, is estimated using Equation (12).
I b h = I t h I d
This means that the hourly beam radiation on the horizontal surface is the difference between the hourly horizontal global radiation and the hourly horizontal diffuse radiation.
Finally, the estimation of the hourly value of direct solar radiation on a surface normal to the direction of the beam is given in Equation (13).
I b n = I b h cos θ z
θ z = solar zenith angle and is calculated by Equation (14).
θ z = cos ϕ cos δ cos ω + sin ϕ sin δ
Hence, θ z is a function of time, day number, and latitude.
The energy yield from a PV panel varies mainly on the angle between the panel and the sun, and this angle at which the sun receives a PV panel regulates its efficiency. However, the fundamental principle of solar PV is power generation through solar panels that produce electricity as sunlight goes through the atmosphere and strikes the solar panels. Therefore, the energy generation of solar PV power plants mainly relies on the quantity of solar radiation, including global horizontal ir-radiance (GHI), as the most important climatic and geometrical factor [77]. GHI is the solar energy that passes through the atmosphere and enters a point on a horizontal surface. Nevertheless, the fluctuations in climatic parameters are fluid and complex, which brings about unease in forecasting solar PV power production. In the same vein, clouds are significant climatic parameters affecting solar PV power production. They decrease the amount of solar radiation reaching the Earth’s surface by scattering and reflecting sunlight that reaches the ground.

3. The Contributions and Impact of Solar Photovoltaics on National Development

The amount of solar energy potential in the global community is enormous with respect to neighboring sustainable energy resources [78]. This is due to the significant amount of solar radiation that drifts from high altitudes of 0.06 kW/m2 to low altitudes of 0.25 kW/m2 toward the Earth’s surface [79]. Because of this, several governments worldwide have given mandatory research to develop and deploy solar PV technology. Many PV materials and modules are obtainable globally, with different efficiencies and limitations. Government incentives in conjunction with scientific research piloted the recent rapid installation capacity and the exponential drop in prices. This is supported by the annual solar PV electricity production report, which grew from 4 TWh in 2005 to 247 TWh in 2015 (IEA 2017) [80]. The yearly solar cell production increased from 4028 MW in 2007 to 187,453 MW in 2021, whereas the cumulative cell production increased from 4028 MW in 2007 to 1,050,231 MW in 2021. The development in global solar energy, as presented in Figure 2, demonstrates the increase in effort on solar power generation in 2021. As a result, the study on enhancing solar energy-producing efficiency with the least effect on the ecosystem and the environment is hugely motivated [81,82].
Meanwhile, the rapid studies in the solar PV industry have made it a marketable grown technology capable of producing and supplying short- and long-term electricity. Although the PV technologies are yet to meet their target since they could only deliver 0.1% of the global electricity demand, some PV marketers have presented records that the yearly averages of the PV technologies are expanding steadily at the rate of 40% [84]. The unit cost of PV technology has decreased to nearly one-third of its initial stand more than four years ago, coupled with constant practical improvements and studies for efficiency rise. Henceforth, PV will remain at a strong emerging rate and finally become an indispensable energy provider in the universe. Research works have reported that solar PV generations deliver the world’s energy of about 345 GW, which is around 4% by 2020, and 1081 GW by 2030, while the cumulative installations are projected to have reached 600 GW worldwide and are projected to reach 4500 GW by 2050 [85].

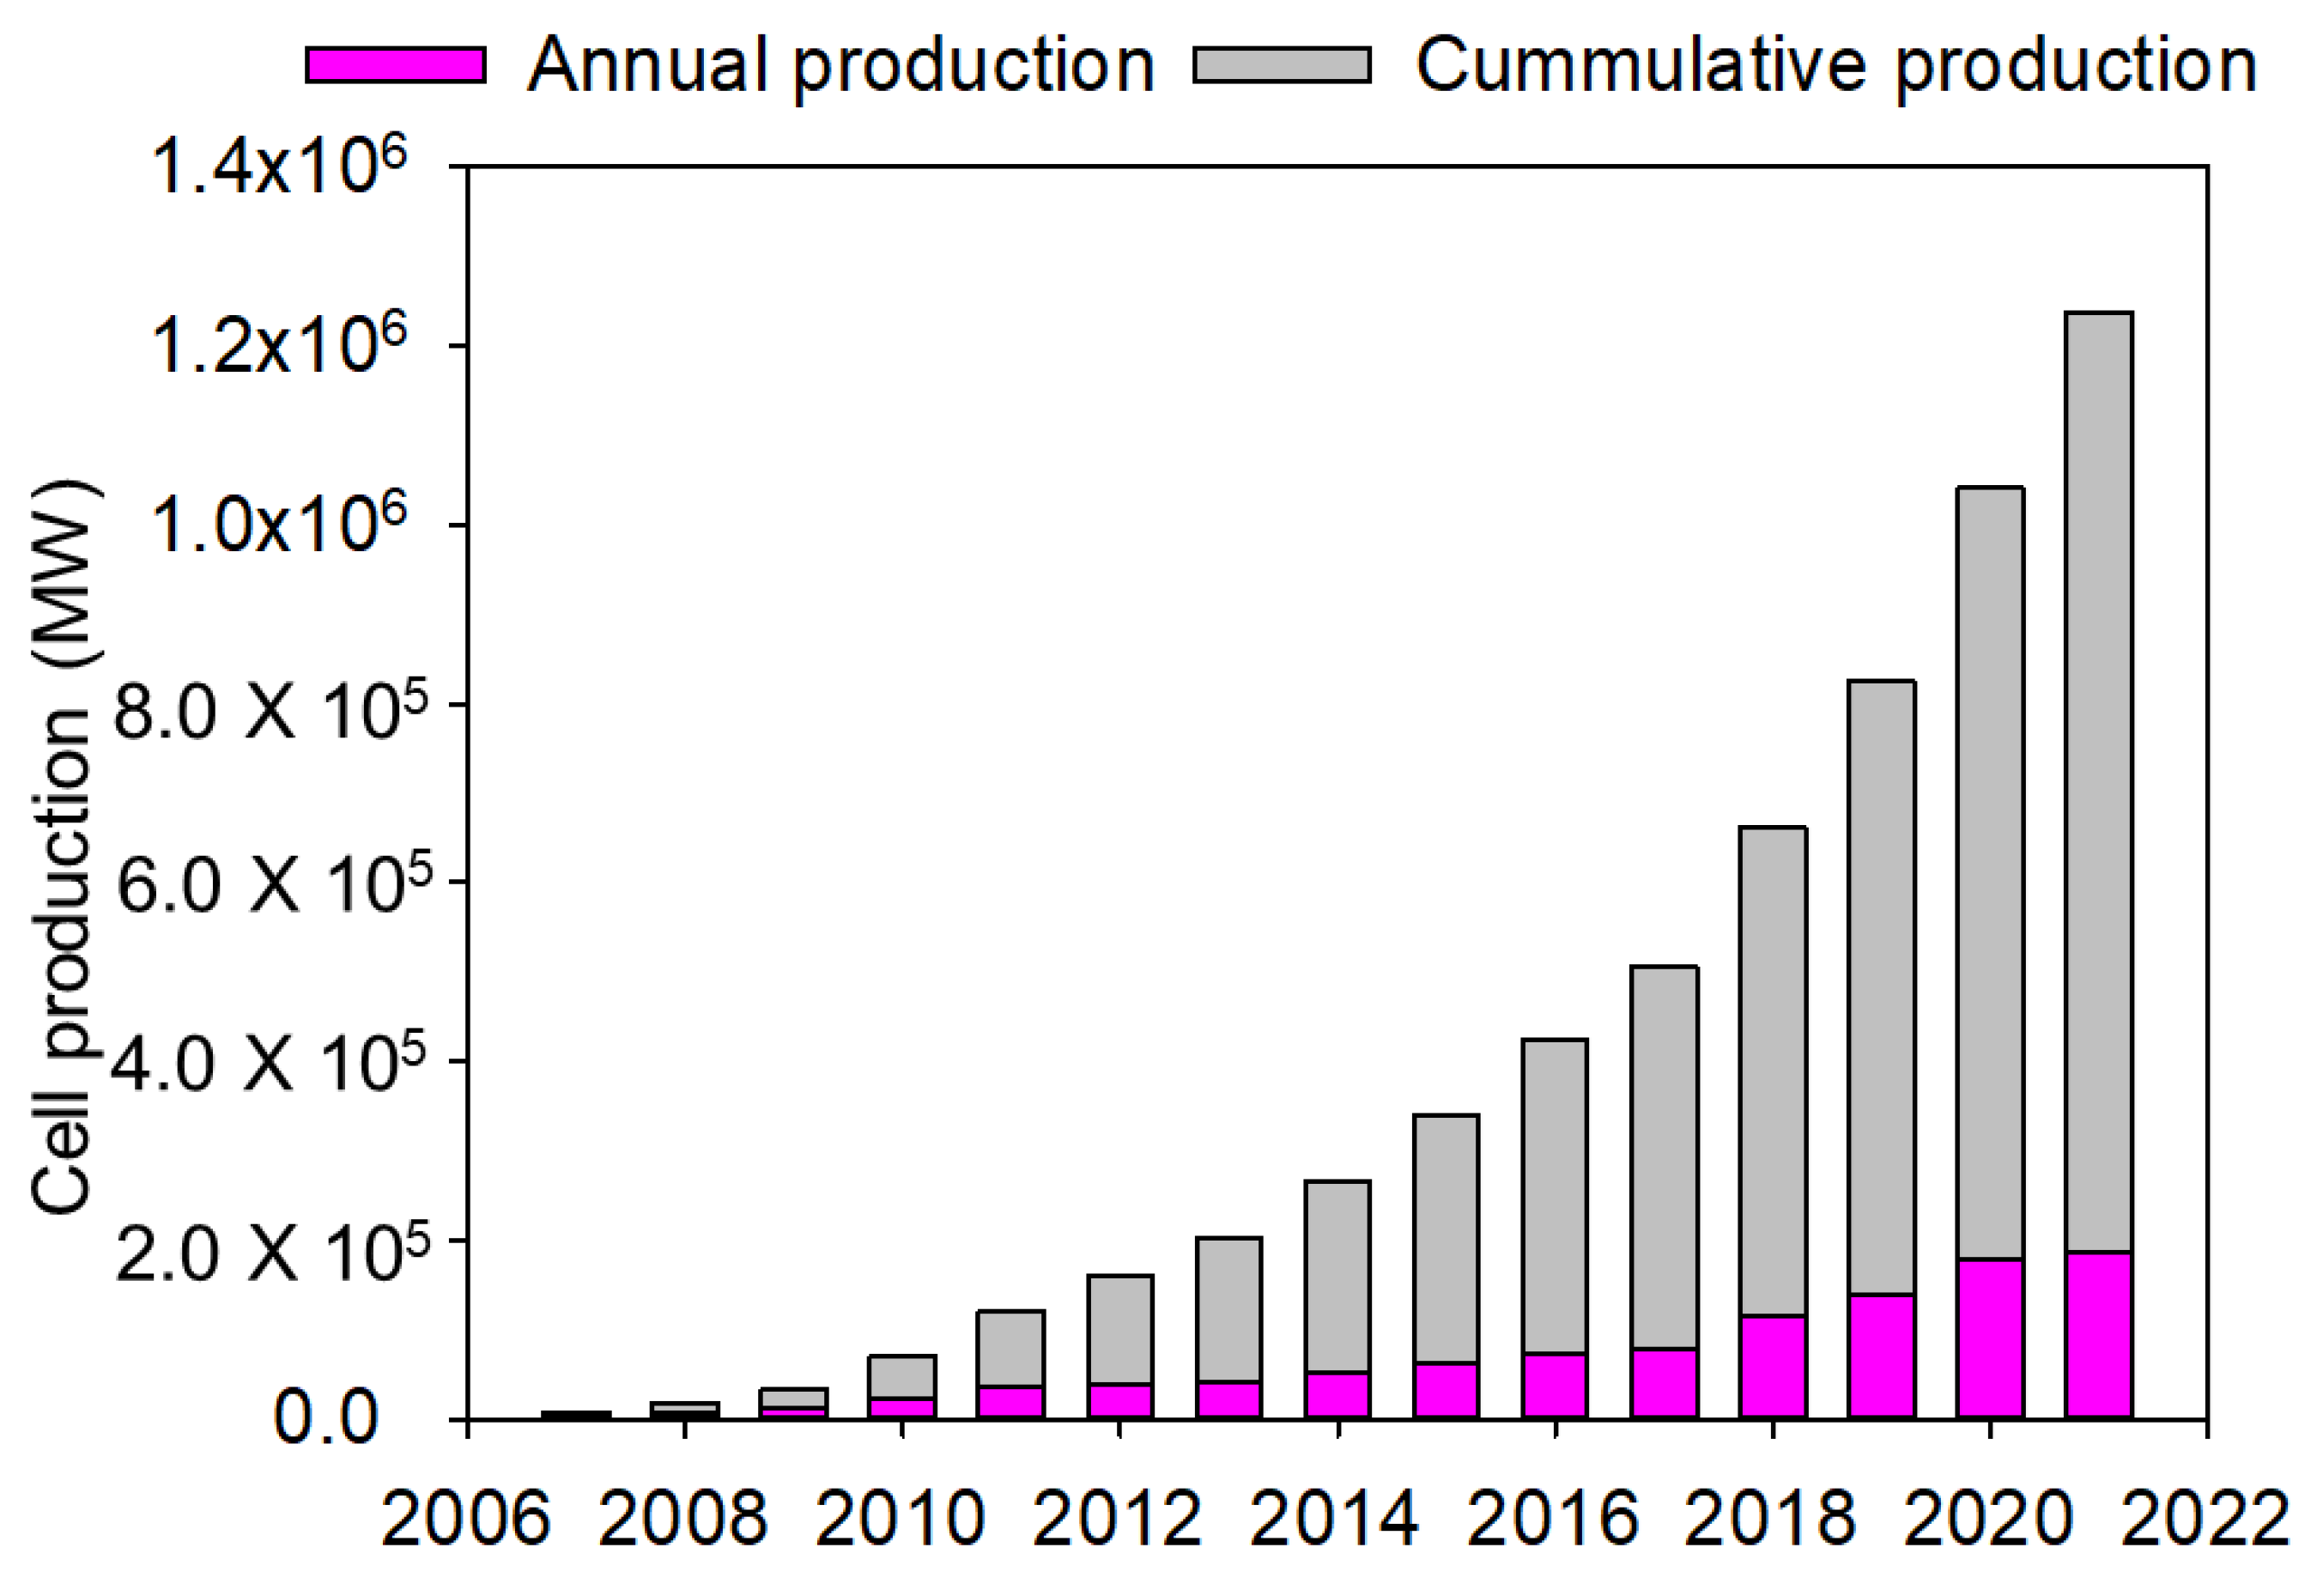
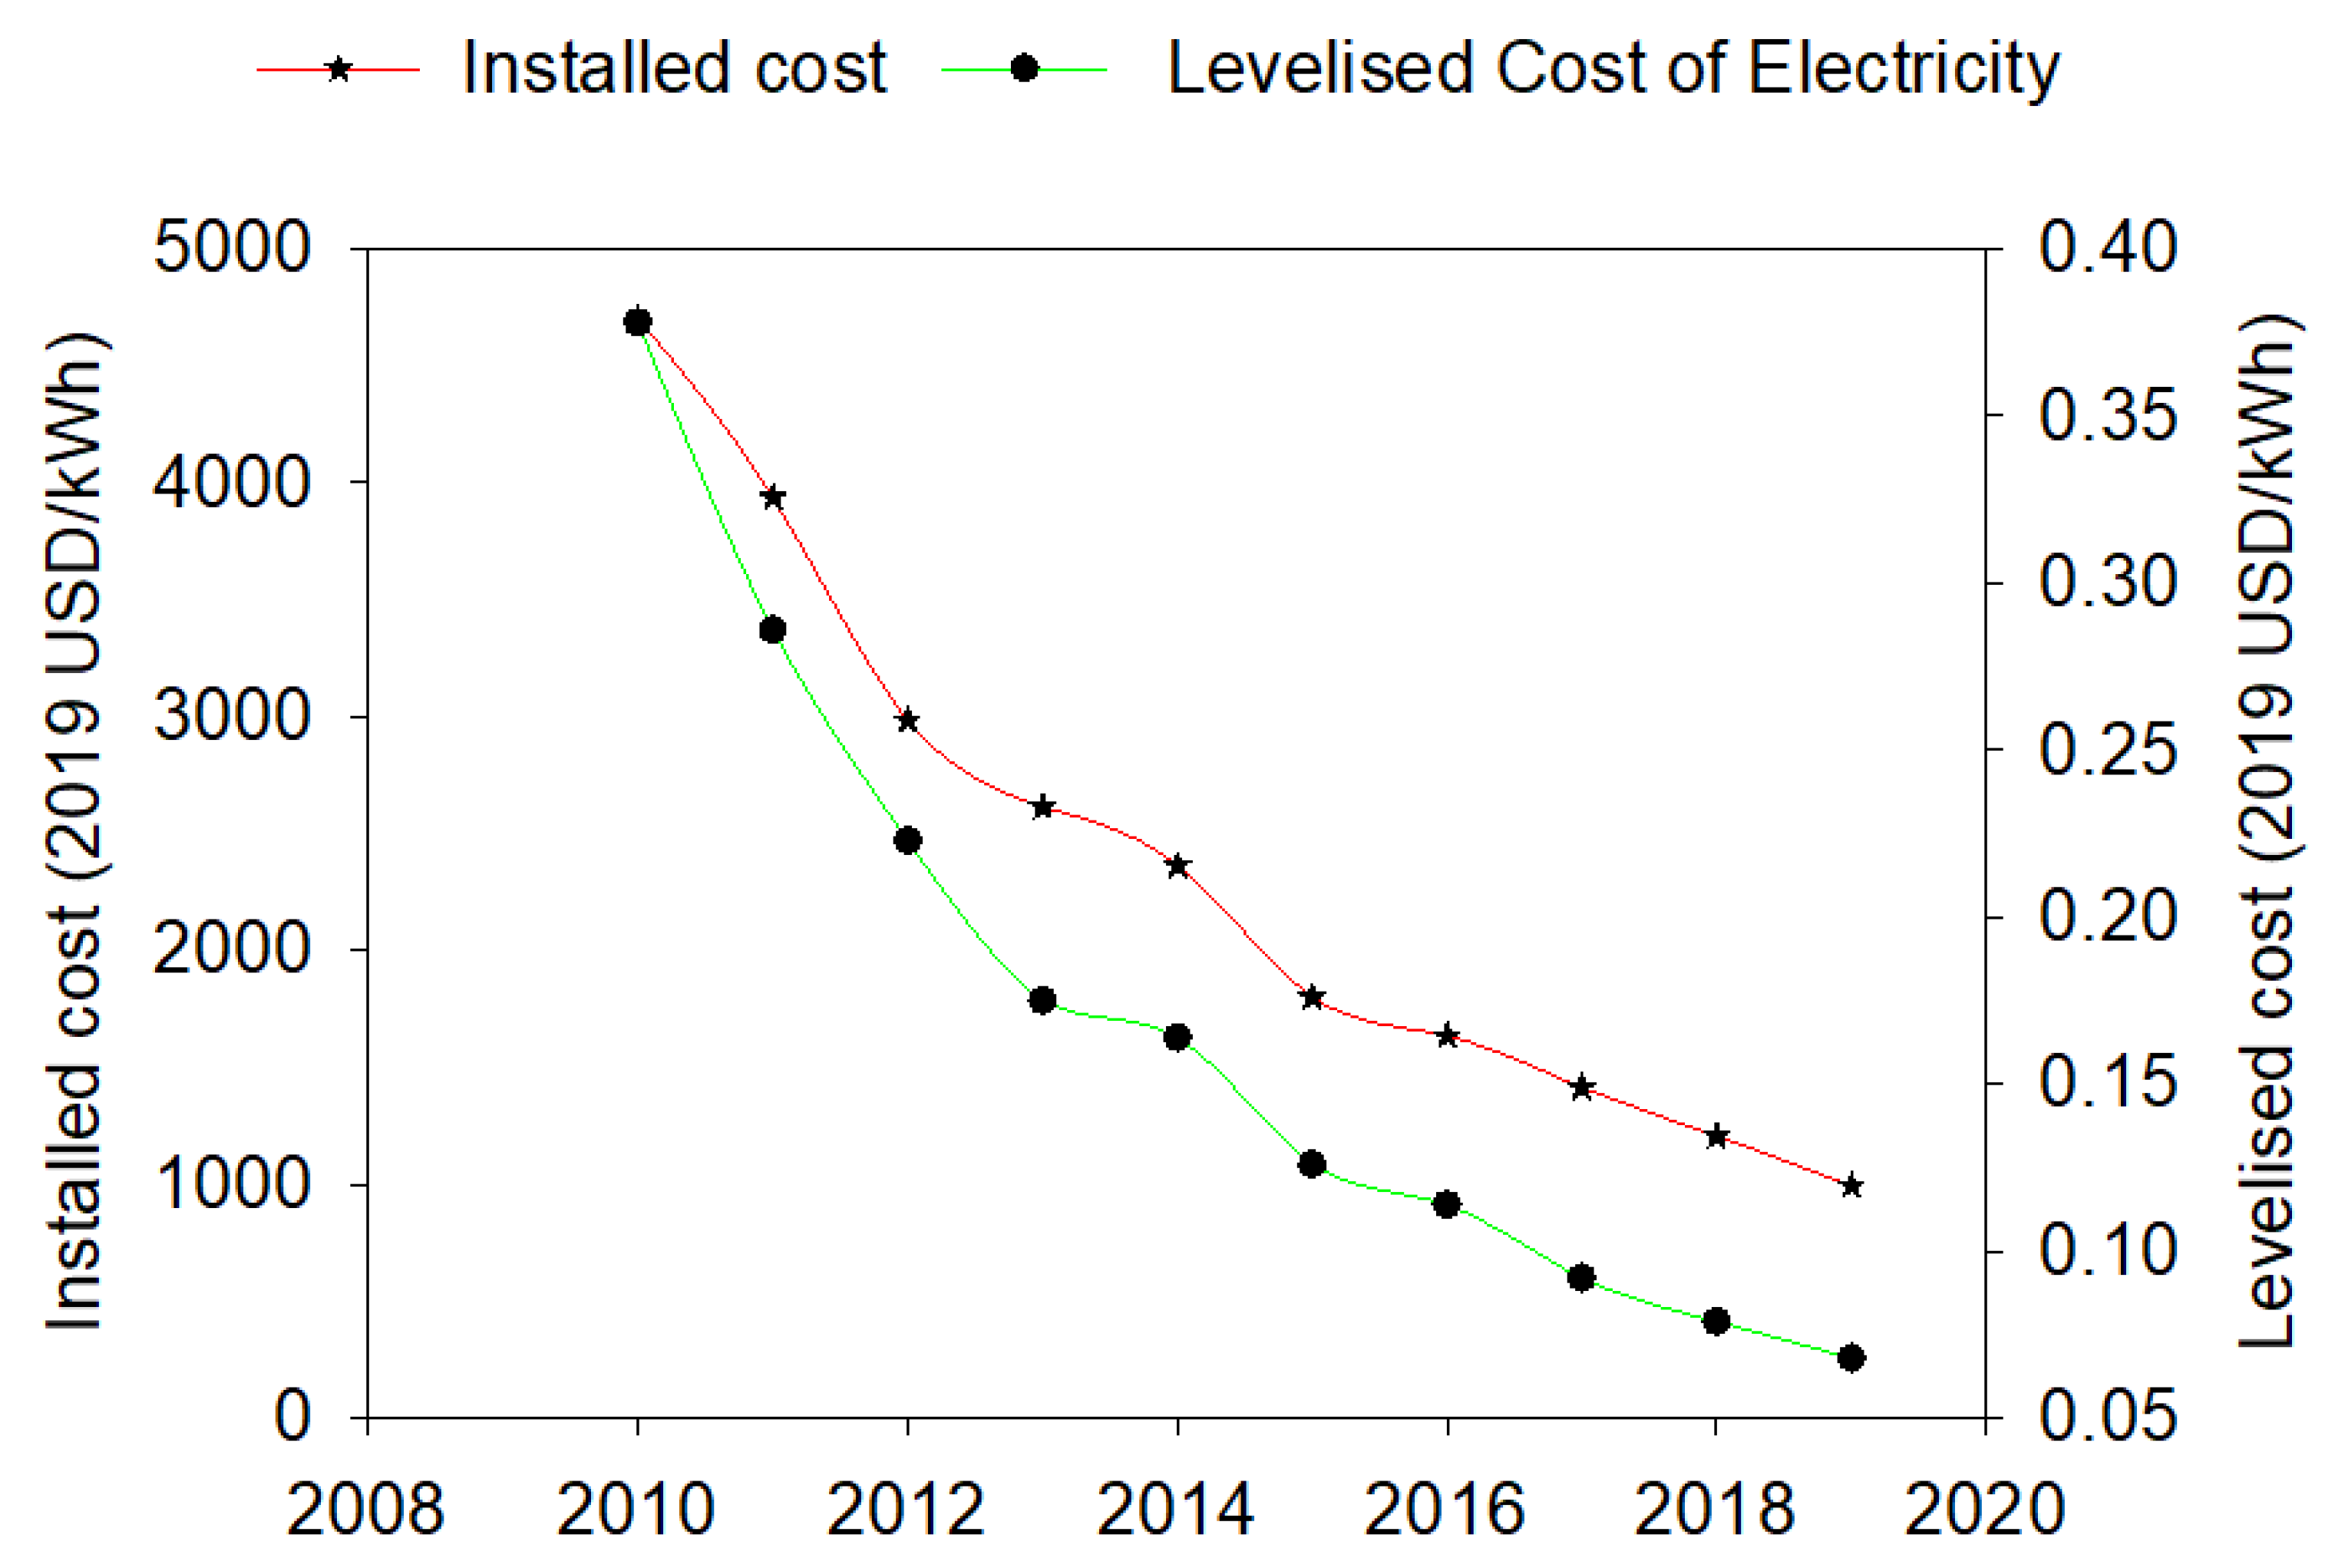
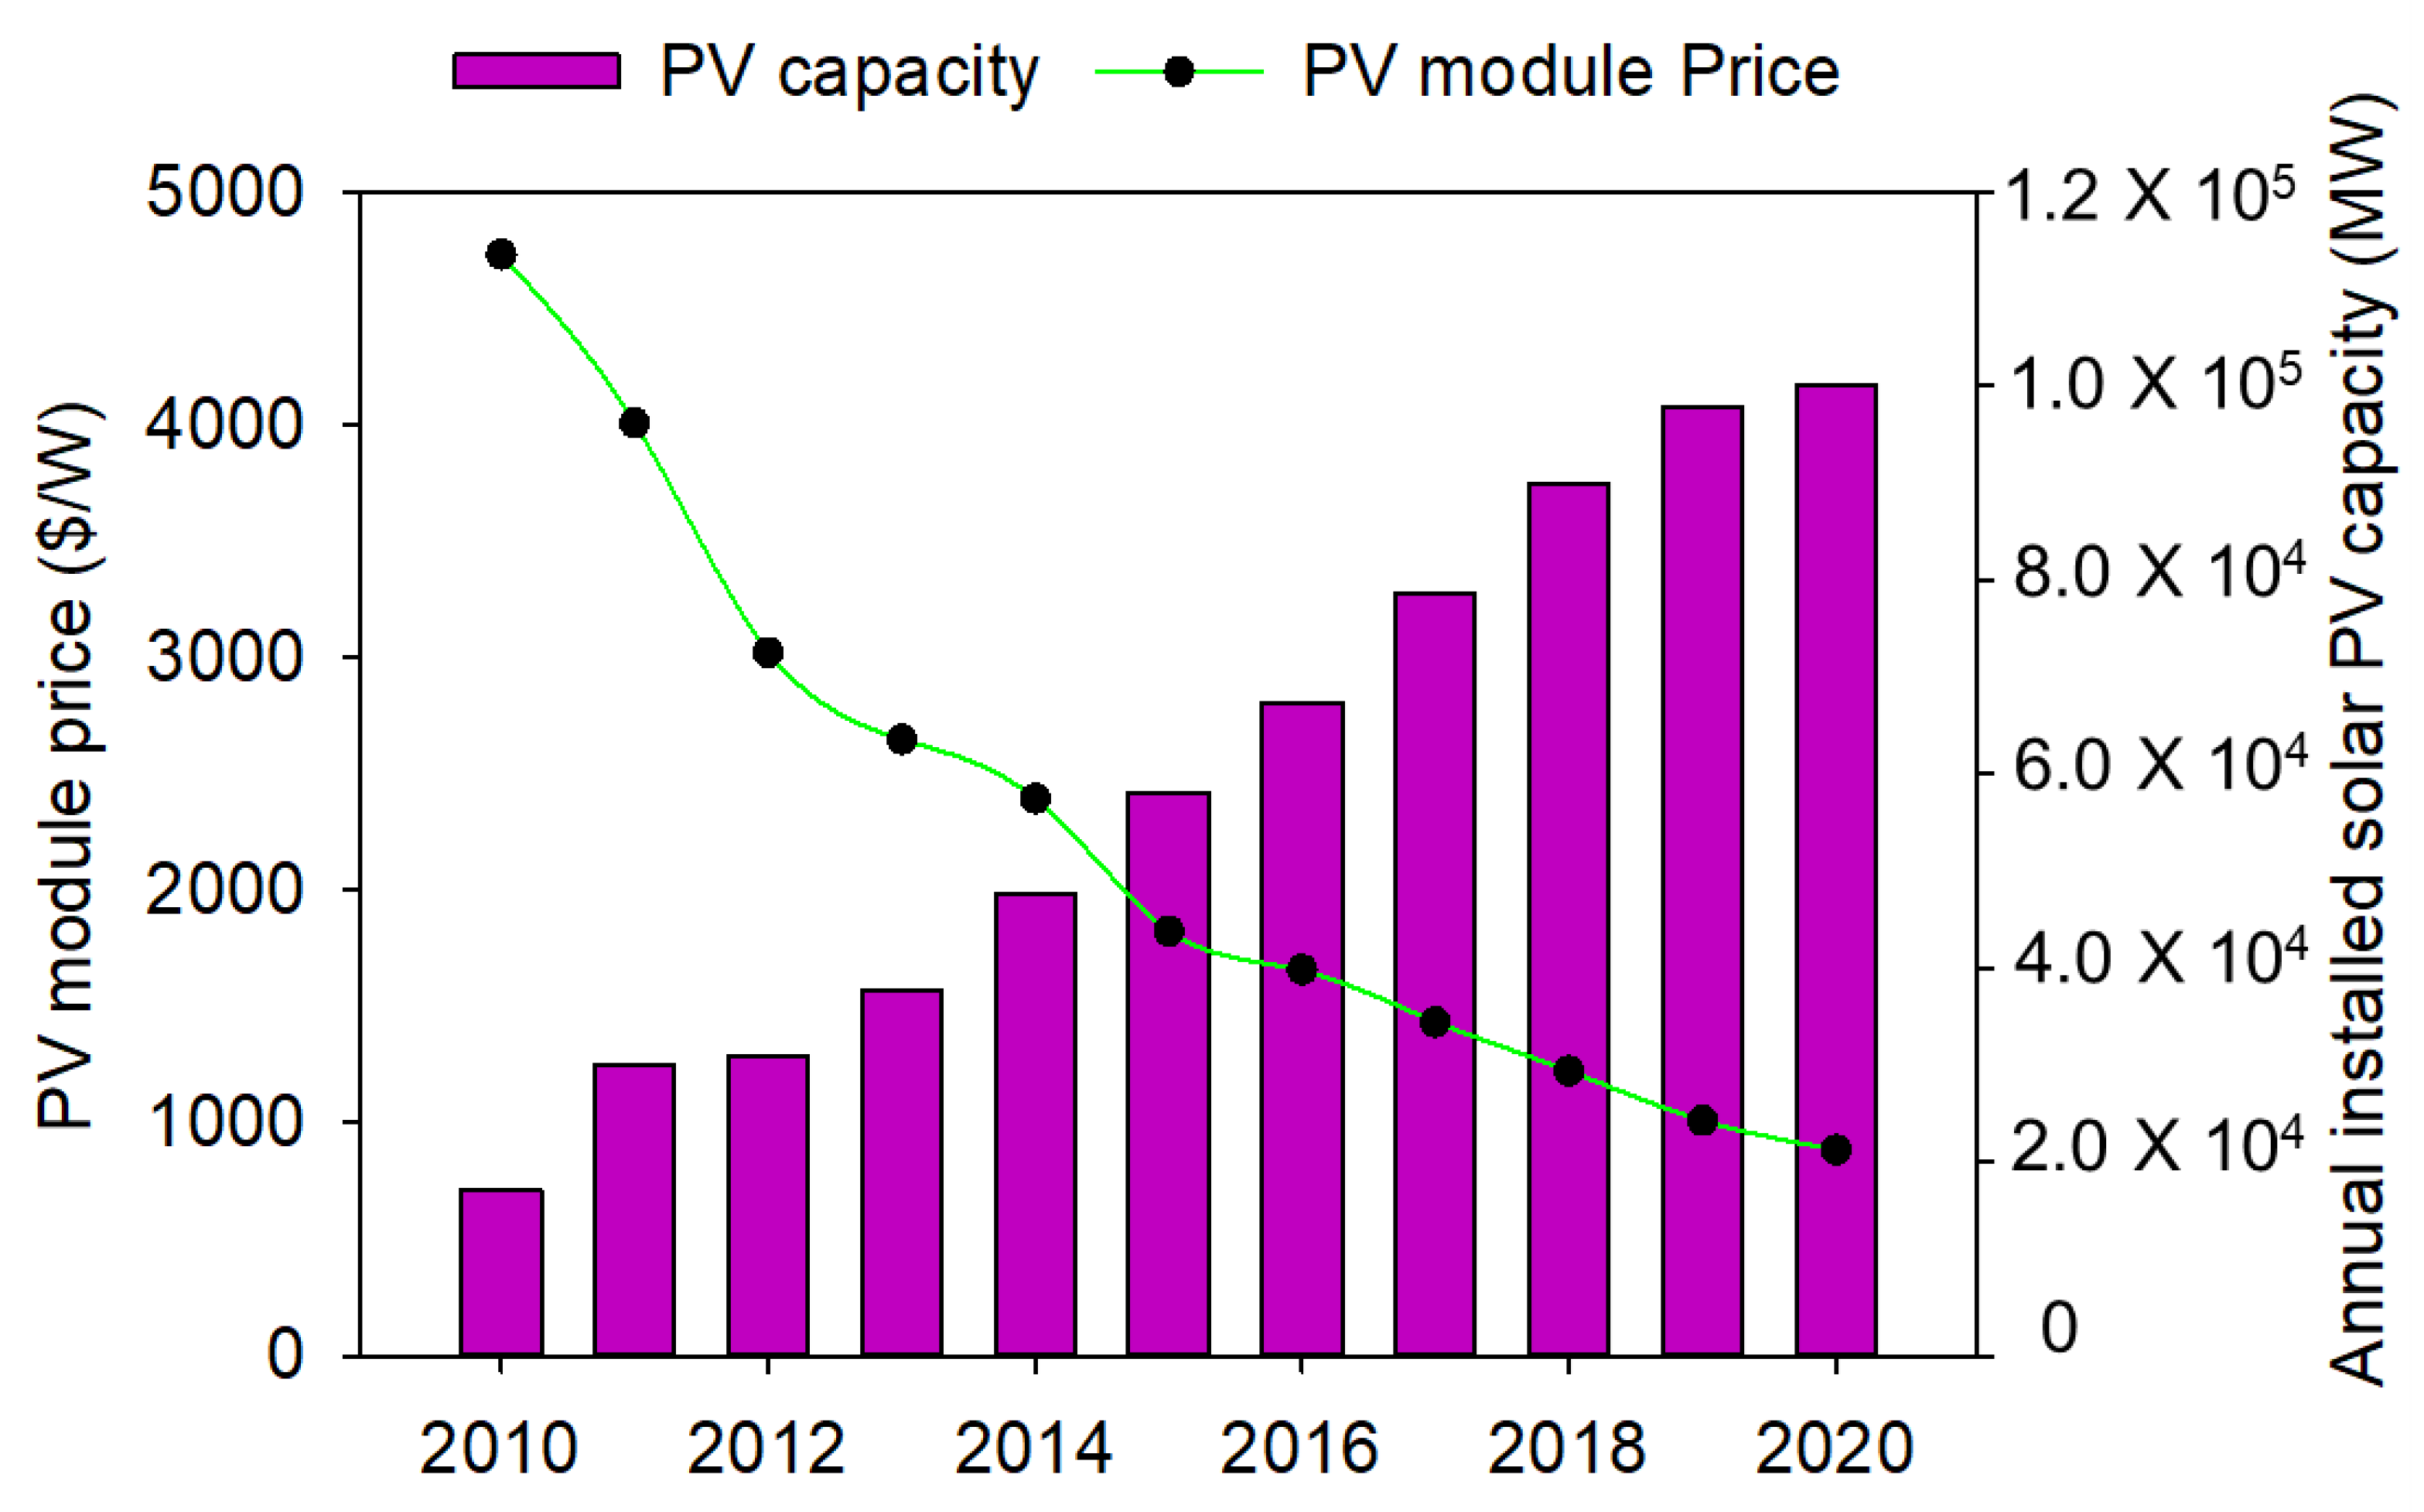
3.1. The Price Reduction and Installation Capacity of Photovoltaic Cells/Modules

Solar energy is pleasantly improving its affordability due to the impressive drop in prices and cost of installations both at utility and distribution levels. PV module prices have decreased over the past years, having degenerated by almost 100% since the 1950s [86]. This is because of tremendous variations in the cost of solar modules since 1975. In 1979, solar modules were approximately 100 times more expensive than they are now. The price of solar modules has dropped to 6.5% from the previous years due to technological advances.
On the other hand, the installation costs have been reduced by more than 70% since 2010, which is determined by mainly decreasing solar PV prices. However, the drop in prices has been influenced by many factors such as an increase in the quantity of production, the discovery of new technology, an increase in the efficiency of material, government support, and an increase in the lifespan of PV systems [87]. Figure 3 shows a drastic fall in installation and the levelized costs of electricity from 2010 to 2019, whereas Figure 4 shows the PV module prices and installations from 2009 to 2017 [7,88]. It is observed from Figure 4 that the amount of PV modules has extremely dropped from 4731 $/W in 2010 to 883 $/W in 2020, whereas the installation capacity had escalated exponentially from 17,065 MW in 2010 to 100,200 MW in 2020.
Furthermore, the evidence of continuous improvements in the PV cells and modules is shown in Figure 5.
Figure 5 presents that solar PV cell/modules will continue to grow in popularity globally from year to year. This rise in the PV industry could be due to the large-scale technological advancements and improvements in the power sector. The cost of PV module production has decreased considerably from USSD 100 per Watt in the 1970s to USSD 1.0 per Watt in 2016 [90]. In 2014, the overall growth was less than 20,000 MW. However, there was tremendous growth in 2015, where both c-Si cell and c-Si module recorded 20,000 MW each, but in 2016, they experienced a slight 20% rise. Thin-film and integrated cells/modules recorded less than 10,000 MW each in 2015 and decreased drastically in 2016. Only c-Si cells recorded more than 60,000 MW, with a slight rise in thin-film in 2017 but a fall in c-Si modules and a severe fall in integrated cells/modules.

3.2. The Trending Position of Current and Future Photovoltaic Power Generation around the World

Currently, scientific researchers are continuously improving PV power production globally. The international PV market has undergone a sudden rise since 1998, with an annual growth of 35% of the installed capacity. The installed cumulative PV capacity had also risen from 1200 MW in 2000 with a rapid increase up to 188 GW in 2014 and was found to be 490 GW by 2020 [91]. These fast advancements in PV production have created high competition in the market industries. Clearly, some nations such as the US, China, Japan, Germany, and South Africa have significantly improved in the PV market. The global PV modules at the end of 2014 were about 50 GW, in which China shared 27.2%, contributing to about 70% of the worldwide market [92]. Hence, as this swift development continues, the global market production outlook projects the PV to reach 266 GW by 2025 and 270 GW by 2030. Recently, there has been growing attention on PV prospects, investigation, and future. Most of the studies emphasized decreasing costs, expanding efficiency, and improving the present systems’ technical strategy [22].
On the other hand, many countries have also declared their strategies and policies to endorse PVs’ growth [93,94]. On 2nd June 2014, the US Environmental Protection Agency (EPA) issued its Clean Power Plan by declaring that renewable energy practices (as well as solar energy) will be doubled within the next ten years. In another development, the US Department of Energy (DOE) also spent $15 million to assist peoples’ initiatives and societies in developing the solar energy platform [95]. In the same vein, the Japanese government has passed laws, such as the Renewable Energy Special Measure Law and the Renewable Portfolio Standard Law, to ascertain the expansion of fresh energy ideas and tasks the parties for immense contributions [96]. China, from another angle, had emphasized a few essential and critical demonstration schemes of the PV technologies in the Outline of the National Program for Long- and Medium-Term Scientific and Technological Development (2006–2020), the National 11th Five-Year Scientific and Technological Development Plan, and the Renewable Energy 12th Five-Year Plan [93,94,95,96,97].
It is worth mentioning that Japan and the US have driven deep into the solar PVs’ “Industry Roadmap Through 2030 And Beyond”. At the same time, Japan anticipates collaborative work among academia, industry, and government to establish a PV market base that aims to develop a cumulative-installed PV rating of 100 GW capacity in 2030. On the other hand, the US expects that the expansion outline of the PV production could be improved from export-controlled to the national asset preoccupied with encouraging the industry’s meaningful progress by assigning on the improvement of the technologies and market growth of the local demand. In the US, it is expected that by 2030, there could be an annual installation of 19 GW of solar PVs with a corresponding cumulative installed capacity of 200 GW. Similarly, the PVs’ price will drop to about $0.06/kW, creating a significant share of the electricity market and developing into one of the critical sources of electricity.
However, the PV industry’s growth in South Africa is increasing rapidly to encounter the rise in energy demand. The country’s installed capacity for solar power is estimated to reach 8.4 GW by 2030 from 922 MW in 2014, thereby proposing to enter the ‘top 10’ capacity ratings [98]. Likewise, the country is projected to install more than four million solar modules and has plans to establish 1.6 million additional ones. The global solar power generation attains 500 GW in 2020, from 40.134 GW in 2014, making the solar power market a country leader. The newly installed PV capacity in ten leading countries is presented in Figure 6.
On the other hand, the contributions of PV technology to electricity are improving globally. According to the Statistical Review of World Energy, 2017, the total world value of the newly installed capacity was about 37.6 GW, which accounts for 53% of the world. Solar PV market research estimated that approximately 38% of the new solar PV modules were manufactured in China, Japan, the US, and Germany. China led in cumulative solar photovoltaics in 2017 with a capacity of 11.3 GW. The research by [100] on grid-connected PV systems in China showed that PV technology is swiftly emerging. The study noticed that China’s government offers unusual incentives to research and development (R&D) groups in the country for solar PV and enacts some policies for PV installations. The PV industry has experienced massive growth in the worldwide PV market for several years. The report presented by European Photovoltaic Industry Association (EAPIA), a global PV market outlook, showed that the world’s cumulative PV power installed was 22.9 GW in 2010, which rose by 45% when compared to 2008 (16 GW), and in 2017, it was about 139.6 GW, and a value of 55% was installed worldwide [99]. Figure 7 shows cumulative-Installed PV capacity in ten leading countries and the world.
Germany led the world’s PV market with a cumulative installed capacity of about 36 GW, accounting for 14% of the world’s overall capacity [99]. This was possible because of the German government’s targets to extend the share of electricity demand by solar PV by 10% in 2020 and 20% in 2030. Additionally, the total cumulative solar PV capacity would be 51.75 GW, increasing by 3.5 GW annually [7]. China topped up to 18.300 GW with the value of 7% of the world’s total capacity, whereas Italy and Japan shared 17.6 GW and 13.6 GW, respectively. However, the 2009 report showed that the US led in the PV market, while at the end of 2012, the US had attained the cumulative solar capacity by 7.2 GW but only grew to 12 GW in 2017. In 2021, China was leading in the world’s cumulative solar PV capacity with 306,973 MW (36.1%), followed by the United States with 95,209 MW (11.2%) and Japan with 74,191 MW (8.7%). It is equally shown that in 2015, 164 countries had equipped themselves with renewable energy prospects, of which about 45 aimed particularly at solar energy [101]. In November 2016, for instance, the European Commission approved a ‘Clean energy for all Europeans’ package (also called the ‘Winter Energy Package’), implementing legislative plans and other arrangements allowing the EU to meet its 2030 energy and climate aims [102].

4. The Importance of Solar Photovoltaics as Compared to Fossil Fuels

It is becoming more apparent that the prevailing global method of generating electricity through coal fire has been unsustainable for the past years. Fossil fuel power plants control over 90% of the global electricity generation. The plants are vertically integrated in the sense that it generates, transmits, and distributes electricity to internal markets and purchases and sells electricity to and from the developing communities. Fuel is typically stored in the form of energy carried as a primary energy, which must be converted for practical purposes. Therefore, it must be burned to generate electricity, and lots of energy is wasted in transporting from the coal-fired station to the consumers. Figure 8 shows that about 65% of the energy is lost from the consumers’ primary source.
Unfortunately, only one-third of the useful primary energy reaches the customers since the chain of transportation is associated with relatively high conversion losses. Furthermore, coal, as well as other fossil fuels, contributes to climatic change in countries. It is now widely believed that climate change is partly initiated by human-generated carbon dioxide, which presents a grave environmental risk to the world [19]. Therefore, the PV energy supply is paramount has an unlimited growth in demand, and extends to other benefits. Nevertheless, PV energy resources are a sustainable energy supply choice that can expressively moderate dependence on fossil fuels. Other benefits are job opportunities, nearness to point-of-use, and less reliance on intensive energy sources (and political power) in various circumstances. However, most of the materials in PV productions are potentially poisonous, which may be discharged into the environment through air or water; hence, proper waste management methods of wastes made by PV industries have been established and deliberated [21]. Table 1 highlights the advantages of PV energy over coal fire.
A very considerable effort has been undergone in the prospect of continuous utilization of fossil fuels to solve our potential desires by using carbon capture and sequestration (CCS) [103]. However, the deterioration of these fossil fuel reserves as well as the lesser efficiency of CCS make it a short-term solution. Recently, the contributions of renewable energy, especially solar and wind, in the global commercialization of energy are gradually increasing, though by less than 10%, as presented in Table 2.

5. Photovoltaic Generator, Optimal Sizes, and Electrical Load Management

The standard test conditions (STC) being used to assess the power of a solar module are described by three regulating states [105]: the full sun radiation (radiation strength E = ESTC = 1000 W/m2), the solar module temperature: =25 °C, and standard light spectrum AM 1.5. The rated or nominal power of the solar module is based on these conditions. It describes the module’s peak power under optimal conditions and is given in Watt peak (Wp). The generation and consumptions of the electrical energy in a PV system are essential since the energy produced should be more or equal to the amount consumed. Thus, the first step is to estimate the self-consumption level of solar energy, calculated as the ratio of directly consumed energy to generated PV energy [106]. According to the sign direction shown in Figure 9, the energy balance in a PV system is defined as the feed-in power, where P B = battery charge and discharge power, P P V = PV generated power, P L = electrical loads, P G = grid power, P F = feed-in-power, and Ps = self-consumption.
The schematic diagram in Figure 9 illustrates how the PV modules, the charge controllers, the battery banks, the conversion unit DC/AC (inverter), and the national grid connections were all incorporated into the load. A blocking diode assists the power to move only toward the charge controller. Regardless of this diode, the battery would discharge back to the solar module during low ir-radiance. The charge controllers were integrated with the MPPT devices to charge further and shield the batteries, preventing the danger of overcharging and attaining an excessive discharge level. The MPPT maintains that the maximum power produced by the solar array is detached immediately. The DC/AC conversion unit also supplies the conversion of the input current from the PV or the national grid to the alternating current needed by the load. Lastly, bidirectional energy metering measures the power to and from the grid. The excess energy generated from the PV power plant is fed into the power grid during a favorable day. With this, credit is given to offset the cost of any power drawn from the power grid. In the evening, the plant can produce no power, and a significant amount of power is drawn from the grid, thereby reversing the power meter and compensating for the excess that was fed to the grid. Presently, a broad study in terms of experimental and simulation research works on the use of PV systems is being undertaken to determine their potential role as distributed energy sources (DERs) to generate power from nonconventional energy means with few environmental effects. The optimum sizing of a PV array for a stand-alone hybrid/PV system was presented by [107]. The applications of independent PV systems to provide electricity to rural areas in Morocco were performed and presented good results [108].
On the other hand, there are other configurations of solar PV power plants, such as single-axis tracking, including vertical aligned (VSAT), horizontal (HSAT), horizontal with tilted modules (HTSAT), and tilted (TSAT) and polar aligned (PSAT) [109]. Additionally, two axes of rotational solar tracking systems are normally perpendicular to each other and need more complex organization systems. The study was undertaken on a 300 kW double-axis parabolic trough collector by Sun et al. (2016) and described that the optimized double-axis tracking plan boosted 15–17% efficiency of the double-axis as compared to the single-axis tracking strategy [110].

5.1. Problems of Grid Integration and Its Participation in the Ancillary Market

However, ancillary markets perform important functions in power system dependability in such a way that it integrates many of the functions needed to uphold the distribution of power from producers to the users while maintaining suitable system procedures. However, structural evaluation especially markets to assist increasing changes in production in the PV industry, and encounters different technical and economic obstacles, including market design, different variabilities of electricity prices, and instructions among several shareholders of PV modules [111,112].

5.1.1. Market Design

The transportation of ancillary services from power production to the places of consumption or sale remains an essential factor of consideration, bringing different cost-allocation problems especially where ancillary services could rise in one place in order to correct grid challenges in a different location. Another vital challenge is the allocation of transmission rights and determining who pays the actual cost of new transmissions.

5.1.2. Different Variabilities of Electricity Prices

The constant changes in power absorption in a solar PV system have continued to raise concerns in the PV market as compared to other renewable power supplies. It has always caused a hot challenge in PV operations and brought unnecessary uncertainties of electricity prices in PV-dominated markets. Hence, it is a problem that must be examined by PV power production enterprises, trading centers, and power dispatching centers. With the constant reshufflement of the electricity market, the present centralized supply method could be extremely altered. In this situation, different variabilities of electricity prices will have more effects on PV operations in the electricity market.

5.1.3. Instructions among Shareholders of Different PV Modules

The stakeholders may tag high prices and receive a small quantity of electricity absorbed by different PV modules due to the various techniques involved. The resulting problem is that power generation capacity varies and may require the same stakeholders to improve the system to generate enough electricity.

5.2. Photovoltaic Materials and Efficiency of Solar Module

A summary of the materials for solar PV cell fabrication is presented in Figure 10. From the current research, silicon material has remained a prominent technology in producing solar cells due to its better efficiency. Nevertheless, the cost for this material is very high, and alternative means are being used to fabricate solar cells at a reduced cost. Presently, thin-film technology has been identified as an alternative means [113]. This type of technology is cost-effective because it uses reduced materials, and furthermore, its layers are very thin with respect to both monocrystalline and polycrystalline solar cells. Although thin-film technology’s efficiency to build solar cells is not yet high, there is an unceasing emphasis on improving the low efficiency. One of the improvements made by researchers in this field of thin-films was the discovery of amorphous silicon, CdS/CdTe, and CIS [114]. These materials have been prioritized in thin-film technology, where studies are being conducted to learn how to improve their efficiency.
Many researchers have recently significantly improved thin-film technology by applying polymer or organic materials as a solar cell material. The polymer materials have been seen as beneficial in providing a clean, lightweight, and cost-effective option [115]. The efficiency is very low, in the range of 4–5% compared to other materials. Thus, the efficiency of materials remains a great interest of research in PV technology. However, solar module efficiency is when a module transmits the sunlight through photovoltaics into electricity. The efficiency of a solar module ranges from 11% to 22%, which differs among producers. Solar module efficiency is directly proportional to the power generated from the module per square meter. This means that efficiency remains among all essential factors in establishing PV technology marketwise. A comprehensive research effort is currently ongoing to advance the efficiency of solar cells intended for commercialization. Monocrystalline silicon solar cell efficiency has presented a great betterment annually. For instance, in the 1950s, it began at just 15%, rose to 17% in the 70s, and constantly accelerated to 28% in recent days. The investigations of Zhao et al. show how the expansion of contact, solar cell surface, and light trapping in polycrystalline solar cells increases solar cell efficiency. Polycrystalline solar cell efficiency has attained 19.8% at the moment, but then it lies in the range of 12–15% for commercialization [116]. Fraunhofer ISE has significantly worked on high-efficiency silicon solar cells, which have robustly been devoted to transmitting high-efficiency cell structures into industrial fabrication. The summary of solar PV technology is presented in Table 3.

6. Solar Material Information and Description

Crystalline Si (c-Si): Currently, these modules are the most popular due to their stability, high efficiencies in the range of 15–25%, and reliability. Commercially, the material has universally advanced where the module efficiency has attained over 80% market standard and maximum efficiency under standard test conditions (STC. There is the easy availability of silicon supply because the raw material found on the Earth’s surface is the second most abundant [117].
Monocrystalline module: The monocrystalline module has a higher efficiency of about 15% compared with polycrystalline modules and over 20% with other materials in commercial markets. The module is expensive, delicate, and has been confirmed to last up to 50 years.
Polycrystalline module: This module has a cheap raw material with lower efficiency than monocrystalline and other emerging materials. The module only converts 10–14% of solar radiation that fall on their surface [116]
GaAs: The semiconductor GaAs were produced due to covalent bonding between gallium (Ga) and arsenic (As), with a comparable silicon shape. Its high efficiency, ranging from 20 to 25%, is due to the high bandgap of 1.43 eV. Alloying elements such as Al improve the efficiency of P, In, and Pb devices. It is applied in space and for concentrators of PV modules due to the great heat resistance. GaAs material is lighter than polycrystalline and monocrystalline silicon, though the manufacturing device is costly [118].
Thin-film solar modules: This technology is designed by slotting thin layers of semiconductor materials on top of different surfaces, usually a sheet of glass. Due to low-quality material and few manufacturing processes, this module is known for its cheaper solar cell-based crystalline silicon production costs. It has a thickness of about 35–260 nm [119]. However, the most prominent disadvantage is the low efficiency which ranges between 4–7%. A thin-film module is twice the same amount of electricity produced by polycrystalline modules and almost three times that of monocrystalline. It is flexible, easy to install on rough surfaces, and resistant to harsh climatic conditions.
Amorphous silicon (a-Si): This technology is most familiar in thin-film and other materials such as CdS/CdTe and CIS/CIGS but prone to degradation [120]. The light absorption of a-Si is 40 times greater than its monocrystalline with a noncrystalline arrangement of silicon pattern. The high bandgap of 1.7 eV was provided due to the haphazard structure incurred as a benefit [121]. The research work presented by Radue et al. examined that each of these technologies, single junction, triple junction, as well as flexible triple junction a-Si, degraded by 45%, 22% and 27%, respectively [122].
Cadmium terride (CdTe) and cadmium sulfide (CdS): CdTe has a high efficiency of 15%, while the company First Solar recorded 17.3% in 2011. It has a high absorption coefficient as well as an ideal bandgap of 1.45 eV; hence, it is an encouraging material in thin-film technology [123]. This technology remains one of the raw materials applied in order to intensify the low efficiency in thin-film technology. Moreover, the technology has gained attention for a long time due to the stability of CdS/CdTe material [114]. Copper doped with CdS will develop into photoconductive material since it is an n-type semiconductor [124]. An experiment performed by [125] on CdTe solar cell characteristics demonstrates that the chemical heat treatment is required to generate superior cells.
Copper indium gallium selenide (CIGS) and copper indium selenide (CIS): This type of technology has a high optical absorption coefficient with light CIGS modules compared to crystalline silicon modules. It is more easily adaptable to hot weather conditions than silicon is. The modules and cell efficiencies of 13% and 20%, respectively, have been reported [126] with a direct bandgap of 1.68 eV. The experiment conducted by Meyer and van Dyk [127] to study CIS’s performance plus other thin-film materials revealed that just 10% of CIS was degraded compared to other thin-film materials once exposed to 130 kW h/m2 outdoor conditions.
Organic and polymer cells: The technology for the organic solar module is fast-growing, similar to CIS/CIGS. It has a low efficiency of about 4–5%, although it has additional benefits such as ease in disposal, cheap material, and mechanical flexibility [128]. The experiment performed by Gorter et al. [115] to study the performance of 15 polymers established that a few polymers exhibited a high prospect for future substitution of silicon PV modules. Additionally, Peumans et al. [129] proposed raising the voltage output from organic material; there is a need to create and establish comprehensive absorption band materials.
Hybrid solar module: When a crystalline silicon material combines with another noncrystalline silicon, a hybrid solar module is produced. Wu et al. [130] estimated that choosing amorphous and crystalline silicon will develop a very high-performance ratio for cost. In the same way, Sanyo, a company from Japan and one of the leading solar cell producers, has established the efficiency of a 21% hybrid solar cell named heterojunction with an intrinsic thin layer (HIT) and fundamentally behaves as a light absorber due to the n-type CZ silicon wafer solar cell.
Dye-sensitized solar cell: This technology arises to meet the high cost of raw material, low efficiency, and environmental challenges of some solar cell materials. Many researchers are developing plans to bring forth a new and sophisticated technology known as a dye-sensitized solar cell. Usually, the five principles of the dye-sensitized solar cell are found [131]. Thus, for a healthy competition with the current technology, the material is envisaged as a nice material, especially in fabricating solar cells.

7. Socioeconomic Impacts of Photovoltaic Technology

The solar PV industry has sustained itself expansively in creating several jobs globally. The industry provides different jobs in numerous fields where different skills are needed. The different job opportunities range from research-connected, highly skilled employments in the enterprise and fabricating solar energy goods to employments demanding a minor level of experiences such as the repairs of renewable energy systems and processes. In 2014, for instance, virtually 3.3 million people were employed by the solar energy industry, where the solar PV in particular recorded 2.5 million jobs [132], while in 2018, Asia alone presented more than 3 million PV employment, or close to nine-tenths of the global. Therefore, a significant aspect of the job opportunities was found in Asia, particularly in manufacturing solar instruments [133]. While there was a weak employment opportunity for solar PV in Europe, job expansion has been robust and healthy globally.
Moreover, the solar heating and cooling sector has given job opportunities to more than three-quarters of a million people worldwide in 2014, with serious markets in Brazil, China, and India [134]. Countries such as China, Japan, India, Germany, and the US have contributed immensely to job creation globally in the solar PV manufacturing sector. In 2017, global solar PV manufacturing companies had an excellent period, with 94 gigawatts (GW) installations from 73 GW in 2016 and a meaningful fresh job establishment [102]. The US, China, India, and Japan were the top essential markets, succeeded by Australia, Turkey, Korea, and Germany [135]. Furthermore, employment opportunities improved by 8.7% to reach 3.37 million jobs in 2017, while the uppermost five nations, led by China, recorded 90% of solar PV jobs globally [134]. Generally, Asia holds the key to virtually 3 million solar PV jobs which denote 88% worldwide, seconded by North America with a value of 7%, and then followed by Europe with 3% of the PV [136]. On the contrary, European PV jobs kept descending, replicating partial local installation markets and an absence of rivalry amongst European module producers. Reviewed evaluations show an 8% drop to 99,600 employment across the European Union in 2017 [137]. More amazingly, US jobs decreased for the first time, roughly by 233,000 employments [19]. Japan’s decelerating step brought down job opportunities from 302,000 in 2016 to 272,000 in 2017. As solar PV deployment increases, more nations will profit from employment opportunities in line with the supply chain, mainly in installations, developments, and repairs [138]. Figure 11 shows renewable energy job opportunities with solar PV increasing yearly from 1.36 million jobs in 2012 to 3.75 million in 2019.
Generally, the top nations account for approximately 87% of the global solar PV workers, which shows that employment and industries linger in a minority of the countries. This worldwide analysis comprises approximate 372,000 off-grid employments for South Asia and parts of Africa.
In reference to the European Photovoltaic Industry Association (EPIA)–Greenpeace research, extra employment opportunities are produced in the installation and servicing of PV systems by 2030. Hence, approximately 10 million permanent employments would be put in place by advancing solar power globally. According to the study presented by the industry, the prediction is that out of 10 jobs, each MWp (megawatt peak) would be produced during manufacturing, while roughly 33 jobs, each MWp would be produced in the course of installation. Totaling the systems and indirect supply, such as manufacturing procedures, produces 3–4 jobs for each MWp. The study presents an extra 1–2 jobs for each MWp [140]. Moreover, the rate of jobs being manufactured from solar, according to the report by Electric Power Research Institute (EPRI), is 7.14 jobs per MWp for PV while the working service rate is 0.12 jobs per MWp for PV [141]. Regarding the European Renewable Energy Council (EREC) research, with the estimated development of solar thermal, over half a million people will be engaged in the solar thermal section in just a few periods. According to the study by [142], in concentrated solar panel power plants, each 100 MWp installed will generate 400 permanent jobs corresponding to 600 contracting and installation job opportunities and 30 yearly employment. Table 3 summarizes the top renewable energy employments in 2016/2017 [143].
Nevertheless, many literature reviews have studied the effects of employment opportunities from the applications of integrated energy, single measures, and climatic strategies. Several analyses on the area were established by [144,145,146,147,148], comprising the fossil fuel-based and green technologies. The influences of employment were broadly categorized into direct, indirect, and induced jobs. Direct employment resulted from the invention of renewable energy, maintenance activities, all activities associated with the organization throughout the asset’s lifetime or strategy studied, and installation on-site. The indirect employments mean the effects of the supply chain on renewable energy-related undertakings. In this case, the job protects every specialized record in activities such as raw materials, marketing and sales, transport, processing, extraction, and equipment delivery. All the macroeconomic effects being produced lie within the induced employments. They are found in the activities undertaken by direct and indirect employees and relate to every segment indirectly related to renewable energy. Each effect produced needs a reliable estimation system. If the direct effects are simply noticeable from the study of item research, then the quantification of indirect and induced employment needs the application of macroeconomic models that manage to grip the organization of the economic scheme under examination.

8. Policies Adopted That Helped to Boost Solar Photovoltaic Systems in Leading Countries

For the past few decades, the growth of solar PV systems has been powered by the application of different assisting policies targeted at decreasing the breach between the price of PV energy and the energy price for conservative production. Hence, the enrolment of these strategies has encouraged the decline of PV energy prices, making it easy in the past years, especially in 2012 and 2013, for “fuel parity” in many countries. Notwithstanding, solar PV is still very expensive, and its growth involves sufficient supportive devices such as simple grid-connection techniques.
Several methods of funding have been established for PV sectors for the past decade, such as tax credits, capital subsidies, net-metering, VAT reduction, feed-in tariffs (FiTs), and renewable portfolio standards (RPS), etc. In the US, for instance, the growth of the PV system has been mostly motivated by net metering, RPS strategies, and tax credits (flexible in each state), while in Europe, PV was assisted primarily by net-metering and FiTs. A summary of various fiscal enticement approaches is presented in [149,150,151], which account for two fascinating descriptions relating to the rules for PV system benefit in the EU, and hence can help one comprehend the way the assistance policies have progressed for the current years.
The influences of capital subsidies on the PV market in Europe have been analyzed by [152,153,154,155]. Additionally, in [156], a small study of electricity generation from RES in Slovenia is described. The authors stated that soft loans, FiTs, and capital subsidies are the most appropriate methods to fuel power generation from RES. In [157], the author projects an economic model and a computer simulation to regulate the most suitable FiT for grid-connected PV systems. Presently, various countries are rapidly identifying the policy and strategies of solar energy to offer sustainable energy, as observed in Table 4.
However, the strategic conclusion for productive PV supportive parks is to have a bond between the fiscal assistance and the position of the installed PV system. A parametric assistance study is undertaken in [160] to examine the economic feasibility of big PV plants in Cyprus without appropriate assistance. The results show that the capital expenses of a PV package are a serious factor for the feasibility of the scheme without the availability of FiT. In another development, the Greek PV market is examined in [161], where authors deduce that the FiT importance should be used in connection to the position/part of the installation to eliminate unnecessary pay for the PV customers. Additionally, in [162], the authors investigate the installed solar PV and thermal collector capacities per capita in 15 EU nations and their assistance devices for PV electricity. They deduced that capital subsidies and inducements are significant in supporting solar thermal and PV collectors. The authors [163] produce a linear programming model capable of ideally powering a grid-connected PV system for domestic uses to reduce the annual energy charge use, including PV savings price, maintenance price, utility electricity price, and deducting the revenue from marketing the extra electricity. In [164], a study of PV systems in Spain, Greece, and Germany was performed by examining the key parameters that influence the efficiency of PV policies. The investigation indicates that, over a definite profit stage, risk-related issues, such as policy variability and managerial obstacles, are a significant part of promoting investment choices rather than return-related features such as the level of an FiT. In [165], the authors carry out a comparative economic study of specific European funding devices in PV sectors, centered on the design of discounted cash flows (DCF), NPV, and IRR. An isolated domestic PV plant in Italy was economically assessed [158] to estimate the economic viability with respect to the PV assistant devices. The status of PV electricity and policies was examined in Germany, Japan, Spain, China, and the US, deducing that, to obtain a quantifiable result on market development as well as to attain a varied cross-section of customers, trade funding terms need to be fluctuating. An innovative procedure for computing the economics of a domestic PV sector was undertaken in [166]. The authors applied this procedure to create the economic feasibility of several PV sectors in Ireland. In [167], the authors examined the factors of investment risk in the PV production in Italy by a scenario analysis, risk analysis, and sensitivity analysis. They declare that PV industries will definitely have prospects in Italy; however, eliminating the normalization limits, simplification of the mechanisms as well as extra funds are main features for more dissemination of PV. Lastly, in [168], the authors described a mechanism for assessing the prospect of PV systems in urban setting with regards to the difference of the key economic factors and financial inducements.
FiTs are, undoubtedly, the most extensive assistant device approved globally, with a market portion equivalent to about 60% in 2012 [159]. The second most widespread devices are the tax rebates and direct subsidies, which have about 20% share, after which follows self-consumption (12%), RPS (4%), and net-metering (2%). It is, however, remarkable that for the past decades, electricity reparation systems (self-consumption and net-metering) have risen their market share, increasing from a 4% to 14% in 2012. This improved distribution was supported through a concurrent decline in the application of the FiT device, which missed approximately 10 points of its worldwide market portion. The purpose is to reduce PV prices, which encouraged numerous administrations to decrease or eradicate the FiT system and alternatively initiate self-consumption regulations.
In another development, Australia, the US, and Europe have accomplished the grid utility-scale solar subsidies such as feed-in-premiums (FIPs) and feed-in-tariffs (FiTs). In the US, the utilities providers sign long-term power purchase agreements (PPAs) where developers safeguard the power plant’s income streams. Some governments likewise offer investment or production tax credits to improve solar expansion. For dispersed schemes, FiTs and net metering have shown fruitful procedures. The FiT price adopted in Germany, for example, is ten times that of thermal power and is paid within 20 years [133], whereas in Japan, subsidies are offered per kWp installation [169].

9. Conclusions

A few countries have recently established solar-based technologies as alternative energy resources to confront most countries’ energy and economic challenges sustained by fossil fuels. In order to keep pace with the fast economic growth and to face the risk of climatic change, some strategies were developed to encourage the use of solar photovoltaic systems in every field. This paper reviewed the contributions of solar photovoltaic systems to environmental and socioeconomics aspects of national development. The conclusions which address the objective’s aspects are:
The price analyses show that the cost of photovoltaic modules has significantly dropped from 4731 $/W in 2010 to 883 $/W in 2020, making solar energy affordable for low-income earners.
Upon examination of different photovoltaic materials and technologies, it was noticed that the efficiency of photovoltaic technology, such as crystalline silicon, has improved from 15 to 25%, while GaAs has risen from 20 to 25%.
The study highlighted the top countries that led in the world’s photovoltaic market in 2021 with a cumulative installed capacity; China led with 306,973 MW, followed by the United States with 95,209 MW, Japan with 74,191 MW, Germany with 58,461 MW, India with 49,684 MW, and Italy 22,698 MW.
The world’s yearly energy consumption has risen to 10 TW and is projected to increase to 30 TW by 2030.
Solar photovoltaics is policy-motivated, and the rest of the world needs to emulate the strategies of the top nations to participate in photovoltaic deployment, including net metering, VAT reduction, feed-in-tariffs, and renewable portfolio standards
Solar photovoltaics is an excellent emerging manufacturing system with 94 GW installations in 2017 from 73 GW in 2016; hence, it is a platform for job creation.

10. Future Works

Recently, solar PV technologies have been analyzed through an enhanced aging assessment to determine their suitability for the application. In many of the earlier research studies, the PV experimental conditions have not reproduced international techniques, such as International Electrotechnical Commission (IEC) conditions, which effectively assist experts in improving the governing rules on PV productions. Therefore, future research analysis may incorporate the PV system that must be validated according to high standards to guarantee the works’ dependability.
Furthermore, in the future, it is necessary to prepare many energy scenarios in the decision-making platform. This will help attain the maximum prospect for concerns of spatial installation and temporal market-driven trade-offs.
Additionally, the yearly average solar radiation was used to estimate the solar resources, not minding the effect of the solar radiation that varies on power production. Hence, real-time and GIS solar radiation datasets should be incorporated in future studies.

Funding

The research was funded by Govan Mbeki Research and Development Centre (GMRDC) at the University of Fort Hare and the National Research Foundation (NRF) of South Africa.

Data Availability Statement

Data is provided based on request.

Acknowledgments

The authors wish to express their gratitude to the Govan Mbeki Research and Development Centre (GMRDC) at the University of Fort Hare and the National Research Foundation (NRF) of South Africa for their financial support.

Conflicts of Interest

The authors declare that there is no conflict of interest regarding the publication of this review.

References

  1. Luna-Rubio, R.; Trejo-Perea, M.; Vargas-Vázquez, D.; Ríos-Moreno, G.J. Optimal sizing of renewable hybrids energy systems: A review of methodologies. Sol. Energy 2012, 86, 1077–1088. [Google Scholar] [CrossRef]
  2. Müller-Fürstenberger, G.; Wagner, M. Exploring the environmental Kuznets hypothesis: Theoretical and econometric problems. Ecol. Econ. 2007, 62, 648–660. [Google Scholar] [CrossRef]
  3. Rathore, N.; Panwar, N.L.; Yettou, F.; Gama, A. A comprehensive review of different types of solar photovoltaic cells and their applications. Int. J. Ambient Energy 2019, 42, 1–18. [Google Scholar] [CrossRef]
  4. Bukhary, S.; Ahmad, S.; Batista, J. Analyzing land and water requirements for solar deployment in the Southwestern United States. Renew. Sustain. Energy Rev. 2018, 82, 3288–3305. [Google Scholar] [CrossRef]
  5. MacDougall, A.H.; Friedlingstein, P. The origin and limits of the near proportionality between climate warming and cumulative CO2 emissions. J. Clim. 2015, 28, 4217–4230. [Google Scholar] [CrossRef]
  6. Trenberth, K.E.; Fasullo, J.T.; Balmaseda, M.A. Earth’s energy imbalance. J. Clim. 2014, 27, 3129–3144. [Google Scholar] [CrossRef]
  7. Sahu, B.K. A study on global solar PV energy developments and policies with special focus on the top ten solar PV power producing countries. Renew. Sustain. Energy Rev. 2015, 43, 621–634. [Google Scholar] [CrossRef]
  8. Suganthi, L.; Samuel, A.A. Energy models for demand forecasting—A review. Renew. Sustain. Energy Rev. 2012, 16, 1223–1240. [Google Scholar] [CrossRef]
  9. Russo, A.C.; Rossi, M.; Germani, M.; Favi, C. Energy Label Directive: Current limitations and guidelines for the improvement. Procedia CIRP 2018, 69, 674–679. [Google Scholar] [CrossRef]
  10. Labanca, N.; Bertoldi, P. Beyond energy efficiency and individual behaviours: Policy insights from social practice theories. Energy Policy 2018, 115, 494–502. [Google Scholar] [CrossRef]
  11. Rosenow, J.; Bayer, E. Costs and benefits of Energy Efficiency Obligations: A review of European programmes. Energy Policy 2017, 107, 53–62. [Google Scholar] [CrossRef]
  12. World Energy Council. Energy Efficiency: A Worldwide Review: Indicators, Policies, Evaluation; World Energy Council: London, UK, 2004. [Google Scholar]
  13. Wettestad, J.; Gulbrandsen, L.H. The Evolution of Carbon Markets: Design and Diffusion; Routledge: England, UK, 2017; ISBN 135185559X. [Google Scholar]
  14. Ciulli, F. Institutional Complexity and Sustainable Development in the EU Electricity Sector; Universiteit van Amsterdam: Amsterdam, The Netherlands, 2016; ISBN 9402802177. [Google Scholar]
  15. Sebitosi, A.B. Energy efficiency, security of supply and the environment in South Africa: Moving beyond the strategy documents. Energy 2008, 33, 1591–1596. [Google Scholar] [CrossRef]
  16. Tobnaghi, D.M.; Madatov, R.; Naderi, D. The effect of temperature on electrical parameters of solar cells. Int. J. Adv. Res. Electr. Electron. Instrum. Eng. 2013, 2, 6404–6407. [Google Scholar]
  17. AL-Rousan, N.; Isa, N.A.M.; Desa, M.K.M. Advances in solar photovoltaic tracking systems: A review. Renew. Sustain. Energy Rev. 2018, 82, 2548–2569. [Google Scholar] [CrossRef]
  18. Tyagi, V.V.; Rahim, N.A.A.; Rahim, N.A.; Selvaraj, J.A.L. Progress in solar PV technology: Research and achievement. Renew. Sustain. Energy Rev. 2013, 20, 443–461. [Google Scholar] [CrossRef]
  19. Kabir, E.; Kumar, P.; Kumar, S.; Adelodun, A.A.; Kim, K.-H. Solar energy: Potential and future prospects. Renew. Sustain. Energy Rev. 2018, 82, 894–900. [Google Scholar] [CrossRef]
  20. McGinn, D.; Green, D.; Hinrichs-Rahlwes, R.; Sawyer, S.; Sander, M.; Taylor, R.; Giner-Reichl, I.; Teske, S.; Lehmann, H.; Hales, D. Renewables 2013, Global Status Report (REN21). 2013. Available online: www.ren21.net (accessed on 1 June 2021).
  21. Rabaia, M.K.H.; Abdelkareem, M.A.; Sayed, E.T.; Elsaid, K.; Chae, K.-J.; Wilberforce, T.; Olabi, A.G. Environmental impacts of solar energy systems: A review. Sci. Total Environ. 2021, 754, 141989. [Google Scholar] [CrossRef]
  22. Tawalbeh, M.; Al-Othman, A.; Kafiah, F.; Abdelsalam, E.; Almomani, F.; Alkasrawi, M. Environmental impacts of solar photovoltaic systems: A critical review of recent progress and future outlook. Sci. Total Environ. 2020, 759, 143528. [Google Scholar] [CrossRef]
  23. Al Dulaimi, N.H.; Alkhalidi, D.A. Design of an Off–Grid Solar PV System for a Rural Shelter; School of Natural Resources Engineering Management: Amman, Jordan, 2017. [Google Scholar]
  24. Benedetti, D.; Agnelli, J.; Gagliardi, A.; Dini, P.; Saponara, S. Design of an Off-Grid Photovoltaic Carport for a Full Electric Vehicle Recharging. In Proceedings of the 2020 IEEE International Conference on Environment and Electrical Engineering and 2020 IEEE Industrial and Commercial Power Systems Europe (EEEIC/I&CPS Europe), Madrid, Spain, 9–12 June 2020; pp. 1–6. [Google Scholar]
  25. Bhattacharyya, S.C. Mini-grid based electrification in Bangladesh: Technical configuration and business analysis. Renew. Energy 2015, 75, 745–761. [Google Scholar] [CrossRef]
  26. Harrouz, A.; Abbes, M.; Colak, I.; Kayisli, K. Smart grid and renewable energy in Algeria. In Proceedings of the 2017 IEEE 6th International Conference on Renewable Energy Research and Applications (ICRERA), San Diego, CA, USA, 5–8 November 2017; pp. 1166–1171. [Google Scholar]
  27. Thirugnanasambandam, M.; Iniyan, S.; Goic, R. A review of solar thermal technologies. Renew. Sustain. Energy Rev. 2010, 14, 312–322. [Google Scholar] [CrossRef]
  28. Beylot, A.; Payet, J.; Puech, C.; Adra, N.; Jacquin, P.; Blanc, I.; Beloin-Saint-Pierre, D. Environmental impacts of large-scale grid-connected ground-mounted PV installations. Renew. Energy 2014, 61, 2–6. [Google Scholar] [CrossRef]
  29. Mahmoud, M.; Ramadan, M.; Naher, S.; Pullen, K.; Olabi, A.-G. The impacts of different heating systems on the environment: A review. Sci. Total Environ. 2020, 766, 142625. [Google Scholar] [CrossRef]
  30. Fong, K.F.; Chow, T.T.; Lee, C.K.; Lin, Z.; Chan, L.S. Comparative study of different solar cooling systems for buildings in subtropical city. Sol. Energy 2010, 84, 227–244. [Google Scholar] [CrossRef]
  31. McCubbin, D.; Sovacool, B.K. Quantifying the health and environmental benefits of wind power to natural gas. Energy Policy 2013, 53, 429–441. [Google Scholar] [CrossRef]
  32. Liu, S.-Y.; Perng, Y.-H.; Ho, Y.-F. The effect of renewable energy application on Taiwan buildings: What are the challenges and strategies for solar energy exploitation? Renew. Sustain. Energy Rev. 2013, 28, 92–106. [Google Scholar] [CrossRef]
  33. Bouich, A.; Marí-Guaita, J.; Sahraoui, B.; Palacios, P.; Marí, B. Tetrabutylammonium (TBA)-Doped Methylammonium Lead Iodide: High Quality and Stable Perovskite Thin Films. Front. Energy Res 2022, 10, 840817. [Google Scholar] [CrossRef]
  34. Elsaid, K.; Sayed, E.T.; Yousef, B.A.A.; Rabaia, M.K.H.; Abdelkareem, M.A.; Olabi, A.G. Recent progress on the utilization of waste heat for desalination: A review. Energy Convers. Manag. 2020, 221, 113105. [Google Scholar] [CrossRef]
  35. Olabi, A.G.; Elsaid, K.; Rabaia, M.K.H.; Askalany, A.A.; Abdelkareem, M.A. Waste heat-driven desalination systems: Perspective. Energy 2020, 209, 118373. [Google Scholar] [CrossRef]
  36. Brough, D.; Mezquita, A.; Ferrer, S.; Segarra, C.; Chauhan, A.; Almahmoud, S.; Khordehgah, N.; Ahmad, L.; Middleton, D.; Sewell, H.I. An experimental study and computational validation of waste heat recovery from a lab scale ceramic kiln using a vertical multi-pass heat pipe heat exchanger. Energy 2020, 208, 118325. [Google Scholar] [CrossRef]
  37. Olabi, A.G.; Wilberforce, T.; Sayed, E.T.; Elsaid, K.; Rezk, H.; Abdelkareem, M.A. Recent progress of graphene based nanomaterials in bioelectrochemical systems. Sci. Total Environ. 2020, 749, 141225. [Google Scholar] [CrossRef]
  38. Abdelkareem, M.A.; Sayed, E.T.; Nakagawa, N. Significance of diffusion layers on the performance of liquid and vapor feed passive direct methanol fuel cells. Energy 2020, 209, 118492. [Google Scholar] [CrossRef]
  39. Abdelkareem, M.A.; Sayed, E.T.; Mohamed, H.O.; Obaid, M.; Rezk, H.; Chae, K.-J. Nonprecious anodic catalysts for low-molecular-hydrocarbon fuel cells: Theoretical consideration and current progress. Prog. Energy Combust. Sci. 2020, 77, 100805. [Google Scholar] [CrossRef]
  40. Abdelkareem, M.A.; El Haj Assad, M.; Sayed, E.T.; Soudan, B. Recent progress in the use of renewable energy sources to power water desalination plants. Desalination 2018, 435, 97–113. [Google Scholar] [CrossRef]
  41. Souliotis, M.; Arnaoutakis, N.; Panaras, G.; Kavga, A.; Papaefthimiou, S. Experimental study and Life Cycle Assessment (LCA) of Hybrid Photovoltaic/Thermal (PV/T) solar systems for domestic applications. Renew. Energy 2018, 126, 708–723. [Google Scholar] [CrossRef]
  42. Rezk, H.; Mazen, A.-O.; Gomaa, M.R.; Tolba, M.A.; Fathy, A.; Abdelkareem, M.A.; Olabi, A.G.; Abou Hashema, M. A novel statistical performance evaluation of most modern optimization-based global MPPT techniques for partially shaded PV system. Renew. Sustain. Energy Rev. 2019, 115, 109372. [Google Scholar] [CrossRef]
  43. Mahmoud, M.; Ramadan, M.; Olabi, A.-G.; Pullen, K.; Naher, S. A review of mechanical energy storage systems combined with wind and solar applications. Energy Convers. Manag. 2020, 210, 112670. [Google Scholar] [CrossRef]
  44. Inayat, A.; Raza, M. District cooling system via renewable energy sources: A review. Renew. Sustain. Energy Rev. 2019, 107, 360–373. [Google Scholar] [CrossRef]
  45. Wilberforce, T.; Baroutaji, A.; El Hassan, Z.; Thompson, J.; Soudan, B.; Olabi, A.G. Prospects and challenges of concentrated solar photovoltaics and enhanced geothermal energy technologies. Sci. Total Environ. 2019, 659, 851–861. [Google Scholar] [CrossRef]
  46. Kumar, M.; Dar, M.A.; Katiyar, A.; Agrawal, R.; Shenai, P.M.; Srinivasan, V. Role of magnetization on catalytic pathways of non-oxidative methane activation on neutral iron carbide clusters. Phys. Chem. Chem. Phys. 2022, 24, 11668–11679. [Google Scholar] [CrossRef]
  47. Grant, C.; Garcia, J.; Hicks, A. Environmental payback periods of multi-crystalline silicon photovoltaics in the United States–How prioritizing based on environmental impact compares to solar intensity. Sustain. Energy Technol. Assess. 2020, 39, 100723. [Google Scholar] [CrossRef]
  48. Uctug, F.G.; Azapagic, A. Life cycle environmental impacts of domestic solar water heaters in Turkey: The effect of different climatic regions. Sci. Total Environ. 2018, 622, 1202–1216. [Google Scholar] [CrossRef]
  49. Klugmann-Radziemska, E.; Kuczyńska-Łażewska, A. The use of recycled semiconductor material in crystalline silicon photovoltaic modules production-A life cycle assessment of environmental impacts. Sol. Energy Mater. Sol. Cells 2020, 205, 110259. [Google Scholar] [CrossRef]
  50. Čabo, F.G.; Nižetić, S.; Giama, E.; Papadopoulos, A. Techno-economic and environmental evaluation of passive cooled photovoltaic systems in Mediterranean climate conditions. Appl. Therm. Eng. 2020, 169, 114947. [Google Scholar] [CrossRef]
  51. Lizin, S.; Van Passel, S.; De Schepper, E.; Maes, W.; Lutsen, L.; Manca, J.; Vanderzande, D. Life cycle analyses of organic photovoltaics: A review. Energy Environ. Sci. 2013, 6, 3136–3149. [Google Scholar] [CrossRef]
  52. Gerbinet, S.; Belboom, S.; Léonard, A. Life Cycle Analysis (LCA) of photovoltaic panels: A review. Renew. Sustain. Energy Rev. 2014, 38, 747–753. [Google Scholar] [CrossRef]
  53. Kommalapati, R.; Kadiyala, A.; Shahriar, M.; Huque, Z. Review of the life cycle greenhouse gas emissions from different photovoltaic and concentrating solar power electricity generation systems. Energies 2017, 10, 350. [Google Scholar] [CrossRef]
  54. El-Bialy, E.; Shalaby, S.M.; Kabeel, A.E.; Fathy, A.M. Cost analysis for several solar desalination systems. Desalination 2016, 384, 12–30. [Google Scholar] [CrossRef]
  55. Chen, Z.; Ivan Su, S.I. Dual competing photovoltaic supply chains: A socialwelfare maximization perspective. Int. J. Environ. Res. Public Health 2017, 14, 1416. [Google Scholar] [CrossRef]
  56. Amin, M.R.; Mishu, M.K.; Al Faysal, A.; Nizam, M.R. Design and implementation of opto-isolator based low cost digital anemometer with wind direction monitoring system. In Proceedings of the Informatics, Electronics and Vision (ICIEV), 2016 5th International Conference, Dhaka, Bangladesh, 13–14 May 2016; pp. 133–138. [Google Scholar]
  57. Farjana, S.H.; Huda, N.; Mahmud, M.A.P.; Saidur, R. Solar process heat in industrial systems–A global review. Renew. Sustain. Energy Rev. 2018, 82, 2270–2286. [Google Scholar] [CrossRef]
  58. Hafez, A.A.; Nassar, Y.F.; Hammdan, M.I.; Alsadi, S.Y. Technical and economic feasibility of utility-scale solar energy conversion systems in Saudi Arabia. Iran. J. Sci. Technol. Trans. Electr. Eng. 2020, 44, 213–225. [Google Scholar]
  59. Espinosa, N.; Hösel, M.; Jørgensen, M.; Krebs, F.C. Large scale deployment of polymer solar cells on land, on sea and in the air. Energy Environ. Sci. 2014, 7, 855–866. [Google Scholar] [CrossRef]
  60. Espinosa, N.; Zimmermann, Y.-S.; dos Reis Benatto, G.A.; Lenz, M.; Krebs, F.C. Outdoor fate and environmental impact of polymer solar cells through leaching and emission to rainwater and soil. Energy Environ. Sci. 2016, 9, 1674–1680. [Google Scholar] [CrossRef]
  61. Shafique, M.; Luo, X.; Zuo, J. Photovoltaic-green roofs: A review of benefits, limitations, and trends. Sol. Energy 2020, 202, 485–497. [Google Scholar] [CrossRef]
  62. Akinyele, D.; Belikov, J.; Levron, Y. Battery storage technologies for electrical applications: Impact in stand-alone photovoltaic systems. Energies 2017, 10, 1760. [Google Scholar] [CrossRef]
  63. Pellow, M.A.; Ambrose, H.; Mulvaney, D.; Betita, R.; Shaw, S. Research gaps in environmental life cycle assessments of lithium ion batteries for grid-scale stationary energy storage systems: End-of-life options and other issues. Sustain. Mater. Technol. 2020, 23, e00120. [Google Scholar] [CrossRef]
  64. Wang, F.; Deng, Y.; Yuan, C. Life cycle assessment of lithium oxygen battery for electric vehicles. J. Clean. Prod. 2020, 264, 121339. [Google Scholar] [CrossRef]
  65. Ardente, F.; Beccali, G.; Cellura, M.; Brano, V. Lo Life cycle assessment of a solar thermal collector: Sensitivity analysis, energy and environmental balances. Renew. Energy 2005, 30, 109–130. [Google Scholar] [CrossRef]
  66. Kalogirou, S. Thermal performance, economic and environmental life cycle analysis of thermosiphon solar water heaters. Sol. energy 2009, 83, 39–48. [Google Scholar] [CrossRef]
  67. Mousa, O.B.; Kara, S.; Taylor, R.A. Comparative energy and greenhouse gas assessment of industrial rooftop-integrated PV and solar thermal collectors. Appl. Energy 2019, 241, 113–123. [Google Scholar] [CrossRef]
  68. Atilgan, B.; Azapagic, A. Renewable electricity in Turkey: Life cycle environmental impacts. Renew. Energy 2016, 89, 649–657. [Google Scholar] [CrossRef]
  69. Hou, G.; Sun, H.; Jiang, Z.; Pan, Z.; Wang, Y.; Zhang, X.; Zhao, Y.; Yao, Q. Life cycle assessment of grid-connected photovoltaic power generation from crystalline silicon solar modules in China. Appl. Energy 2016, 164, 882–890. [Google Scholar] [CrossRef]
  70. Ward, D.J.; Inderwildi, O.R. Global and local impacts of UK renewable energy policy. Energy Environ. Sci. 2013, 6, 18–24. [Google Scholar] [CrossRef]
  71. Grant, C.A.; Hicks, A.L. Effect of manufacturing and installation location on environmental impact payback time of solar power. Clean Technol. Environ. Policy 2020, 22, 187–196. [Google Scholar] [CrossRef]
  72. Bianchini, A.; Gambuti, M.; Pellegrini, M.; Saccani, C. Performance analysis and economic assessment of different photovoltaic technologies based on experimental measurements. Renew. Energy 2016, 85, 1–11. [Google Scholar] [CrossRef]
  73. Apeh, O.O.; Overen, O.K.; Meyer, E.L. Monthly, seasonal and yearly assessments of global solar radiation, clearness index and diffuse fractions in alice, south africa. Sustainability 2021, 13, 2135. [Google Scholar] [CrossRef]
  74. Widén, J.; Munkhammar, J. Solar Radiation Theory; Uppsala University: Uppsala, Sweden, 2019. [Google Scholar]
  75. Collares-Pereira, M.; Rabl, A. The average distribution of solar radiation-correlations between diffuse and hemispherical and between daily and hourly insolation values. Sol. Energy 1979, 22, 155–164. [Google Scholar] [CrossRef]
  76. Al-Rawahi, N.Z.; Zurigat, Y.H.; Al-Azri, N.A. Prediction of hourly solar radiation on horizontal and inclined surfaces for Muscat/Oman. J. Eng. Res. 2011, 8, 19–31. [Google Scholar] [CrossRef]
  77. Son, J.; Jeong, S.; Park, H.; Park, C.-E. The effect of particulate matter on solar photovoltaic power generation over the Republic of Korea. Environ. Res. Lett. 2020, 15, 84004. [Google Scholar] [CrossRef]
  78. Brano, V.L.; Orioli, A.; Ciulla, G.; Di Gangi, A. An improved five-parameter model for photovoltaic modules. Sol. Energy Mater. Sol. Cells 2010, 94, 1358–1370. [Google Scholar] [CrossRef]
  79. Infield, D.; Freris, L. Renewable Energy in Power Systems; John Wiley & Sons: Hoboken, NJ, USA, 2020; ISBN 1118649931. [Google Scholar]
  80. REN21. Global Status Report; REN21 Secretariat: Paris, France, 2018. [Google Scholar]
  81. Aman, M.M.; Solangi, K.H.; Hossain, M.S.; Badarudin, A.; Jasmon, G.B.; Mokhlis, H.; Bakar, A.H.A.; Kazi, S.N. A review of Safety, Health and Environmental (SHE) issues of solar energy system. Renew. Sustain. Energy Rev. 2015, 41, 1190–1204. [Google Scholar] [CrossRef]
  82. Pearlmutter, D.; Theochari, D.; Nehls, T.; Pinho, P.; Piro, P.; Korolova, A.; Papaefthimiou, S.; Mateo, M.C.G.; Calheiros, C.; Zluwa, I. Enhancing the circular economy with nature-based solutions in the built urban environment: Green building materials, systems and sites. Blue-Green Syst. 2020, 2, 46–72. [Google Scholar] [CrossRef]
  83. Harris, J.M.; Roach, B. Environmental and Natural Resource Economics: A Contemporary Approach; Routledge: England, UK, 2017; ISBN 1317216210. [Google Scholar]
  84. Wirth, H.; Schneider, K. Recent Facts about Photovoltaics in Germany; Fraunhofer ISE: Freiburg, Germany, 2015; Volume 92. [Google Scholar]
  85. Morata, F.; Sandoval, I.S. European Energy Policy: An Environmental Approach; Edward Elgar Publishing: Cheltenham, UK, 2012; ISBN 0857939211. [Google Scholar]
  86. Nemet, G.F. Beyond the learning curve: Factors influencing cost reductions in photovoltaics. Energy Policy 2006, 34, 3218–3232. [Google Scholar] [CrossRef]
  87. Gul, M.; Kotak, Y.; Muneer, T. Review on recent trend of solar photovoltaic technology. Energy Explor. Exploit. 2016, 34, 485–526. [Google Scholar] [CrossRef]
  88. Feldman, D.; Barbose, G.; Margolis, R.; Bolinger, M.; Chung, D.; Fu, R.; Seel, J.; Davidson, C.; Darghouth, N.; Wiser, R. Photovoltaic System Pricing Trends: Historical, Recent, and Near-Term Projections, 2015th ed.; Lawrence Berkeley National Laboratory: Berkeley, CA, USA, 2015. Available online: https://www.osti.gov/ (accessed on 21 July 2022).
  89. IRENA. Off-Grid Renewable Energy Solutions to Expand Electricity Access: An Opportunity Not to Be Missed; International Renewable Energy Agency: Abu Dhabi, United Arab Emirates, 2019; p. 144. [Google Scholar]
  90. Obi, M.; Bass, R. Trends and challenges of grid-connected photovoltaic systems–A review. Renew. Sustain. Energy Rev. 2016, 58, 1082–1094. [Google Scholar] [CrossRef]
  91. Needleman, D.B.; Poindexter, J.R.; Kurchin, R.C.; Peters, I.M.; Wilson, G.; Buonassisi, T. Economically sustainable scaling of photovoltaics to meet climate targets. Energy Environ. Sci. 2016, 9, 2122–2129. [Google Scholar] [CrossRef]
  92. Peng, H.; Liu, Y. How government subsidies promote the growth of entrepreneurial companies in clean energy industry: An empirical study in China. J. Clean. Prod. 2018, 188, 508–520. [Google Scholar] [CrossRef]
  93. Solangi, K.H.; Islam, M.R.; Saidur, R.; Rahim, N.A.; Fayaz, H. A review on global solar energy policy. Renew. Sustain. Energy Rev. 2011, 15, 2149–2163. [Google Scholar] [CrossRef]
  94. Timilsina, G.R.; Kurdgelashvili, L.; Narbel, P.A. Solar energy: Markets, economics and policies. Renew. Sustain. Energy Rev. 2012, 16, 449–465. [Google Scholar] [CrossRef]
  95. Pitt, D.; Congreve, A. Collaborative approaches to local climate change and clean energy initiatives in the USA and England. Local Environ. 2017, 22, 1124–1141. [Google Scholar] [CrossRef]
  96. Lau, L.C.; Tan, K.T.; Lee, K.T.; Mohamed, A.R. A comparative study on the energy policies in Japan and Malaysia in fulfilling their nations’ obligations towards the Kyoto Protocol. Energy Policy 2009, 37, 4771–4778. [Google Scholar] [CrossRef]
  97. Liu, L.; Wang, Z.; Zhang, H.; Xue, Y. Solar energy development in China—A review. Renew. Sustain. Energy Rev. 2010, 14, 301–311. [Google Scholar] [CrossRef]
  98. Modise, D.; Mahotas, V. Overview of the South African Energy Sector Sources of Power. 2014. Available online: http://www.energy.gov.za (accessed on 21 July 2022).
  99. Petroleum, B. BP Statistical Review of world energy 2015. Br. Pet 2017, 66, 1–52. [Google Scholar]
  100. Wu, H.; Hou, Y. Recent development of grid-connected PV systems in China. Energy Procedia 2011, 12, 462–470. [Google Scholar] [CrossRef]
  101. Hart, D.; Birson, K. Deployment of Solar Photovoltaic Generation Capacity in the United States; Schar Sch. Policy Gov. Georg. Mason Univ. Prep. Off. Energy Policy Syst. Anal. US Dep. Energ, 2016. Available online: https://diggingintodata.org (accessed on 1 June 2021).
  102. Ahmad, L.; Khordehgah, N.; Malinauskaite, J.; Jouhara, H. Recent advances and applications of solar photovoltaics and thermal technologies. Energy 2020, 207, 118254. [Google Scholar] [CrossRef]
  103. Pachauri, R.K.; Allen, M.R.; Barros, V.R.; Broome, J.; Cramer, W.; Christ, R.; Church, J.A.; Clarke, L.; Dahe, Q.; Dasgupta, P. Climate Change 2014: Synthesis Report. Contribution of Working Groups I, II and III to the Fifth Assessment Report of the Intergovernmental Panel on Climate Change; IPCC: Geneva, Switzerland, 2014; ISBN 9291691437. [Google Scholar]
  104. Moriarty, P.; Honnery, D. Can renewable energy power the future? Energy Policy 2016, 93, 3–7. [Google Scholar] [CrossRef]
  105. Meyer, E.L. Investigation of Properties and Energy Rating of Photovoltaic Modules. Ph.D. Thesis, Universiteit van Port Elizabeth, Port Elizabeth, South Africa, 1999. Available online: https://journals.co.za/doi/ (accessed on 21 July 2022).
  106. Li, J.; Danzer, M.A. Optimal charge control strategies for stationary photovoltaic battery systems. J. Power Sources 2014, 258, 365–373. [Google Scholar] [CrossRef]
  107. Borowy, B.S.; Salameh, Z.M. Optimum photovoltaic array size for a hybrid wind/PV system. IEEE Trans. Energy Convers. 1994, 9, 482–488. [Google Scholar] [CrossRef]
  108. Mendez, L.; Narvarte, L.; Marsinach, A.G.; Izquierdo, P.; Carrasco, L.M.; Eyras, R. Centralized stand alone PV system in microgrid in Morocco. In Proceedings of the 3rd World Conference on Photovoltaic Energy Conversion, Osaka, Japan, 11–18 May 2003; Volume 3, pp. 2326–2328. [Google Scholar]
  109. Awasthi, A.; Shukla, A.K.; SR, M.M.; Dondariya, C.; Shukla, K.N.; Porwal, D.; Richhariya, G. Review on sun tracking technology in solar PV system. Energy Reports 2020, 6, 392–405. [Google Scholar] [CrossRef]
  110. Sun, J.; Wang, R.; Hong, H.; Liu, Q. An optimized tracking strategy for small-scale double-axis parabolic trough collector. Appl. Therm. Eng. 2017, 112, 1408–1420. [Google Scholar] [CrossRef]
  111. Cifor, A.; Denholm, P.; Ela, E.; Hodge, B.-M.; Reed, A. The policy and institutional challenges of grid integration of renewable energy in the western United States. Util. Policy 2015, 33, 34–41. [Google Scholar]
  112. Shen, J.; Cheng, C.; Jia, Z.; Zhang, Y.; Lv, Q.; Cai, H.; Wang, B.; Xie, M. Impacts, challenges and suggestions of the electricity market for hydro-dominated power systems in China. Renew. Energy 2022, 187, 743–759. [Google Scholar] [CrossRef]
  113. McCann, M.J.; Catchpole, K.R.; Weber, K.J.; Blakers, A.W. A review of thin-film crystalline silicon for solar cell applications. Part 1: Native substrates. Sol. Energy Mater. Sol. Cells 2001, 68, 135–171. [Google Scholar] [CrossRef]
  114. Böer, K.W. Cadmium sulfide enhances solar cell efficiency. Energy Convers. Manag. 2011, 52, 426–430. [Google Scholar]
  115. Gorter, T.; Reinders, A.H.M.E. A comparison of 15 polymers for application in photovoltaic modules in PV-powered boats. Appl. Energy 2012, 92, 286–297. [Google Scholar] [CrossRef]
  116. Razykov, T.M.; Ferekides, C.S.; Morel, D.; Stefanakos, E.; Ullal, H.S.; Upadhyaya, H.M. Solar photovoltaic electricity: Current status and future prospects. Sol. Energy 2011, 85, 1580–1608. [Google Scholar] [CrossRef]
  117. Schleicher-Tappeser, R. How renewables will change electricity markets in the next five years. Energy Policy 2012, 48, 64–75. [Google Scholar] [CrossRef]
  118. Iles, P.A. Evolution of space solar cells. Sol. Energy Mater. Sol. Cells 2001, 68, 1–13. [Google Scholar] [CrossRef]
  119. Vrielink, J.A.M.; Tiggelaar, R.M.; Gardeniers, J.G.E.; Lefferts, L. Applicability of X-ray fluorescence spectroscopy as method to determine thickness and composition of stacks of metal thin films: A comparison with imaging and profilometry. Thin Solid Films 2012, 520, 1740–1744. [Google Scholar] [CrossRef]
  120. Parida, B.; Iniyan, S.; Goic, R. A review of solar photovoltaic technologies. Renew. Sustain. Energy Rev. 2011, 15, 1625–1636. [Google Scholar] [CrossRef]
  121. Boutchich, M.; Alvarez, J.; Diouf, D.; i Cabarrocas, P.R.; Liao, M.; Masataka, I.; Koide, Y.; Kleider, J.-P. Amorphous silicon diamond based heterojunctions with high rectification ratio. J. Non. Cryst. Solids 2012, 358, 2110–2113. [Google Scholar] [CrossRef]
  122. Radue, C.; Van Dyk, E.E.; Macabebe, E.Q. Analysis of performance and device parameters of CIGS PV modules deployed outdoors. Thin Solid Films 2009, 517, 2383–2385. [Google Scholar] [CrossRef]
  123. Chopra, K.L.; Paulson, P.D.; Dutta, V. Thin-film solar cells: An overview. Prog. Photovoltaics Res. Appl. 2004, 12, 69–92. [Google Scholar] [CrossRef]
  124. Hegedus, S.S.; McCandless, B.E. CdTe contacts for CdTe/CdS solar cells: Effect of Cu thickness, surface preparation and recontacting on device performance and stability. Sol. Energy Mater. Sol. Cells 2005, 88, 75–95. [Google Scholar] [CrossRef]
  125. Soliman, M.M.; Shabana, M.M.; Abulfotuh, F. CdS/CdTe solar cell using sputtering technique. Renew. Energy 1996, 8, 386–389. [Google Scholar] [CrossRef]
  126. Repins, I.; Contreras, M.A.; Egaas, B.; DeHart, C.; Scharf, J.; Perkins, C.L.; To, B.; Noufi, R. 19.9%-efficient ZnO/CdS/CuInGaSe2 solar cell with 81.2% fill factor. Prog. Photovolt. Res. Appl. 2008, 16, 235–239. [Google Scholar] [CrossRef]
  127. Meyer, E.L.; Van Dyk, E.E. Characterization of degradation in thin-film photovoltaic module performance parameters. Renew. Energy 2003, 28, 1455–1469. [Google Scholar] [CrossRef]
  128. Goetzberger, A.; Hebling, C.; Schock, H.-W. Photovoltaic materials, history, status and outlook. Mater. Sci. Eng. R Reports 2003, 40, 1–46. [Google Scholar] [CrossRef]
  129. Peumans, P.; Yakimov, A.; Forrest, S.R. Small molecular weight organic thin-film photodetectors and solar cells. J. Appl. Phys. 2003, 93, 3693–3723. [Google Scholar] [CrossRef]
  130. Wu, L.; Tian, W.; Jiang, X. Silicon-based solar cell system with a hybrid PV module. Sol. Energy Mater. Sol. Cells 2005, 87, 637–645. [Google Scholar] [CrossRef]
  131. Nazeeruddin, M.K.; Baranoff, E.; Grätzel, M. Dye-sensitized solar cells: A brief overview. Sol. Energy 2011, 85, 1172–1178. [Google Scholar] [CrossRef]
  132. Philibert, C.; Frankl, P.; Tam, C.; Abdelilah, Y.; Bahar, H.; Marchais, Q.; Wiesner, H. Technology Roadmap: Solar Photovoltaic Energy; International Energy Agency: Paris, France, 2014. [Google Scholar]
  133. Grau, T.; Huo, M.; Neuhoff, K. Survey of photovoltaic industry and policy in Germany and China. Energy Policy 2012, 51, 20–37. [Google Scholar] [CrossRef]
  134. Sen, S.; Ganguly, S. Opportunities, barriers and issues with renewable energy development–A discussion. Renew. Sustain. Energy Rev. 2017, 69, 1170–1181. [Google Scholar] [CrossRef]
  135. Whiteman, A.; Esparrago, J.; Elsayed, S. Renewable Energy Statistics 2018; International Renewable Energy Agency: Abu Dhabi, United Arab Emirates, 2018. [Google Scholar]
  136. IRENA. Future of Solar Photovoltaic: Deployment, Investment, Technology, Grid Integration and Socio-Economic Aspects (A Global Energy Transformation: Paper); Abu Dhabi. 2019. ISBN 9789292601553. Available online: www.irena.org/publications (accessed on 1 June 2021).
  137. Observ, E.R. The state of renewable energies in europe: Frankfurt School of Finance and Management (DE), Fraunhofer ISI (DE) and Statistics Netherlands (NL), Report, 18th EuroObserv’ER, Edition. 2013; Volume 33, p. 103.
  138. Boshell, F.; Gielen, D.; Roesch, R.; Anisie, A.; Salgado, A.; Ratka, S. Innovation Driving The Energy Transition. In Global Innovation Index 2018; IRENA: Abu Dhabi, United Arab Emirates, 2018; p. 97. [Google Scholar]
  139. IEA. Renewable Energy and Jobs–Annual Review; IEA: Abu Dhabi, United Arab Emirate, 2020; ISBN 978-92-9260-266-6. [Google Scholar]
  140. Solar Generation, V. Solar Electricity for over One Billion People and Two Million Jobs by 2020; European Photovoltaic Industry Association: Brussels, Belgium, 2008. [Google Scholar]
  141. Heavner, B.; Del Chiaro, B. Renewable Energy and Jobs: Employment Impacts of Developing Markets for Renewables in California; Environment California Research & Policy Center: Sacramento, CA, USA, 2003. [Google Scholar]
  142. Zervos, A. Renewable Energy Technology Roadmap 20% by 2020; European Renewable Energy Council: Brussels, Belgium, 2009. [Google Scholar]
  143. IRENA. Renewable Energy and Jobs-Annual Review 2018; International Renewable Energy Agency: Abu Dhabi, United Arab Emirates, 2018; pp. 1–28. [Google Scholar]
  144. Sterzinger, G. Jobs and Renewable Energy Project; IRENA: Abu Dhabi, United Arab Emirates, 2006. [Google Scholar]
  145. Del Rio, P.; Burguillo, M. An empirical analysis of the impact of renewable energy deployment on local sustainability. Renew. Sustain. Energy Rev. 2009, 13, 1314–1325. [Google Scholar] [CrossRef]
  146. Sastresa, E.L.; Usón, A.A.; Bribián, I.Z.; Scarpellini, S. Local impact of renewables on employment: Assessment methodology and case study. Renew. Sustain. Energy Rev. 2010, 14, 679–690. [Google Scholar] [CrossRef]
  147. Moreno, B.; Lopez, A.J. The effect of renewable energy on employment. The case of Asturias (Spain). Renew. Sustain. Energy Rev. 2008, 12, 732–751. [Google Scholar] [CrossRef]
  148. Cameron, L.; Van Der Zwaan, B. Employment factors for wind and solar energy technologies: A literature review. Renew. Sustain. Energy Rev. 2015, 45, 160–172. [Google Scholar] [CrossRef]
  149. Burns, J.E.; Kang, J.-S. Comparative economic analysis of supporting policies for residential solar PV in the United States: Solar Renewable Energy Credit (SREC) potential. Energy Policy 2012, 44, 217–225. [Google Scholar] [CrossRef]
  150. Fouquet, D.; Johansson, T.B. European renewable energy policy at crossroads—Focus on electricity support mechanisms. Energy Policy 2008, 36, 4079–4092. [Google Scholar] [CrossRef]
  151. Sarasa-Maestro, C.J.; Dufo-López, R.; Bernal-Agustín, J.L. Photovoltaic remuneration policies in the European Union. Energy Policy 2013, 55, 317–328. [Google Scholar] [CrossRef]
  152. Gutermuth, P.-G. Regulatory and institutional measures by the state to enhance the deployment of renewable energies: German experiences. Sol. Energy 2000, 69, 205–213. [Google Scholar] [CrossRef]
  153. Erge, T.; Hoffmann, V.U.; Kiefer, K. The German experience with grid-connected PV-systems. Sol. Energy 2001, 70, 479–487. [Google Scholar] [CrossRef]
  154. Jahn, U.; Nasse, W. Performance analysis and reliability of grid-connected PV systems in IEA countries. In Proceedings of the 3rd World Conference on Photovoltaic Energy Conversion, Osaka, Japan, 11–18 May 2003; Volume 3, pp. 2148–2151. [Google Scholar]
  155. Weiss, I.; Sprau, P.; Helm, P. The German PV solar power financing schemes reflected on the German PV market. In Proceedings of the 3rd World Conference on Photovoltaic Energy Conversion, Osaka, Japan, 11–18 May 2003; Volume 3, pp. 2592–2595. [Google Scholar]
  156. Stritih, U.; Zupan, G.; Butala, V. Review of green electricity production in Slovenia. Renew. Sustain. Energy Rev. 2007, 11, 2201–2208. [Google Scholar] [CrossRef]
  157. Zahedi, A. Development of an economical model to determine an appropriate feed-in tariff for grid-connected solar PV electricity in all states of Australia. Renew. Sustain. Energy Rev. 2009, 13, 871–878. [Google Scholar] [CrossRef]
  158. Focacci, A. Residential plants investment appraisal subsequent to the new supporting photovoltaic economic mechanism in Italy. Renew. Sustain. Energy Rev. 2009, 13, 2710–2715. [Google Scholar] [CrossRef]
  159. Jia, F.; Sun, H.; Koh, L. Global solar photovoltaic industry: An overview and national competitiveness of Taiwan. J. Clean. Prod. 2016, 126, 550–562. [Google Scholar] [CrossRef]
  160. Poullikkas, A. Parametric cost–benefit analysis for the installation of photovoltaic parks in the island of Cyprus. Energy Policy 2009, 37, 3673–3680. [Google Scholar] [CrossRef]
  161. Papadopoulos, A.M.; Karteris, M.M. An assessment of the Greek incentives scheme for photovoltaics. Energy Policy 2009, 37, 1945–1952. [Google Scholar] [CrossRef]
  162. Celik, A.N.; Muneer, T.; Clarke, P. A review of installed solar photovoltaic and thermal collector capacities in relation to solar potential for the EU-15. Renew. Energy 2009, 34, 849–856. [Google Scholar] [CrossRef]
  163. Ren, H.; Gao, W.; Ruan, Y. Economic optimization and sensitivity analysis of photovoltaic system in residential buildings. Renew. Energy 2009, 34, 883–889. [Google Scholar] [CrossRef]
  164. Luethi, S. Effective deployment of photovoltaics in the Mediterranean countries: Balancing policy risk and return. Sol. Energy 2010, 84, 1059–1071. [Google Scholar] [CrossRef]
  165. Dusonchet, L.; Telaretti, E. Economic analysis of different supporting policies for the production of electrical energy by solar photovoltaics in western European Union countries. Energy Policy 2010, 38, 3297–3308. [Google Scholar] [CrossRef]
  166. Dincer, F. The analysis on photovoltaic electricity generation status, potential and policies of the leading countries in solar energy. Renew. Sustain. Energy Rev. 2011, 15, 713–720. [Google Scholar] [CrossRef]
  167. Cucchiella, F.; D’Adamo, I. Feasibility study of developing photovoltaic power projects in Italy: An integrated approach. Renew. Sustain. Energy Rev. 2012, 16, 1562–1576. [Google Scholar] [CrossRef]
  168. Orioli, A.; Di Gangi, A. Effects of the Italian financial crisis on the photovoltaic dissemination in a southern city. Energy 2013, 62, 173–184. [Google Scholar] [CrossRef]
  169. de Keizer, A.C.; Alsema, E.A.; van Sark, W. Socio-Economic Aspects of Photovoltaic Energy Technology. 2006. Available online: https://www.researchgate.net/ (accessed on 21 July 2022).
Figure 1. A typical atmospheric influence on solar radiation falling on horizontal surfaces [74].
Energies 15 05963 g001
Figure 2. Global annual and cumulative solar PV cell production from 2007–2021 [83].
Energies 15 05963 g002
Figure 3. Global total installed and levelized cost of electricity from 2010–2019 [89].
Energies 15 05963 g003
Figure 4. Solar PV installation and price from 2009–2020 [88].
Energies 15 05963 g004
Figure 5. The cell/module capacity from 2014 to 2017 [90].
Energies 15 05963 g005
Figure 6. Newly installed PV capacity in ten leading countries and other remaining countries of the world [99].
Energies 15 05963 g006
Figure 7. Cumulative-installed PV capacity in ten leading countries and other remaining countries of the world, [99].
Energies 15 05963 g007
Figure 8. Description of energy transportation from fossil fuel to the consumer.
Energies 15 05963 g008
Figure 9. Schematic representations of the PV system with integration in the utility grid. Adapted from [106].
Energies 15 05963 g009
Figure 10. A PV material chart. Adapted from [18].
Energies 15 05963 g010
Figure 11. Global renewable energy employment by technology from 2012–2019 [139].
Energies 15 05963 g011
Table 1. Comparative advantages of PV energy to resources from fossil fuel [19].
S/NKindPV Sources of EnergyFossil Fuel Sources of Energy
1EmissionDischarge zero emissionsDischarges greenhouse gases
2AvailabilityThey are infiniteFuel reserves are finite
3EnvironmentalAre environmentally friendly as well as nontoxicToxic to the environment
4Climatic changeRely on the alteration of weather and climateIndependent of weather conditions
5CostHave a high cost of maintenance and are capital intensive Low cost of production with
cheap transportation
6StorageRequire storage between production and consumptionStorage is portable and easy
7DevelopmentCreate more jobs and have a highly sustainable developmentSustainable development is lower
8TransportationTransported where they are desirable or used where they are obtainableNeed transportation from the production site for further processing.
9DistributionUniformly distributed worldwideDistribution is nonuniform and leads to flow gaps and changes in the price
10AreaRequire large portions of landA small geographical area is needed
11RegenerationCan be renewed; inexhaustible resourceOre is exhausted and cannot be renewed
12Geographical implicationsLimit our dependency on coal and permit self-sufficiencyOver-dependency on coal as a resource can weaken a country’s energy security
13Energy SupplyGenerate a high amount of energySupply is limited
Table 2. Global primary commercial energy by type, 2014 [104].
Type of EnergyPrimary Energy (EJ)Primary Energy (%)
2004201420042014
Wind, solar0.88.50.21.6
Nuclear26.624.05.94.4
Fossil fuels385.2467.287.286.3
Solar energy contributes the strongest opportunity for alleviating climate change and substituting fossil fuels.
Table 3. The global approximated direct and indirect job opportunities in renewable energy by industry in 2016–2017.
CountryGeothermalSolar PVCSPWind PowerBiogasSolar Heating and CoolingCSP
World9333650114834480734
China1.52216051014567011
India 1640618517
USA352335106713 5.2
Germany6.536 1608.9 0.6
Japan2272150.7
Brazil 10 3442
EU25100 34434 6
Table 4. Key drivers for growth in major solar PV markets.
S/noCountryPolicy/Regulatory TargetSupply Side DriversDemand Side DriversFiscal
Incentives
RemarksReferences
1GermanyYesFeed-in-tariff, competitive biddingMandatory interconnectionCapital subsidyGrid parity, capital subsidy now provided for energy storage[133]
2ChinaYesFeed-in-tariff, competitive bidding Capital subsidy [158]
3JapanYesFeed-in-tariffNet meteringCapital subsidyShifted from net to gross metering in 2009[158]
4ItalyYesFeed-in-tariff [133]
5USAYesInvestment tax credit (ITC)Renewable portfolio Standard (RPS); net meteringCapital subsidy; tax creditsA few states have gross metering in place[133]
6FranceYesFeed-in-tariff [133]
7SpainYesFeed-in-tariff Capital subsidyNew projects not eligible for FiT[133]
8United KingdomYesFeed-in-tariffNet metering; renewable obligation (RO)Capital subsidy [159]
9AustraliaYesFeed-in-tariffNet meteringCapital subsidy [159]
10IndiaYesFeed-in-tariff;
competitive bidding
renewable portfolio obligation (RPO); renewable energy credits (REC)Capital subsidy; tax holidaysCompetitive bidding on tariff[158]
Publisher’s Note: MDPI stays neutral with regard to jurisdictional claims in published maps and institutional affiliations.

