Article

The Effect of Bedding Plane Angle on Hydraulic Fracture Propagation in Mineral Heterogeneity Model

1
Key Laboratory of Roads and Railway Engineering Safety Control, Shijiazhuang Tiedao University, Ministry of Education, Shijiazhuang 050043, China
2
State Key Laboratory of Mechanical Behavior and System Safety of Traffic Engineering Structures, Shijiazhuang Tiedao University, Shijiazhuang 050043, China
3
Hebei Province Technical Innovation Center of Safe and Effective Mining of Metal Mines, Shijiazhuang 050043, China
4
Key Laboratory of Shale Gas and Geoengineering, Institute of Geology and Geophysics, Chinese Academy of Sciences, Beijing 100029, China
5
Innovation Academy for Earth Science, CAS, Beijing 100029, China
6
College of Earth and Planetary Sciences, University of Chinese Academy of Sciences, Beijing 100049, China
*
Author to whom correspondence should be addressed.
Energies 2022, 15(16), 6052; https://doi.org/10.3390/en15166052
Submission received: 19 July 2022 / Revised: 15 August 2022 / Accepted: 18 August 2022 / Published: 20 August 2022

Abstract

:
The bedding planes of unconventional oil and gas reservoirs are relatively well developed. Bedding planes directly interfere with hydraulic fracture expansion. Determining how bedding planes influence hydraulic fractures is key for understanding the formation and evolution of hydraulic fracturing networks. After conducting X-ray diffraction analysis of shale, we used Python programming to establish a numerical model of mineral heterogeneity with a 0-thickness cohesive element and a bedding plane that was globally embedded. The influence of the bedding-plane angle on hydraulic fracture propagation was studied. Acoustic emission (AE) data were simulated using MATLAB programming to study fracture propagation in detail. The numerical simulation and AE data showed that the propagation paths of hydraulic fractures were determined by the maximum principal stress and bedding plane. Clearer bedding effects were observed with smaller angles between the bedding surface and the maximum principal stress. However, the bedding effect led to continuous bedding slip fractures, which is not conducive to forming a complex fracture network. At moderate bedding plane angles, cross-layer and bedding fractures alternately appeared, characteristic of intermittent dislocation fracture and a complex fracture network. During hydraulic fracturing, tensile fractures represented the dominant fracture type and manifested in cross-layer fractures. We observed large fracture widths, which are conducive to proppant migration and filling. However, the shear fractures mostly manifested as bedding slip fractures with small fracture widths. Combining the fracture-network, AE, and fractal dimension data showed that a complex fracture network was most readily generated when the angle between the bedding plane and the maximum principal stress was 30°. The numerical simulation results provide important technical information for fracturing construction, which should support the efficient extraction of unconventional tight oil and gas.

1. Introduction

With the depletion of conventional oil and gas resources, shale gas resources are attracting increasing global attention. However, shale reservoir is dense with low permeability. To achieve economic feasibility, it is necessary to fracture a reservoir to generate a connected fracture network, increase the seepage channels for shale gas, and improve the reservoir permeability. Therefore, obtaining a complex fracture network has become a hot research topic. In addition, the bedding plane (BP) of a shale reservoir is well developed, which can provide a better diversion channel for hydraulic fractures (HFs) and directly determine the complexity of the HF network [1]. Therefore, it is very important to explore the interaction mechanisms between HFs and BPs to reveal the underlying mechanism of the complex pressure–fracture network.
In view of the mechanism whereby BPs influence HF propagation, a substantial amount of theoretical and indoor hydraulic fracturing testing analyses has been performed [2]. Zhao et al. [3] researched the influence of the BP angle and injection rate on HFs without confining pressure and discussed trends in fracture-pressure variations. They proposed that a high injection rate can reduce the fracture pressure, whereas a low injection rate is beneficial for a generating more complex fracture network. In addition, a complex fracture network is mainly realized by the intersection of the HF and BP, which determines the complexity of the fracture network. However, rocks show different characteristics under confining pressure, and the geostress field is the main factor that determines HF propagation. Owing to the development of a true triaxial testing machine, the indoor hydraulic fracturing test was gradually developed from the non-confining pressure condition to the conventional triaxial hydraulic fracturing test and then to the true triaxial hydraulic fracturing test, where the strength of the in situ stress and the number of specimens studied have increased. The test samples included rocks, rock-like materials, cement concrete, and other materials. Some scholars believe that horizontal bedding is not conducive to the formation of a complex compressive fracture network. The existence of BPs limits the expansion of HFs. HFs stop at the horizontal bedding and limit their height. The larger the spacing between the BPs, the stronger the horizontal bedding that can capture HFs, which reduces the fracturing complexity [4,5,6]. Huang et al. [7] revealed a basic propagation law of hydraulic fracturing near the BP by performing true triaxial hydraulic fracturing experiments and established three fracture-propagation models. Moreover, these three penetration modes have been recognized by many scholars who performed numerical simulations of the interactions between HFs and natural fractures (NFs) [8]. It is generally considered that the main interaction modes between hydraulic and NFs include penetration, diversion, and offset interactions [9,10,11]. These penetration modes are mainly affected by ground-stress differences and the angles between the HFs and NFs. It is also generally considered that HFs are easily captured by NFs when the ground-stress difference is low or when the angle between an HF and a NF is small. In addition, other characteristics of BPs and fracture-propagation processes [12] have been studied at different scales [12]. Huang et al. [7] researched the fracture-length distribution before and after the bedding of HFs through via hydraulic fracturing experiments and proposed that HFs could continue to expand in their original direction when the water pressure increased to a certain critical value. Guo et al. [8] researched the influence of the BP density on HF propagation and experimentally verified the three interaction modes of HFs and BPs. In addition, Bradley et al. [13] developed a laboratory-scale transparent flow cell to visually observe the filtration phenomenon of an artificial bedding interface and studied the migration law of fracturing fluids and proppants with different viscosities. Due to the complexity and high cost of indoor hydraulic-fracturing tests, numerical simulations have become an important means for studying hydraulic fracturing.
Xie et al. [14] researched the influence of BP on fracture height growth by adopting a three-dimensional model coupled with an HF-propagation model and proposed that fracture-height obstruction was caused by fracture fluid leakage into the BP. These results further verified previous laboratory test results. Zou et al. [15] studied the influence of horizontal bedding on HF propagation using the three-dimensional discrete-element method and proposed that the existence of a BP increases the injection pressure during fracturing. In addition, when the rock properties on both sides of the bedding differ or the ground-stress difference is small, HFs are more easily captured by the BP, resulting in T-shaped horizontal fractures, which indirectly limits the height of the HF but is beneficial for increasing the complexity of fractures. Tang et al. [16] analyzed the HF propagation mode under the influence of various factors, such as the angle of HF and BP, the ratio of injection point to BP spacing, fracture height, and injection pressure. There is a positive correlation between the bedding slip and the approach angle. Based on the three-dimensional discrete fracture network model, Li et al. [17] simulated the complex interaction process among HFs, NFs, and BPs and focused on the influence of injection rate on the formation and evolution of the fracture network. It was revealed that the interaction between the HF and original discontinuous surface was affected by the injection rate. A low injection rate did not activate NF and BP, whereas a high injection rate easily formed multiple network fractures. Moreover, the injection rate positively affected the fracture complexity. Gong et al. [18] also considered the propagation of HFs under the combined actions of BF and NFs. However, their model comprehensively considers the influences of stress differences, BP angles, NF angles, and BP cohesion on the HF. The results showed that the in situ stress difference and cohesion of the BP correlated negatively with the complex fracture network. The BP and NF angles significantly influenced the fracture-network morphology, which serves as the basis for the formation and evolution of complex fracture networks. In addition, Sun et al. [19] considered the effect of the tensile strength on HF propagation. Their simulation results showed that the propagation of HFs was determined by differences in the in situ stress, BP angle, and tensile strength. The tensile strength of the BP determines the degree of opening of the bedding slip fracture. Zeng et al. [20] comprehensively considered the influence of fracture spacing and NF on HF and found that complex fracture networks are determined by fracture spacing and stress anisotropy. Based on the stress–shadow phenomenon caused by HFs, Nagel et al. [21] also analyzed the effect of new HFs on in situ stress and NFs, and changes in the stress field caused by HFs significantly affected the state of NFs, and NFs also affected the success of hydraulic fracturing.
The current results show that the BP exerts an important influence on fracture propagation and that the natural BP begins to undergo tensile or shear fracturing after the HF contacts the BP. The BP angle primarily determines the fracture mode of the rock, directly affects the fracture morphology, and determines the fracturing effect. However, most current numerical simulation studies are based on the discrete-element method, where the influence of rock mineral heterogeneity on HF propagation is not considered. Revealing the influence of the BP angle on HF propagation is of great significance for guiding the perforation arrangement and optimizing the fracturing design. Therefore, an urgent need exists for further simulating the evolution of HF networks with different BP angles under a rock–mineral heterogeneity model. In this study, a numerical model of shale mineral heterogeneity was established using Python programming. A discrete network model with a BP was constructed using a cohesive zone model (CZM). Numerical simulations of acoustic emissions (AEs) were performed using MATLAB. The propagation process of HFs were analyzed in detail in combination with the numerical AE results, and the interaction mode between HFs and BPs was revealed, which provides important theoretical support for the formation and evolution mechanism of the fracture network.
The structure of this paper is as follows. The first section reviews the research status of the influence of bedding plane on hydraulic fracture propagation. The second part introduces the basic principle of numerical simulation. Section 3 introduces the numerical model. The numerical simulation results are presented in Section 4 and discussed in Section 5. The conclusion is given in Section 6.

2. Principle of Numerical Calculation

The CZM was first proposed by Dugdale et al. [22] and Barenblatt et al. [23] and can be used to better solve the singularity problem at the crack tip and determine crack propagations under various conditions.

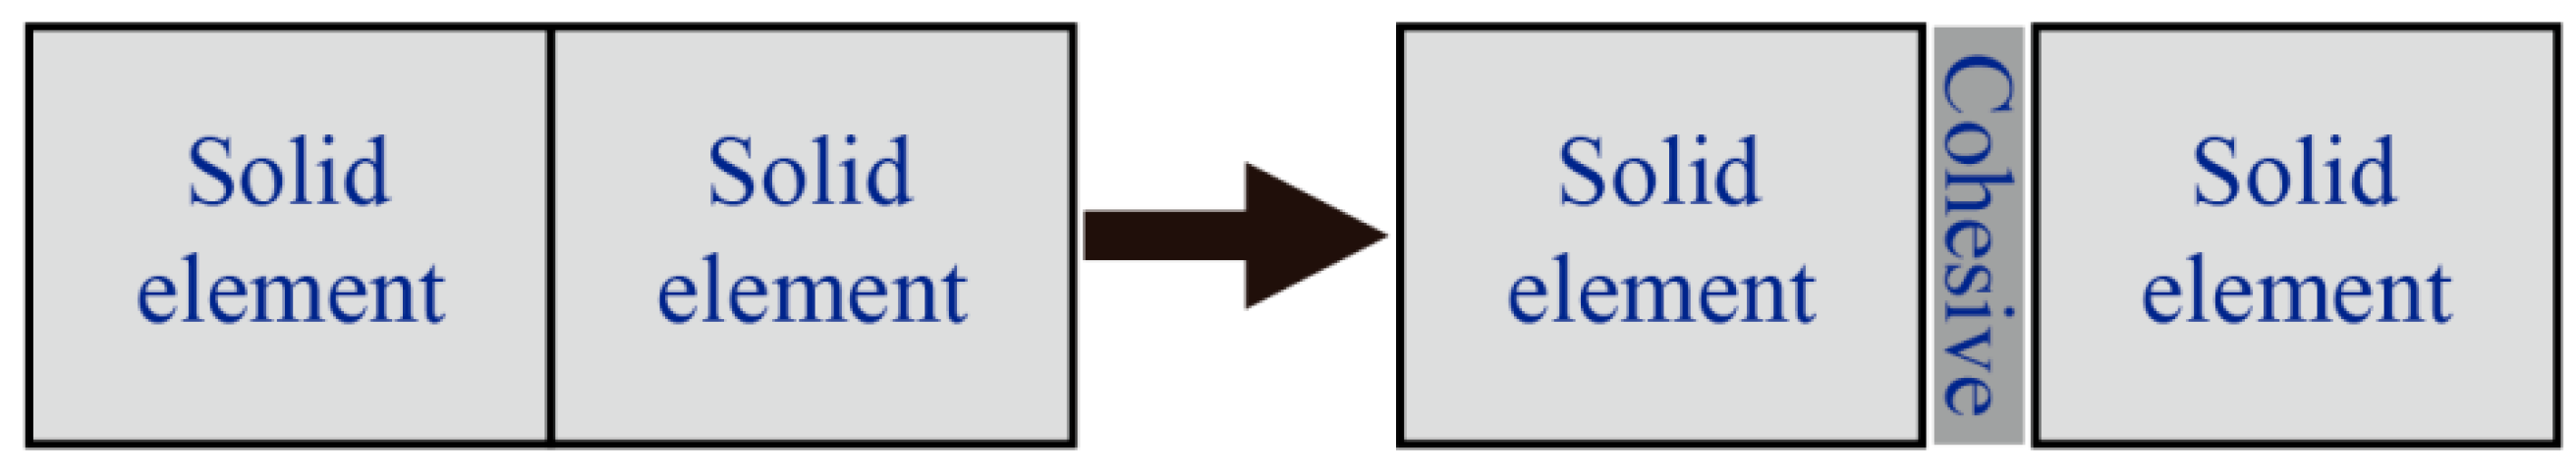
2.1. Constitutive Equation for the Cohesive Element

The cohesive element adopts a linear elastic constitutive model based on the traction-separation law. Before damage starts, the stress–strain relationship satisfies the linear elastic relationship as follows:
t = { t n t s t t } = [ K n n K n s K n t K n s K s s K s t K n t K s t K t t ] { ε n ε s ε t } = E ε
where t represents stress, ε represents strain, subscript n represents normal, subscripts s and t represent two tangential directions, and K represents the element stiffness.

2.2. Stiffness-Setting Principle

The cohesive element is used to simulate fracture propagation, which is essentially the crack of the cohesive element. The fracture only extended along the cohesive elements. To simulate a complex fracture network, it is necessary to embed a 0-thickness cohesive element between all solid elements. However, the embedded 0-thickness cohesive element affected the overall stiffness of the model. Therefore, to reduce the effect of the cohesive element on the stiffness of the entire model, it is necessary to set a reasonable stiffness value for the cohesive element. In this study, the stiffness variation in a cohesive element embedded in two solid elements in series was used to illustrate the stiffness selection (Figure 1).
Suppose that the stiffness of the solid element is K1 and that of the cohesive element is Kc. When the two solid elements are connected in series, the overall stiffness (Kall) is
K all = 1 1 K 1 + 1 K 1 = K 1 2
After embedding a cohesive element with 0 thickness between two solid elements, the formula for the overall stiffness becomes
K all = 1 1 K 1 + 1 K C + 1 K 1
By comparing Formulas (2) and (3), it can be found that the embedded cohesive element with 0 thickness does not affect the overall stiffness of the model only when KC >> K1.The relationship between the cohesive element stiffness (Kn) and elastic modulus (En) and the element geometric thickness (heff) is defined as follows:
K n = E n h e f f
In general, the elastic modulus of the cohesive element is set to be the same as that of the solid element; therefore, according to Formula (4), to satisfy KC, K1 usually sets heff to a very small value. In general, when heff ≤ 0.001, the embedded cohesive element had no effect on the overall stiffness of the model.

2.3. Equation of the Fluid–Solid-Coupling

2.3.1. Equilibrium Equation

The equilibrium equation of rock can be expressed using the virtual-work principle [24]:
V σ : δ ε d V = S T δ V d S + V f ^ δ v d V
where V and S are the integral space and the surface of the integral space, respectively. δε is the virtual strain field. δv is the virtual-velocity field of the rock node. T is the external surface force of the unit integral region.
f ^ is the physical strength per unit volume and is defined as follows:
f ^ = ( s n + n t ) ρ w g
where ρ w is the density of the liquid and g is the acceleration of gravity, assuming it is constant in the vertical direction.
For the sake of simplicity, the gravity load of the wetting liquid is explicitly expressed such that any other gravity term in f ^ is only related to the weight of the dry porous media. Therefore, the virtual-work equation can be written as:
V σ : δ ε d V = S T δ V d S + V f δ v d V + V ( s n + n t ) ρ w g δ v
where, f is the element volume force without considering fluid gravity.

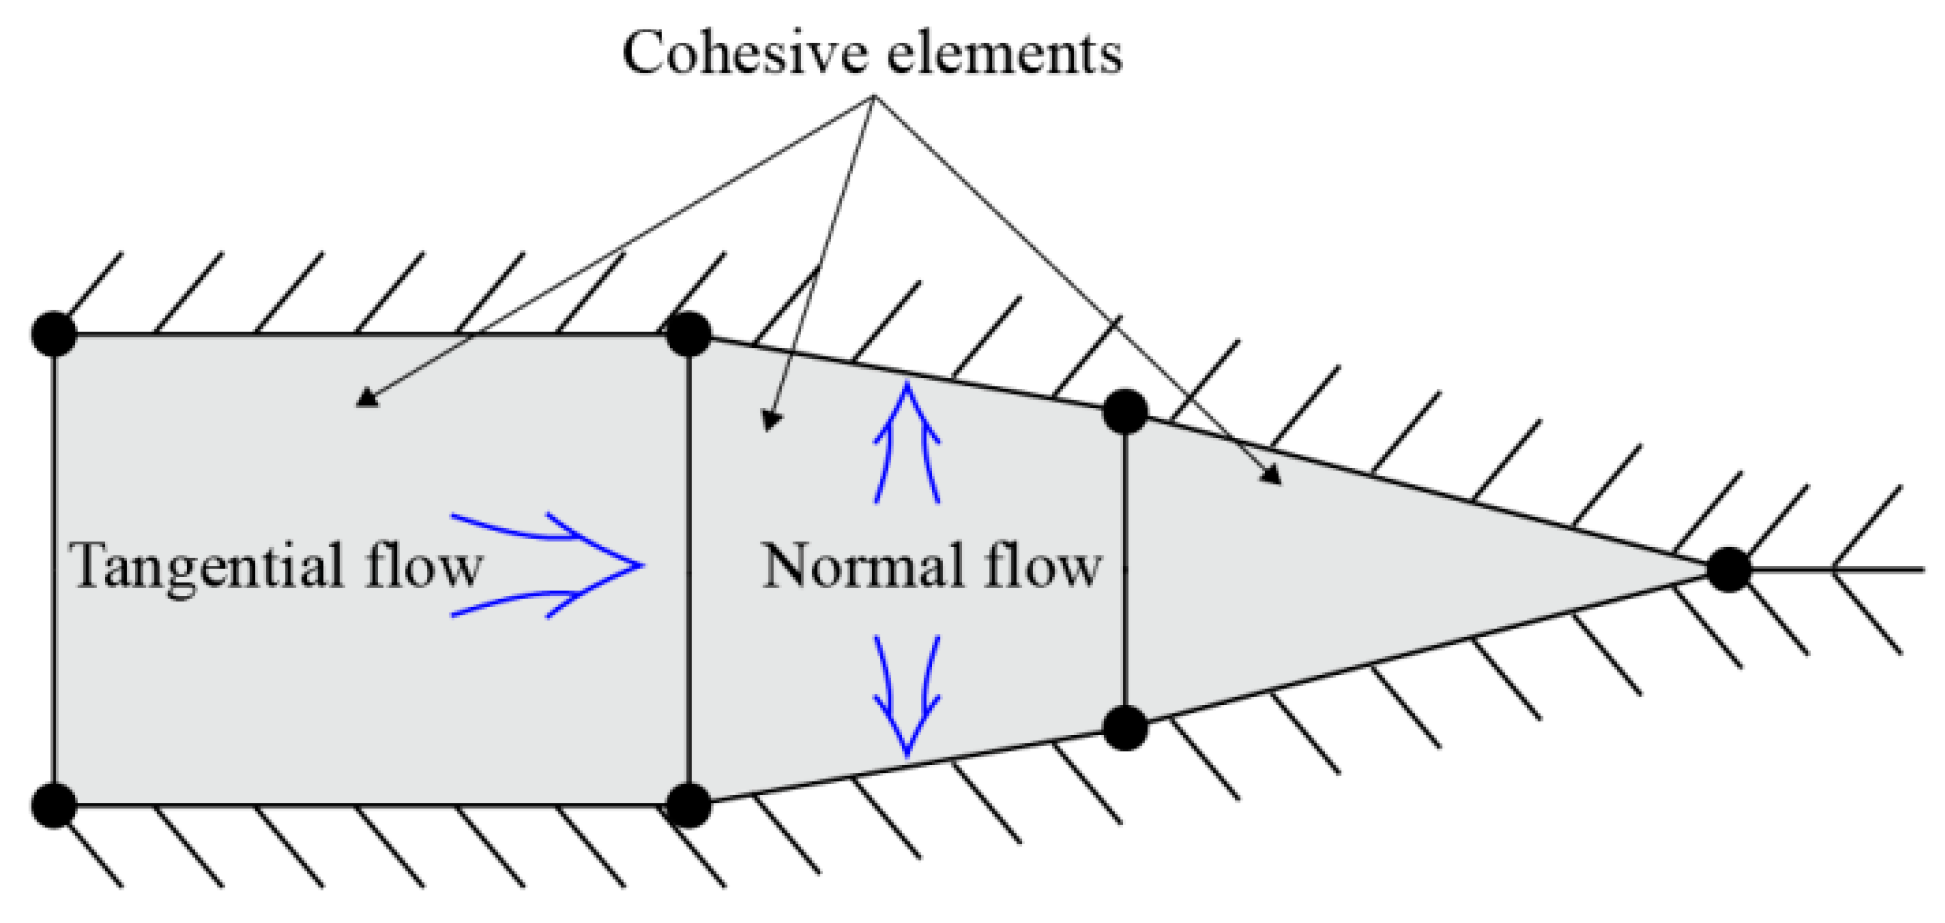
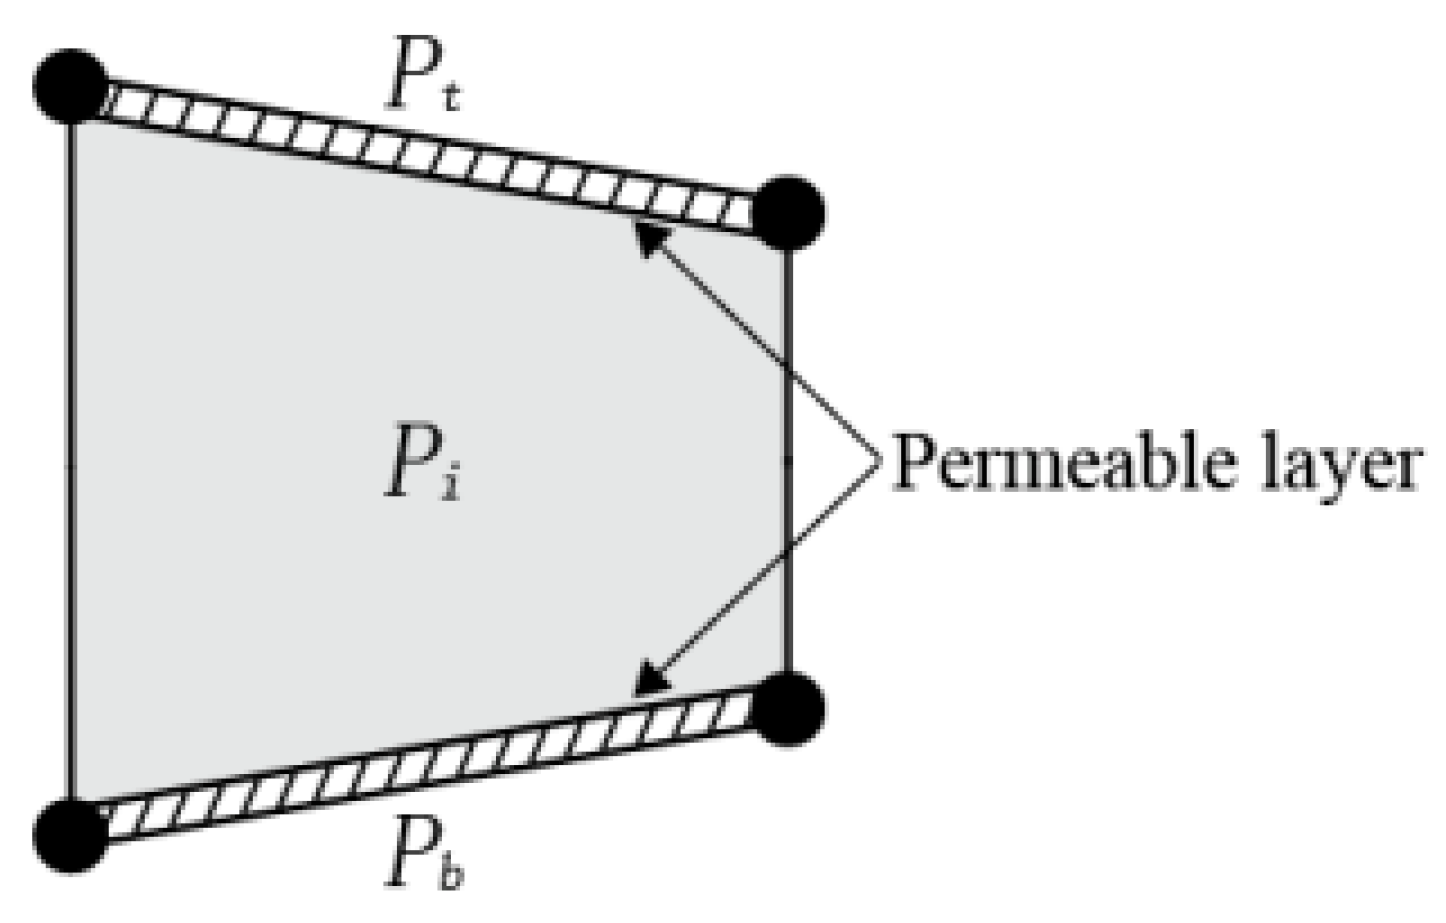
2.3.2. Fluid-Flow Model in Cohesive Elements

Assuming that the fluid within a crack is continuous and incompressible, the fluid flow within a cohesive element can be divided into tangential and normal flows (Figure 2).
(1) Fluid tangential flow equation: The tangential flow on the surface of a cohesive element can be obtained using Newton’s model. The volume flow in Newtonian fluid is given by the following expression [24]:
Q = k t p
where Q is the injection rate, kt is the tangential permeability, and ∇p is the pressure gradient along the fracture surface.
According to Reynold’s equation, tangential permeability can be defined as [24]:
k t = d 3 12 μ
where d is the opening displacement of the fracture element and μ is the viscosity of the fracturing fluid.
(2) Normal flow-flow equation: The normal flow of fluid on the fracture element can be explained as the rate that a given volume of fluid flows into a simulated regional element, which corresponds to the filtration phenomenon in engineering (Figure 3).
The formula for calculating the normal flow of fluid on the upper and lower surfaces of cohesive elements is as follows [24]:
{ q t = c t ( p i p t ) q b = c b ( p i p b )
where q is the volume-flow rate, c is the filtration coefficient, p is the pore pressure, and pi is the fluid pressure at the virtual node on the edge of a rupture unit. The subscripts t and b indicate the upper and lower surfaces of the cohesive element, respectively.

2.4. Fracture-Propagation Criterion

2.4.1. Damage Initiation

In this study, the maximum principal stress criterion was adopted as the fracture initiation criterion:
f = { σ max σ max 0 }
Damage starts when σ max 0 is equal to the critical maximum principal stress value, σ max , expressed as:
{ σ max = 0 , σ max < 0 σ max = σ max , σ max 0
That is, the cohesive element does not initiate damage under pure compression.

2.4.2. Damage Evolution Criterion

The damage evolution law was used to describe the stiffness–degradation rates of materials. The damage variable D was defined as representing the overall damage to the materials, where D evolved from 0 to 1 during the damage process. The influence of the damage variables on the stress components can be expressed using the following formula:
{ t n = { ( 1 D ) t ¯ n , t ¯ n 0 t ¯ n , otherwise t s = ( 1 D ) t ¯ s t t = ( 1 D ) t ¯ t
where t ¯ n , t ¯ s , and t ¯ t are the three stress components predicted by the elastic–plastic traction–separation behavior combined with the current strain. In order to describe the damage evolution under the joint actions of normal and shear deformation on the interface, the effective displacement [25] was introduced and defined as:
δ m = δ n 2 + δ s 2 + δ t 2
The damage variable D was expressed in the form of linear softening based on the effective displacement:
D = δ m f ( δ m max δ m 0 ) δ m max ( δ m f δ m 0 )
δ m f = 2 G C T e f f 0
where δ m f denotes the effective displacement when a failure occurs, δ m 0 is the effective displacement of the damage initiation evolution, δ m max represents the maximum effective displacement during loading, T e f f 0 is the effective traction force at the beginning of the damage, and G C is the fracture energy [25].

2.5. AE Based Numerical Simulation Method
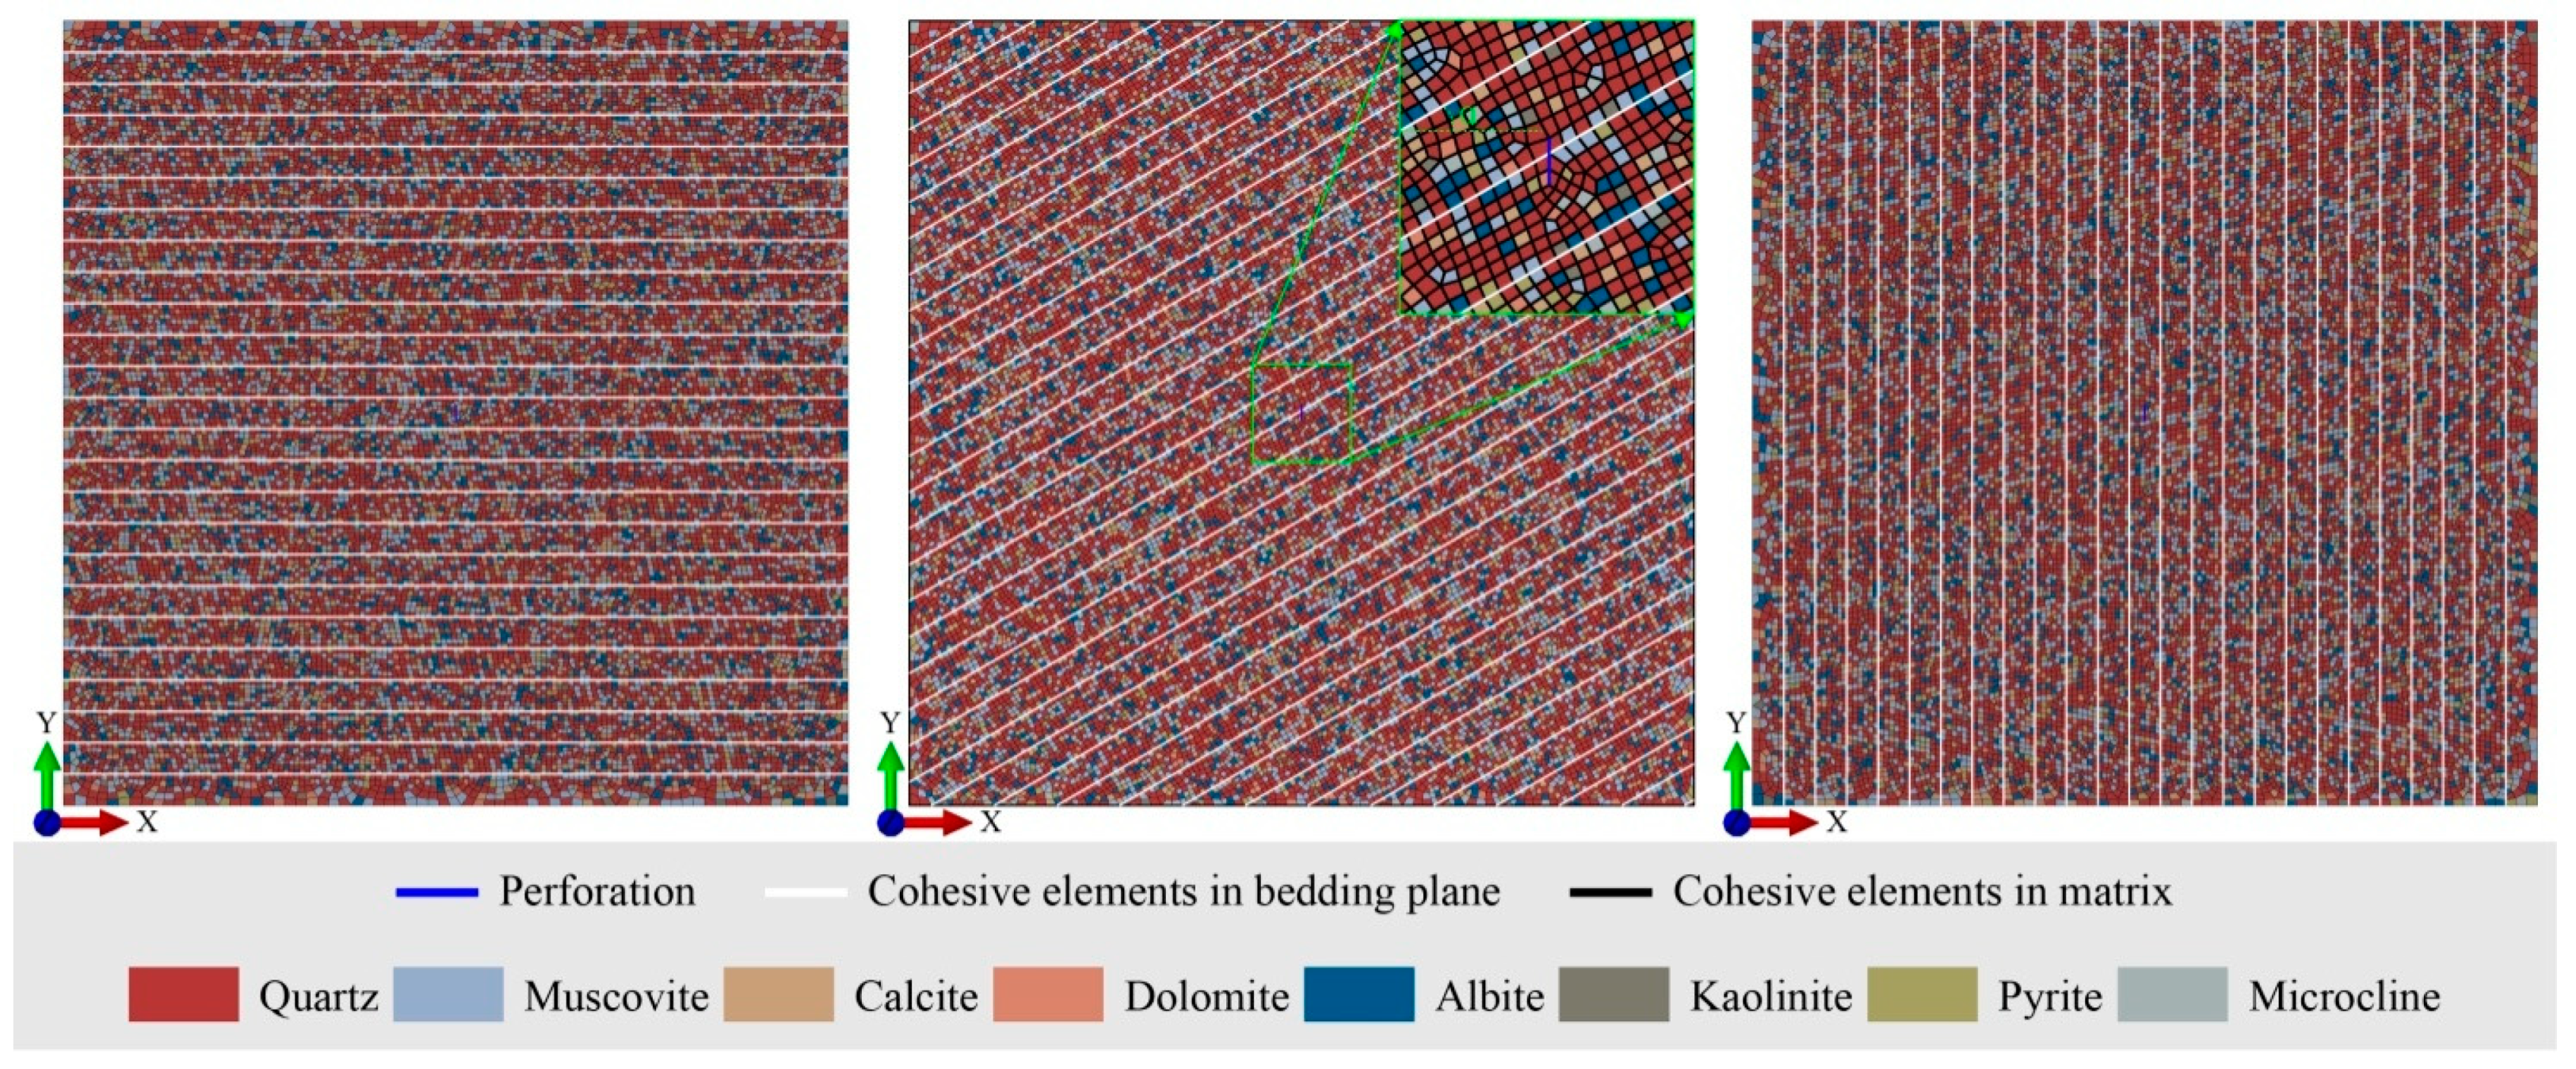
AE technology is an effective means of monitoring crack propagation that can be used to continuously monitor the generation and development of cracks in real time, and it has been widely used in the field of rock mechanics [26]. To deeply analyze the process of fracture propagation, based on the principle of the AE method, Python was used to extract the simulation results, and MATLAB was used to process the simulation data. In this manner, AE-based numerical simulations were performed with the finite element, and accurate AE-location map and AE-characteristic parameters were obtained. The basic concept is as follows [27]:
First, all damage elements and their initial damage times were extracted, and the numbers of damaged elements at different times were counted as the number of AE events. Second, the node coordinates and dissipated energy of the damaged elements were obtained to calculate the coordinates of the AE event and energy. Finally, the damage-element parameter, MMIXDME, was obtained to determine the fracture type. The MMIXDME parameters were defined as follows:
M M I X D M E = G s + G t G T ; G T = G n + G s + G t
where Gn, Gs and Gt represent the fracture energies of the three fracture types. MMIXDME of 0 represents a pure tensile fracture, and MMIXDME of 1 represents a pure shear fracture. Tensile-shear mixed fractures are represented with MMIXDME between 0 and 1.

3. Numerical Model

As a mineral assemblage, rocks are composed of various mineral particles with mineral heterogeneity, and the BP of shale is extremely developed. Therefore, it is necessary to consider both the mineral heterogeneity and bedding anisotropy of shale. The types and proportions of minerals contained in the shale were determined based onshale X-ray diffraction results [28] (Table 1). In Python, mineral particles were represented by grid elements, and strength parameters were applied to different minerals to determine the heterogeneity of shale minerals.
Simultaneously, a cohesive element with 0 thickness was used to construct the BP. To determine the randomness of the fracture propagation, cohesive elements with 0 thickness were embedded globally in the model by programming, and different material properties were assigned to the cohesive element at the BP and between solid elements to highlight the weakness characteristics of the BP. In this manner, a model of mineral heterogeneity and BP anisotropy was established (Figure 4).The size of the model was 50 m × 50 m, the initial fracture parallel to the direction of the maximum principal stress was prefabricated in the center of the model as the perforation, and the perforation length was set to 1 m.
After setting the angle between the BP and the minimum principal stress, a numerical model with seven different BP angles (0°, 15°, 30°, 45°, 60°, 75°, and 90°) was established. The average number of elements for the seven models was 67,932, the solid element was composed of a four-node plane strain pore fluid element, and the average number of elements was 22,692. The cohesive element employed four-node cohesive pore fluid/stress elements, with an average of 45,240 elements. The geostatic and soil analysis steps were set, and a transient consolidation analysis was performed. Fracturing fluid injection was simulated by editing keywords using the C-flow function. The basic reservoir and cohesive element parameters (Table 2) were set based on published data [29].

4. Simulation Results

The AE simulation data and numerical simulation results were obtained to determine the interaction processes between the HFs and BP and the influence of the BP angle on the evolution of the HF network was determined.

4.1. Fracture Path and AE-Location Map

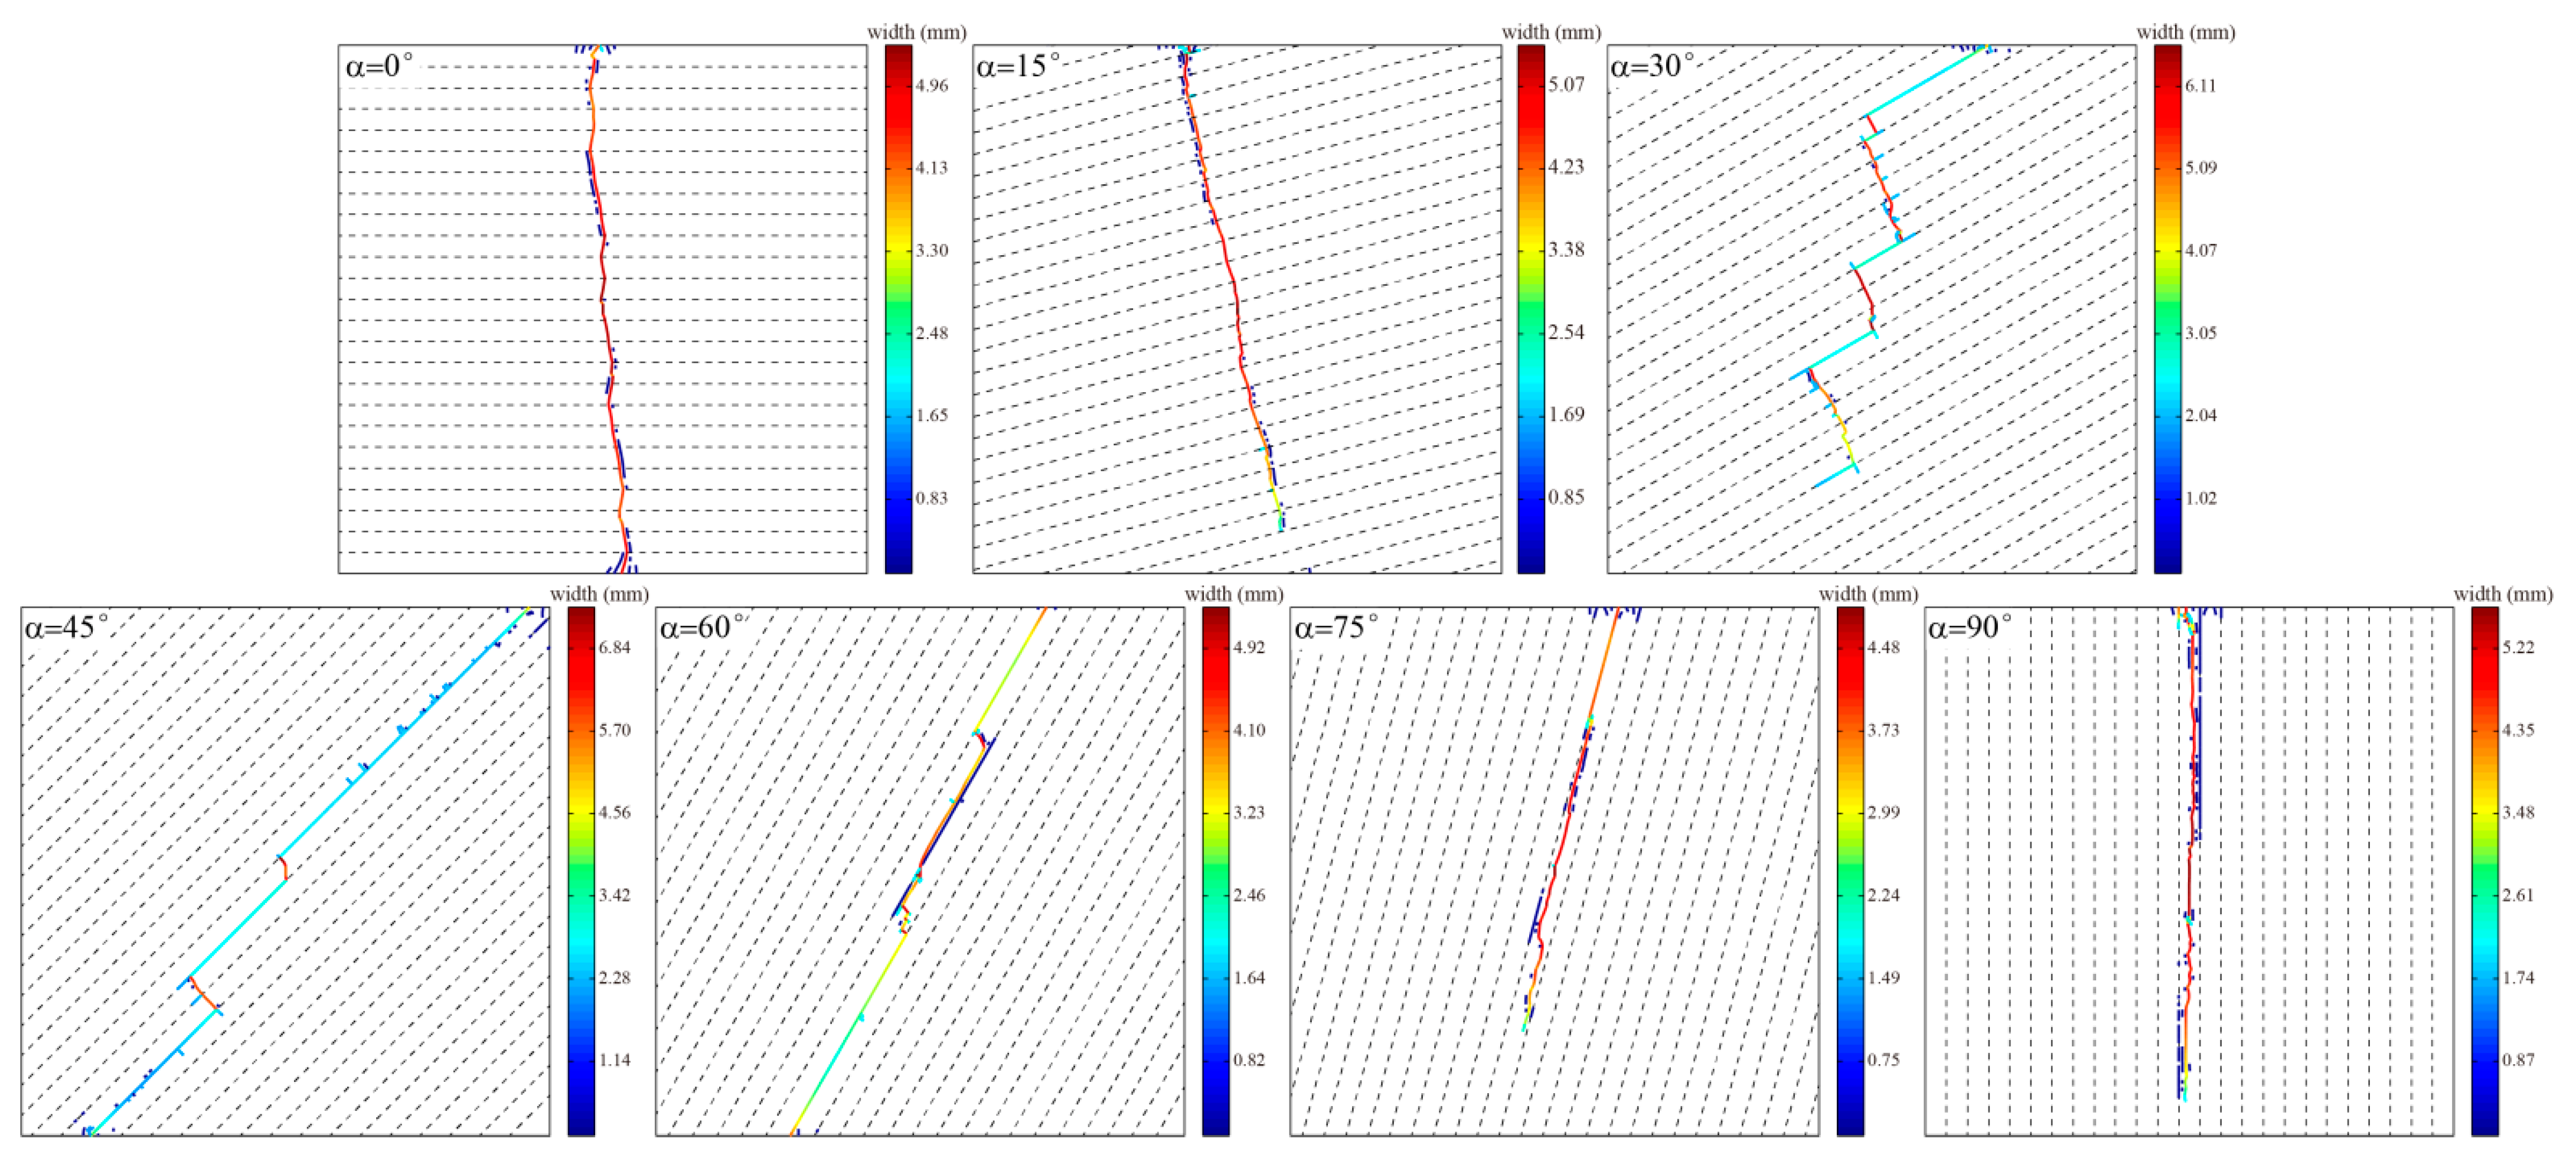
4.1.1. Fracture-Propagation Paths

The fracture-propagation paths were extracted at seven BP angles (Figure 5). Different colors represent the fracture widths, which increased from blue to red. According to the fracture path, the overall propagation direction of the fracture was along the direction of the maximum principal stress after the fracture started from the perforation. When the BP angles were set to 0° and 15°, the fractures ruptured through the layer and spread along the direction of the maximum principal stress, and the fracture width was large. When the angle of the BP was greater than 15°, the BP hindered the propagation of fractures along the direction of the maximum principal stress, resulting in complex fracture patterns in the cross-layer and bedding slip fractures. With an increase in the bedding angle, the fracture path gradually tended to become a single bedding slip fracture from the cross-layer fracture. When the BP angle was 30°, the phenomena of cross-layer and bedding slip fractures were the most obvious, the fracture path was the most complex, the fracture width of the cross-layer fracture was generally larger than that of the bedding slip fracture, and the cross-layer fracture hada high fracture width (which is more conducive to proppant migration and filling).

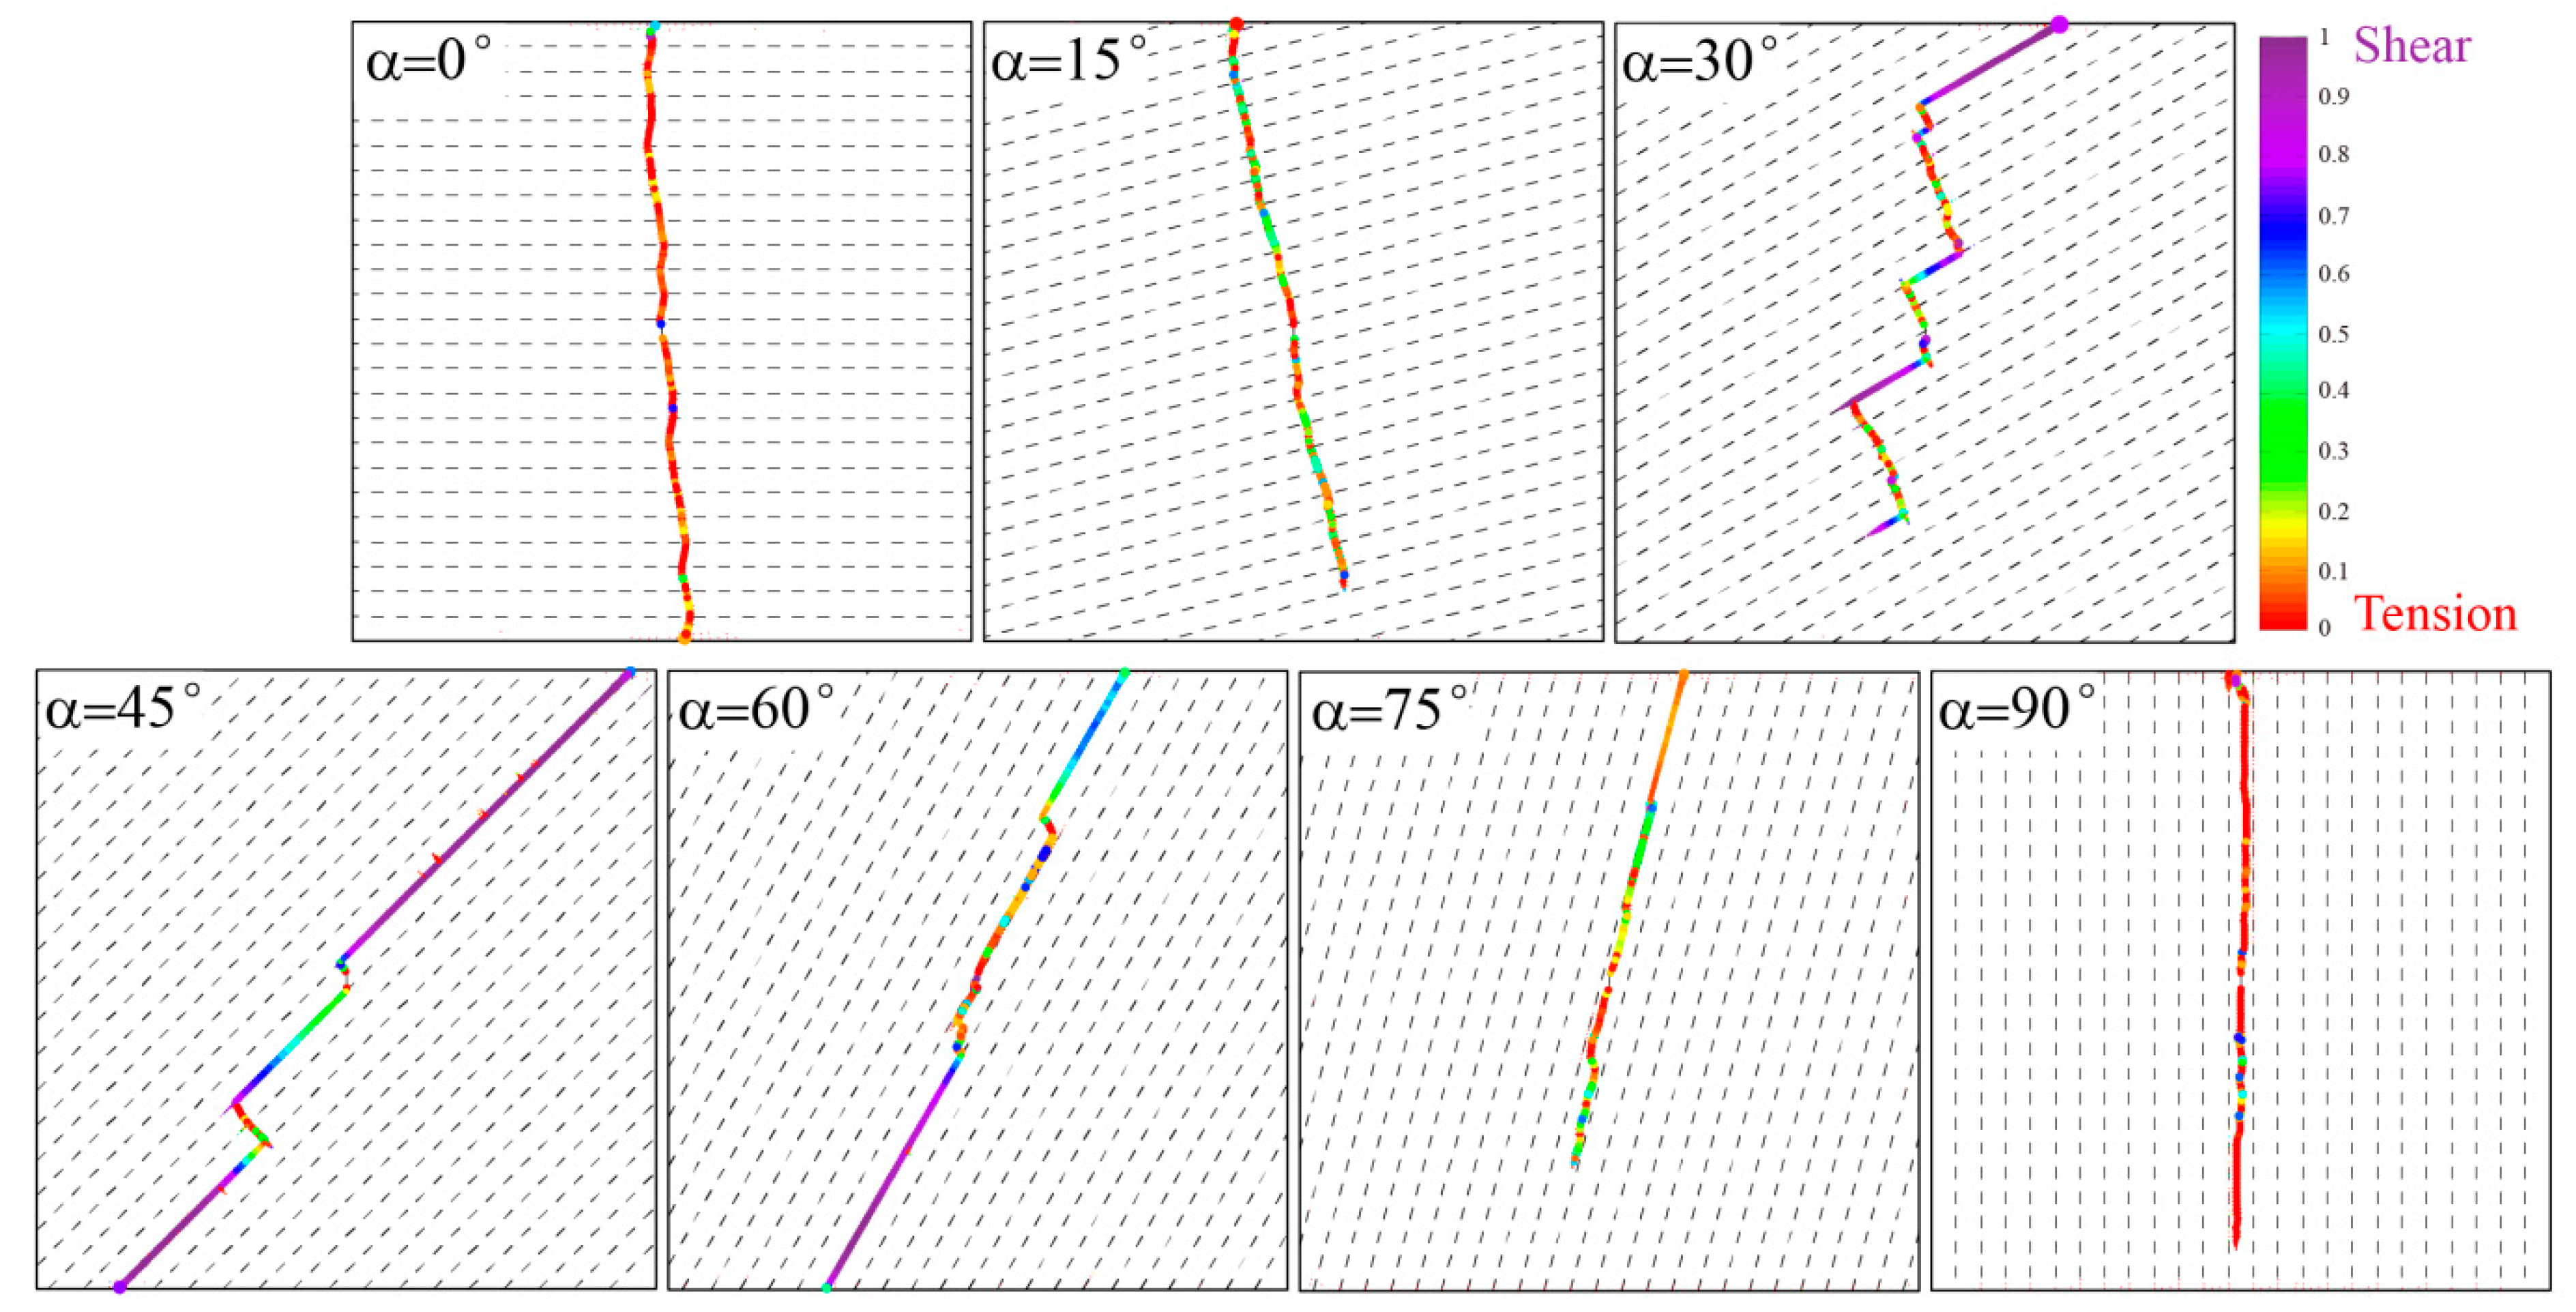
4.1.2. AE-Location Map

The AE parameters were obtained using Python, and a AE-location map was drawn using MATLAB (Figure 6). The AE energy and fracture type are represented by the size and color of the AE-event points, respectively. Red points represent pure tensile fractures, and purple points represent pure shear fractures. According to the AE-location map, the overall fracturing process was dominated by tensile fractures that were mainly manifested in cross-layer fractures. The bedding slip fractures were mainly of the shear-fracture type, which is caused by dislocation sliding due to the opening of the BP under the action of hydraulic fracturing. During actual hydraulic fracturing construction, the tensile fracture readily closes under the action of in situ stress. Although proppants provide support, tensile fractures have higher proppant-strength requirements, whereas shear fractures are difficult to close. Therefore, the formation of bedding-shear fractures is conducive to the exploitation of tight oil and gas. With an increase in the BP angle, the fracture underwent discontinuous dislocation expansion, which was no longer obvious after 45°, and the BP became the main controlling factor of HF propagation.

4.2. Fracture Lengths and Numbers of AE Events

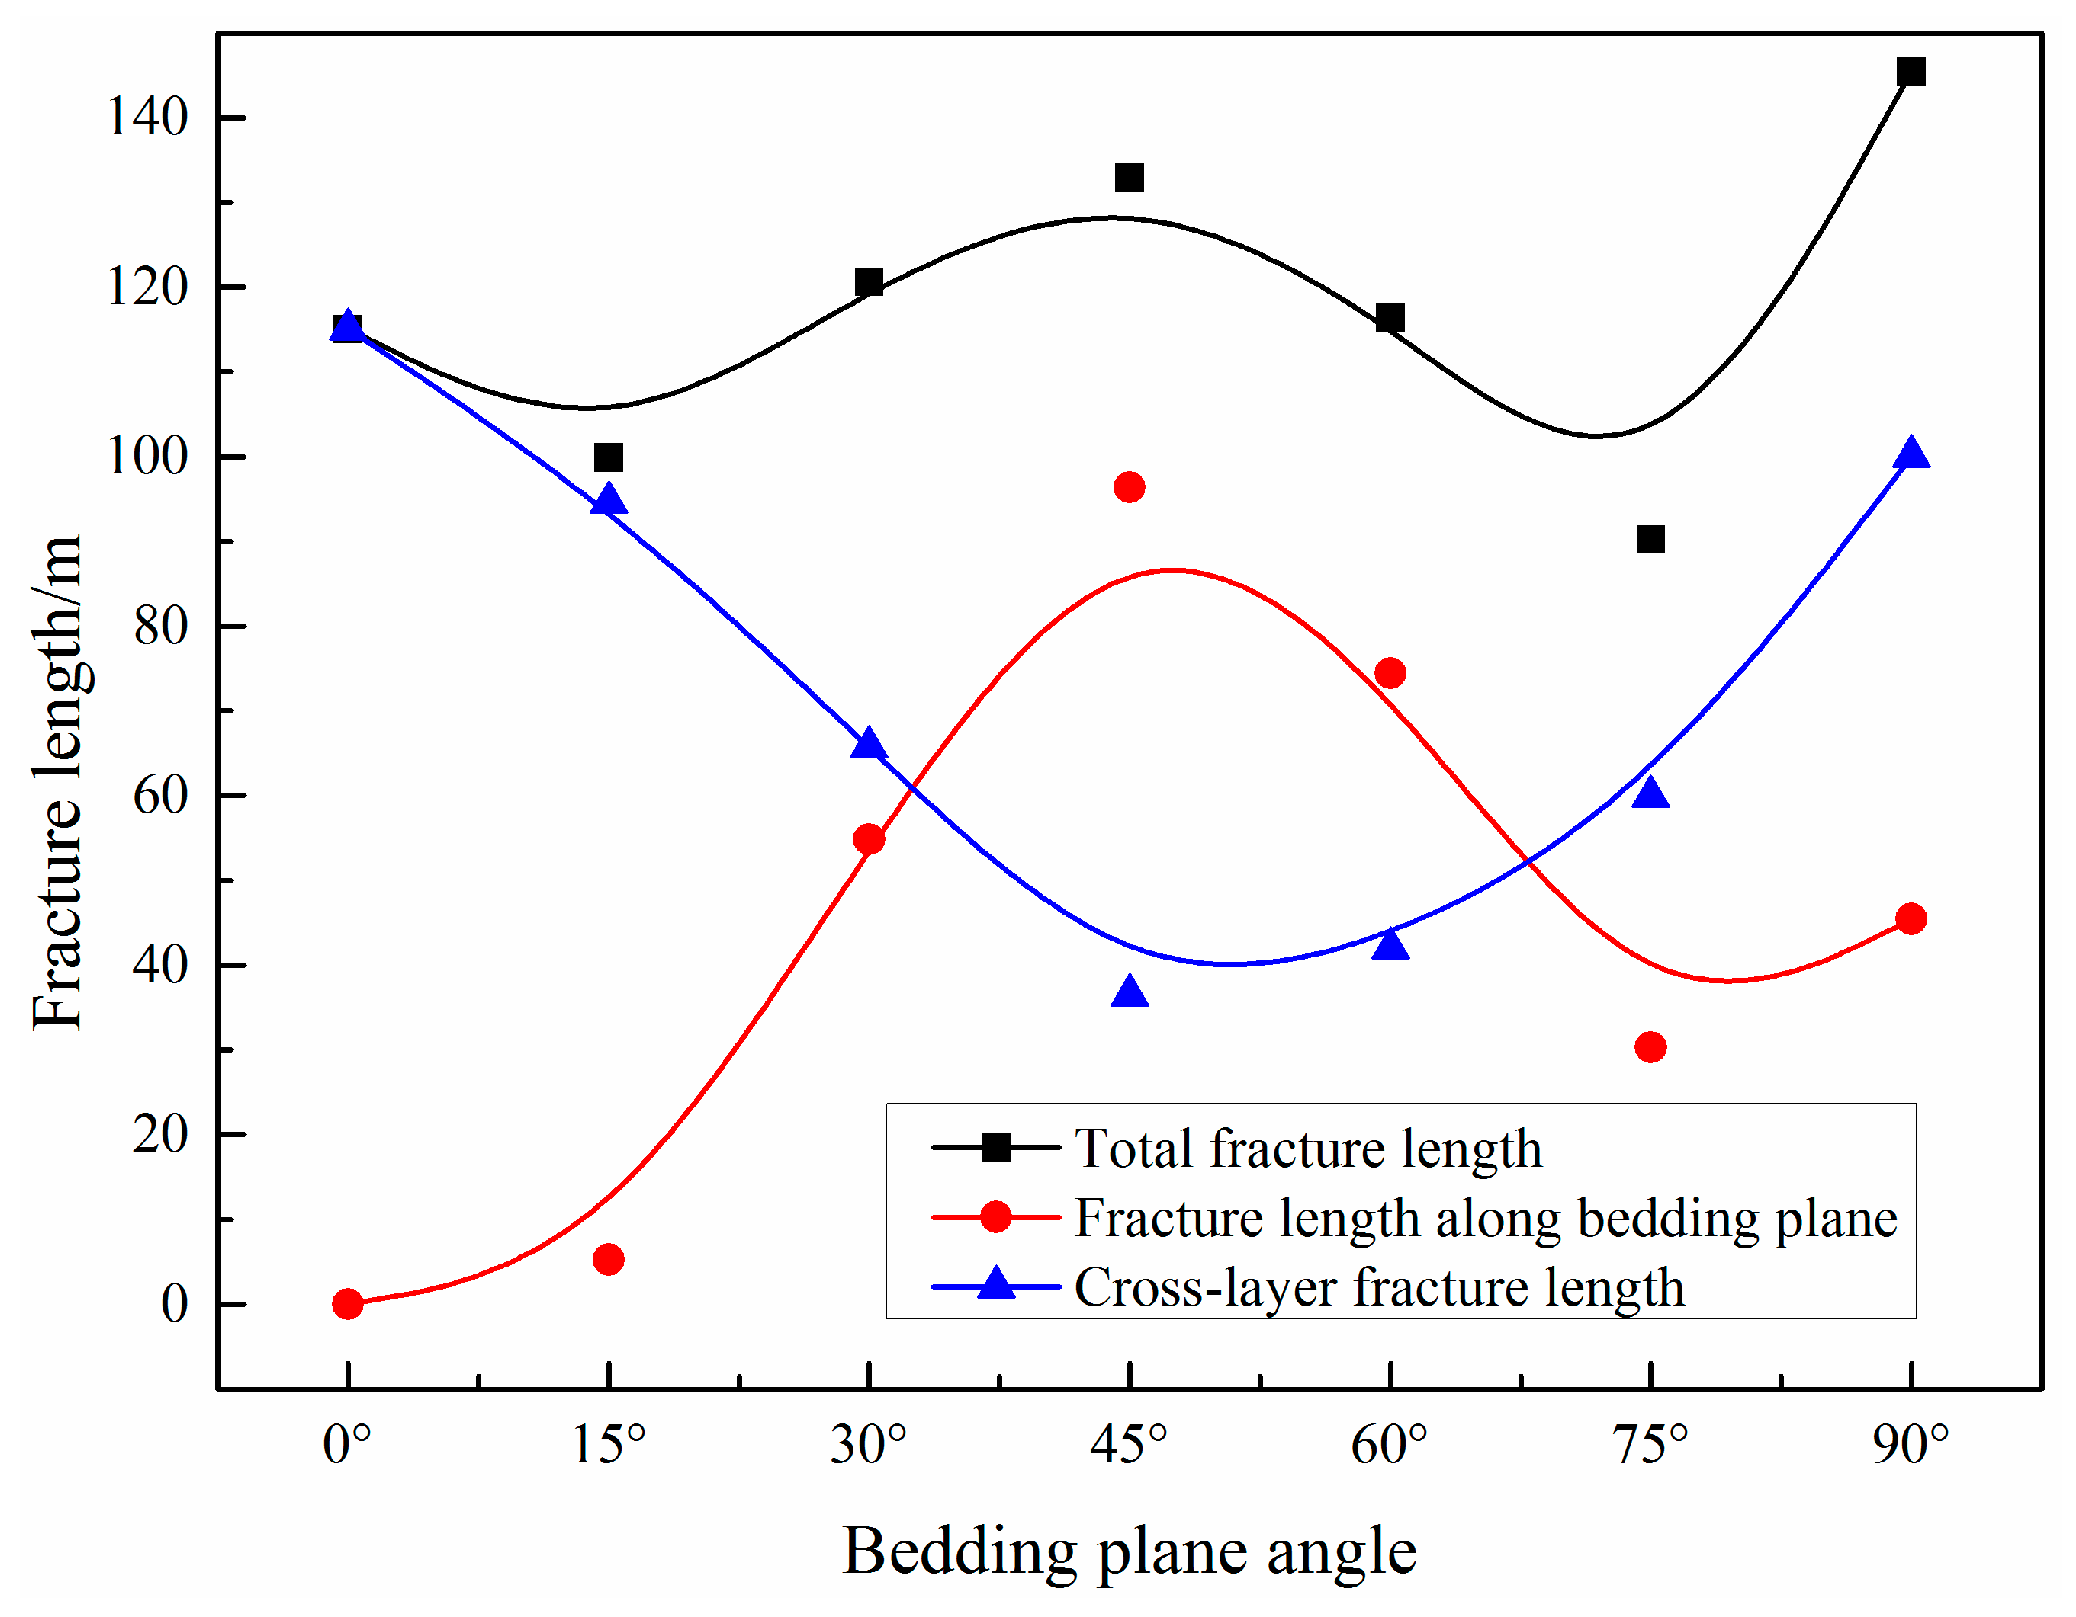
4.2.1. Fracture Length

In addition, the fracture lengths of the seven BP angles were extracted (Figure 7). The total lengths of the fractures at the seven bedding angles were of the ‘W’ type, and the lengths of the cross-layer fractures were of the ‘U’ type. At 0°, the lengths of the cross-layer fractures were equal to the total length of the fractures. At this point, the BP did not significantly influence the HF propagation, and this result may be related to the strength of the BP, which requires further detailed research. When the BP angle was 45°, the cross-layer fracture was the smallest, and the ability to capture HFs was the strongest. The length of the bedding slip fractures increased gradually from 0° to 45° and decreased above 45°, but there was a small increase at 90°. When the BP angle was 90°, because the perforation did not completely coincide with the BP, the ground stress had the main advantage of fracture propagation, and the fracture extended along the direction of the maximum principal stress. Owing to the weak strength of the BP, the pore water pressure induced initiation and propagation of the BP near the HF at the same time as HF propagation. Therefore, when the BP angle was 90°, the bedding fracture was incomplete. The length of the cross-layer fracture at 30° was close to that of the bedding slip fracture, indicating that the cross-layer and bedding slip fractures occurred simultaneously, which is conducive to the generation of a complex fracture network.

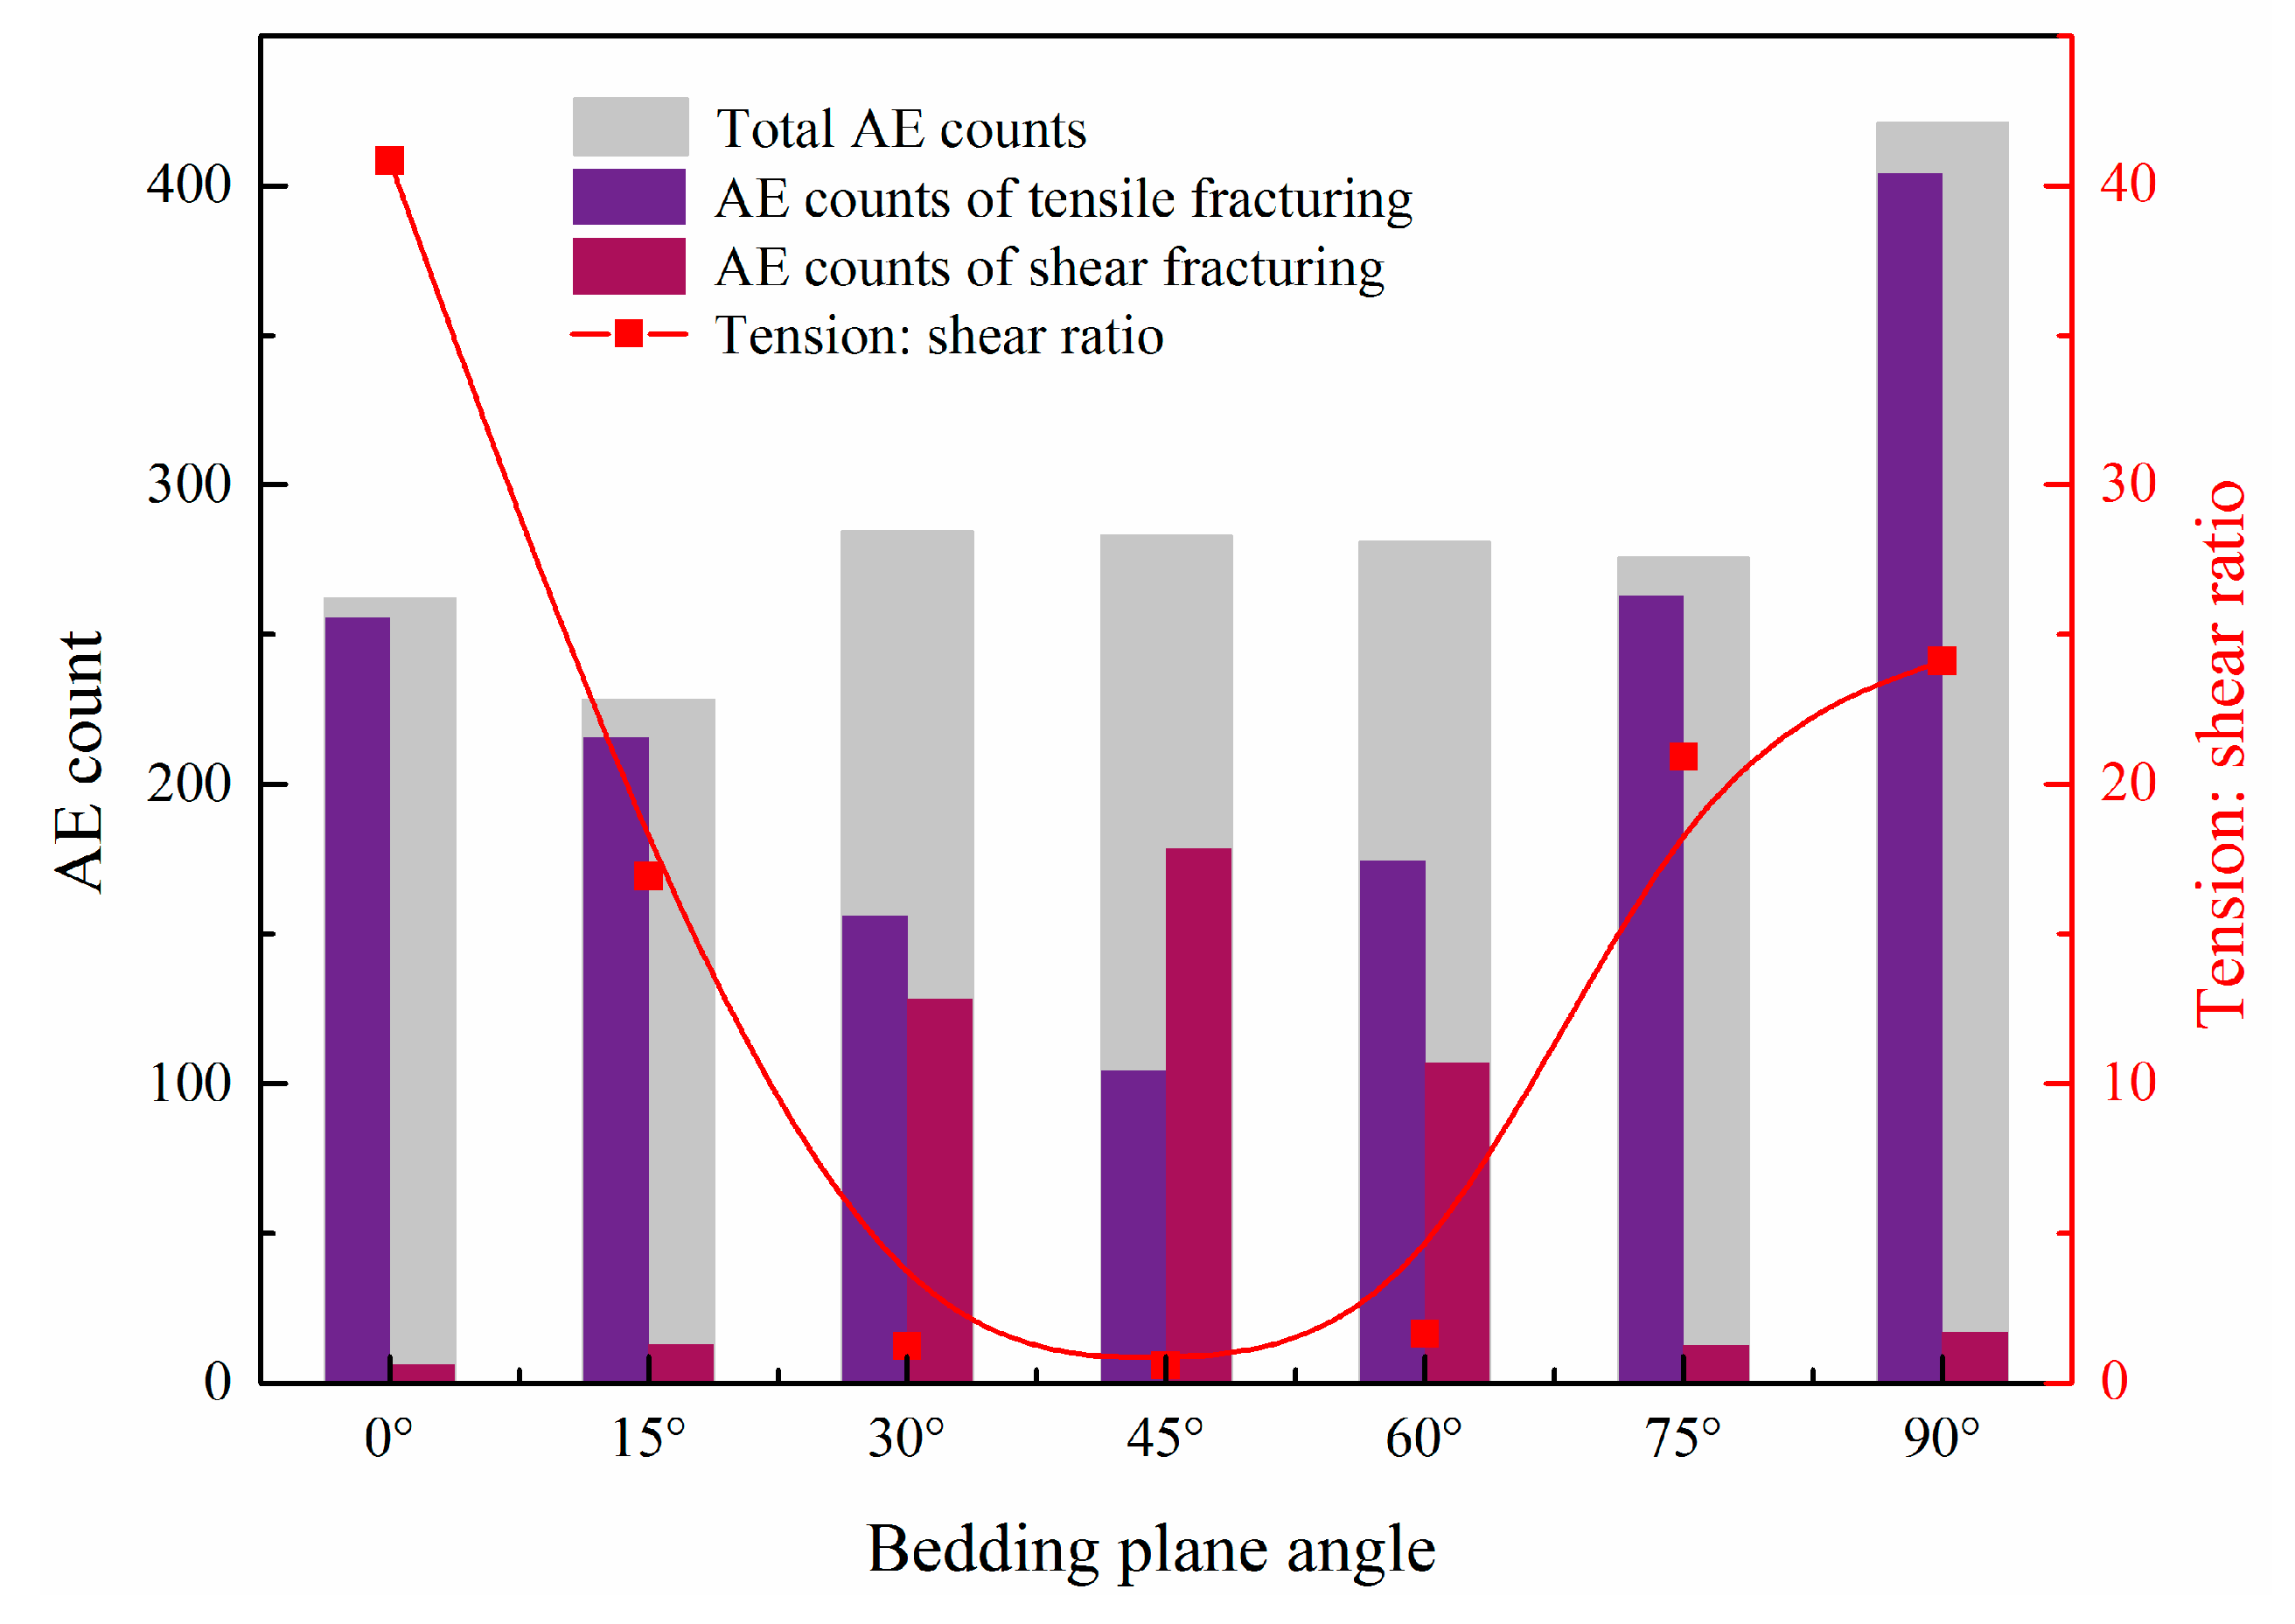
4.2.2. Number of AE Events

Tensile fractures were considered dominant when MMIXDME was less than 0.5, and shear fractures were considered dominant when the value was between 0.5 and 1. Based on this, the numbers of AE events for different rupture types were determined using MATLAB (Figure 8). The numbers of AE events of the tensile-fracture type first decreased and then increased with increasing angles and were generally greater than those for the shear-fracture type (except at an angle of 45°), indicating that the tensile fracture was dominant. However, the numbers of shear-fracture events showed an opposite trend to that of the number of tensile-fracture events, which first increased and then decreased. When the angles were 30°, 45°, and 60°, the numbers of shear-fracture events were highest, and the tensile-shear ratio was lowest. When the BP angle was 30°, the numbers of tensile and shear-fracture events were similar. The cross-layer and bedding slip fractures were tensile and shear failures, respectively. Therefore, the alternating complex propagation process of cracks was also reflected in the AE-fracture type.

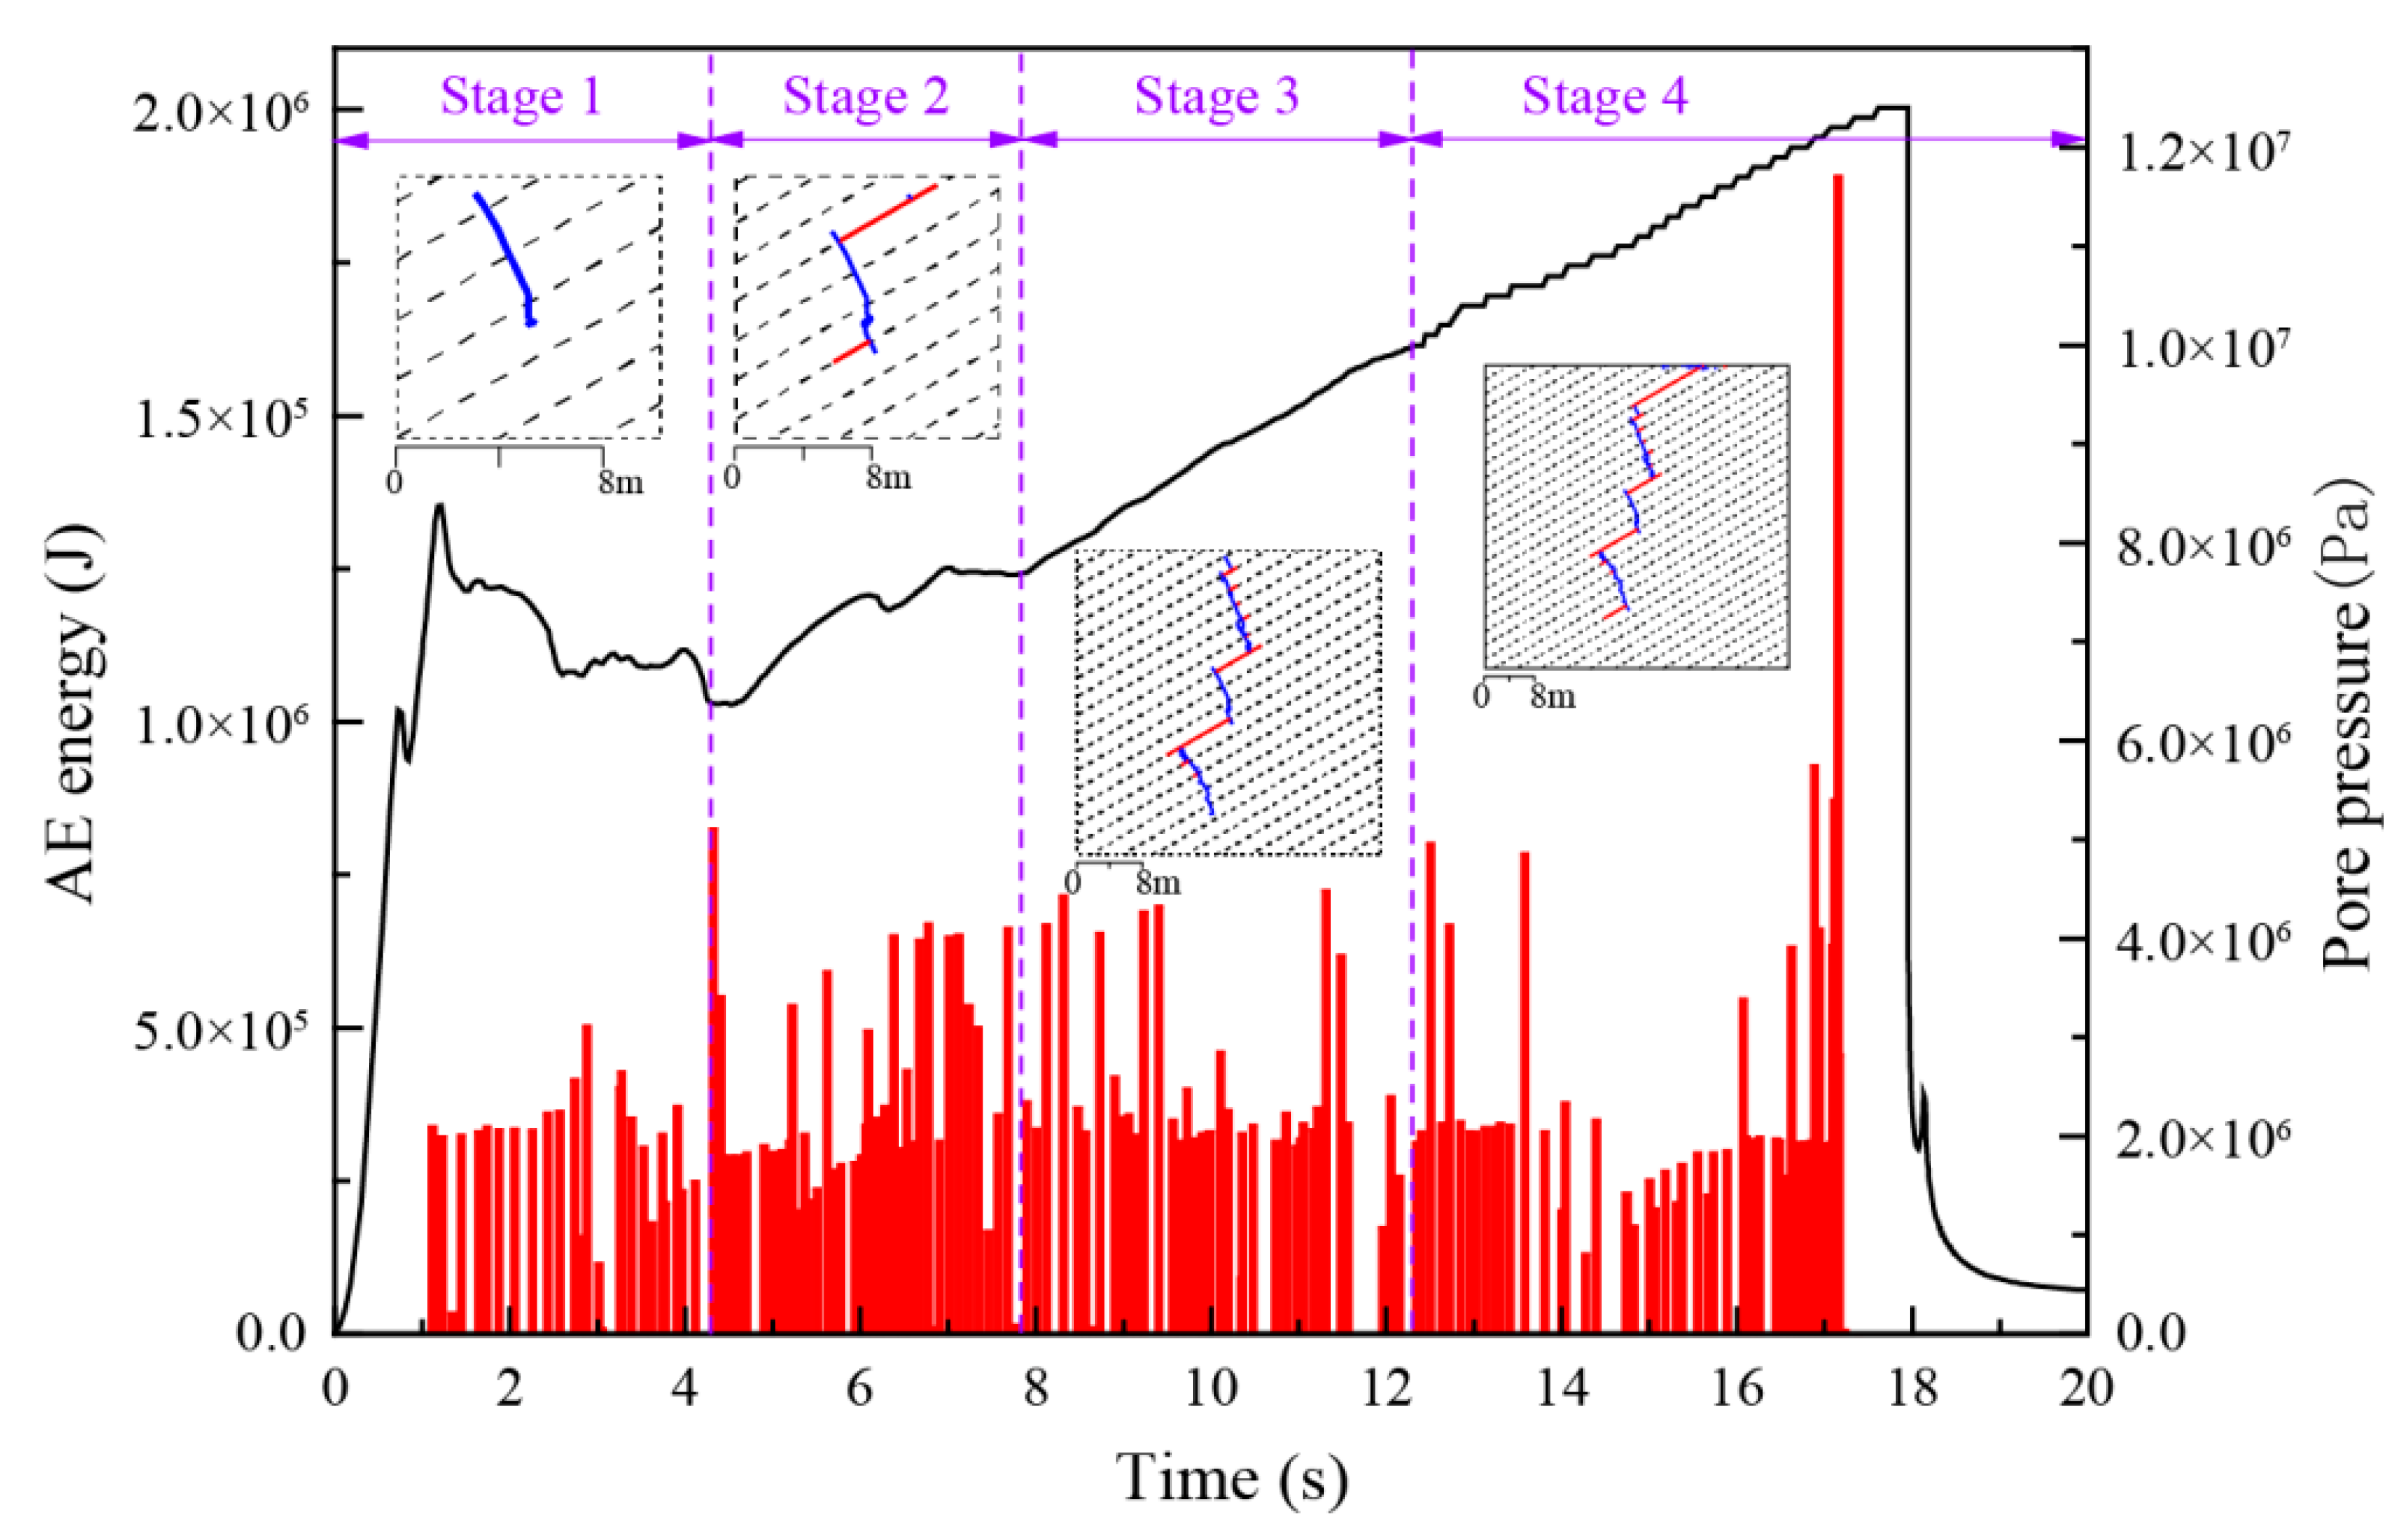
4.3. Pore-Water Pressure Curves and AE-Energy Distributions

The pore-water pressure curves and AE-energy characteristics of the perforating orifice at different BP angles were extracted. In this study, a BP angle of 30° was used as an example for analysis (Figure 9). According to the degree of fluctuation of the pore-water pressure curve and the distribution characteristics of the AE energy, the fracturing process could be roughly divided into four stages. The fractures started at the first stage and then continued to fracture throughout the layer. At this time, the AE energy was evenly distributed in the interval. The second stage showed rapid fracture expansion, during which the AE-energy distribution was more concentrated. It was observed from the fracture path that this stage was mainly the fracture of the BP. Owing to the weakness of the BP, the fracture occurred rapidly, and the pore-pressure curve also clearly fluctuated at this time. During the third stage, the pore-water pressure increased steadily, and the fracture exhibited stable expansion. During this process, the fractures were mainly comprised of extensional cross-layer fractures with a single fracture type and a stable pore-pressure curve. Moreover, the AE energy was evenly distributed in the form of multiple clusters during this stage. At the end of the stage, the AE energy varied owing to a small amount of bedding fractures. During the fourth stage, the fractures entered the last bedding slip fracture expansion stage and were close to the model boundary. Under the influence of the boundary effect, the pore-pressure curve exhibited strong fluctuations, and the AE energy exhibited uneven distribution characteristics. When the fracture penetrated the model boundary, the pore pressure dropped sharply, and a high-intensity AE energy event occurred.

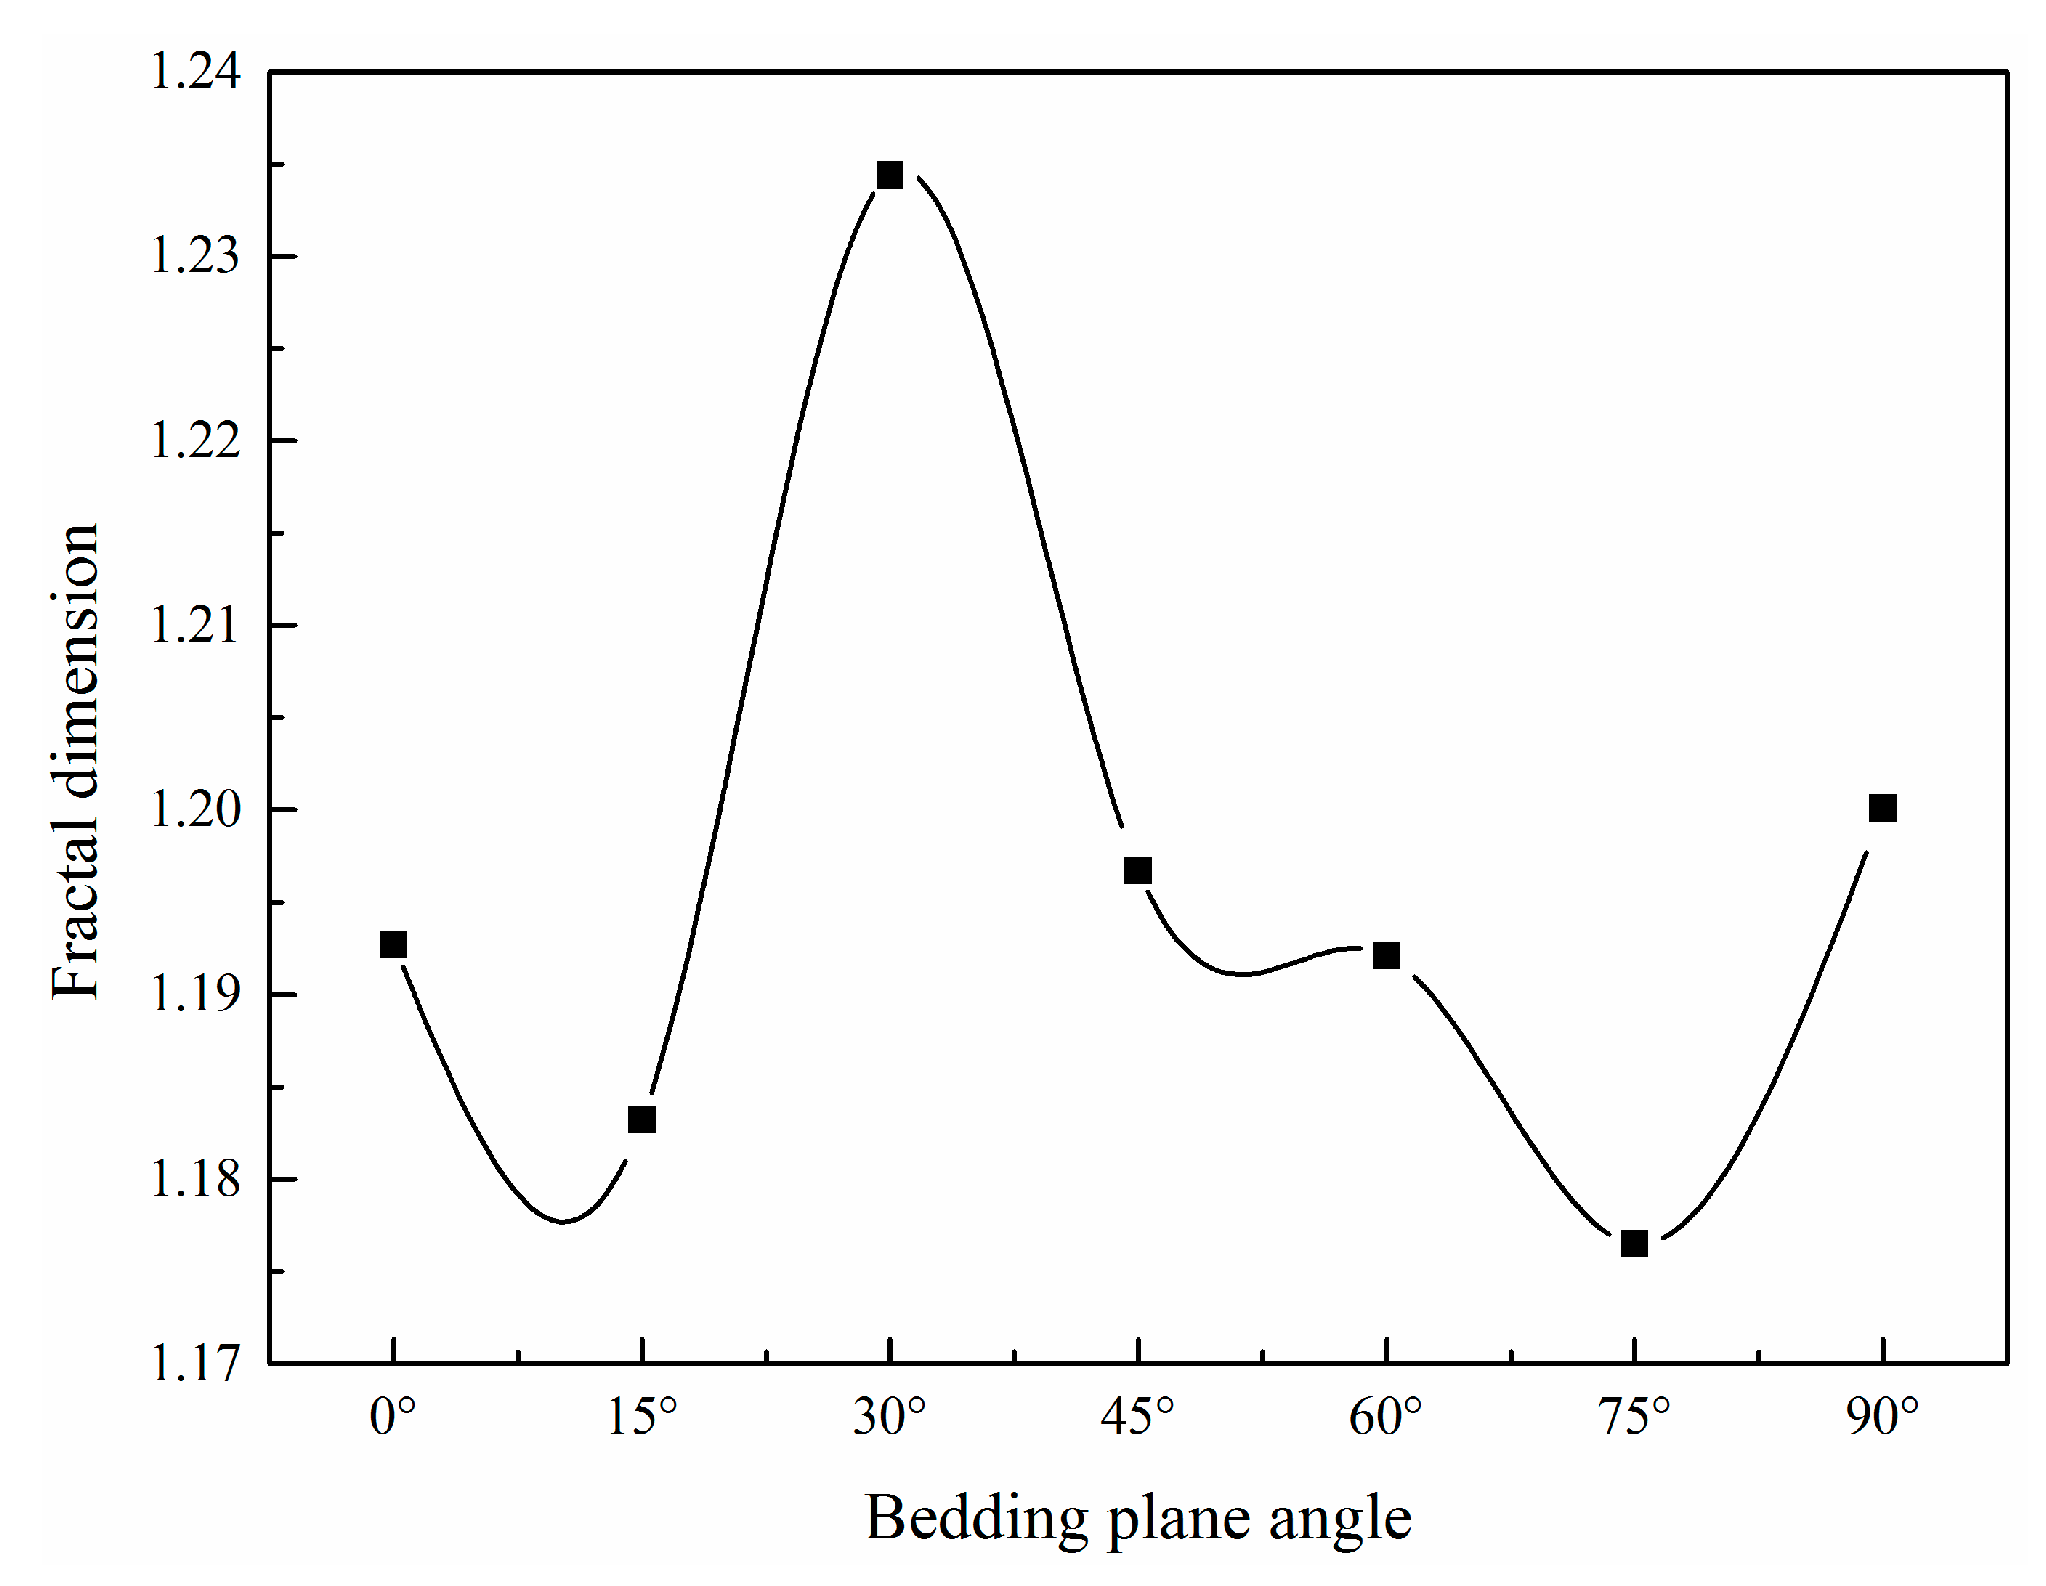
4.4. Fractal Dimensions (FDs)

To quantitatively analyze the influence of different BP angles on the HF effect, the FD was introduced to evaluate the fracturing effect, as the FD can be used to quantitatively evaluate the complexity of the fracture network. Because the box-counting dimension (BCD) method is simple and easy to implement, it is often used to calculate FD [30].
The basic principle of the BCD method is that a square lattice with a side length of δ is used to cover the entire graphic area and count the number of grids containing cracks. Subsequently, the side length of the lattice is continuously reduced, and the corresponding number of grids containing cracks is counted. Finally, a double-logarithmic coordinate system is implemented, and the least-squares method is used for regression analysis of the number of lattices to obtain a fitting line. The slope of the straight line represents the FD in the graph. The relevant equations are as follows:
N ( δ ) = A δ D
where N ( δ ) is the number of grids containing cracks, δ is the edge lengths of the grids, A is the initial value of the image distribution, D is the value of FD, and the D value of a two-dimensional plane is always between 1 and 2.
D can be obtained by taking the logarithms of both sides of (18):
lg N ( δ ) = lg A D lg δ
The BCD method was used to calculate the FDs of fractures at different BP angles (Figure 10). The FDs at a BP angle of 30° were significantly higher than those at other angles, indicating that the fractures at 30° were the most complex and that the fracturing effect was the best.

5. Discussion

Since the influence of proppant was not taken into account in this study, the fracture tends to close under the action of in situ stress after the fracture penetration model boundary. Therefore, the crack width before and after the fracture penetration model boundary can be extracted, and the difference between the two can be obtained to characterize the degree of fracture closure. Then, the response of different fracture types to in situ stress can be obtained by comparative analysis of fracture closure degree and AE location (Figure 11). It can be found that the degree of fracture closure of tensile fracture is obviously greater than that of shear fracture. Therefore, shear fractures are favorable for maintaining fracture width, and tensile fractures require higher proppant strength.
Scholars have proposed mechanisms that influence rock minerals on crack propagation at micro- and nano-scales [12]. However, hydraulic fracturing simulations are usually aimed at fractures with a size of several min length or even larger. Owing to limitations in computing ability, it is unrealistic to reduce the actual size of rock minerals during numerical HF simulations based on the size of the reservoir. Therefore, this study was conducted in attempt to analyze the influence of mineral heterogeneity on fracturing by constructing a mineral heterogeneity model using an approximate method. The horizontal stress contours of the different fracturing stages were extracted (Figure 12). The contour distributions showed that mineral heterogeneity can lead to uneven stress distributions. The stress was concentrated at the fracture tip, but the difference in minerals led to different degrees of stress concentration, which directly affected the subsequent fracture propagation direction. Because the stress–shadow effect caused by fracture propagation was also affected by the mineral distribution, the extended fracture produced compressive stress zones on both sides of the fracture, thereby affecting subsequent fracture propagation. Mineral heterogeneity led to an asymmetrical distribution of compressive stress. In this scenario, the compressive stress on the left side of the fracture was higher than that on the right side. In subsequent fracture-propagation processes, different fracture propagation patterns appeared on both sides of the existing fractures.
Shale in different regions showed strong differences in bedding spacing. It is of great significance to investigate the influence of bedding spacing on HF propagation in order to reasonably guide fracturing design. Fracture-propagation paths for different BP spacings were obtained (Figure 13). The smaller the BP spacing, the more obvious the BP effect. When the BP spacing was small, the weak-plane distribution was dense, and a large number of intermittent short cracks was readily produced. The fracture path shows that short bedding slip and cross-layer fractures appeared alternately, and the width of the cross-layer fracture was larger than that of the bedding slip fracture. When the spacing between BPs was large, weak BPs were sparsely distributed and had a lower chance of interacting with HFs; therefore, their influence on HFs was small. However, when the spacing between BPs was moderate, the length of a single bedding slip fracture increased significantly, and the compression-fracture network formed by the interaction with cross-layer fractures was beneficial for improving the mining efficiency and increasing production.
According to the numerical simulation results, the fracture propagation path is determined by the in situ stress and BP, but their influence proportions are different. The influence of BP on HFs is also affected by factors such as BP angle, strength and spacing. The energy of HF propagation is mainly used to overcome the strength of the rock and the compression of the in situ stress field. When the angle between the BP and the direction of the maximum principal stress is large, the BP needs more energy to resist the influence of the in situ stress field if it wants to crack. However, when the energy is insufficient to open the BP, the rock has broken. At this time, the energy is released, and the bedding plane is more unlikely to crack. However, when the angle between the BP and the direction of the maximum principal stress is small, the compression effect of the in situ stress field on the BP is reduced. Therefore, the energy required for the initiation of the BP decreases, and the BP is easier to open. As can be seen in Figure 5, when the angle of BP is 30°, the bedding plane effect begins to appear. This indicates that the residual energy after overcoming the effect of rock strength and in situ stress field just meets the initiation condition of BP. Of course, it is also related to the strength of the BP. Under this critical condition, the fracture behavior of cross-layer and bedding slip alternation is generated. Since then, with the increase of BP angle, the compression effect of in situ stress on BP is weakened. And the energy required to open the BP is reduced, so the BP effect is clearer. Combined with Figure 13, it can be found that this phenomenon is also related to the spacing of BPs. Therefore, different combinations of bedding plane angle, strength and spacing may produce different fracture path, which is a complex process and needs further research.

6. Conclusions

The influence of different BP angles on the evolution of the HFN was studied using the global-embedding cohesive element method. Moreover, the interaction processes between the HF and BP were analyzed using AE-based numerical simulation. HF effects corresponding to different BP angles were comprehensively evaluated using multiple simulation results. The following conclusions were drawn.
(1)
The maximum principal stress was always the main factor controlling the propagation of HFs, and the BPs captured HFs to inhibit their propagation along the direction of maximum principal stress. The larger the angle between the BP and the minimum principal stress, the stronger the capture ability. In addition, when a BP captured an HF, the phenomena of cross-layer and bedding slip fractures occurred alternately, showing characteristics of an intermittent dislocation fracture, which were most obvious when the BP angle was 30°. These results indicate that the final fracture path of the HF was determined by the maximum principal stress and BP.
(2)
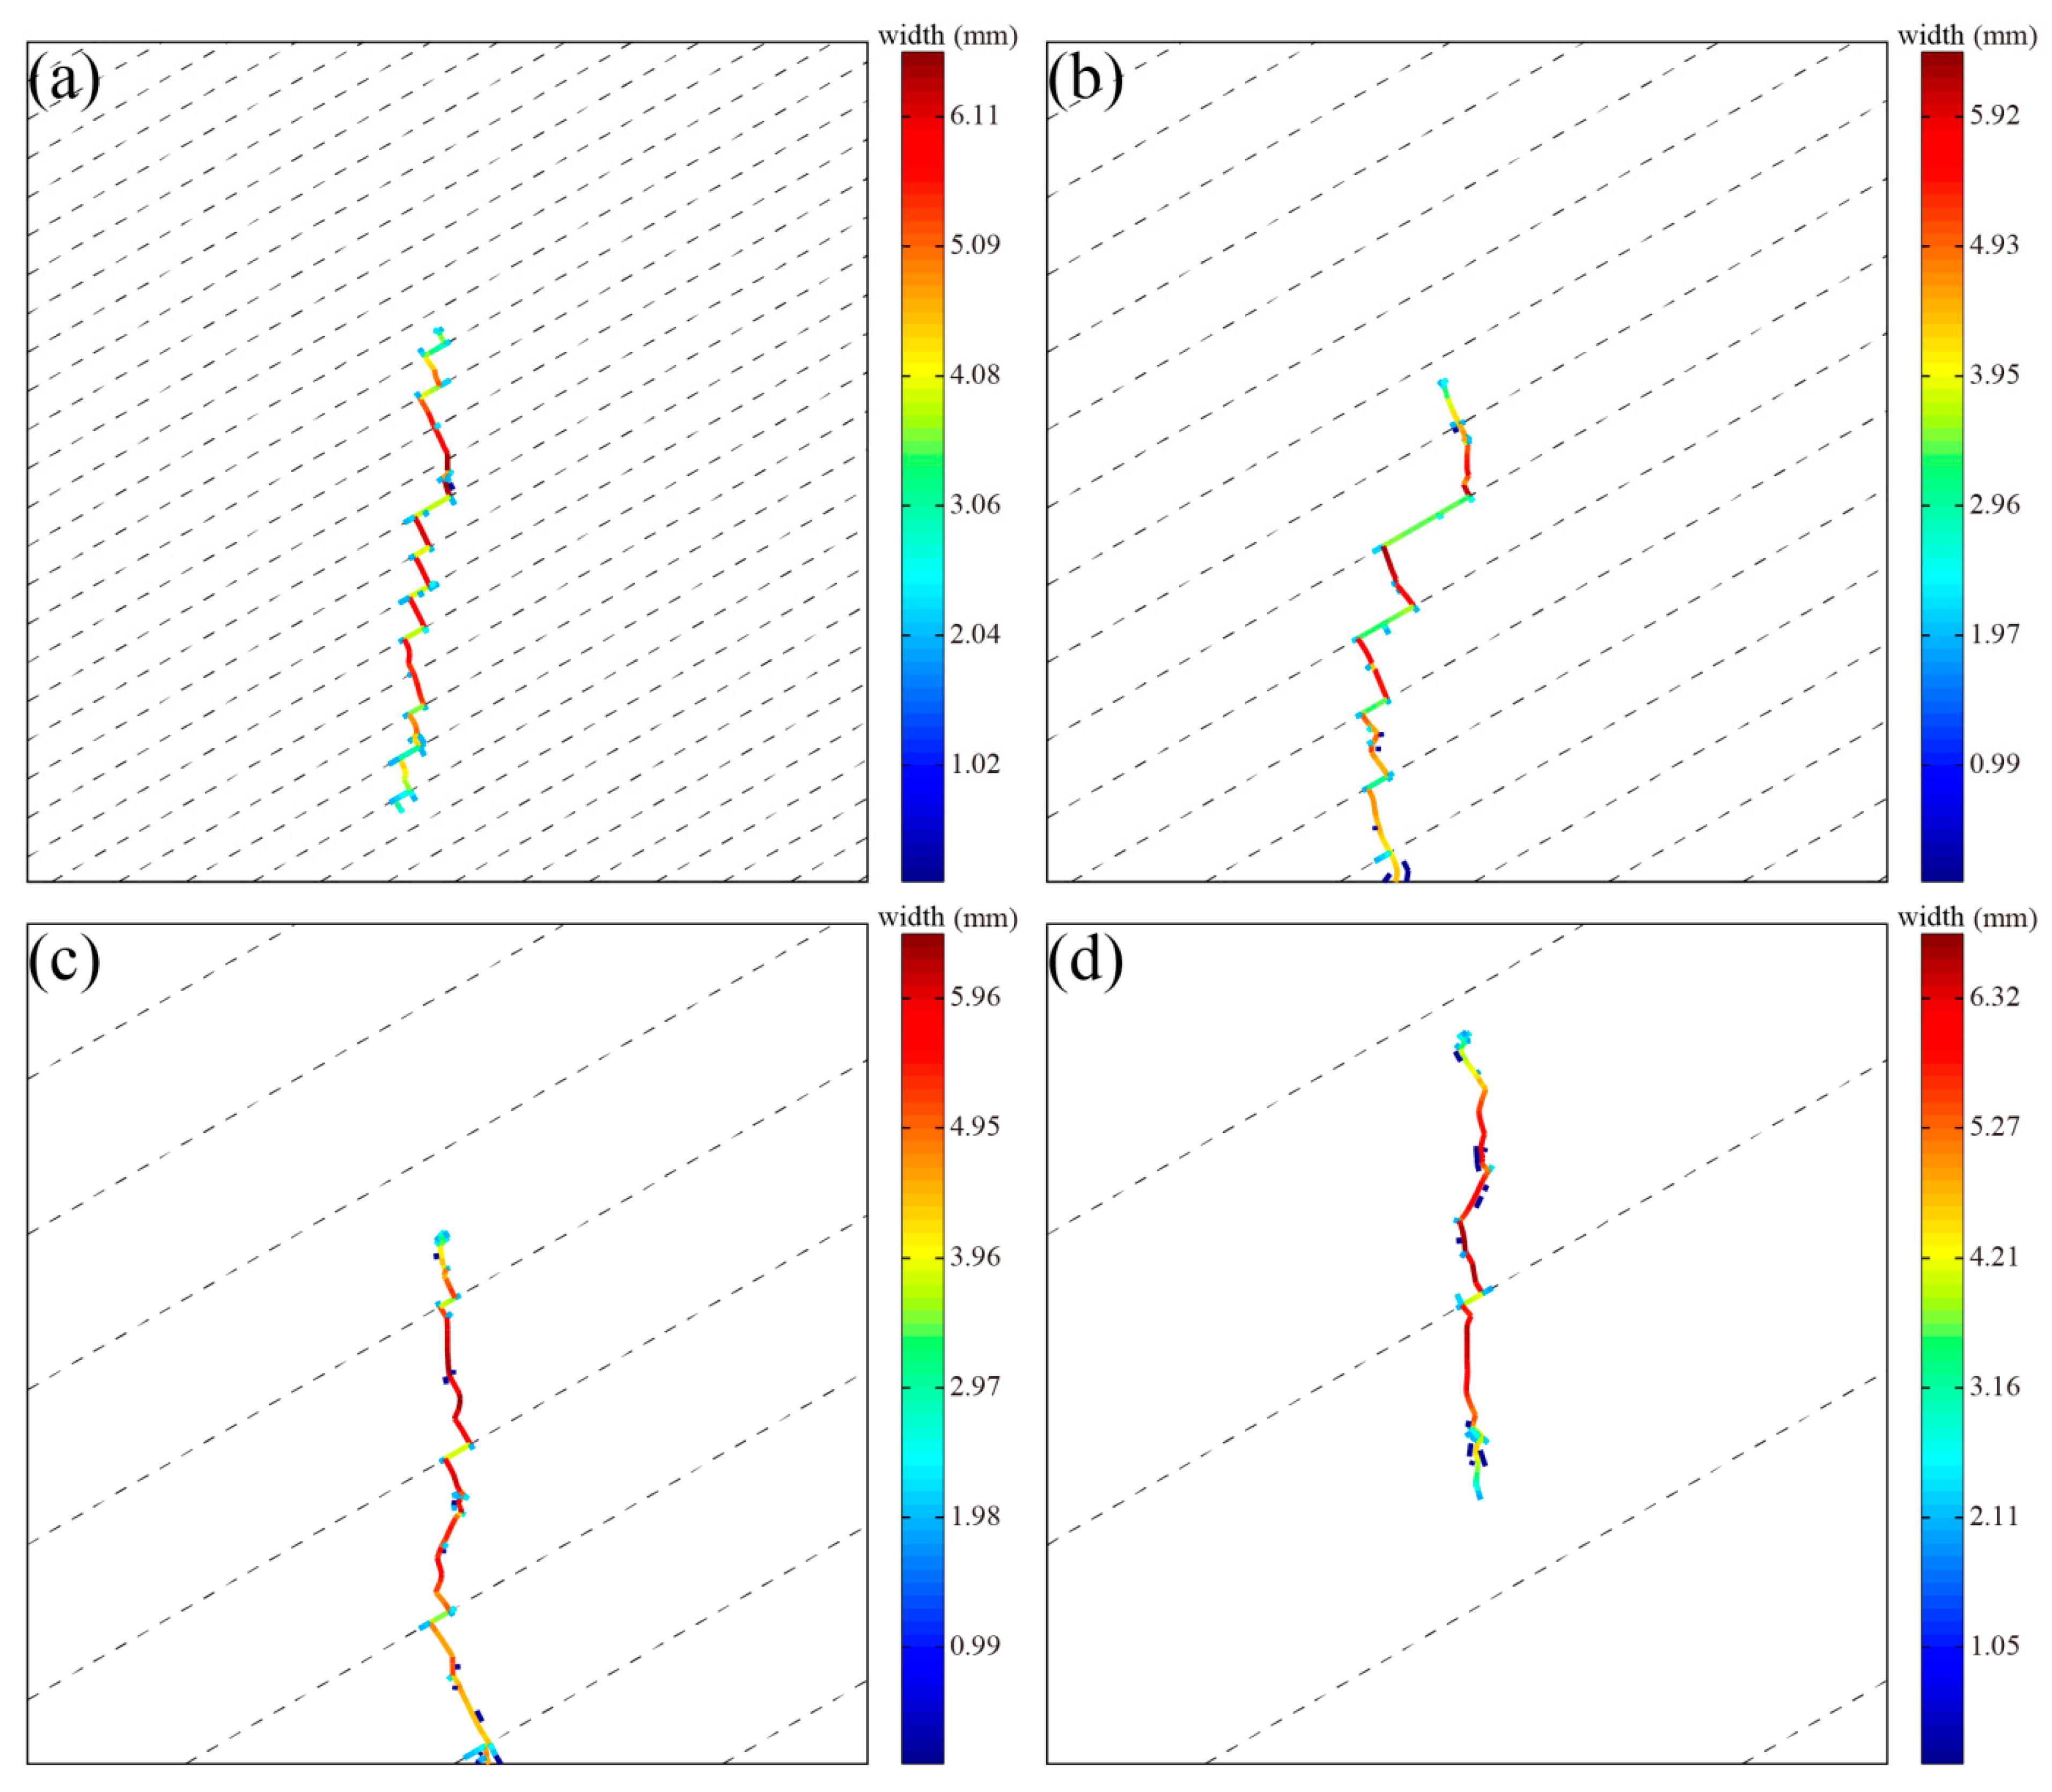
The entire fracturing process was mainly dominated by cross-layer fractures, which are tensile fractures with a large fracture width, whereas bedding slip fractures are shear fractures with a small fracture width. A tensile fracture with a large fracture width is more effective for proppant migration and filling, whereas a shear fracture with a small fracture width is more effective for maintenance of the HF width.
(3)
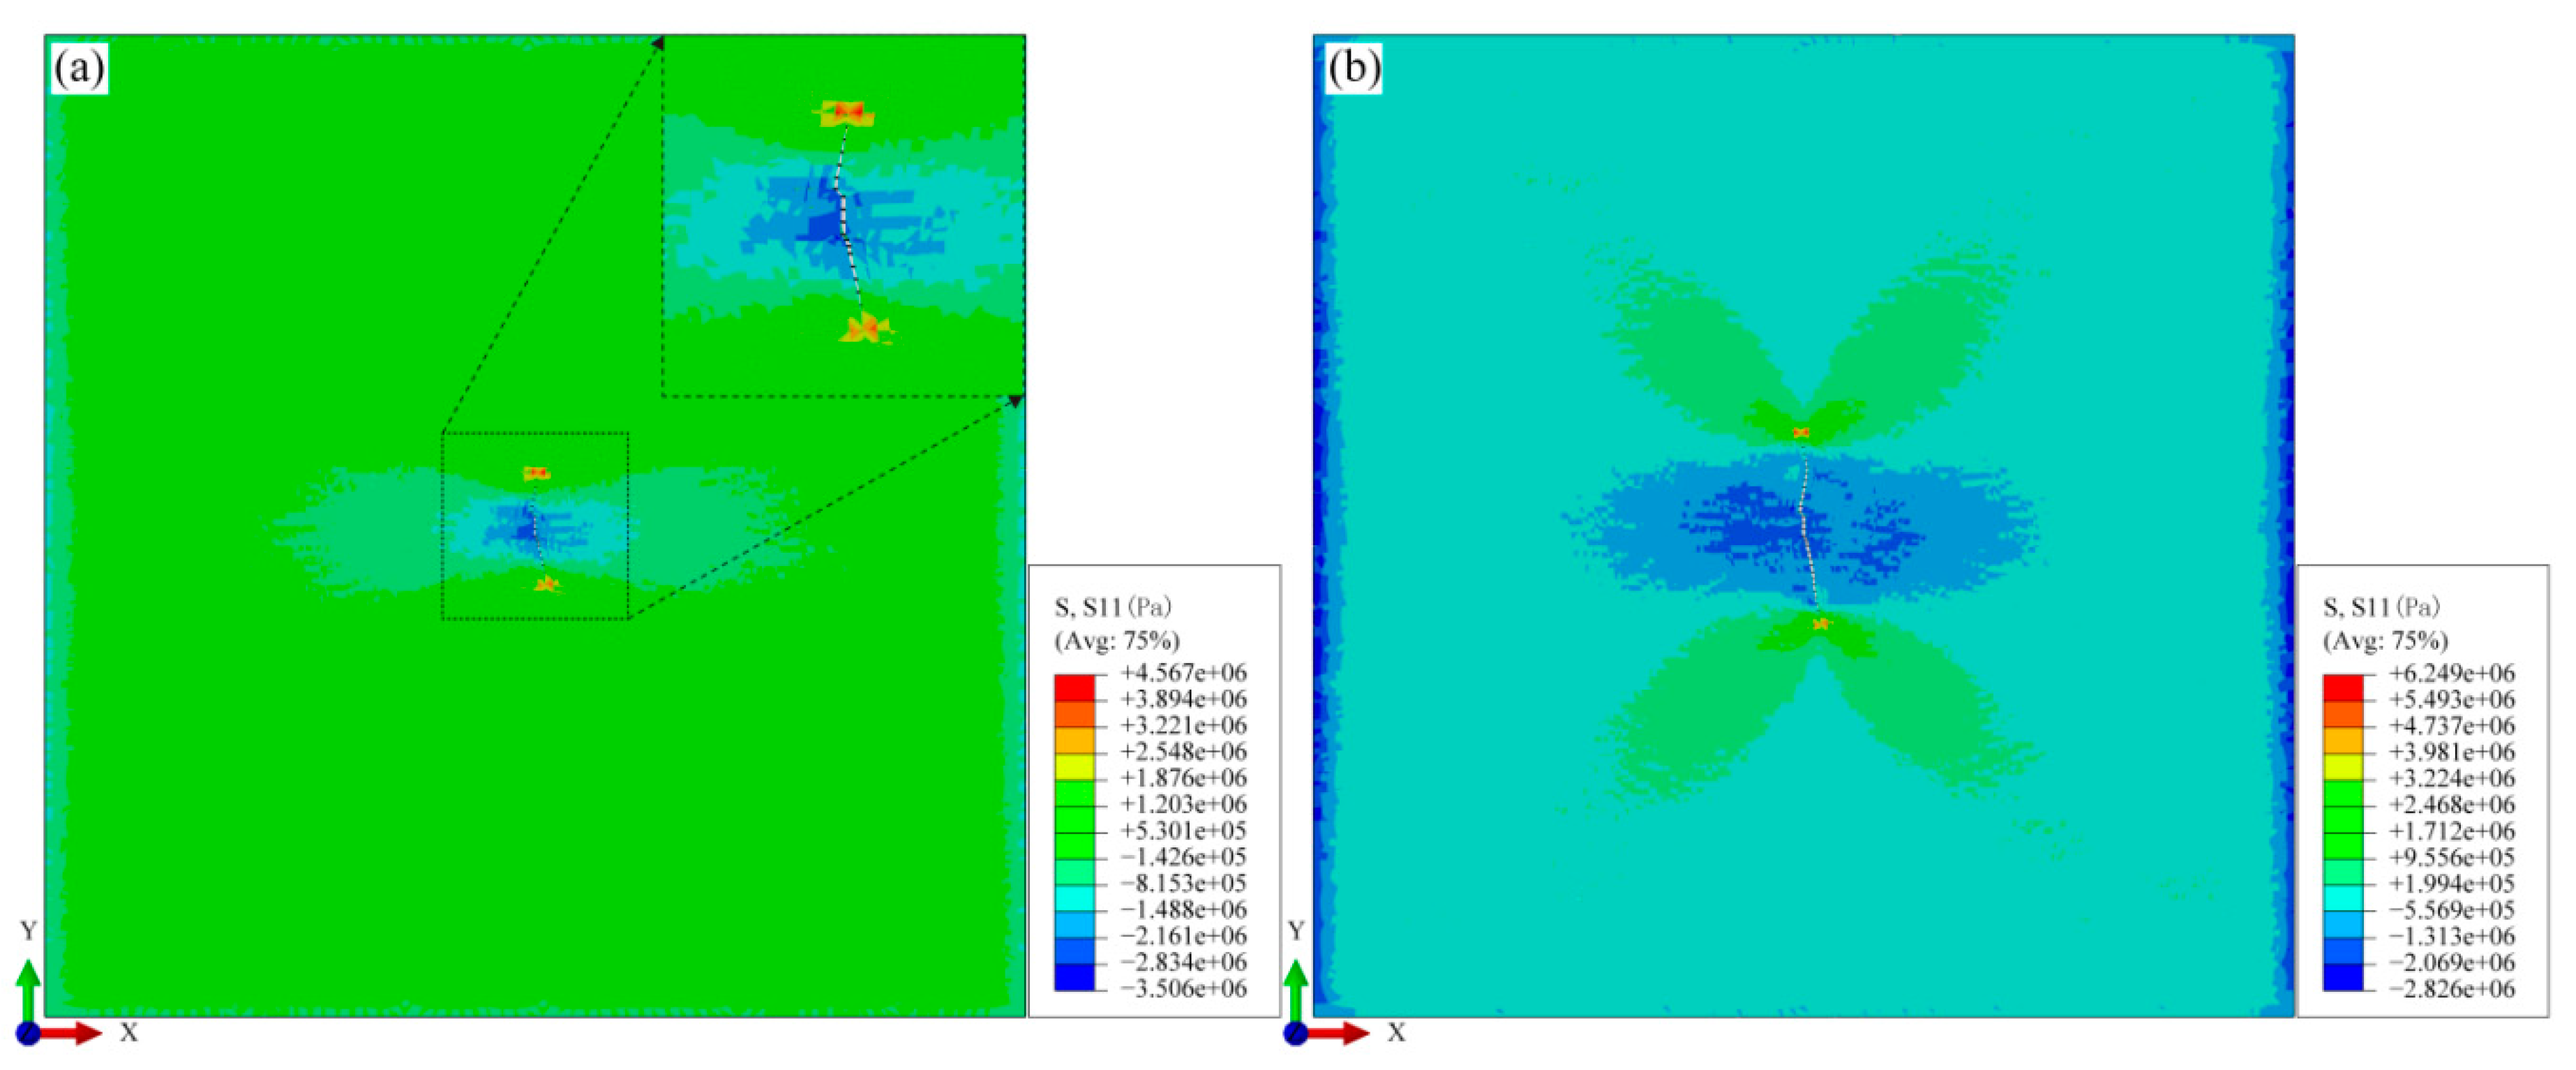
Mineral heterogeneity directly affected the stress-contour distribution and indirectly affected the fracture-propagation direction and stress–shadow effect. Therefore, mineral heterogeneity plays an important role in multi-cluster and multi-batch fracturing.
(4)
When combining the fracture path, fracture length, AE-fracture type, and fractal dimension, the best fracturing effect was obtained when the BP angle was 30° with moderate interlayer spacing.

Author Contributions

Conceptualization, Z.C.; Methodology, Z.Z.; Visualization, X.H.; Writing—original draft, W.H.; Writing—review & editing, W.H., Z.C., Z.Z. and X.H. All authors have read and agreed to the published version of the manuscript.

Funding

This work was supported by the China Postdoctoral Science Foundation (Grant No. 2022M712211), the National Natural Science Foundation of China (Grant No. 42141009, Grant No.41972296), the Second Tibetan Plateau Scientific Expedition and Research Program (STEP) (Grant No. 2019QZKK0904), the National Key Research and Development Project (Grant No. 2019YFC1509705).

Institutional Review Board Statement

Not applicable.

Informed Consent Statement

Not applicable.

Data Availability Statement

Not applicable.

Conflicts of Interest

The authors declare no conflict of interest.

Nomenclature

Kelement stiffness
heffelement geometric thickness
Vintegral space
Ssurface of the integral space
δεvirtual strain field
δvvirtual-velocity field of the rock node
Texternal surface force of the unit integral region
ρ w liquid density
gacceleration of gravity
Qinjection rate
kttangential permeability
∇ppressure gradient along the fracture surface
dopening displacement of the fracture element
μviscosity of the fracturing fluid
qvolume-flow rate
cfiltration coefficient
ppore pressure
Ddamage variable
δ m f effective displacement when a failure occurs
δ m 0 effective displacement of the damage initiation evolution
δ m max maximum effective displacement
T e f f 0 effective traction force
G C fracture energy
N ( δ ) number of grids containing cracks
δ edge lengths of the grids
Ainitial value of the image distribution

References

  1. Men, X.; Tang, C.a.; Wang, S.; Li, Y.; Yang, T.; Ma, T. Numerical simulation of hydraulic fracturing in heterogeneous rock: The effect of perforation angles and bedding plane on hydraulic fractures evolutions. In Proceedings of the SRM International Conference for Effective and Sustainable Hydraulic Fracturing, Brisbane, QLD, Australia, 20–22 May 2013. [Google Scholar]
  2. Daneshy, A.A. Hydraulic fracture propagation in layered formations. Soc. Pet. Eng. J. 1978, 18, 33–41. [Google Scholar] [CrossRef]
  3. Zhao, Y.; Zhang, Y.; Wang, C.; Liu, Q. Hydraulic fracturing characteristics and evaluation of fracturing effectiveness under different anisotropic angles and injection rates: An experimental investigation in absence of confining pressure. J. Nat. Gas Sci. Eng. 2022, 97, 104343. [Google Scholar] [CrossRef]
  4. Weng, X.; Chuprakov, D.; Kresse, O.; Prioul, R.; Wang, H. Hydraulic fracture-height containment by permeable weak bedding interfaces. Geophysics 2018, 83, MR137–MR152. [Google Scholar] [CrossRef]
  5. Li, J.; Zou, Y.; Shi, S.; Zhang, S.; Wang, J.; Ma, X.; Zhang, X. Experimental study on fracture propagation mechanism of shale oil reservoir of Lucaogou Formation in Jimusar. Geofluids 2022, 2022, 6598575. [Google Scholar] [CrossRef]
  6. Wu, S.; Ge, H.; Li, T.; Wang, X.; Li, N.; Zou, Y.; Gao, K. Characteristics of fractures stimulated by supercritical carbon dioxide fracturing in shale based on acoustic emission monitoring. Int. J. Rock Mech. Min. Sci. 2022, 152, 105065. [Google Scholar] [CrossRef]
  7. Huang, B.X.; Liu, J.W. Experimental Investigation of the Effect of Bedding Planes on Hydraulic Fracturing Under True Triaxial Stress. Rock Mech. Rock Eng. 2017, 50, 2627–2643. [Google Scholar] [CrossRef]
  8. Guo, Y.T.; Yang, C.H.; Wang, L.; Xu, F. Study on the Influence of Bedding Density on Hydraulic Fracturing in Shale. Arab. J. Sci. Eng. 2018, 43, 6493–6508. [Google Scholar] [CrossRef]
  9. Fu, W.; Savitski, A.A.; Damjanac, B.; Bunger, A.P. Three-dimensional lattice simulation of hydraulic fracture interaction with natural fractures. Comput. Geotech. 2019, 107, 214–234. [Google Scholar] [CrossRef]
  10. Zhang, F.; Dontsov, E.; Mack, M. Fully coupled simulation of a hydraulic fracture interacting with natural fractures with a hybrid discrete-continuum method. Int. J. Numer. Anal. Methods Geomech. 2017, 41, 1430–1452. [Google Scholar] [CrossRef]
  11. Zhou, J.; Zhang, L.; Braun, A.; Han, Z. Investigation of processes of interaction between hydraulic and natural fractures by PFC modeling comparing against laboratory experiments and analytical models. Energies 2017, 10, 1001. [Google Scholar] [CrossRef] [Green Version]
  12. Cui, Z.; Han, W. In situ scanning electron microscope (SEM) observations of damage and crack growth of shale. Microsc. Microanal. 2018, 24, 107–115. [Google Scholar] [CrossRef] [PubMed]
  13. Abell, B.; Xing, P.; Bunger, A.; Dontsov, E.; Suarez-Rivera, R. Laboratory Investigation of Leak-Off During Hydraulic Fracturing into Bedding Interfaces. In Proceedings of the SPE/AAPG/SEG Unconventional Resources Technology Conference, Denver, CO, USA, 22–24 July 2019. [Google Scholar]
  14. Xie, J.; Tang, J.; Yong, R.; Fan, Y.; Zuo, L.; Chen, X.; Li, Y. A 3-D hydraulic fracture propagation model applied for shale gas reservoirs with multiple bedding planes. Eng. Fract. Mech. 2020, 228, 106872. [Google Scholar] [CrossRef]
  15. Zou, Y.; Ma, X.; Zhang, S.; Zhou, T.; Li, H. Numerical investigation into the influence of bedding plane on hydraulic fracture network propagation in shale formations. Rock Mech. Rock Eng. 2016, 49, 3597–3614. [Google Scholar]
  16. Tang, J.; Wu, K.; Li, Y.; Hu, X.; Liu, Q.; Ehlig-Economides, C. Numerical investigation of the interactions between hydraulic fracture and bedding planes with non-orthogonal approach angle. Eng. Fract. Mech. 2018, 200, 1–16. [Google Scholar] [CrossRef]
  17. Li, Y.; Hu, W.; Zhang, Z.; Zhang, Z.; Shang, Y.; Han, L.; Wei, S. Numerical simulation of hydraulic fracturing process in a naturally fractured reservoir based on a discrete fracture network model. J. Struct. Geol. 2021, 147, 104331. [Google Scholar] [CrossRef]
  18. Gong, T.; Xia, B.; Liu, L.; Peng, Z.; Gao, Y. Propagation of hydraulic fracture under the joint impact of bedding planes and natural fractures in shale reservoirs. Energy Sci. Eng. 2019, 7, 2690–2702. [Google Scholar] [CrossRef]
  19. Sun, C.; Zheng, H.; Liu, W.D.; Lu, W. Numerical simulation analysis of vertical propagation of hydraulic fracture in bedding plane. Eng. Fract. Mech. 2020, 232, 107056. [Google Scholar] [CrossRef]
  20. Zeng, Q.; Yao, J. Numerical simulation of fracture network generation in naturally fractured reservoirs. J. Nat. Gas Sci. Eng. 2016, 30, 430–443. [Google Scholar] [CrossRef]
  21. Nagel, N.B.; Sanchez-Nagel, M.A.; Zhang, F.; Garcia, X.; Lee, B. Coupled Numerical Evaluations of the Geomechanical Interactions Between a Hydraulic Fracture Stimulation and a Natural Fracture System in Shale Formations. Rock Mech. Rock Eng. 2013, 46, 581–609. [Google Scholar] [CrossRef]
  22. Dugdale, D.S. Yielding of steel sheets containing slits. J. Mech. Phys. Solids 1960, 8, 100–104. [Google Scholar] [CrossRef]
  23. Barenblatt, G.I. The mathematical theory of equilibrium cracks in brittle fracture. Adv. Appl. Mech. 1962, 7, 55–129. [Google Scholar]
  24. Han, W.; Cui, Z.; Zhang, J. Fracture path interaction of two adjacent perforations subjected to different injection rate increments. Comput. Geotech. 2020, 122, 103500. [Google Scholar] [CrossRef]
  25. Camanho, P.P.; Dávila, C.G. Mixed-Mode Decohesion Finite Elements for the Simulation of Delamination in Composite Materials; Langley Research Center: Hampton, VA, USA, 2002.
  26. He, M.C.; Miao, J.L.; Feng, J.L. Rock burst process of limestone and its acoustic emission characteristics under true-triaxial unloading conditions. Int. J. Rock Mech. Min. Sci. 2010, 47, 286–298. [Google Scholar] [CrossRef]
  27. Han, W.; Cui, Z.; Tang, T.; Zhang, J.; Wang, Y. Effects of different bedding plane strength on crack propagation process un-der three points bending. J. China Coal Soc. 2019, 44, 3022–3030. (In Chinese) [Google Scholar]
  28. Cui, Z.; Qi, S.; Han, W. The role of weak bedding planes in the cross-layer crack growth paths of layered rocks. Geomech. Geophys. Geo-Energy Geo-Resour. 2022, 8, 22. [Google Scholar] [CrossRef]
  29. Han, W.; Cui, Z.; Zhu, Z. The Effect of Perforation Spacing on the Variation of Stress Shadow. Energies 2021, 14, 4040. [Google Scholar] [CrossRef]
  30. Li, J.; Du, Q.; Sun, C. An improved box-counting method for image fractal dimension estimation. Pattern Recognit. 2009, 42, 2460–2469. [Google Scholar] [CrossRef]
Figure 1. Schematic diagram of a cohesive element with 0 thickness embedded between solid elements.
Energies 15 06052 g001
Figure 2. Schematic diagram of fluid flow in a fracture. The crack is presented using a cohesive cracking model, where fluid flows within a cohesive element.
Energies 15 06052 g002
Figure 3. Filtration of fracturing fluid in a permeable layer.
Energies 15 06052 g003
Figure 4. Numerical model of mineral heterogeneity. Different colors represent different minerals. The locations of individual minerals were determined randomly by the program. White represents cohesive elements in the BP, and black represents cohesive elements in the matrix. All cohesive elements had 0 thickness.
Energies 15 06052 g004
Figure 5. Fracture paths. Overall, the fracture paths extended along the direction of maximum principal stress. The larger the bedding angle, the stronger the effect of the BP and the stronger the ability to capture HFs.
Energies 15 06052 g005
Figure 6. AE-location map. Tensile fractures were the main fracture type during fracturing. Bedding slip fractures (a type of shear fracture) were the most obvious when the BP angle was 45°. The AE energy of crack tip was low.
Energies 15 06052 g006
Figure 7. Fracture lengths. The lengths of bedding slip fracture was directly influenced by the BP angle. The longer the bedding slip fracture, the greater the effect of bedding on HF. At 30°, the length of cross-layer fracture was close to that of the bedding slip fracture, and the BP exerted a favorable effect.
Energies 15 06052 g007
Figure 8. The numbers of AE events and tension: shear ratios. Regularity in the total number of AE events was not obvious. The number of tensile events decreased first and then increased, whereas opposite results were found in terms of the number of shear events. The tension: shear ratio was approximately symmetrically distributed across the seven angles.
Energies 15 06052 g008
Figure 9. Pore-water pressure and AE-energy. During different stages, the fractures showed different propagation modes, and the AE energy presented with different distribution characteristics. The AE energy of bedding slip fracture was concentrated. The energy of cross-layer fracture was dispersed.
Energies 15 06052 g009
Figure 10. FDs at different BP angles. The FD reached a maximum at 30°.
Energies 15 06052 g010
Figure 11. Fracture closure degree and AE location. In figure (a), different colors represent the fracture widths, which increased from blue to red. In figure (b), the fracture type is represented by color. Red points represent pure tensile fractures and purple points represent pure shear fractures.
Energies 15 06052 g011
Figure 12. Horizontal stress contours at different fracturing stages under the mineral-heterogeneity model. (a) is the initial stage of fracturing. (b) is the middle stage of fracturing. Minerals indirectly affected the fracture-propagation path by changing the stress distribution.
Energies 15 06052 g012
Figure 13. Fracture paths under different bedding spacing. The bedding spacing of (ad) are 2 m, 4 m, 8 m and 16 m, respectively The smaller the interlayer spacing, the more obvious the bedding effect, although the fracturing effect was better when the interlayer spacing was moderate.
Energies 15 06052 g013
Table 1. Mineral parameters [24].
Minerals (Shale)Elastic Modulus
(GPa)
Poisson’s RatioPercentage
(%)
Quartz400.249
Muscovite180.2717
Albite210.2411
Calcite270.236
Dolomite210.235
Microcline200.254
Kaolinite220.234
Pyrite350.224
Table 2. Basic reservoir and cohesive element parameters.
Simulation ParameterValue
Cohesive Elements in the BPCohesive Elements in the Matrix
Knn1517
Kss1517
Ktt1517
Tensile strength (MPa)36
Shear strength (MPa)612
Horizontal maximum principal stress13
Horizontal minimum principal stress7
Permeability coefficient (m/s)1−7
Filtration coefficient (m/[Pa × s])1−14
Fracturing fluid viscosity (Pa × S)0.001
Injection rate (m2/s)0.01
Publisher’s Note: MDPI stays neutral with regard to jurisdictional claims in published maps and institutional affiliations.

