Article

The Bacterial Disinfection of Water Using a Galloping Piezoelectric Wind Energy Harvester

by
Prakash Poudel
1,†,
Saurav Sharma
2,†,
Mohamed Nainar Mohamed Ansari
3,*,
Pushpendra Kumar
1,
Sobhy M. Ibrahim
4,
Rahul Vaish
1,*,
Rajeev Kumar
1 and
Paramanandam Thomas
5
1
School of Engineering, Indian Institute of Technology Mandi, Himachal Pradesh 175075, India
2
Faculty of Mechanical, Maritime and Materials Engineering, Delft University of Technology, Mekelweg 2, 2628 CD Delft, The Netherlands
3
Institute of Power Engineering, Universiti Tenaga Nasional, Selangor 43000, Malaysia
4
Department of Biochemistry, College of Science, King Saud University, Riyadh 11451, Saudi Arabia
5
Dielectric Materials Division, Central Power Research Institute, Bengaluru 560080, India
*
Authors to whom correspondence should be addressed.
These authors contributed equally to this work.
Energies 2022, 15(17), 6133; https://doi.org/10.3390/en15176133
Submission received: 25 November 2021 / Revised: 9 January 2022 / Accepted: 17 January 2022 / Published: 24 August 2022
(This article belongs to the Section B: Energy and Environment)

Abstract

:
In this study, a method for the bacterial disinfection of drinking water in the water storage systems based on the electric potential generated from a piezoelectric wind energy harvester is presented. First, an efficient galloping piezoelectric wind energy harvester is designed by adding curve- shaped attachments to the bluff body of the harvester. The simulated output voltage of the harvester is validated by performing different sets of experiments on an open environment. Later, the output voltage of the harvester is enhanced, using copper oxide nanowires (CuONWs) grown perpendicular to the surface of the center copper wire. The enhanced electric field is able to disinfect the bacterial water in a 25 min time period. The bacterial removal log efficiency of 2.33 is obtained with a supplied rms voltage of 0.1 V from the harvester. The findings of this study will help to provide alternate means to water treatment that are efficient, reliable, and also free from disinfection by-products.

1. Introduction

Pathogenic infections caused due to impure drinking water have become a major challenge for undeveloped as well as developing countries [1,2,3,4]. Nearly 1 million people die yearly around the globe from waterborne diseases because of a lack of proper sanitation facilities [5]. Highly efficient disinfection methods with low energy consumption are required to safeguard the life of people from diseases caused by pathogenic infections. Disinfection techniques in the centralized units may involve chlorination and ozonation for killing bacteria, in water treatment [6]. Chlorination is adopted as an important water disinfection technique because of its high efficiency, low cost and reliable performance. However, chlorination causes the occurrence of carcinogenic disinfection by-products that pose a high risk to human health [7,8,9]. This problem of the formation of by-products can be resolved by the use of non-chlorine-based water disinfection techniques. Membrane filtration [10,11] and UV disinfection [12,13] are the alternative disinfection methods, but are limited by high energy consumption, high cost and the inability to produce residual antimicrobial power. The energy consumed during the water treatment process with the membrane filtration technique is around 500–5000 JL−1, whereas the UV disinfection technique involves energy consumption of about 20–60 JL−1 [14].
There is a need for water treatment systems that offer low cost, high efficiency and less consumption of energy. Many studies have been performed on the water disinfection technique, which can be achieved by supplying a high strength electric field, both AC and DC, to the water [15,16,17]. Locally enhanced electric field treatment (LEEFT) is a phenomenon that implements the electroporation mechanism, in which the permeability of the bacterial cell membrane increases when exposed to a high electric field intensity [18,19,20]. When the supplied electric field reaches a high value, there occurs an irreversible damage to the cell membrane, causing cell death [21]. Implementing this phenomenon in the water disinfection process results in an efficient treatment, without the formation of disinfection by-products. The requirement of high strength electric field involves a high electrical voltage (>1 KV) that consumes high electrical energy with operational threats. The electrodes used in LEEFT can be modified with nanowires that can amplify the electric field intensity with many folds near the tips of nanowires [22,23,24]. Though a low voltage is supplied externally, there exists a strong electric field that is sufficient for the electroporation process. The energy consumed in this water treatment technique is very low, compared to other existing disinfection methods, such as conventional methods, UV disinfection and the membrane filtration method. Zhou et al. [25] performed the chemically free water disinfection analysis in pipes using the center electrode modified with copper oxide nanowires and provided a very high disinfection rate with the electric voltage of 1 V. The stability of a copper oxide nanowire was improved using a protective polydopamine (PDA) coating, as illustrated by Huo et al. [26]. The enhancement of the electrical field at the tips of the nanowires due to the lightening rod effect was described by Liu et al. [27]. Various methods of supplying the voltage for electric field enhancement at the tips of the nanowires have been employed for water disinfection techniques. The voltage in the range of few volts produced from the energy harvesting techniques can be suitable for killing bacteria present in the water. Energy harvesting techniques based on the piezoelectric effect, triboelectric nanogenerator and photoelectric effect are preferred as they have a high power density with a low frequency.
Kumar et al. [28] demonstrated the bacterial degradation using the piezo-photocatalysis approach and the beam vibration. Bacterial disinfection obtained using BaTiO3 ceramic at a low frequency (8 Hz) was able to produce the required external voltage within 30 min of exposure. A tribo pump with a low cost and self-driven water disinfection system was proposed by Ding et al. [29], in which the water consisting of bacteria is pumped to the tribo nanogenerator system, where disinfection occurs by the electric field produced in the system and the outlet is the water free from bacteria. Huo et al. [30] developed a localized electric field air disinfection method to destroy the outer membrane of the bacteria, driven by a triboelectric nanogenerator. The air disinfection system provides the high performance in terms of microbial inactivation in a very short time period.
The authors of this paper propose a water disinfection system, based on the direct piezoelectric effect that is produced by beam vibration driven by wind. The voltage produced is then supplied to the copper tube filled with bacteria-infected water. Nanowires grown on the central electrode enhance the electric field to a magnitude that is sufficient to disinfect the bacteria present in the water. This paper demonstrates the successful treatment of the infected water in a short period of time and the bacterial treatment process is efficient. The proposed method based on a piezoelectric wind energy harvester can be suitable for water treatment in the areas in which there is an unavailability of electrical power supply. This system is portable as it harvests electrical energy from wind that is required for bacterial disinfection. The electrical voltage produced by the galloping wind energy harvester is found to be a promising concept for the disinfection of water in the storage systems. This paper is organized as follows: in Section 2, an analytical modeling of the wind energy harvester based on a galloping phenomenon is discussed; the experimental studies of the bacterial disinfection procedure are also described in this section; Section 3 presents the simulation and experimental results of the galloping wind energy harvester, where the simulation of the enhanced electric field and results of bacterial disinfection are also presented; finally, Section 4 concludes the paper.

2. Materials and Methods

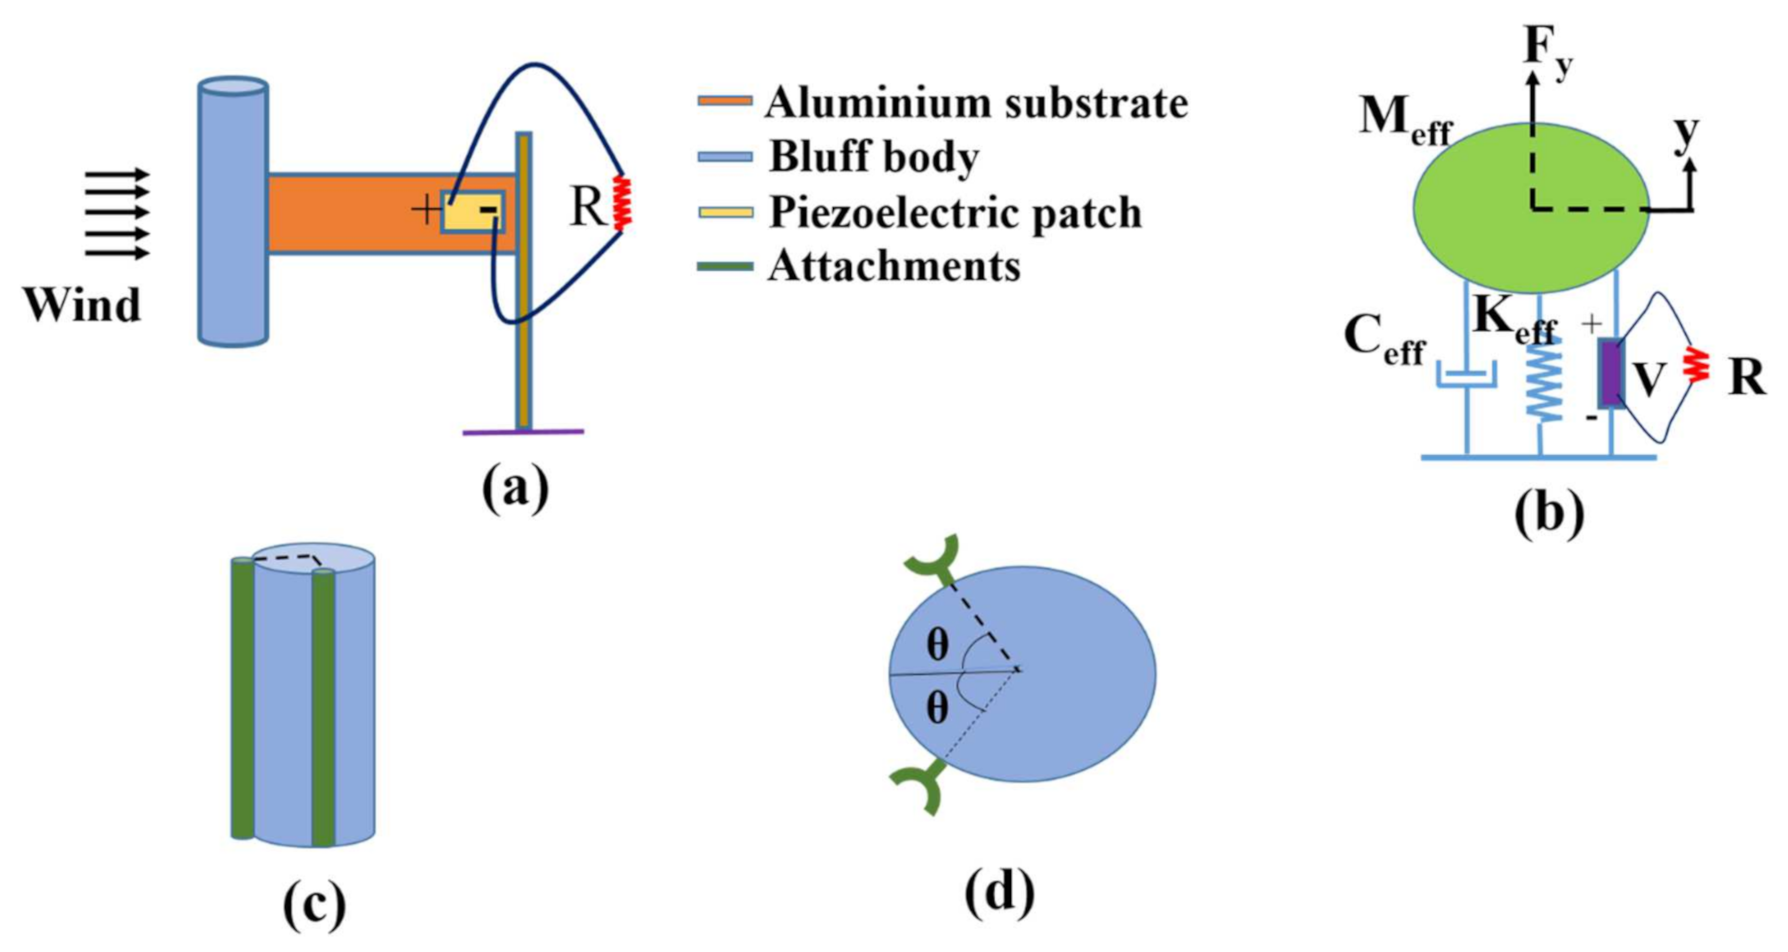
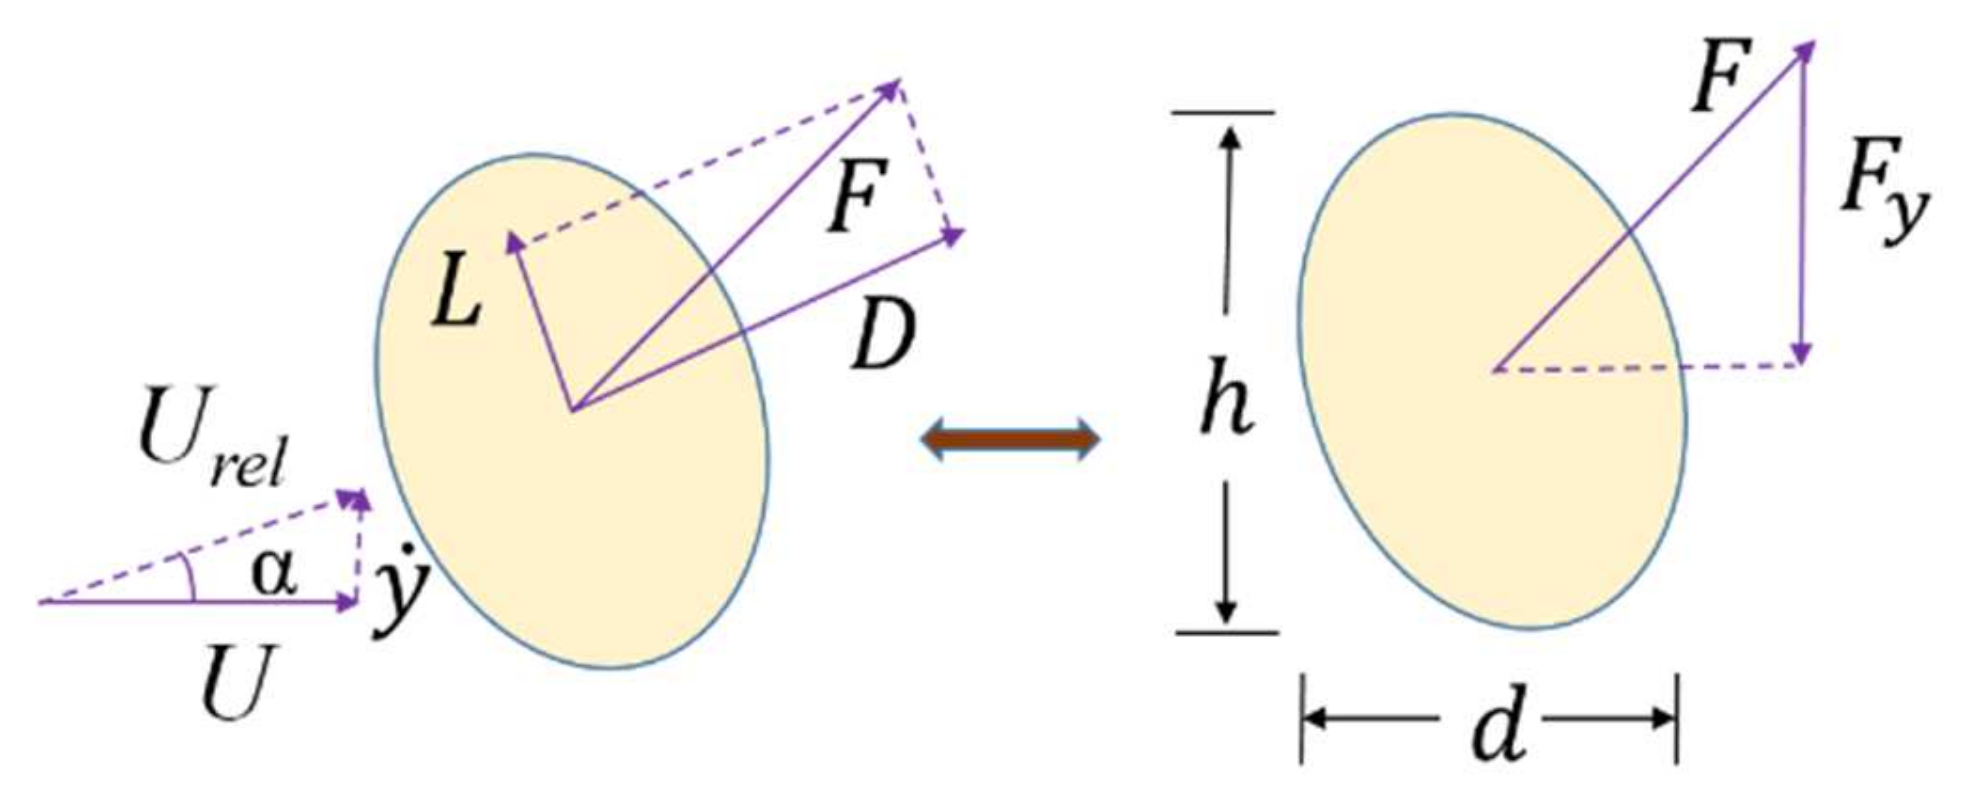
2.1. Analytical Modeling of the Galloping Piezoelectric Wind Energy Harvester

When the structures are subjected to wind flows, there arise large amplitude oscillations with low frequencies, termed as a galloping phenomenon. The piezoelectric wind energy harvester, based on a galloping mechanism, consists of an aluminum cantilever beam fixed at one end and a bluff body made of an expanded polystyrene (EPS) material with la ow density fixed at the other end, as shown in Figure 1a. The modifications on the shape of the bluff body by adding different shapes of attachments in order to achieve a better performance of the harvester have been proposed in recent years [31,32]. In our study, two attachments made of polylactic acid (PLA) material were attached to a bluff body at an angle of 120°, in order to provide a better galloping effect when the air flows through the bluff body of the harvester, as illustrated in Figure 1c. The top view of a bluff body with curve-shaped attachments on it is shown in Figure 1d.
The piezoelectric wind energy harvester system involves a fluid flow mechanism, structural deformation of the cantilever beam, as well as the piezoelectric effect. Therefore, it is suitable to model the system as a lumped parameter, which reduces the complexity of the system. A distributed parameter model of the harvester can be converted into a lumped parameter model by considering the Euler–Bernoulli beam theory, Kirchhoff’s law, piezoelectric effect and self-induced galloping vibration [33]. A single degree of freedom (sdof) model with equivalent mass, damping and stiffness is obtained from the structural diagram, as shown in Figure 1b. The governing equations based on the lumped parameter modeling can be written as,
M y ¨ t   +   C y ˙ t   +   K y t   +   θ c V t   = F y t
C p V ˙ t   +   1 R V t     θ c y t ˙ = 0
where the equivalent mass, M , can be obtained as M =   33 140 m 1 + m 2 + m 3 [34], with   m 1 , m 2 and m 3 being the mass of the piezoelectric beam, the mass of the bluff body and the mass of the two attachments fixed to the bluff body. The equivalent stiffness, K = w n 2 M , and the equivalent damping, C = 2 ξ w n M , are determined through static tests performed on the harvester. The natural frequency, w n , is calculated from the free decay test and the damping ratio, ξ , is obtained from the logarithmic decrement technique. The displacement, y t , of the bluff body in the y -direction is assumed to be perpendicular to the direction of the wind flow. The output voltage, V t , of the harvester is measured across the load resistance,   R . The open-circuit condition, I = V R = 0 , and the short circuit criteria, V = 0 , of the electrical system can be applied to Equations (1) and (2) to determine the electromechanical coupling coefficient as,
θ c = w o 2 w s 2 M C p
The open-circuit natural frequency, w o , and the short circuit natural frequency, w s , of the piezoelectric beam is calculated by performing experimental measurements. The capacitance of the piezoelectric patch, C p , is obtained from the manufacturer’s formula. The aerodynamic force,   F y t , that drives the oscillations of the cantilever beam is given as [35],
F y t   = 1 2 C F y ρ U 2 d h
where C F y denotes the coefficient of the aerodynamic force in the y-direction, and it depends on the shape of the bluff body. The frontal dimensions, d and h , are the diameter and height of the bluff body, respectively. Here, U represents the speed of the wind, and ρ is the density of the air. Figure 2 demonstrates the resultant force acting on the bluff body with shapes (other than circular cross-section) that is required to create galloping.
The mechanism of galloping can be explained by assuming a quasi-static hypothesis, which considers the aerodynamic force acting on the oscillating bluff body to be equivalent to the force acting on a steady body at an equivalent angle of attack. The angle of attack, α , is defined as,
α = tan 1 y ˙ t U
The aerodynamic force coefficient, C F y , is an important parameter that describes the force acting on a bluff body. C F y can be expressed in a cubic polynomial form, as defined by Parkinson [36]:
C F y =   a 1 y ˙ t U + a 3 y ˙ t U 3 .
The empirical coefficients, a 1 and a 3 , are determined by the polynomial fitting of C F y vs. α curve. The plot of C F y vs. α curve is obtained experimentally using different angles of attack in the static tests. The rotational effect of the bluff body can be introduced to modify the expression of C F y as,
C F y =   a 1 y ˙ t U   +   y t   +   a 3 y ˙ t U + y t 3 .
Here, y t   = β y t , where β is the coefficient between the transverse displacement, and the rotation at the free end of the cantilever beam and is given as β = 1.5 l .
By performing the linear analysis of the electromechanical coupling equations, the solution of the model can be achieved. For this, define a state vector X as
X =   x 1 x 2 x 3   =   y t y ˙ t V t .
The final governing equations of the galloping piezoelectric energy harvester is written in matrix form as
X ˙ =   y ˙ t C K y ˙ t θ c C p y ˙ t V t R C p K M y t θ c M V t   + ρ U 2 d h 2 M a 1 y ˙ t U + β y t   +   a 3 y ˙ t U   +   β y t 3 .
Equation (9) is solved using MATLAB Simulink, and the vibration response of the beam along with the output voltage with different load resistances is calculated.

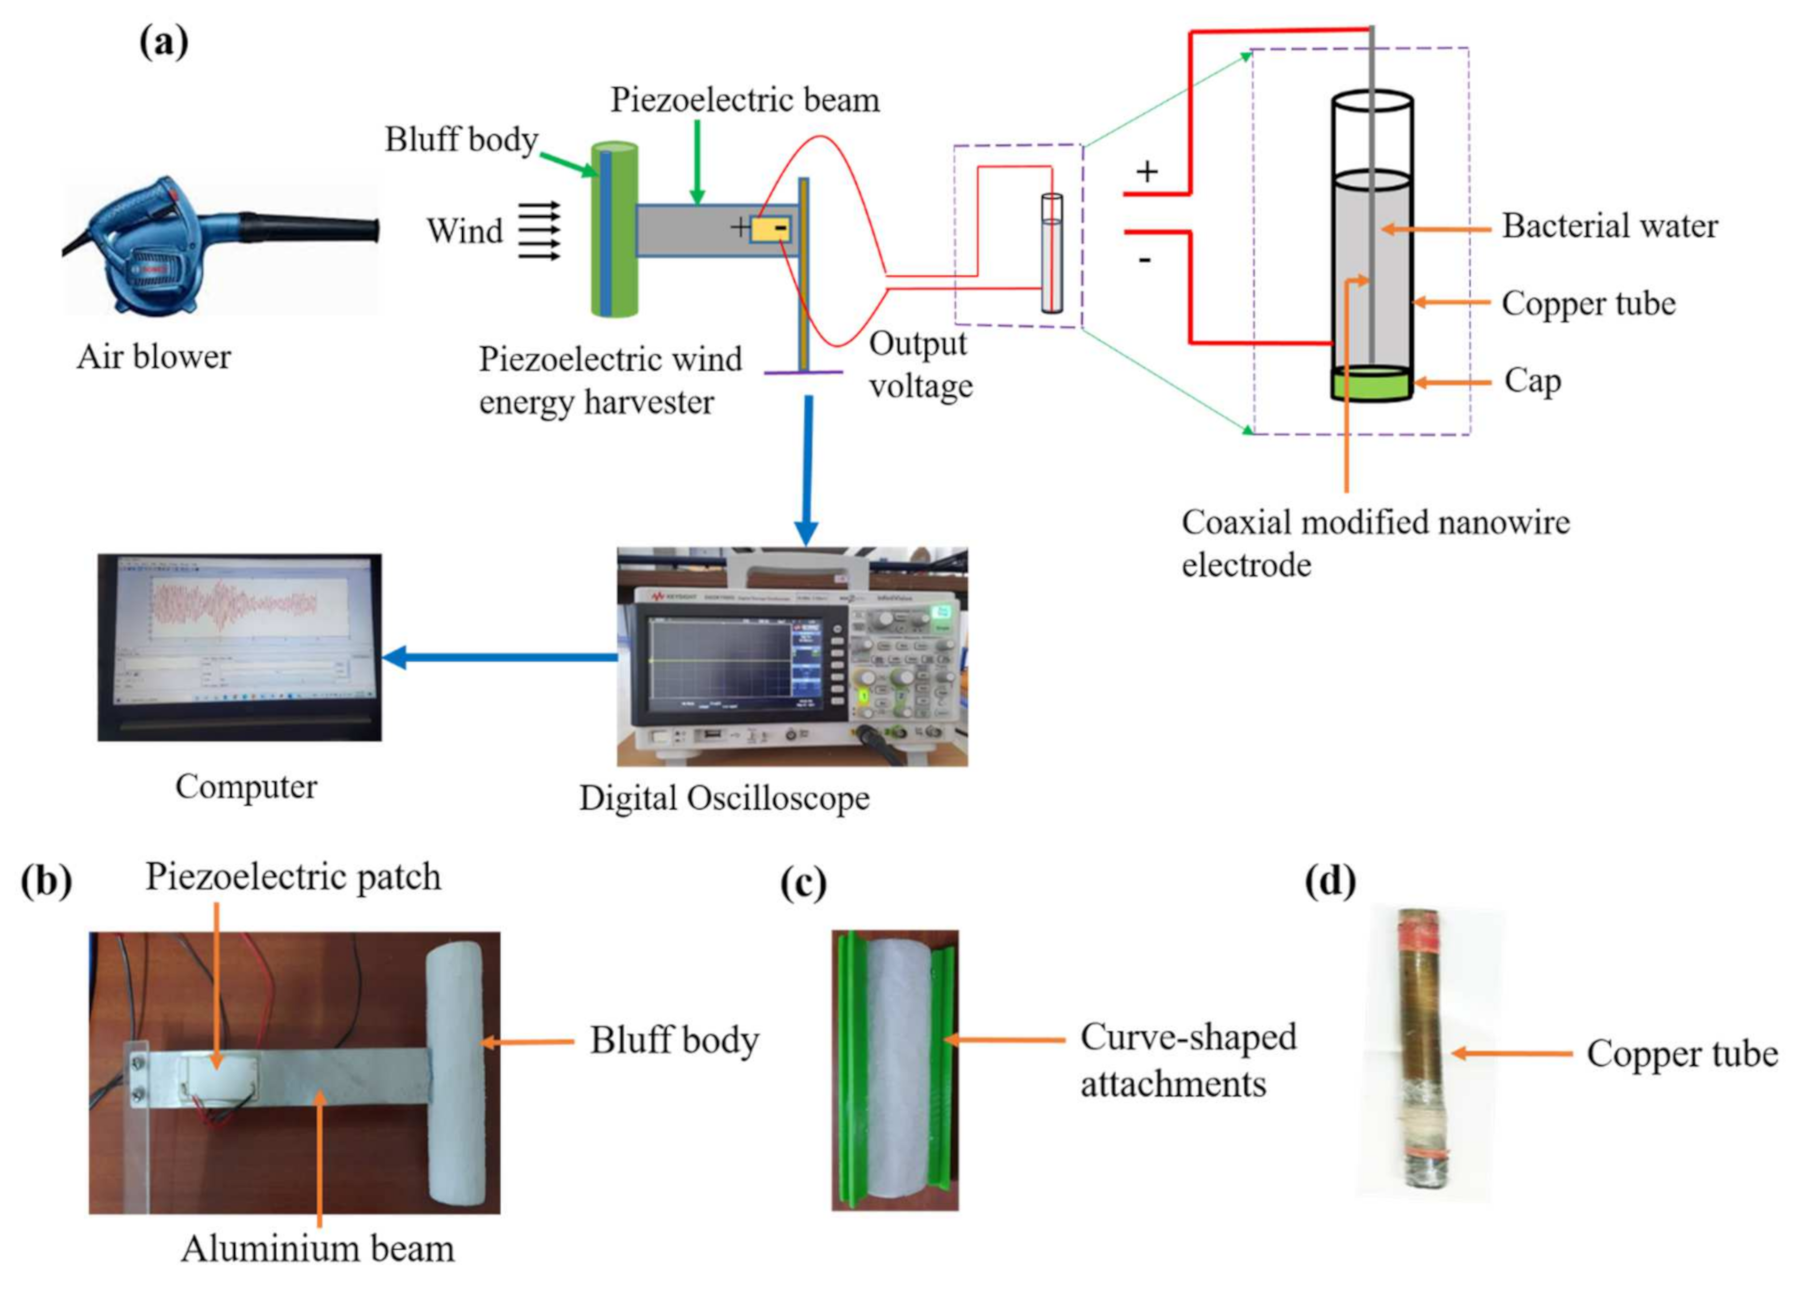
2.2. Experimental Setup and Bacterial Disinfection

The experimental analysis in this study was performed in two phases. In the first phase, various experiments were conducted in order to produce the electric voltage by flowing the air through the bluff body in an open environment. The wind required to drive the harvester was supplied using an air blower and a digital anemometer was used to measure the wind speed. The required speed was maintained by making proper adjustments to a blower and the energy harvester. A commercially purchased piezoelectric patch, PZT-5A (SP-5A, India), with the dimensions of 50 × 20 × 0.4 mm3 was placed at one end of an aluminum beam, with the dimensions of 200 × 25× 0.6 mm3. The piezoelectric patch was attached onto the beam using a strong epoxy adhesive. The piezoelectric energy harvester was operated in d31 working mode and the piezoelectric coefficient of the patch was −190 Coul/N × 10−12. A circular bluff body with a height of 120 mm and 32 mm diameter was attached at the other end of the beam, and the curve-shaped attachments required were 3D printed. The length of the attachments was made equal to the height of the bluff body with frontal dimension of 5 mm. Air was supplied to the harvester at different speeds, and comparisons were made to obtain an optimum value of the electrical voltage. The output voltage across the electric load resistance of the harvester was measured using a digital oscilloscope (InfiniiVision DSO-X 3034A), with an input impendence of 1 MΩ.
After the successful generation of the output voltage from the piezoelectric wind energy harvester, the second phase of the experiment was performed, which involved the disinfection of the bacteria present in the water. The experimental setup of the piezoelectric wind energy harvester based on galloping and its application on the degradation of bacteria is shown in Figure 3a. Figure 3b shows the optical image of a piezoelectric harvester involved in the study. Similarly, the optical image of a bluff body with curve-shaped attachments is shown in Figure 3c.
The electrical voltage produced from the harvester was supplied to the water consisting of Escherichia coli (E. coli) bacteria on the copper tube, as illustrated in Figure 3a. As the AC electrical voltage generated was not enough to disinfect the bacteria, the concept of center copper oxide modified nanowires was applied, which enhanced the electrical field by several times at the tips of the nanowires, which was adequate to disinfect the bacteria. The tube that contained the bacterial water was made up of copper, with a diameter of 94 mm and length of 300 mm, and was closed from one side, as shown in Figure 3d. A fine copper wire (coaxial electrode) with a diameter of 0.35 mm was heated at around 400 °C for 2 h, followed by the cooling down to a room temperature in an open atmosphere in order to produce the copper oxide modified nanowires (CuONWs). It was observed that the nanowires grew perpendicular to the surface of the copper wire. A two dimensional model of the copper tube with a center copper electrode modified with nanowires was developed to illustrate the electric field around the tip of the nanowire. An electrostatic model was used, which is defined as:
E = V ,
where E is the electric field developed and V is the electric potential. E. coli bacteria required for the disinfection analysis was cultured in broth at 37 °C and 200 rpm for 12–18 h. The cultured bacteria solution was then diluted with autoclaved (20 PSI, 15 min) distilled water to a dilution factor of 1/10. The concentration of the E. coli bacteria after dilution was 2 × 10⁷, 3 × 10⁷ and 5 × 10⁷ colony forming units per mL (CFU/mL) for the triplet experiments. A total of 20 mL of diluted bacteria solution was filled in a disinfection device. Coaxial electrodes and copper tubes were connected to the output voltage field of the harvester. Air was supplied from the air blower at a speed of 4 m/s and the oscillating behavior of the bluff body was observed. After every 5 min of the test, 100 µmL of the bacterial sample was removed from the tube and spread on the agar plate. It was stored at 37 °C temperature for 12 h for the final count. Three complete disinfection experiments were performed to observe the repeatability of the study. The CFU’s were counted for every test sample, and the log inactivation efficiency was calculated using Equation (11):
L o g   i n a c t i v a t i o n   e f f i c e i e n c y = l o g 10 C e f f C i n
where C e f f and C i n are the concentrations of the effluent and influent, respectively.

3. Results and Discussion

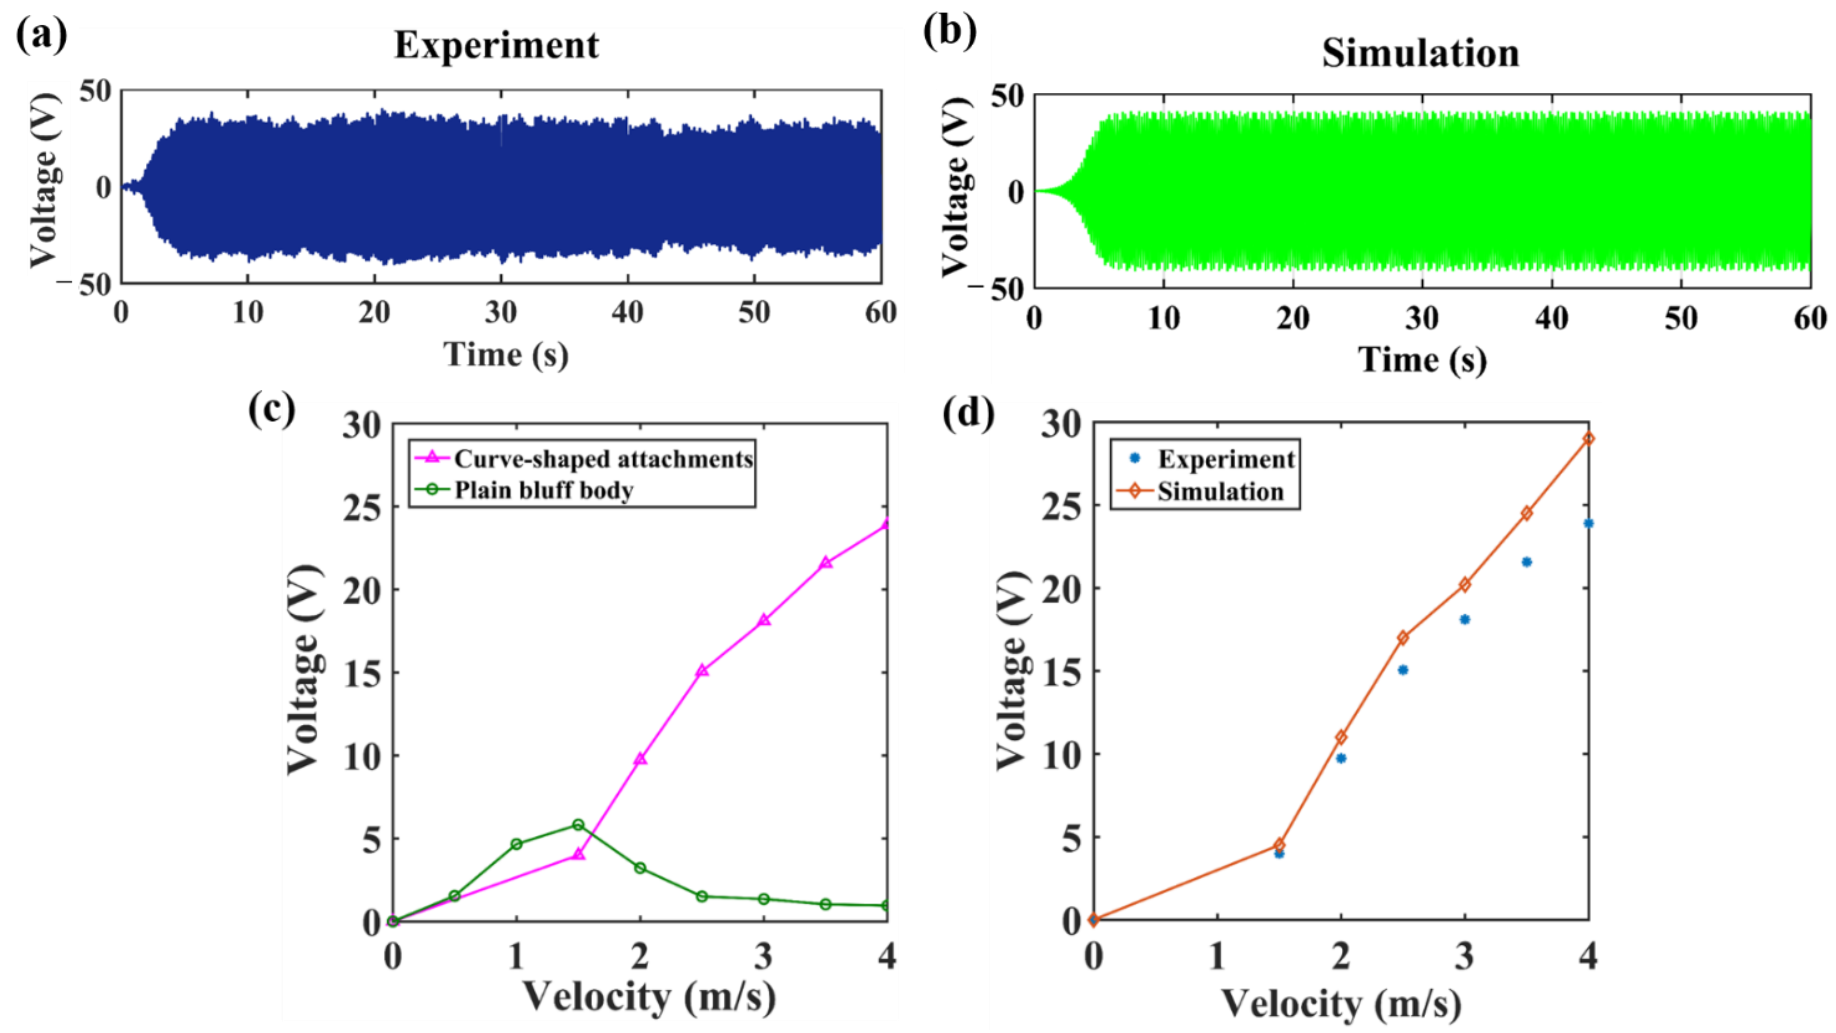
3.1. Simulation and Experimental Results of the Piezoelectric Wind Energy Harvester

A two-dimensional model was developed for performing the CFD simulation of the bluff body with curve-shaped attachments. The standard k-ε turbulence model was used for simulation in order to obtain better computational accuracy with great stability. The computational domain considered was 100 mm long and 80 mm wide. Figure 4 shows the pressure and velocity field developed on the vicinity of the bluff body, when air flows through the body at a speed of 4 m/s. The direction of the air flow is supposed to be perpendicular to the inlet boundary. At the outlet boundary, the pressure was set as zero and the top and bottom boundaries were considered to be fixed.
The pressure difference existing between the upstream and the downstream sides of the bluff body reveals that a lift force exists on the bluff body, which eventually creates the transverse force component required for the galloping mechanism, as observed in Figure 4a. The pressure difference ranging from 60 Pa, just ahead of the bluff body, to −40 Pa, at the vicinity of the curve-shaped attachments, presents a large magnitude force component, which eventually produces the required electric voltage for disinfection. There is a variation of velocity with a maximum value at the upper and lower side of the bluff body and minimum value just behind the bluff body, which signifies the occurrence of vibrations on the bluff body, as shown in Figure 4b. It is important to simulate the bluff body to observe the disturbance produced in the air flow. The parameters of the piezoelectric wind energy harvester that are obtained from the experiments and the formulations described in Section 2.1 are presented in Table 1.
Furthermore, the experimental electrical output voltage measured at different wind speeds is compared with the electrical voltage obtained from the simulation. The experimental output voltage of the harvester with curve-shaped attachments is found to be about 25 V, and the simulated output voltage is about 29 V, when the speed of the wind is kept as 4 m/s, as shown in Figure 5a,b. The modeling of the harvester is based on the lumped parameter model and the quasi-steady hypothesis is assumed in the derivation of the transverse force component with a small angle of attack. These assumptions are responsible for the difference in the simulated and experimental output values. It requires some period of seconds for the harvesters to a produce stable output voltage for both the simulation and experiment, as observed in Figure 5.
The voltage output of the energy harvester without a curve-shaped attachment is low, compared to the output with curve-shaped attachments, as shown in Figure 5c. The maximum voltage obtained with the harvester without any attachments is around 6 V at a wind speed of 1.5 m/s. For the harvester without any attachments, it follows the vortex-induced vibration phenomena, due to the circular cross-section of the bluff body. Figure 5d compares the simulation and experimental electrical voltage produced by the harvester at different wind speeds. It is can be observed that for the galloping phenomenon, the electrical voltage is increased when we increase the wind speed. Since the harvester, when operating at 4 m/s, produced the maximum voltage in our study, we used this speed for the disinfection of bacteria. The comparison of the output voltage of several typical piezoelectric wind energy harvesters based on the galloping phenomenon is listed in Table 2. It can be observed that by using the curve-shaped attachment, an RMS open circuit voltage of 25 V can be generated, which is not possible with other shapes.

3.2. Electric Field Enhancement

When the output of the galloping piezoelectric wind energy harvester was connected with the center coaxial electrode and copper tube, the voltage supplied to the bacterial water decreased. This was because the bacterial water offered some resistance as the electric potential was supplied. The resistance offered by the bacterial water, which is the mixture of deionized water and E. coli bacteria, is around 85 KΩ and the voltage measured across this resistance is 0.1 V, which can be seen in Figure 6a. Similarly, the electric current measured during the disinfection experiment is around 0.8 μA, as shown in Figure 6b.
As a high electric field in the range of (1 to 10 KV/cm) [40] is required for the degradation of bacteria, there is a need to enhance the electric field by the use of electrodes with modified nanowires. The modification of the fine copper wires was achieved by an oxidation process in which oxygen was combined with copper and deposited on the surface of the wire. Figure 7a shows the X-ray diffraction (XRD) image of the coaxial center copper electrode and the data was matched with the JCPDS database. Visualizing the image, we can clarify that CuO (01-089-2529) is present with the (200), (210) and (222) planes, Cu2O (01-078-2076) is present with the (111), (200) and (211) planes and Cu (03-065-9743) is also present with the (211), (220) and (400) planes.
Scanning the electron microscopy (SEM) image of the coaxial Cu wire, as shown in Figure 7b, reveals that the nanowires with a 2–2.5 µm length and a 65–80 nm diameter that are perpendicular to the surface are grown. When the coaxial Cu wire was heated, Cu+ was generated, which reacted with the O2 present in the atmosphere and generated Cu2O. Later, Cu2O was converted to CuO. The generation of Cu2O was in the form of a thin layer, whereas CuO nanowires were grown. According to Wagner’s theory [41], at low temperatures (~0.3–0.5 melting point), a metal is oxidized through the short-circuit diffusion (diffusion along the sub-boundaries, dislocations) of atoms or ions during the reaction in the Cu2O layer. The melting temperature of Cu, Cu2O and CuO are 1083, 1235 and 1446 °C, respectively. At 400 °C, short-circuit diffusion (diffusion along dislocations) is dominated by CuO, and CuONWs generation is achieved [42]. Due to the domination of CuO, which propagates in the form of a wire-like structure, nanowires are generated, which can be verified by the SEM images.
To observe the effect of the copper oxide modified nanowires on the electric field enhancement, a two-dimensional simulation of the disinfection device was performed. In Figure 8, the outer circle represents the circumferential outline of the copper tube consisting of bacterial water. The inner circle represents the coaxial copper wire modified with the nanowire. For the sake of simplicity, we considered a single nanowire to perform the simulation analysis. The output electric potential obtained from the piezoelectric wind energy harvester was connected to the center coaxial copper wire as well as to the outer copper tube. An electric potential of 0.1 V was supplied for the enhancement purpose. It can be observed that there is a high strength electric field produced at the tip of the nanowire. The electric field as high as 14,000 V/m is generated by the use of a nanowire, as illustrated in Figure 8. Several other nanowires were generated on the surface of the copper wire, which can produce enough electric field for bacterial degradation.

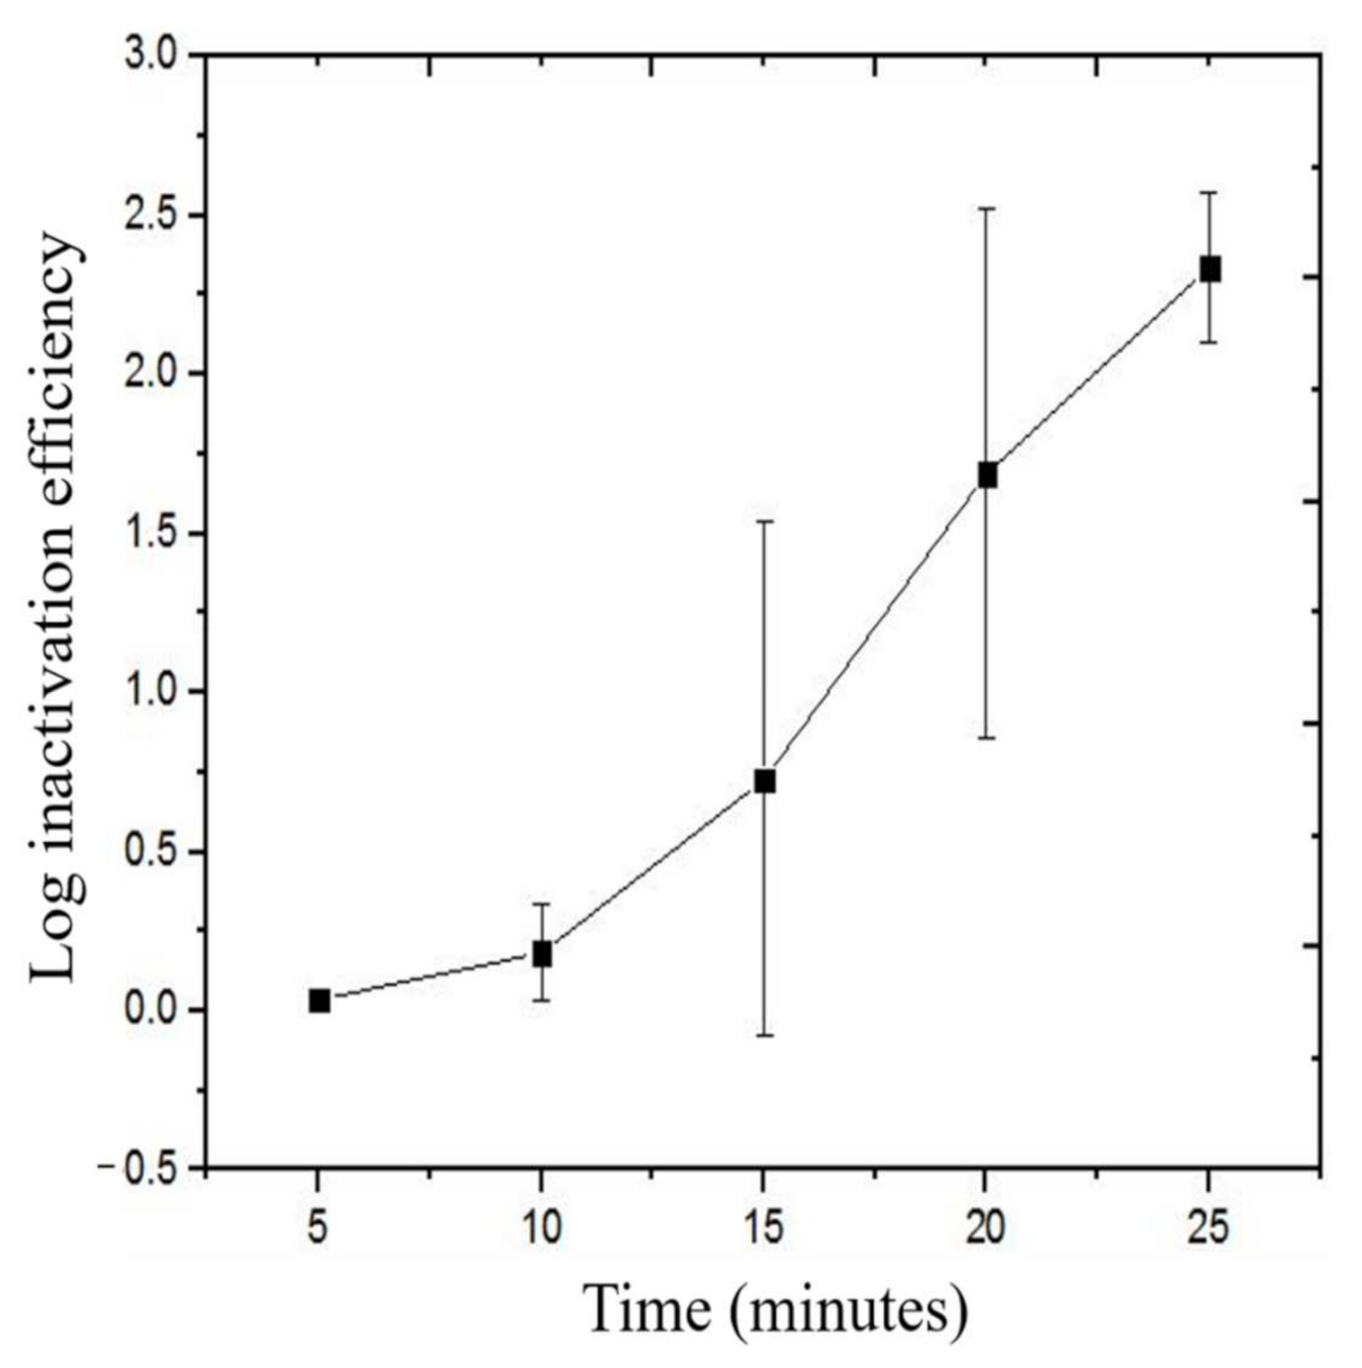
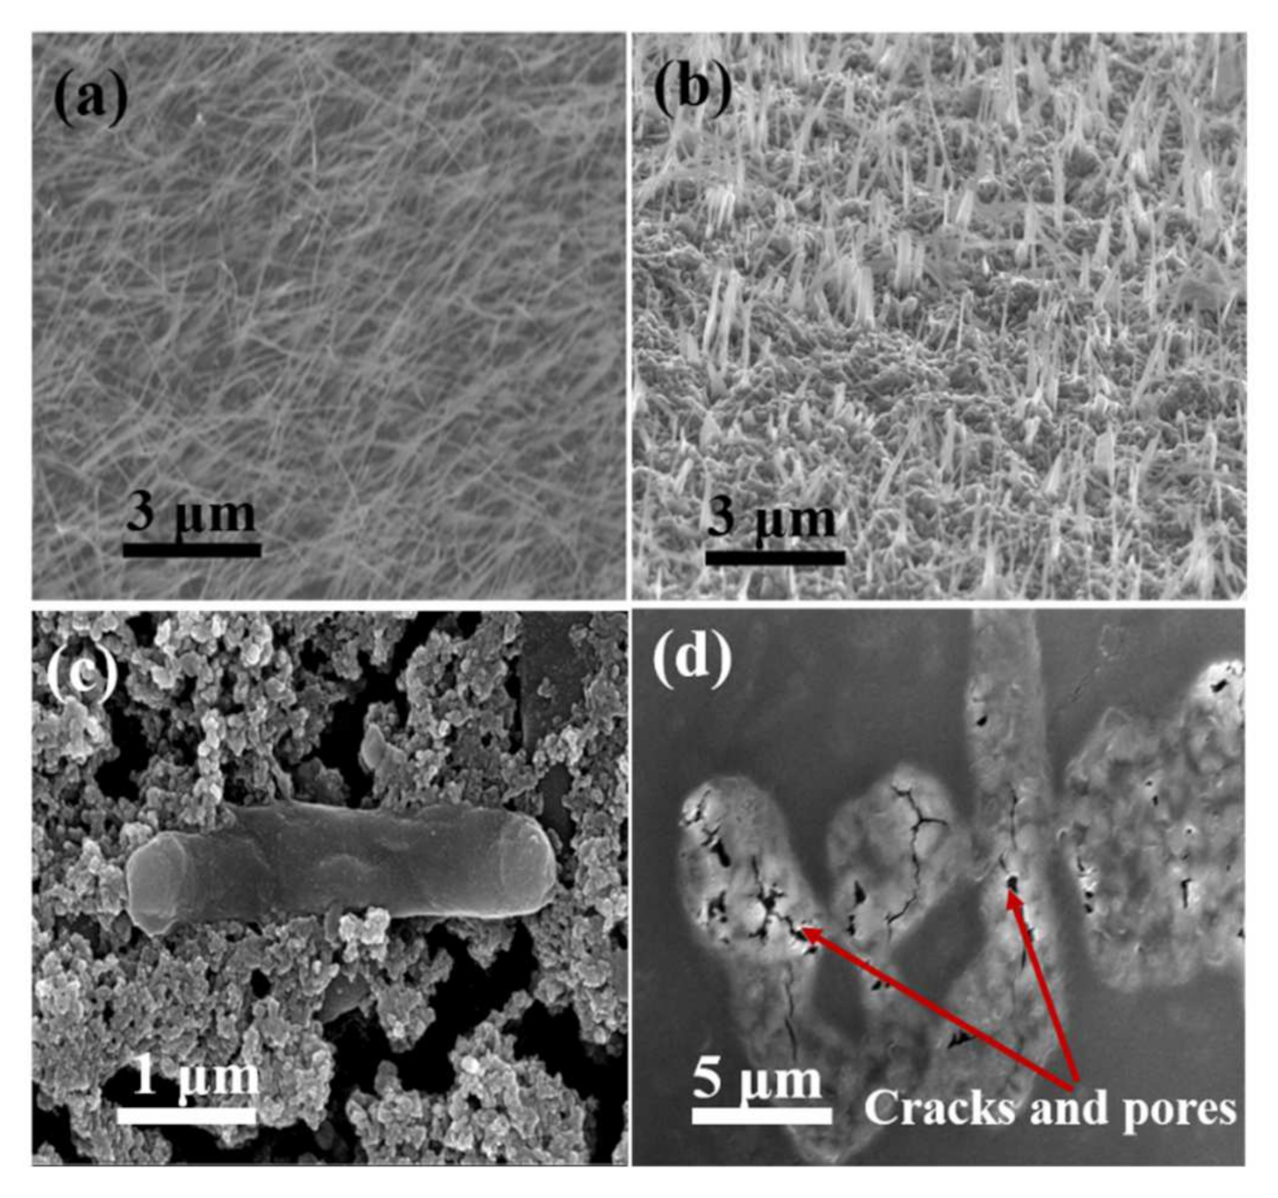
3.3. Bacterial Disinfection

Figure 9 shows the spread plate technique implemented on the agar plate for different periods of the operation. Three different tests were performed to confirm the repeatability of the experiment. Here, the bacterial disinfection analysis performed for a single test is illustrated. The initial sample of the bacterial water was removed and spread on the plate showing bacterial CFUs. After supplying the electrical potential for 5 min, another sample was removed and spread on the agar plate. This process continued for a time period of 25 min, and the results confirmed that for each sample, there is a decrease in the bacterial CFUs, as shown in Figure 9. It can be observed that the initial samples on a Petri dish consisted of a large number of CFUs of bacteria, while no viable bacterial cell was observed after 25 min of treatment. The variation of log inactivation efficiency with the treatment time is plotted with the standard deviation, as seen in Figure 10. The bacterial log removal efficiency is found to be 2.33.
The SEM images of the coaxial CuONWs, as illustrated in Figure 11a,b, reveal that CuONWs break during the bacterial inactivation experiment. The disinfection device was turned upside down for taking the samples out for plating. At that moment, turbulence was generated and CuONWs were not strong enough to withstand the turbulence. CuONWs can be coated with polydopamine (PDA) [43] for improving their stability, which was not performed in our study. Figure 11c,d shows the SEM images of E. coli bacteria, before and after the treatment, respectively. During the disinfection, bacterial cells were dragged towards the modified coaxial center electrode by various forces, such as electrophoresis and dielectrophoresis forces, where a high electric field was present [44]. In the electric field, the bacteria behaved like a capacitor. Charged irons inside and outside of the cell moved towards the cell membrane and generated transmembrane potential [40]. Under this potential, water molecules tended to penetrate the membrane, which lead to the formation of permanent pores and cracks. The comparison of a previously reported LEEFT water disinfection system with our study is presented in Table 3.

4. Conclusions

This paper presented an effective method for the bacterial disinfection of water by utilizing the energy produced from a piezoelectric wind energy harvester. The electrical output voltage of the harvester, when connected to the bacterial water, was about 0.1 V, which was further enhanced by generating copper oxide nanowires (CuONWs) at the center copper wire. A high electric field of around 14,000 V/m was produced, due to the local enhancement of the electric field that was demonstrated in the simulation analysis performed on a single nanowire. Complete bacterial disinfection was achieved by supplying electric potential for 25 min, and the log efficiency of the bacterial removal was calculated for each time interval of 5 min. The bacterial removal mechanism was confirmed by counting the bacterial colonies using the spread plate technique. The piezoelectric harvesting technique based on wind flow can be an important concept for the disinfection of bacteria in the water distribution systems. It is suitable to implement such approaches in the treatment of drinking water in areas in which there is no availability of a power supply. This water disinfection technique is efficient, low cost, by-product free and shows the strong potential for water treatment in storage systems. However, there is a limitation on a galloping-based wind energy harvesting using a piezoelectric beam. The piezoelectric wind energy harvester is always supposed to face the direction of the air flow. However, in reality, it is not possible for a harvester to always face the air flow, as the direction of the air flow is random in nature. This will definitely affect the overall efficiency of a harvester. In this paper, the practical application of a piezoelectric wind energy harvester in a water storage system was discussed. In future, this work can be extended to the bacterial disinfection of drinking water in distribution systems in pipelines, with a detailed study of the different water flow parameters.

Author Contributions

Conceptualization, P.P. and S.S.; methodology, P.P., P.K. and S.S.; software, P.P.; validation, S.S., P.P. and P.K.; formal analysis, P.P. and S.S.; investigation, S.S. and R.V.; resources, R.V. and R.K.; data curation, P.K. and P.T.; writing—original draft preparation, P.P.; writing—review and editing, R.V, R.K. and M.N.M.A.; visualization, P.T. and S.M.I.; supervision, R.K. and R.V.; project administration, S.M.I. and M.N.M.A.; funding acquisition, M.N.M.A. All authors have read and agreed to the published version of the manuscript.

Funding

This work was supported by the Researchers Supporting Project number (RSP-2021/100), King Saud University, Riyadh, Saudi Arabia, UNITEN R&D Sdn.Bhd. through seed fund (U-TV-RD-20-10), and publication funding by UNITEN BOLD grant (No. J510050002) from the Innovation and Research Management Center (iRMC), Universiti Tenaga Nasional, Kajang, Malaysia.

Institutional Review Board Statement

Not applicable.

Informed Consent Statement

Not applicable.

Data Availability Statement

Not applicable.

Acknowledgments

This work was supported by the Researchers Supporting Project number (RSP-383 2021/100), King Saud University, Riyadh, Saudi Arabia.

Conflicts of Interest

The authors declare no conflict of interest.

References

  1. Allaire, M.; Wu, H.; Lall, U. National trends in drinking water quality violations. Proc. Natl. Acad. Sci. USA 2018, 115, 2078–2083. [Google Scholar] [CrossRef] [PubMed] [Green Version]
  2. Bohn, P.W.; Elimelech, M.; Georgiadis, J.G.; Mariñas, B.J.; Mayes, A.M.; Mayes, A.M. Science and technology for water purification in the coming decades. Nanosci. Technol. A Collect. Rev. Nat. J. 2009, 452, 337–346. [Google Scholar] [CrossRef]
  3. Gleick, P.H. Dirty Water: Estimated Deaths from Water-Related Diseases 2000–2020; Pacific Institute for Studies in Development, Environment, and Security: Oakland, CA, USA, 2002; pp. 1–12. [Google Scholar]
  4. Prüss-Üstün, A.; Bos, R.; Gore, F.; Bartram, J. Safer Water, Better Health; World Health Organization: Geneva, Switzerland, 2008; p. 53. Available online: http://www.who.int/quantifying_ehimpacts/publications/saferwater/en/ (accessed on 16 July 2021).
  5. UNICEF; WHO. Progress on Household Drinking Water, Sanitation and Hygiene, 2000–2017; UNICEF: New York, NY, USA; WHO: Geneva, Switzerland, 2019; p. 140. Available online: https://washdata.org/sites/default/files/documents/reports/2019-07/jmp-2019-wash-households.pdf (accessed on 16 July 2021).
  6. Peter-Varbanets, M.; Zurbrügg, C.; Swartz, C.; Pronk, W. Decentralized systems for potable water and the potential of membrane technology. Water Res. 2009, 43, 245–265. [Google Scholar] [CrossRef] [PubMed]
  7. Chalmers, T.C.; Angelillo, I.F. Chlorination, chlorination by-products, and cancer: A meta-analysis. Am. J. Public Health 1992, 82, 955–963. [Google Scholar]
  8. Tian, C.; Liu, R.; Liu, H.; Qu, J. Disinfection by-products formation and precursors transformation during chlorination and chloramination of highly-polluted source water: Significance of ammonia. Water Res. 2013, 47, 5901–5910. [Google Scholar] [CrossRef] [PubMed]
  9. Deborde, M.; von Gunten, U. Reactions of chlorine with inorganic and organic compounds during water treatment-Kinetics and mechanisms: A critical review. Water Res. 2008, 42, 13–51. [Google Scholar] [CrossRef] [PubMed]
  10. Goswami, K.P.; Pugazhenthi, G. Credibility of polymeric and ceramic membrane filtration in the removal of bacteria and virus from water: A review. J. Environ. Manag. 2020, 268, 110583. [Google Scholar] [CrossRef]
  11. Deng, L.; Ngo, H.H.; Guo, W.; Zhang, H. Pre-coagulation coupled with sponge-membrane filtration for organic matter removal and membrane fouling control during drinking water treatment. Water Res. 2019, 157, 155–166. [Google Scholar] [CrossRef]
  12. Kim, I.; Tanaka, H. Photodegradation characteristics of PPCPs in water with UV treatment. Environ. Int. 2009, 35, 793–802. [Google Scholar] [CrossRef]
  13. Zhang, T.; Hu, Y.; Jiang, L.; Yao, S.; Lin, K.; Zhou, Y.; Cui, C. Removal of antibiotic resistance genes and control of horizontal transfer risk by UV, chlorination and UV/chlorination treatments of drinking water. Chem. Eng. J. 2019, 358, 589–597. [Google Scholar] [CrossRef]
  14. Chang, Y.; Kwan, P.; Pierson, G. Dynamic Energy Consumption of Advanced Water and Wastewater Treatment Technologies; Awwa Research Foundation: Denver, CO, USA, 2006. [Google Scholar]
  15. Schoenbach, K.H.; Joshi, R.P.; Stark, R.H.; Dobbs, F.C.; Beebe, S.J. Bacterial decontamination of liquids with pulsed electric fields. IEEE Trans. Dielectr. Electr. Insul. 2000, 7, 637–645. [Google Scholar] [CrossRef]
  16. Peng, P.; Cheng, Y.; Song, H.; Zhang, T.; Deng, S.; Anderson, E.; Addy, M.; Zhu, X.; Liu, S.; Hatzenbeller, R.; et al. Bacterial inactivation of liquid food and water using high-intensity alternate electric field. J. Food Process. Eng. 2017, 40, e12504. [Google Scholar] [CrossRef]
  17. Singh, R.K.; Babu, V.; Philip, L.; Ramanujam, S. Disinfection of water using pulsed power technique: Effect of system parameters and kinetic study. Chem. Eng. J. 2016, 284, 1184–1195. [Google Scholar] [CrossRef]
  18. Zhou, J.; Wang, T.; Yu, C.; Xie, X. Locally enhanced electric field treatment (LEEFT) for water disinfection. Front. Environ. Sci. Eng. 2020, 14, 78. [Google Scholar] [CrossRef]
  19. Pudasaini, S.; Perera, A.T.K.; Ahmed, S.S.U.; Chong, Y.B.; Ng, S.H.; Yang, C. An electroporation device with microbead-enhanced electric field for bacterial inactivation. Inventions 2020, 5, 2. [Google Scholar] [CrossRef] [Green Version]
  20. Huo, Z.-Y.; Li, G.-Q.; Yu, T.; Feng, C.; Lu, Y.; Wu, Y.-H.; Yu, C.; Xie, X.; Hu, H.-Y. Cell Transport Prompts the Performance of Low-Voltage Electroporation for Cell Inactivation. Sci. Rep. 2018, 8, 15832. [Google Scholar] [CrossRef] [PubMed]
  21. Pudasaini, S.; Perera, A.T.K.; Das, D.; Ng, S.H.; Yang, C. Continuous flow microfluidic cell inactivation with the use of insulating micropillars for multiple electroporation zones. Electrophoresis 2019, 40, 2522–2529. [Google Scholar] [CrossRef]
  22. Zhou, J.; Yu, C.; Wang, T.; Xie, X. Development of nanowire-modified electrodes applied in the locally enhanced electric field treatment (LEEFT) for water disinfection. J. Mater. Chem. A 2020, 8, 12262–12277. [Google Scholar] [CrossRef]
  23. Zhou, J.; Wang, T.; Xie, X. Rationally designed tubular coaxial-electrode copper ionization cells (CECICs) harnessing non-uniform electric field for efficient water disinfection. Environ. Int. 2019, 128, 30–36. [Google Scholar] [CrossRef]
  24. Yu, Z.; Zeng, H.; Min, X.; Zhu, X. High-performance composite photocatalytic membrane based on titanium dioxide nanowire/graphene oxide for water treatment. J. Appl. Polym. Sci. 2020, 137, 2–14. [Google Scholar] [CrossRef]
  25. Zhou, J.; Wang, T.; Chen, W.; Lin, B.; Xie, X. Emerging investigator series: Locally enhanced electric field treatment (LEEFT) with nanowire-modified electrodes for water disinfection in pipes. Environ. Sci. Nano 2020, 7, 397–403. [Google Scholar] [CrossRef]
  26. Huo, Z.Y.; Liu, H.; Yu, C.; Wu, Y.H.; Hu, H.Y.; Xie, X. Elevating the stability of nanowire electrodes by thin polydopamine coating for low-voltage electroporation-disinfection of pathogens in water. Chem. Eng. J. 2019, 369, 1005–1013. [Google Scholar] [CrossRef]
  27. Liu, C.; Xie, X.; Zhao, W.; Yao, J.; Kong, D.; Boehm, A.B.; Cui, Y. Static electricity powered copper oxide nanowire microbicidal electroporation for water disinfection. Nano Lett. 2014, 14, 5603–5608. [Google Scholar] [CrossRef] [PubMed]
  28. Kumar, S.; Sharma, M.; Kumar, A.; Powar, S.; Vaish, R. Rapid bacterial disinfection using low frequency piezocatalysis effect. J. Ind. Eng. Chem. 2019, 77, 355–364. [Google Scholar] [CrossRef]
  29. Ding, W.; Zhou, J.; Cheng, J.; Wang, Z.; Guo, H.; Wu, C.; Xu, S.; Wu, Z.; Xie, X.; Wang, Z.L. TriboPump: A Low-Cost, Hand-Powered Water Disinfection System. Adv. Energy Mater. 2019, 9, 1–8. [Google Scholar] [CrossRef]
  30. Huo, Z.Y.; Kim, Y.-J.; Suh, I.-Y.; Lee, D.-M.; Lee, J.H.; Du, Y.; Wang, S.; Yoon, H.-J.; Kim, S.-W. Triboelectrification induced self-powered microbial disinfection using nanowire-enhanced localized electric field. Nat. Commun. 2021, 12, 3693. [Google Scholar] [CrossRef] [PubMed]
  31. Hu, G.; Tse, K.T.; Wei, M.; Naseer, R.; Abdelkefi, A.; Kwok, K.C.S. Experimental investigation on the efficiency of circular cylinder-based wind energy harvester with different rod-shaped attachments. Appl. Energy 2018, 226, 682–689. [Google Scholar] [CrossRef]
  32. Wang, J.; Zhou, S.; Zhang, Z.; Yurchenko, D. High-performance piezoelectric wind energy harvester with Y-shaped attachments. Energy Convers. Manag. 2019, 181, 645–652. [Google Scholar] [CrossRef]
  33. Zhao, L.; Tang, L.; Yang, Y. Comparison of modeling methods and parametric study for a piezoelectric wind energy harvester. Smart Mater. Struct. 2013, 22, 125003. [Google Scholar] [CrossRef]
  34. Erturk, A. Electromechanical Modeling of Piezoelectric Energy Harvesters. Doctoral Dissertation, Virginia Polytechnic Institute and State University, Blacksburg, VA, USA, 2009; p. 291. Available online: http://hdl.handle.net/10919/29927 (accessed on 21 July 2021).
  35. Barrero-Gil, A.; Sanz-Andrés, A.; Roura, M. Transverse galloping at low Reynolds numbers. J. Fluids Struct. 2009, 25, 1236–1242. [Google Scholar] [CrossRef] [Green Version]
  36. Parkinson, G. Phenomena and modelling of flow-induced vibrations of bluff bodies. Prog. Aerosp. Sci. 1989, 26, 169–224. [Google Scholar] [CrossRef]
  37. Yang, Y.; Zhao, L.; Tang, L. Comparative study of tip cross-sections for efficient galloping energy harvesting. Appl. Phys. Lett. 2013, 102, 064105. [Google Scholar] [CrossRef]
  38. Zhou, C.F.; Zou, H.X.; Wei, K.X.; Liu, J.G. Enhanced performance of piezoelectric wind energy harvester by a curved plate. Smart Mater. Struct. 2019, 28, 125022. [Google Scholar] [CrossRef]
  39. Ding, L.; Yang, L.; Yang, Z.; Zhang, L.; Wu, C.; Yan, B. Performance improvement of aeroelastic energy harvesters with two symmetrical fin-shaped rods. J. Wind Eng. Ind. Aerodyn. 2019, 196, 104051. [Google Scholar] [CrossRef]
  40. Wang, T.; Chen, H.; Yu, C.; Xie, X. Rapid determination of the electroporation threshold for bacteria inactivation using a lab-on-a-chip platform. Environ. Int. 2019, 132, 105040. [Google Scholar] [CrossRef] [PubMed]
  41. Wagner, C. Investigations on silver sulfide. J. Chem. Phys. 1953, 21, 1819–1827. [Google Scholar] [CrossRef]
  42. Xu, C.H.; Woo, C.H.; Shi, S.Q. Formation of CuO nanowires on Cu foil. Chem. Phys. Lett. 2004, 399, 62–66. [Google Scholar] [CrossRef]
  43. Huo, Z.Y.; Hai Liu, H.; Wang, W.-L.; Wang, Y.-H.; Wu, Y.-H.; Xie, X.; Hu, H.-Y. Low-voltage alternating current powered polydopamine-protected copper phosphide nanowire for electroporation-disinfection in water. J. Mater. Chem. A 2019, 7, 7347–7354. [Google Scholar] [CrossRef]
  44. Kotnik, T.; Frey, W.; Sack, M.; Meglič, S.H.; Peterka, M.; Miklavčič, D. Electroporation-based applications in biotechnology. Trends Biotechnol. 2015, 33, 480–488. [Google Scholar] [CrossRef]
  45. Xie, X.; Zhou, J.; Wang, T. Locally Enhanced Electric Field Treatment (LEEFT) promotes the performance of ozonation for bacteria inactivation by disrupting the cell membrane. Environ. Sci. Technol. 2020, 54, 14017–14025. [Google Scholar] [CrossRef]
  46. Zhou, J.; Yang, F.; Huang, Y.; Ding, W.; Xie, X. Smartphone-powered efficient water disinfection at the point of use. npj Clean Water 2020, 3, 40. [Google Scholar] [CrossRef]
Figure 1. Schematic diagram of the galloping wind energy harvester: (a) the structural diagram with the circular bluff body; (b) equivalent lumped parameter model; (c) cylindrical bluff body with attachments and (d) top view of the curve-shaped attachments on the main circular bluff body.
Energies 15 06133 g001
Figure 2. A bluff body subjected to galloping.
Energies 15 06133 g002
Figure 3. Experimental setup: (a) bacterial disinfection using a galloping piezoelectric wind energy harvester; (b) piezoelectric wind energy harvester; (c) bluff body with curve-shaped attachments and (d) copper tube.
Energies 15 06133 g003
Figure 4. 2D flow field simulation of a bluff body with curve-shaped attachments: (a) pressure field and (b) velocity field.
Energies 15 06133 g004
Figure 5. Experimental and simulation output voltage: (a) experiment at 4 m/s wind speed; (b) simulation at 4 m/s wind speed; (c) experimental output voltage with and without attachments and (d) comparison at different wind speeds.
Energies 15 06133 g005
Figure 6. Variation of electric supply during disinfection: (a) output voltage vs. time plot and (b) current vs. time plot.
Energies 15 06133 g006
Figure 7. (a) XRD plots of the coaxial center copper electrode; (b) SEM image of nanowires generated on the surface of the coaxial copper electrode and (c) SEM image of the coaxial center copper electrode.
Energies 15 06133 g007aEnergies 15 06133 g007b
Figure 8. Electric field simulation performed on the cross-section of the copper tube using copper oxide modified nanowires.
Energies 15 06133 g008
Figure 9. Agar plates showing the bacterial concentration for different periods of treatment.
Energies 15 06133 g009
Figure 10. Bacterial removal efficiency of E. coli bacteria.
Energies 15 06133 g010
Figure 11. SEM images: (a) copper oxide nanowires before the experiment; (b) copper oxide nanowires after the experiment (broken); (c) live E. coli bacteria (before treatment) and (d) E. coli bacteria (after treatment).
Energies 15 06133 g011
Table 1. Parameters of the piezoelectric wind energy harvester.
PropertiesValue
Mass of cantilever beam2.54 g
Mass of bluff body2.52 g
Mass of curve-shaped attachments3.45 g
Effective mass, M 7.5 g
Effective damping, C 0.0059 N/(m/s)
Effective stiffness, K 6.8359 N/m
Open circuit natural frequency, f o c 4.8211 Hz
Short circuit natural frequency, f s c 4.8141 Hz
Capacitance of the piezoelectric patch, C p 1.3574 × 10⁻⁸ F
Electromechanical coupling coefficient, θ c 2.24 × 10⁻⁵ N/V
Damping ratio, ξ 0.013
Table 2. Comparison results of the various piezoelectric galloping wind energy harvesters.
No.ReferenceBluff BodyPiezoelectric BeamWind Velocity (m/s)Output RMS Voltage (V)
ShapeWindward Width (mm)Height (mm)MaterialDimensions in mm (Length × Width × Thickness)
1.Zhao et al. [37]Square40150Aluminum150 × 30 × 0.6830
2.Zhou et al. [38]Curved plate35100Tin bronze180 × 10 × 0.855
3.Gang et al. [31]Cylindrical body with circular attachments48240Stainless Steel200 × 26 × 0.95819
4.Ding et al. [39]Cylindrical body with fin-shaped attachments30150Stainless Steel120 × 15 × 0.5714
5.Present workCylindrical body with curve-shaped attachments32120Aluminum200 × 25 × 0.6425
Table 3. Comparison of previously reported LEEFT water disinfection.
No.ReferenceStudy Applied Voltage
(Electrical Parameters)
PortableSelf-PoweredFlow/Steady ModeCapacityLog Inactivation Efficiency
1.Xie et al. [45]LEEFT with ozonation 1.2 VDC××Flow4 mL/min,
2.2 HRT (min)
6-log
2.Zhou et al. [46]Smart phone powered LEEFT2 VDCYes×Flow10 mL/min,
0.88 HRT (min)
3-log
~1.8 VDC5 mL/min,
1.77 HRT (min)
6-log
~1.42 mL/min,
4.43 HRT (min)
3.Ding et al. [29]Tribo pumpIRMS = 80 µm
R = several kΩ
YesYesFlow2–2.5 HRT (min)6-log
4.Zhou et al. [25]LEEFT in pipes 0.5 VDC××Flow>1 mL/min
>8.86 HRT (min)
1-log
1 VDC1 mL/min,
8.86 HRT (min)
6-log
2 VDC1 mL/min,
8.86 HRT (min)
5.Present workPiezoelectric wind energy harvester for LEEFT0.1 V Yes Yes Steady 0.8 mL/min2.33-log
Publisher’s Note: MDPI stays neutral with regard to jurisdictional claims in published maps and institutional affiliations.

