Article

Comparative Analysis of the Failure Rates of Shearer and Plow Systems—A Case Study

1
Department of Machinery Engineering and Transport, Faculty of Mechanical Engineering and Robotics, AGH University of Science and Technology, A. Mickiewicza Av. 30, 30-059 Krakow, Poland
2
Department of Mining Engineering and Occupational Safety, Faculty of Civil Engineering and Resource Management, AGH University of Science and Technology, A. Mickiewicza Av. 30, 30-059 Krakow, Poland
*
Author to whom correspondence should be addressed.
Energies 2022, 15(17), 6170; https://doi.org/10.3390/en15176170
Submission received: 30 June 2022 / Revised: 20 August 2022 / Accepted: 22 August 2022 / Published: 25 August 2022
(This article belongs to the Special Issue Coal Mining)

Abstract

:
Mechanised plow and shearer systems are widely applied in underground mines all over the world. Both systems are used in the exploitation of hard coal deposited in the form of seams of various thickness. The selection of the appropriate complex depends on the mining and geological conditions and the thickness of the seam. However, with regard to thin and medium seams, these complexes are competitive solutions. Mines usually use either shearer or plow systems. Both have certain advantages and disadvantages resulting from their design and method of operation, which have been demonstrated and presented in many publications. However, in terms of their failure rate comparison, there are no relevant research and analysis results. Only selective studies of individual machines can be found. The article is concerned with the failure frequency of longwalls equipped with plow and shearer systems in the LW Bogdanka coal mine. The analysis covers a period of 13 months of the mine’s operation, during which 2589 failures were recorded. All failures were taken into account, irrespective of their type or cause. The analysis was conducted for all longwalls exploited in this period, i.e., five plow and five shearer systems working in six different sections. In the analysed period, these longwalls worked for a total of 1484 days. It should be emphasised that all the complexes worked in one mine, thanks to which the data are comparable. The analysis is unique material regarding the failure rate of machines. Both solutions were analysed independently and subjected to a detailed comparison. A comprehensive analysis revealed that the failure rate of longwalls equipped with plow systems is noticeably higher than that of shearer ones. The main purpose of the article was to conduct a comparative analysis of the failure rate of machines in shearer and plow complexes operating in the same conditions. The analysis results contradict the previous opinion on the failure frequency of plow and shearer systems. The final conclusion has been very well-argued and is supported by hard data. The comparison of both techniques in terms of their failure rate is new knowledge and can be treated as an argument when choosing an appropriate longwall complex.

1. Introduction

Hard coal can be mined with the use of various mining systems. Hard coal in the form of seams is most often extracted by means of longwall systems. The main advantages of such systems include a small amount of preparatory work, low operating losses, high concentration of extraction, easy control of the roof, the possibility of full mechanisation of works and easy supervision over the movement in the longwall. A longwall of a certain length, panel length and height is exploited using a mechanised longwall system equipped with a cutting and loading machine in the form of a longwall shearer or a static coal plow. Generally, longwall systems consist of cutting machines (plow or shearer), armored face conveyors (AFCs), roof supports and beam stage loaders (BSLs). Both solutions have specific characteristics resulting from the way that they work. They are developed and adapted to the changing conditions and user requirements. In the case of thin and medium seams, these complexes are competitive solutions.
The shearer technique is dedicated to longwalls with a height of 1.5 m, due to a number of drawbacks related to the use of shearers in thin seams. The major disadvantages include the lack of full automation, which forces the operators to follow the shearer and control it under conditions of limited space and visibility, as well as the slotting process, significantly reducing the daily production, which is limited by the thickness of the seam. It should be noted that the use of a typical two-arm structure and the cutting process as a mining method allows adjusting the cutting height to the changing seam thickness and makes it possible to mine hard-to-cut coals, accompanying rocks and overgrowths. The longwall shearer advances at a speed of a few to several meters per minute, and at one time cuts a slice as thick as the web of the cutting head—usually 0.8 m to 1.0 m. The use of cutting also makes it possible to obtain the assumed daily output in difficult conditions. On the other hand, due to the low advance speed and large web, the shearer technique is characterised by an acceptable sensitivity of the daily extraction to periodic downtimes. In the case of hardly accessible coals or rocks, the machine advance speed is reduced while keeping the cutting for a full web of the cutting head. The use of the rear walkway roof support enables fast securing of the roof immediately after the shearer advance.
The plowing technique is suitable for extracting low seams of easily and moderately accessible coals, without overgrowths. The plow head does not require an operator and moves in an automatic cycle. The head advances at a constant speed of approximately 3–3.5 m/s, and at one time cuts a slice with a thickness corresponding to the depth of pick cutting—usually 5 cm to 9 cm. Continuous operation of the plow head, high speed and quick AFC flitting help to achieve the assumed daily production. However, due to the shallow cutting depth, the plowing technique is characterised by high sensitivity of daily extraction to downtimes. Another of its characteristic features is high sensitivity to coal accessibility as well as the occurrence of seam disturbances, which translates into a reduced cutting depth, and in consequence, a lower daily production. Additionally, it often results in a broken drive chain. Due to the technology of the plow system and the arrangement of successive sections of the longwall support, a large exposure of the roof resulting in its fall is observed. Longwall shearer and plow systems have been used in underground mining for several dozen years. The complexes consist of many machines, which are very well-described in articles and books. In recent years, numerous articles about longwall systems regarding selected machines or selected problems have been published. Several articles are devoted to the exploitation of thin hard coal seams. In one of them, the available longwall systems [1] are described, while in others, new solutions for the longwall system [2] and the results of research in this area are presented [3]. One of the articles is concerned with the use of computer software for quick creation of longwall shearer cutting heads and for determining the cutting resistance [4]. Another discusses the selection of the mining method depending on the properties of the rocks to be excavated [5], and yet another [6] compares the mining methods in terms of their efficiency and energy consumption. There is also an article regarding the state of automation and robotisation of mining, including longwall systems, in Poland [7], and a paper that discusses the design as well as the testing of the system and control algorithms for battery-powered mining machines [8]. In one of the articles, the problem of machine stability assessment is considered [9]. The aim of another paper was to develop and validate methods for choosing the ways of mining face mechanisation [10]. There are also articles on mechanical transmission gears [11] or the mechanisms of longwall shearer advance [12]. Many articles are devoted to mining technologies [13,14,15].
The failure rate and reliability of individual machines or production lines are the subject of many studies and articles. A number of studies devoted to this issue relate to underground mining. In one of the articles, the possibility of using quality-management tools for evaluating the failure rate of cutter–loader and plow mining systems is presented [16]. Similarly, in other articles, the use of such tools in mining is proposed [17,18,19]. In reference [20], the application of sensor-based information systems to identify unplanned downtimes in mining machinery operation is presented. In one of the articles, the results of the causes of downtimes in selected mining machines included in the mechanised longwall system are studied [21]. Another article presents a proposal of using a data warehouse to determine the level of load of the longwall shearer during its work on the basis of shearer motor, power consumption, time and series [22]. In another paper, the authors discuss the application of overall equipment effectiveness (OEE) to measure the effectiveness of shovels and trucks [23]. In one of the articles, a case study in a Swedish open-pit mine is presented to show the mine production index (MPI) as an extension of OEE for bottleneck detection in mining [24]. In article [25], the authors discuss the application of a hybrid neurogenetic algorithm using the example of mining machines, while reference [26] is devoted to the analysis of failures of hydraulic systems used in mining machines operating in copper ore mines. There are various measures for assessing machinery supervision, including OEE, MTBF, MTTR and MTTF. The most popular indicator is OEE—overall equipment effectiveness. The MTTR indicator—mean time to repair—determines the average time needed for a repair when a failure occurs. The MTBF indicator—mean time between failures—indicates how frequently a given machine or set of machines is broken down from a statistical point of view. In enterprises, it is used to establish the schedule of preventive inspections. The indicator is understood as the average working time between failures in a specified time. The MTBF indicator is the sum of MTTR and MTTF [27].
This article concerns longwall workings of the Lubelski Węgiel Bogdanka S.A. mine. During the analysed period, exploitation activities were carried out in 10 longwalls, 5 of which were equipped with plow longwall systems and the other 5 with shearer systems. The best possible use of longwall systems results in high operational efficiency. In practice, various indicators are used to determine the efficiency and take into account a number of factors, especially failures. However, apart from breakdowns, it is worth paying attention to downtimes, disassembly of machines in the longwall and factors independent of the analysed set of machines.
The failure rate of machines and devices, depending on the reporting method and available data, can be described by a number of numerical indicators. Some of the most frequently used ones were presented earlier. In this case, however, the most appropriate indicator to study is the average failure duration, based on the available data regarding the recorded failures. Duration of failures per one day of system operation and duration of failures expressed as the result obtained in the form of the amount of excavated material, taking into account the share of gangue, will allow for the comparison of the shearer and plow techniques.
Producers of plow systems very often express the opinion that these systems are more reliable than shearer complexes, which, however, has never been supported by research results. Currently, the subject literature does not provide any comparisons of the plow and shearer techniques illustrated by an example of data from plants with the same working conditions. The data presented in this article and the obtained results are the first such comparison based on data from one mine, which means the same mining and geological conditions, procedures, employees’ approach and management system.
As both complexes allow for a similar daily production to be obtained, sometimes it is the failure rate of machines that provides a decisive argument when choosing one or the other technique. The main purpose of this article is to conduct a comparative analysis of the failure frequency of machines in shearer and plow complexes operating under the same conditions. The results of this analysis allowed us to conclude, based on relevant indicators, that the shearer technique is characterised by a lower failure rate.

2. Materials and Methods

The data presented in the article concern 10 longwall systems operating in one of Polish mines. Each of the 10 longwall systems worked for a different amount of time in the analysed period and obtained a different amount of excavated material. The share of gangue depended on the location of the longwall and the technical equipment used. Therefore, there are a number of values characteristic of a given longwall working that may influence the machine failure rate. In the article, the tonne, a metric unit of mass (1000 kg), is presented as the megagram (Mg), according to International System of Units (SI). The major values relating to the analysed period, which are listed numerically and presented graphically in Figure 1 and Figure 2, include:
  • number of days—this value specifies the total number of days during which the system was in operation, [-];
  • daily net output—an average coal weight per day, [Mg/d];
  • gross output—this value determines the total mass of excavated material, [Mg];
  • daily gross output—an average weight of excavated material per day, [Mg/d];
  • waste rock output—this value determines the total mass of excavated rock, [Mg];
  • daily waste rock output—an average mass of excavated waste rock per day, [Mg/d];
  • share of waste rock—wt% of waste rock in gross excavated material, [%].
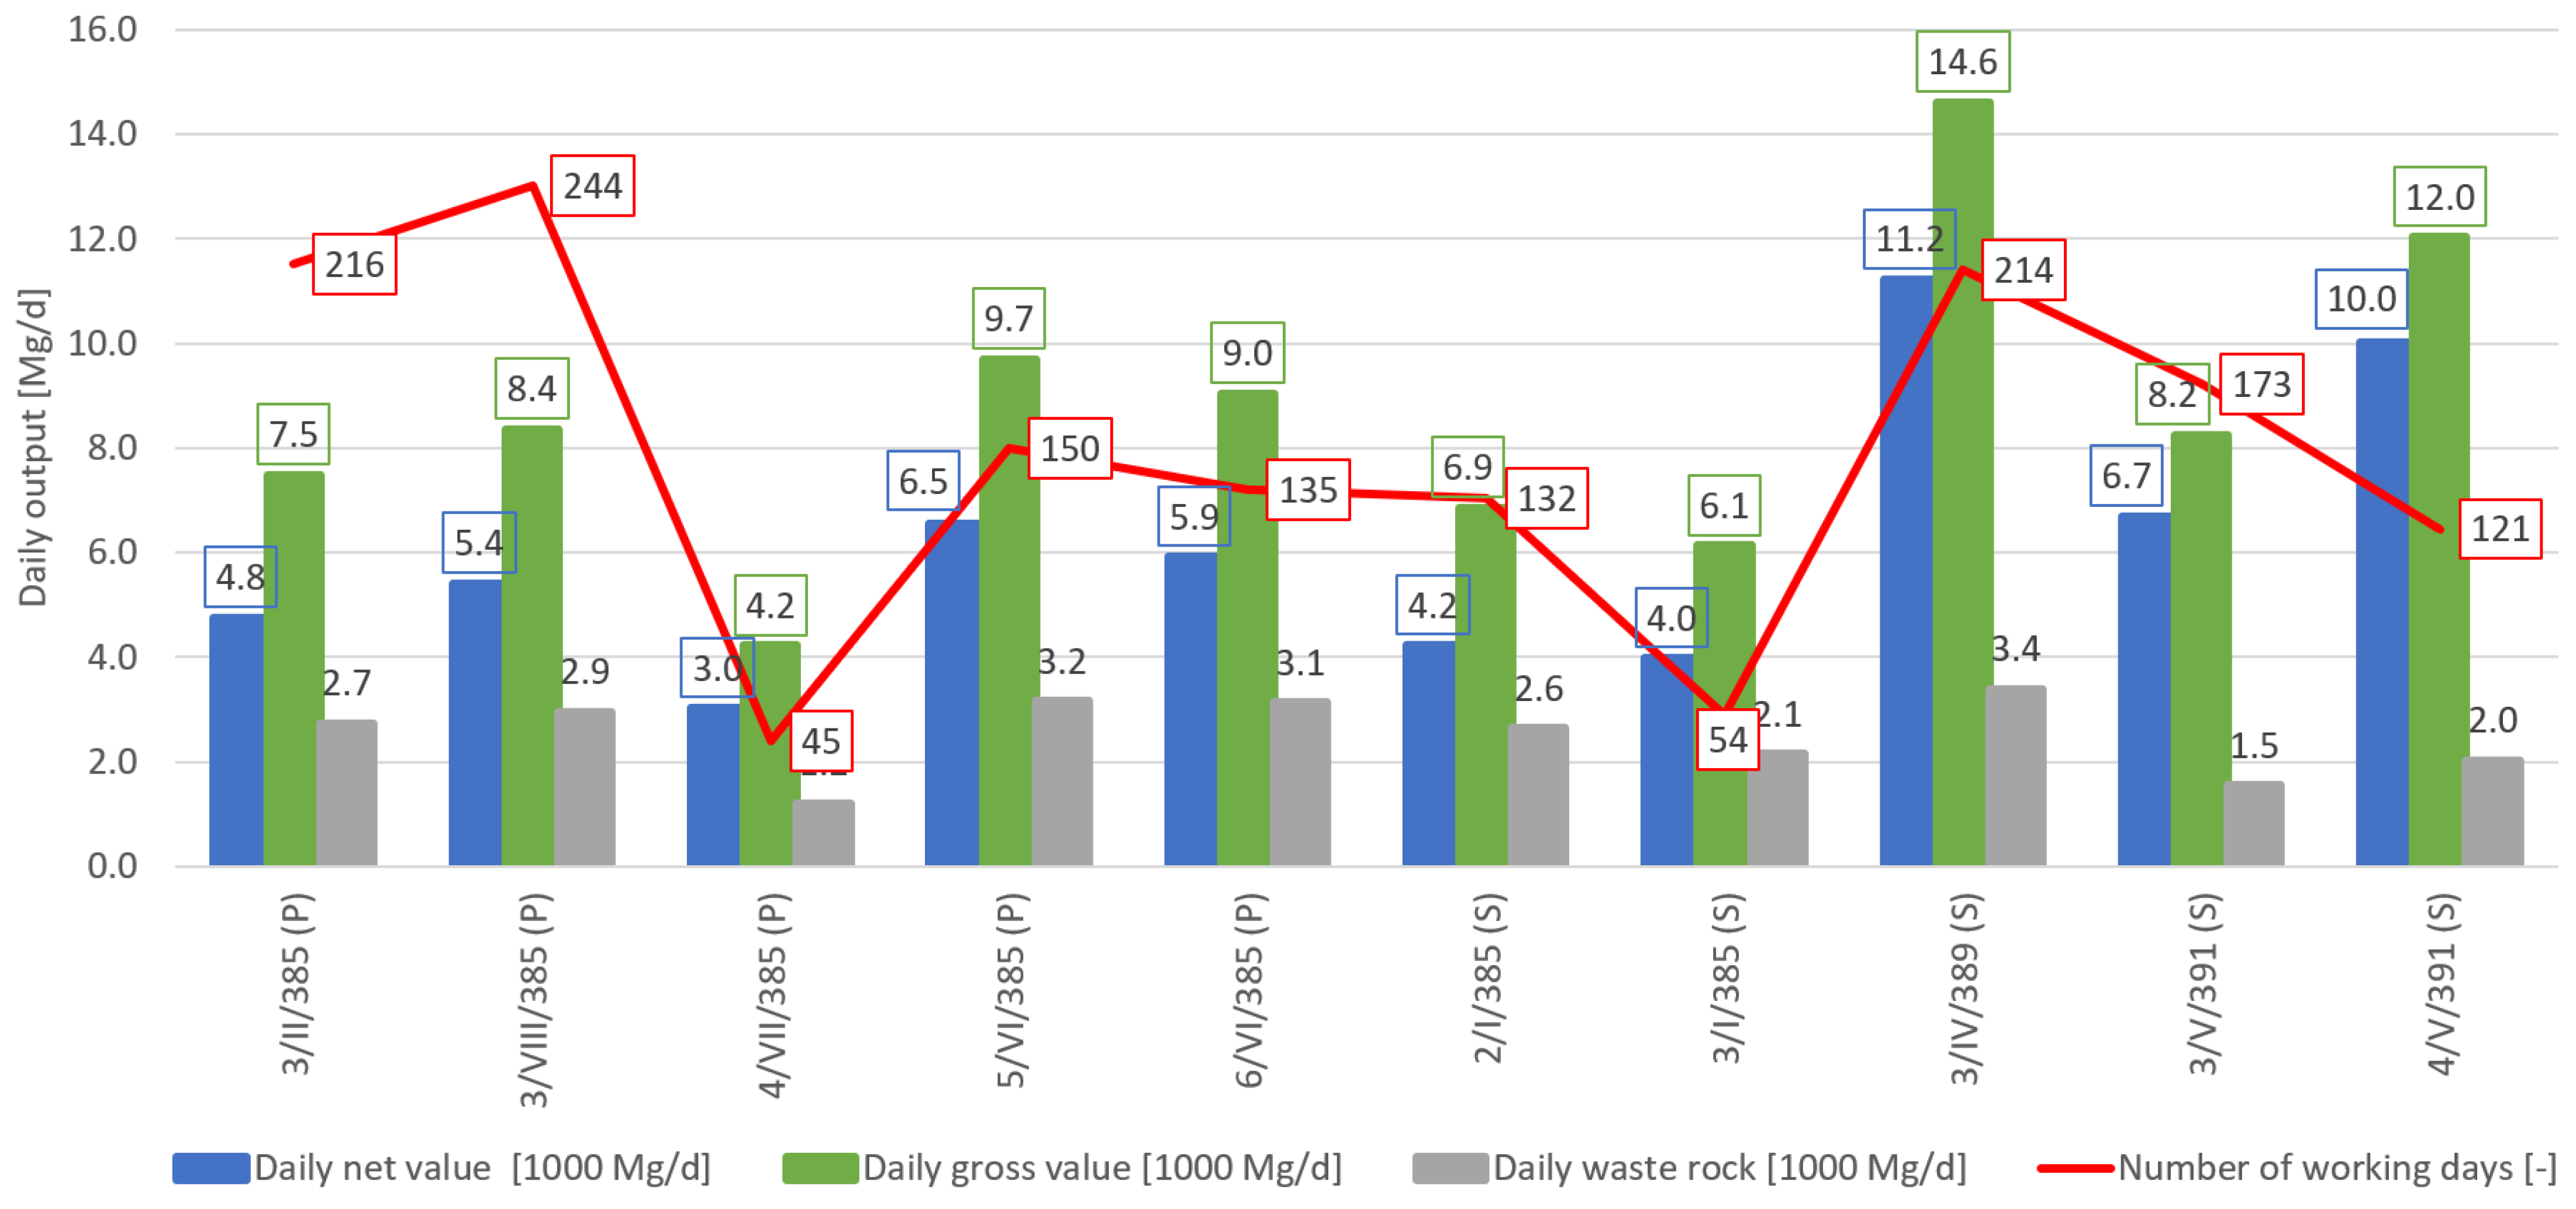
The graph in Figure 2 shows the difference in the number of working days for each longwall. The designation of longwall given in brackets is followed by the P symbol for plow longwalls and the S symbol for shearer longwalls. One shearer longwall and one plow longwall worked for approximately 50 days, whereas the remaining longwalls worked much longer.
The total production analysed as gross value, net value and the amount of excavated waste rock is presented in the bar graph in Figure 1. It is evident that the output was the lowest in the longwalls that worked for the shortest time. Another value important for interpreting and assessing the failure rate is the percentage of waste rock in the excavated material; therefore, its line graph was plotted. The average value of output per day, i.e., daily output, correlates to a greater extent with the actual load of the system machines during work. Such a summary is presented in Figure 2. While the smallest total output for the shortest working longwalls was natural, the average daily output should be independent of the working time. It has to be noted that in the case of systems which were at the start-up stage or at the end of the panel length in the analysed period, the daily output was lower. As can be seen from this diagram, both the higher daily extraction and the lower content of waste rock in the excavated material speak in favour of shearer systems.
In the analysed period, failures were reported on an ongoing basis and tabularised in an Excel file. The following data were provided for each longwall: longwall designation, the date and time of failure, duration in minutes, failure type, detailed information, including description and cause, as well as failure type code.
The failures at the LW Bogdanka mine are divided into 883 types. In the first place, failures are divided into three types: mining—natural (N), electrical (E) and mechanical (M). Each type of failure is divided into objects that indicate what the downtime refers to. Mining failures are divided into 12 objects. Electrical failures are divided into 11 objects. Similarly, mechanical failures are divided into 11 objects. Each of the objects has additional categories and subcategories describing in detail the element or the result of the failure. The largest number of categories—as many as 503—is found in electrical failures, followed by mechanical failures—253 in total, whereas the fewest failures are observed among mining failures—only 93. The structure of failure reports is very detailed, which makes it complex and burdensome from the point of view of comparative analysis.
In the analysed period of time, all the 10 longwalls worked for a total of 1484 days, which resulted in 13,770 thous. Mg of gross spoil, including 9898 thous. Mg net and 3962 thous. Mg of gangue. During this time, 2589 failures lasting a total of 260,802 min were recorded. Therefore:
  • the average failure duration was 100.73 min;
  • there are an average of 1.74 failures per day;
  • the average failure duration per 1000 Mg of gross spoil is 18.94 min;
  • the average failure duration per 1000 Mg of net spoil is 26.59 min;
  • the average failure duration per 1000 Mg of waste rock is 65.83 min;
  • there are an average of 0.19 failures per 1 thous. Mg of gross spoil;
  • there are an average of 0.26 failures per 1 thous. Mg of spoil net;
  • there are an average of 0.65 failures per 1 thous. Mg of waste rock ore.
Mining, electrical and mechanical failures are as follows:
  • mining failures—time 189,640 min, the number of failures—1658, average duration of failure—114 min;
  • electrical failures—time 40,235 min, the number of failures—624, average duration of failure—64 min;
  • mechanical failures—time 30,602 min, the number of failures—302, average duration of failure—101 min.
Figure 3 shows the total duration of failures for each type. Mining failures account for nearly 73% of all failure duration, whereas electrical failures account for 15% and mechanical ones 12%. Mining failures also dominate in terms of numbers, accounting for 64% of all failures, while electrical failures account for 24% and mechanical failures for 12%. It is worth noting, however, that the average duration of failures indicates the greatest time consumption of mining failures. Mining failures last 10% longer than the average duration of all failures. Mechanical failures are also characterised by a long repair time, which is comparable to the average value for all failures. In contrast, electrical failures last about 60% of the average time. This analysis applies to all objects in all longwalls, taking into account the division into mining, electrical and mechanical failures.

3. LW Bogdanka S.A. Hard Coal Mine

The Lubelski Węgiel “Bogdanka” S.A. coal mine is located in the most coal-rich part of the Lublin Coal Basin. The geological structure of the Lublin Coal Basin deposit is significantly different from that of the Upper Silesian deposit. The major factors characterising this basin include:
  • overburden with a thickness of ca 700 m;
  • almost horizontal deposition of coal and waste rock layers;
  • relatively weak rocks accompanying hard coal seams;
  • absence of major faults;
  • water-filled layers characterised by a high water pressure and a layer of quicksand.
The Lubelski Węgiel “Bogdanka” S.A. mine operates within the boundaries of the “Puchaczów V” mining area of approximately 73 km2. In this area, eight seams with industrial resources were selected for exploitation from among 18 recoverable hard coal deposits located under an overburden of 650–730 m. The mine has a license for exploiting four seams marked with the following numbers: 382, 385/2, 389 and 391. Currently, seams 385/2, 389 and 391 are being exploited. Table 1 presents the major parameters of the analysed longwalls, which were exploited in the period covered by the research.

4. Failure Rate by Failure Category

A comparative assessment of the failure rate of the plow and shearer systems should be taken into consideration in the analysis of individual indicators. Therefore, an analysis taking into account the division into plow and shearer longwalls was carried out. Due to the different working time of the longwalls and the different amount of excavated material, the indicators based on one working day and 1000 Mg of excavated material were also used.
In the analysed period, the shearer longwalls worked for 694 days, during which 7,247,000 Mg of spoil was mined, whereas the plow longwalls worked for 790, yielding 6,523,000 Mg of excavated material. On average, the shearer systems yielded 10,400 Mg/d, while the plow ones yielded 8300 Mg/d.
Table 2 presents the number and duration of failures for the shearer and plow longwalls in general (in total) and by the type of failure (mining, electrical, mechanical), taking into account total values and average indicators for one working day and for 1000 Mg of the obtained output. Table 3 shows the percentage correlation between failures in plow longwalls and shearer longwalls. Positive values mean that the failure rate of plow systems is higher than that of shearer ones by a respective percentage value. Therefore, positive values indicate a lower failure rate of shearer systems, while negative ones indicate a lower failure rate of plow systems.
The analysis of indicators describing the number of failures and their duration allows concluding that the total of plow longwall failures is approximately 40% higher per day and approximately 80% higher per 1000 Mg of excavated material than in in the case of shearer longwalls. Only mechanical failures, which account for the smallest share of failures, are in favour of plow longwalls with regard to some indicators.
The next part of the article contains the results of the analyses carried out separately for shearer and plow longwalls. The numerical values are illustrated in bar charts, presenting a total of failure rates in shearer and plow longwalls, successively.
  • total number of failures;
  • failure time in total;
  • number of failures per one day;
  • failure time per one day;
  • number of failures per 1000 Mg of excavated material;
  • failure time per 1000 Mg of excavated material.

5. Analysis of Shearer Longwall Failure Rate

The number and duration of shearer longwall failures are given in Table 4. The table also shows the average failure duration for individual objects as well as the percentage duration and number of failures in relation to the total values for failures in general. To obtain comparative failure rates, the number of failures and the duration of failures per one day of the system operation and per 1000 Mg of the obtained output were also calculated. The number of failures and the average failure duration are presented in the diagram in Figure 4. Similarly, Figure 5 shows the failure duration and the average failure time. Information on the significance of failures for a given object is presented by means of Pareto charts for both the number of failures and the failure time in Figure 6 and Figure 7, respectively.
The data on the shearer longwall failures by object can be summed up as follows:
  • The failures were most frequently related to haulage, face conveyor, longwall shearer, longwall downtime and full-retention bunkers, accounting for more than 85% of the total number of failures;
  • The longest-lasting failures were those related to longwall downtime, face conveyor, full-retention bunkers, haulage and longwall shearer, successively, accounting for more than 90% of all failure duration.
  • Among the major failures, on average, the longest-lasting were those related to longwall downtime (154 min), full-retention bunkers (151 min), face conveyor (104 min), longwall shearer (93 min) and haulage (68 min).
  • Failures related to longwall shearer accounted for 16% of the number of failures and 5% of failure time.

6. Analysis of Plow Longwall Failure Rate

The number and duration of failures in plow longwalls are summarised in Table 5. The table also shows the average failure duration for individual objects as well as the percentage failure duration and the number of failures in relation to the total values for all failures. As before, the number and the duration of failures per one day of system operation and per 1000 Mg of the obtained output were also calculated. The number of failures and the average failure duration are shown in the diagram in Figure 8. Similarly, Figure 9 shows the failure duration and the average failure time. Information on the significance of failures for a given object is presented by means of Pareto charts for both the number of failures and the failure time in Figure 10 and Figure 11, respectively.
The data on the plow longwall failures in total by object can be summed up as follows:
  • The failures are most frequently related to longwall downtime, haulage, plow, face conveyor and full-retention bunkers, accounting for more than 90% of all failures;
  • The longest-lasting failures were those related to face downtime, full-retention bunkers, plow, longwall conveyor and haulage, accounting for nearly 95% of all failure duration;
  • Among the major failures, on average, the longest-lasting were those related to full retention bunkers (199 min), plow (128 min), face conveyor (112 min), longwall downtime (87 min) and haulage (53 min);
  • Plow failures account for 17% of failures and 22% of failure time.

7. Results of Comparison of the Systems Failure Rates

The analysis of the failure rate of plow and shearer longwalls involved specifying the indicators determining the failure rate of individual objects per one day of operation of the longwall and per 1000 Mg of spoil. A further comparative analysis of the plow and shearer longwalls, based on the conclusions regarding the significance of individual objects subject to failure, in particular Pareto charts, took the following into consideration:
  • mining machine: S/P (shearer/plow);
  • armoured face conveyor: AFC;
  • beam stage loader: BSL;
  • support: support;
  • longwall downtime: longwall;
  • haulage: haulage;
  • full-retention bunkers: full-retention bunkers.
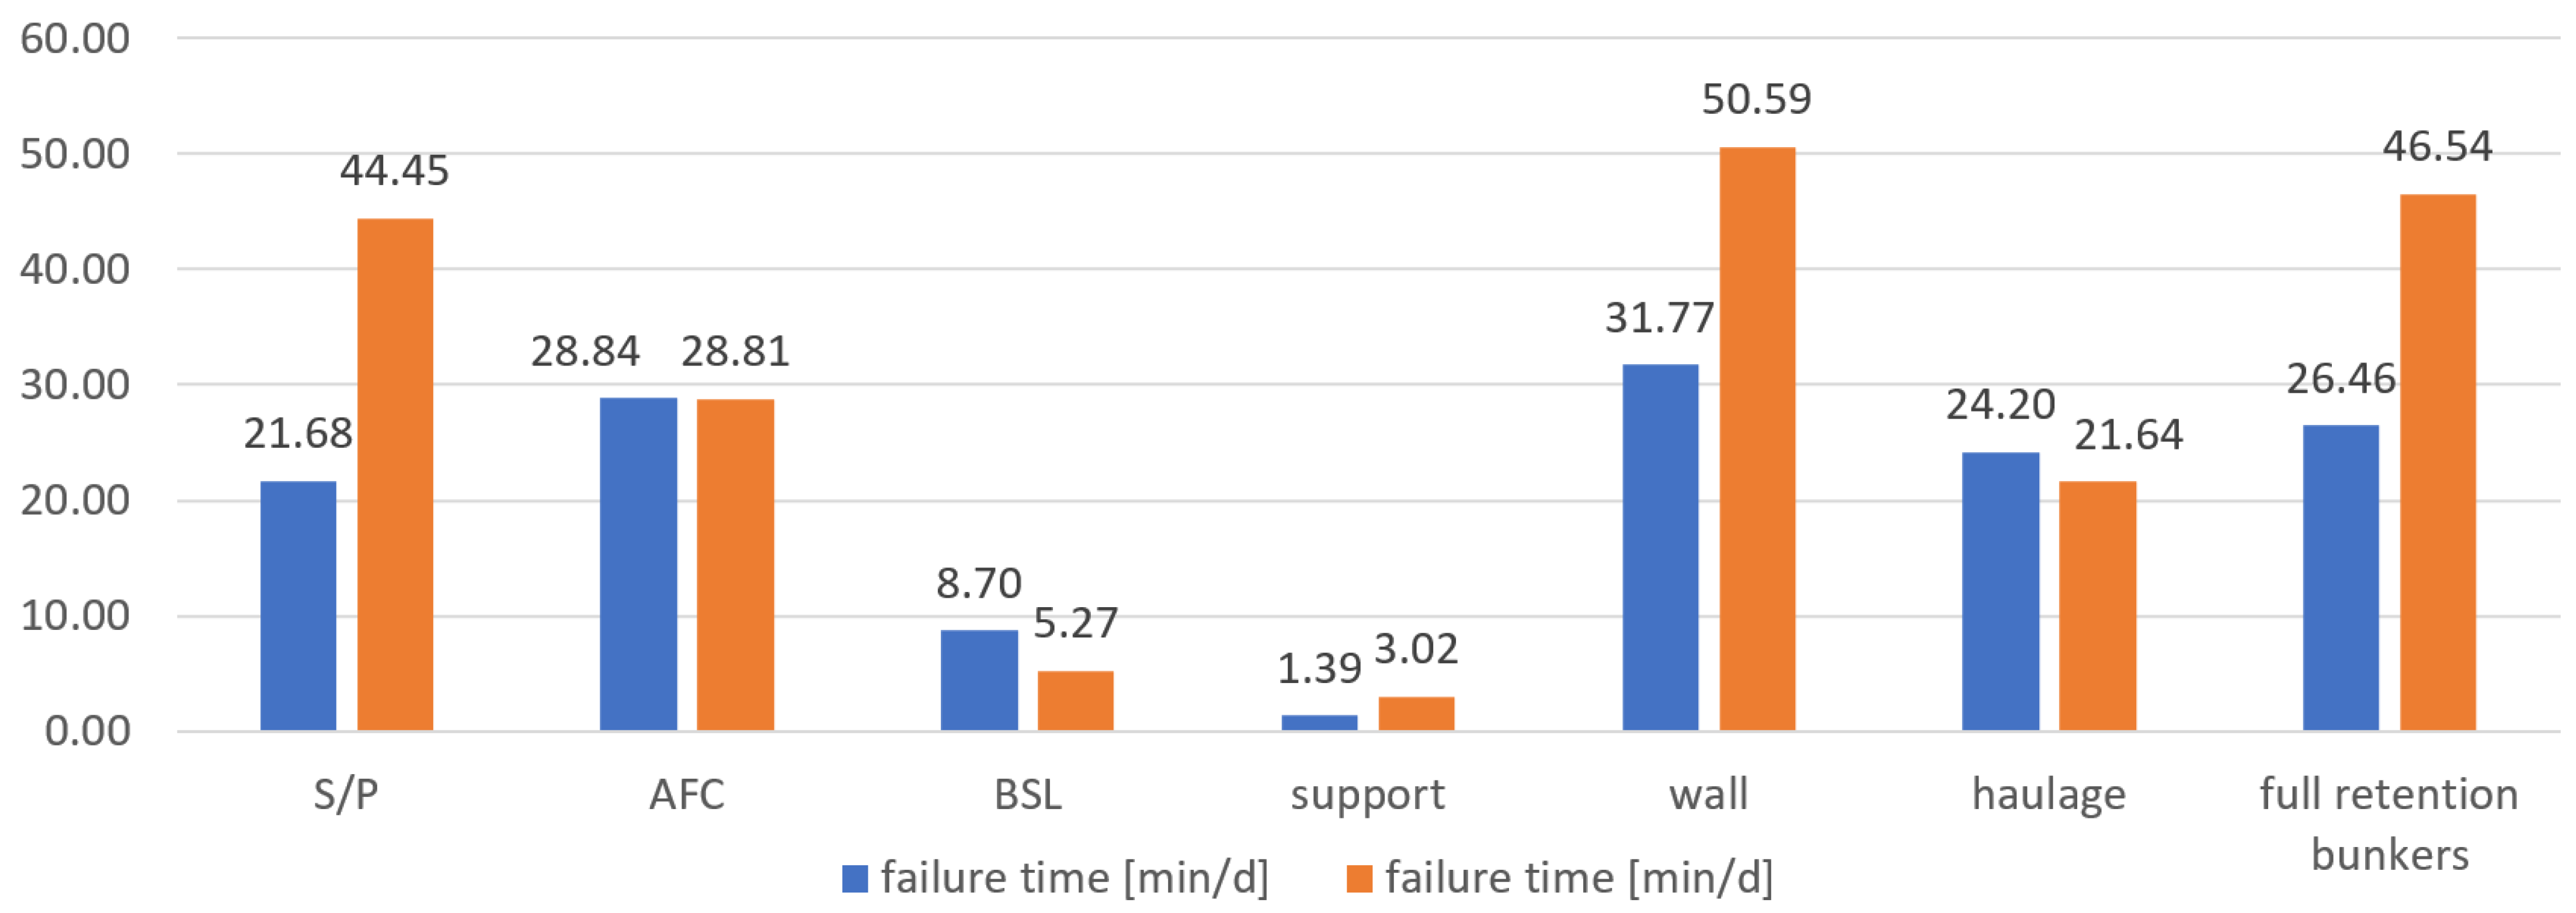
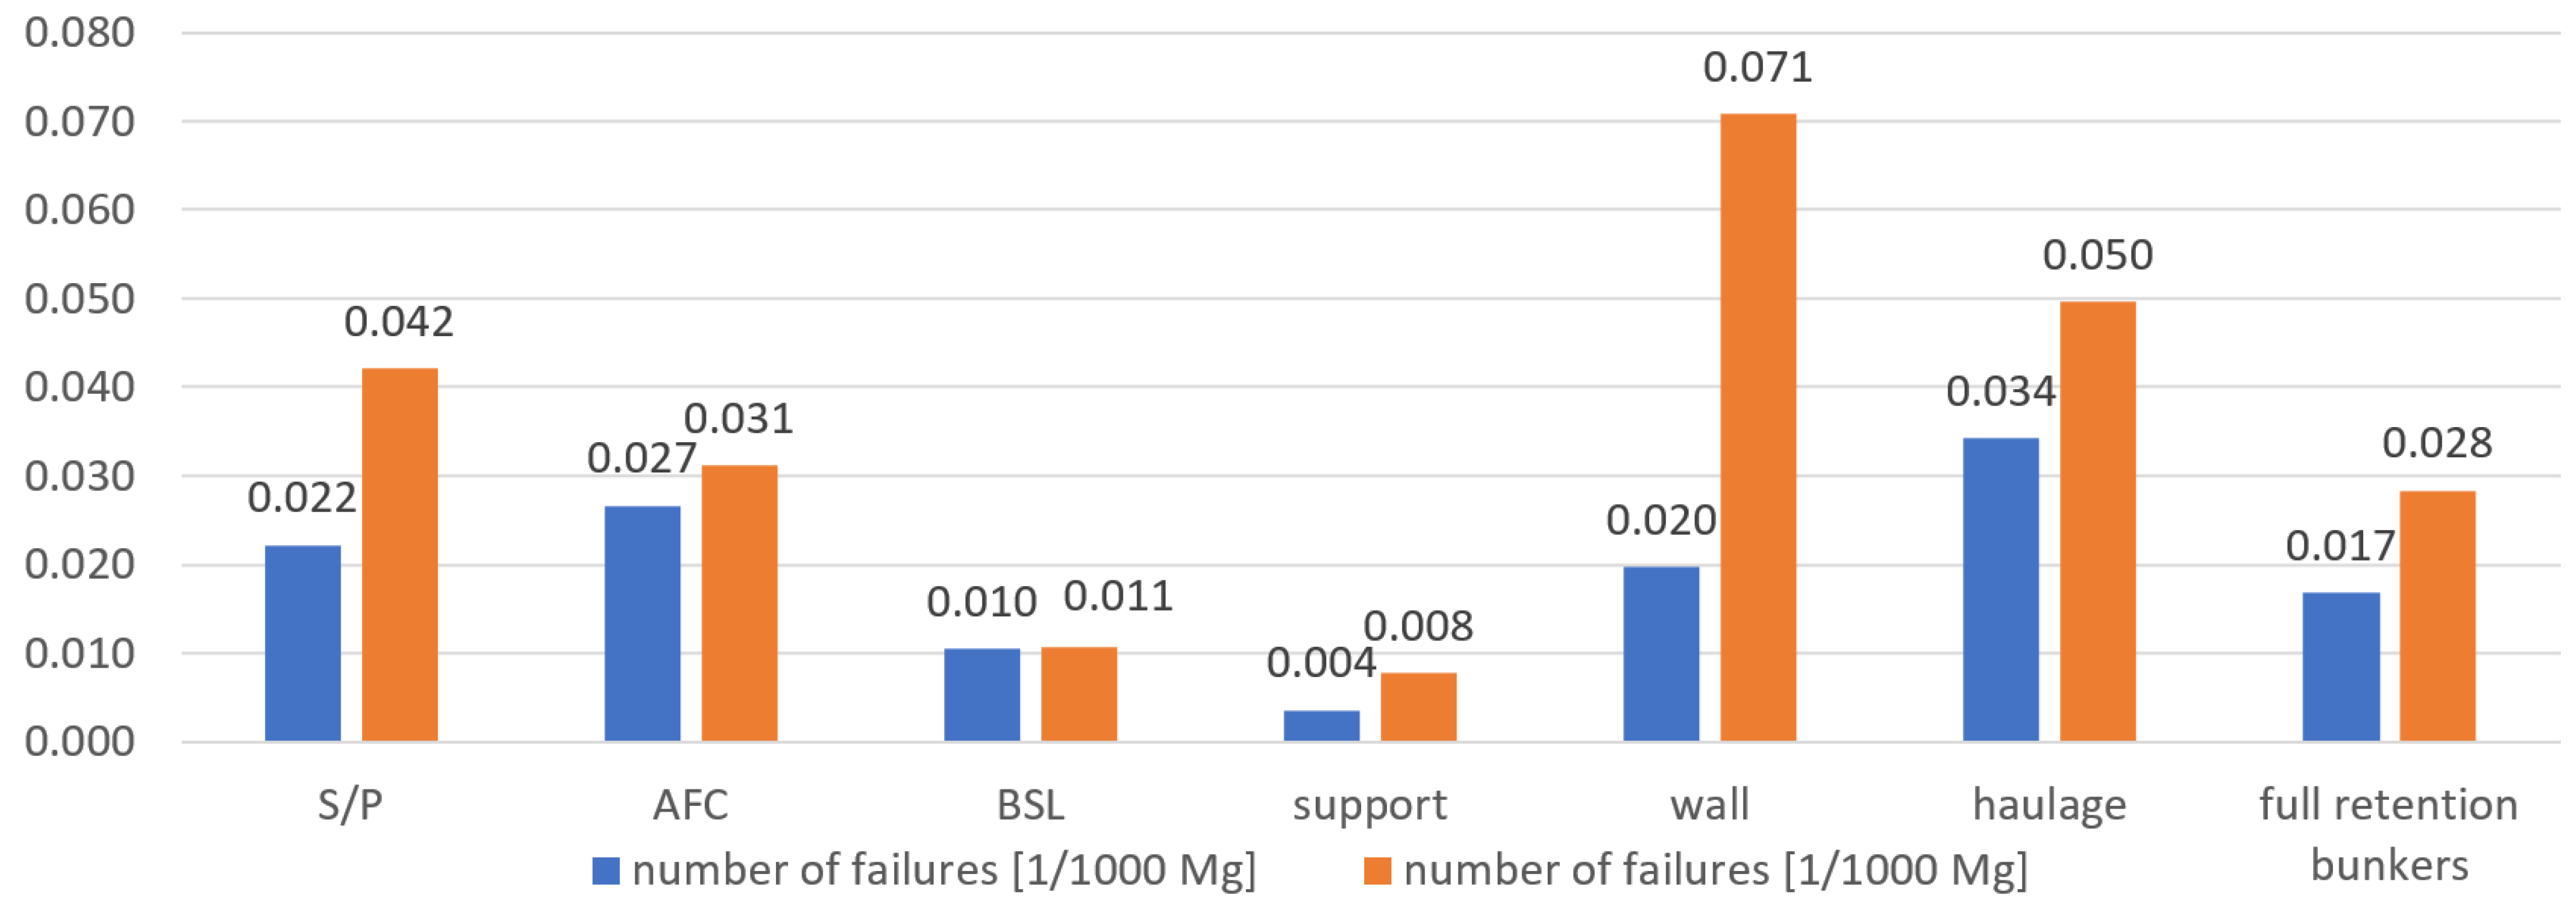
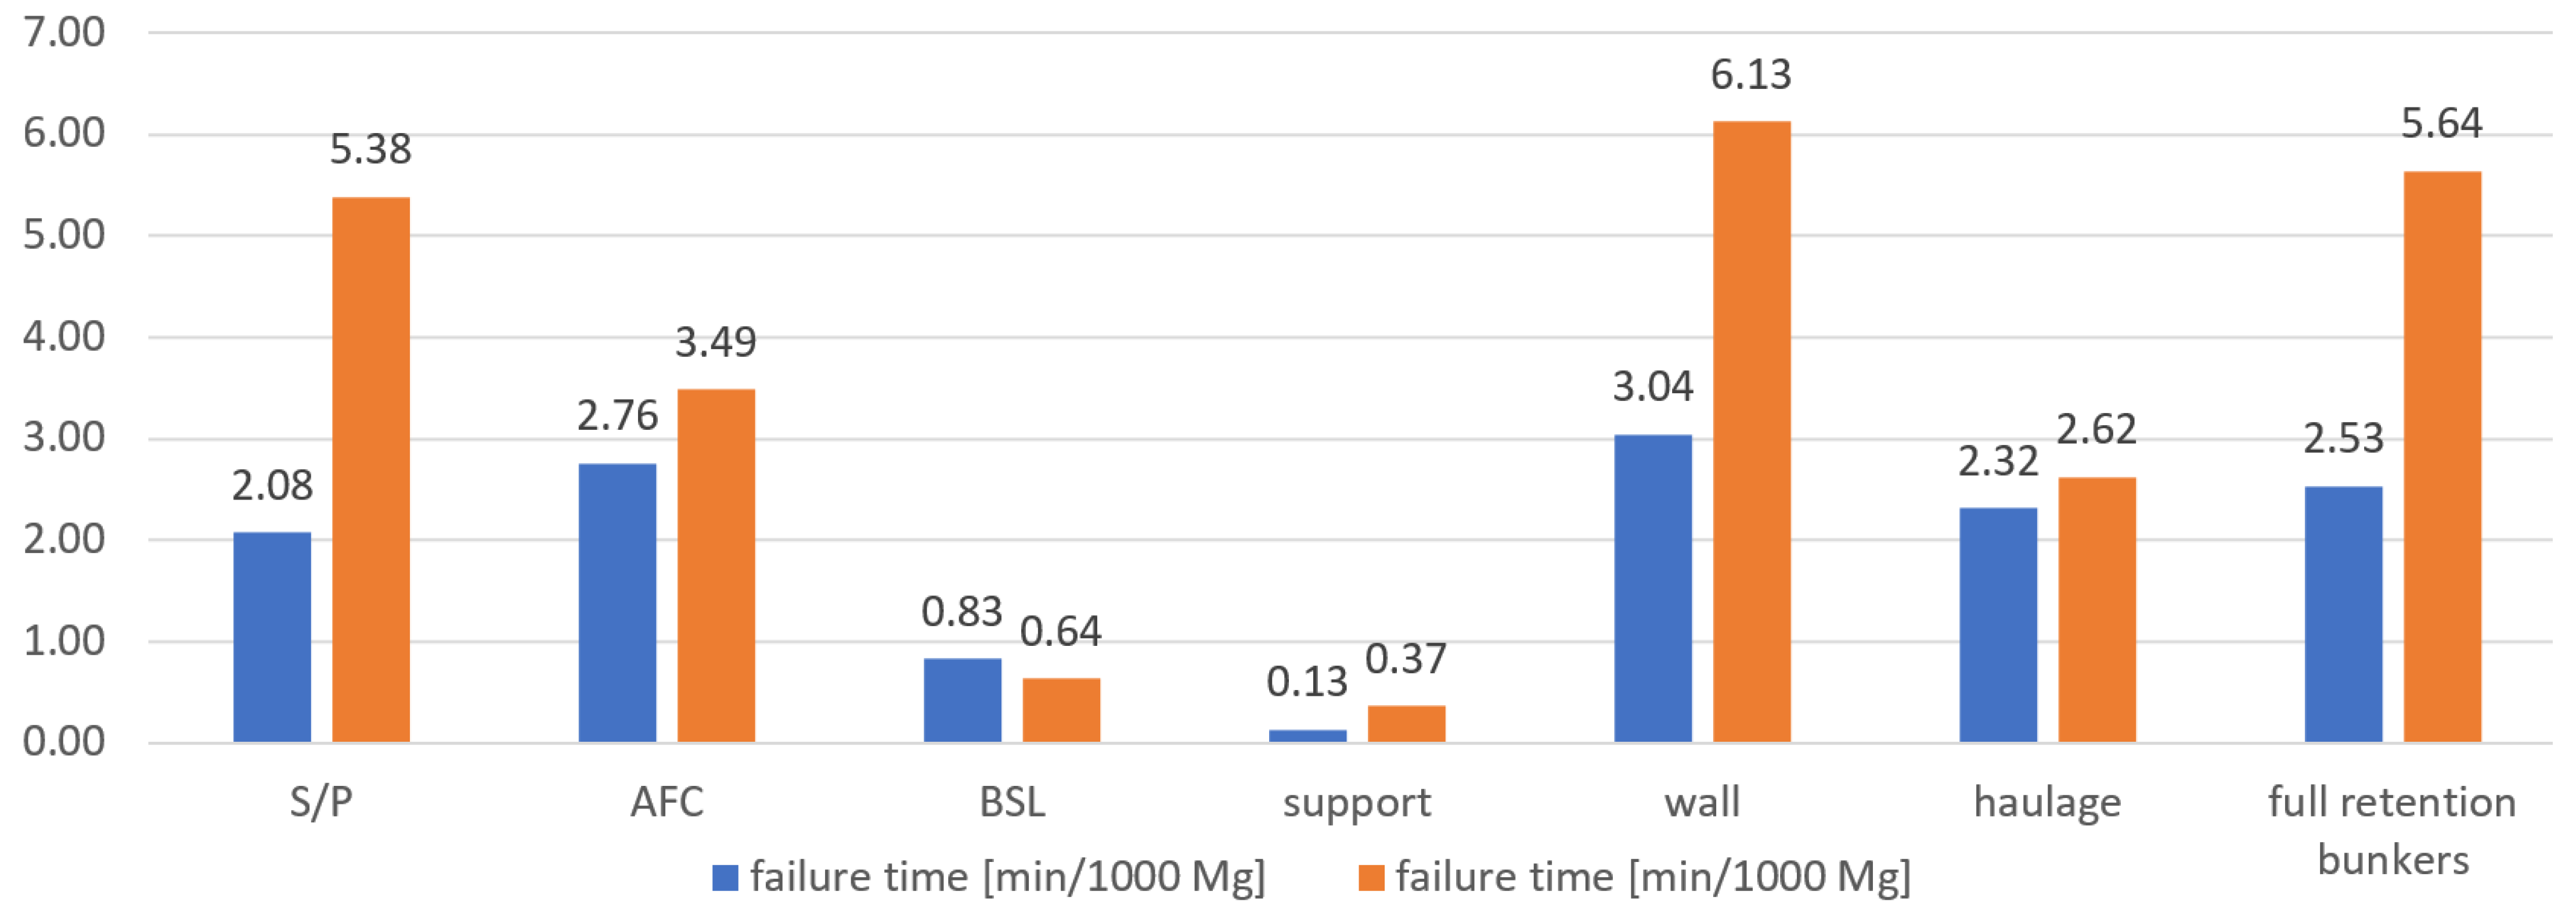
Individual indicators were successively calculated and are listed in Table 6. Next, bar charts comparing the failure rate of objects in shearer (S) and plow longwalls (P) were plotted. Additionally, the percentage failure rate of plow longwall objects in relation to the failure rate of shearer longwalls is given in the table. Positive values indicate a higher failure rate for the plow technique, and negative ones indicate a higher failure rate for the shearer technique. The summary analysis of all failures for subsequent objects is the most important element of the comparison of the two techniques. The following indicators were analysed:
  • number of failures per day—Figure 12;
  • duration of failures per day—Figure 13;
  • number of failures per 1000 Mg of excavated material—Figure 14;
  • failure duration per 1000 Mg of excavated material—Figure 15.

8. Conclusions

Machine availability is a key parameter in every company using a machine fleet. The accessibility of information about the failure rate of individual types of machines is of key importance in the process of making a purchase decision.
Mechanised shearer and plow systems are basic machines for the exploitation of hard coal deposited in the form of seams. Both techniques can be used for thin and medium-thickness seams. Each of the methods has some advantages and disadvantages. Despite numerous available studies on mechanised longwall systems, no comprehensive studies comparing the failure rates of both solutions have been published so far. Therefore, this work is a unique and valuable material. It should be clearly emphasised that the mining geological conditions in Polish mines are demanding and difficult; therefore, they provide a very good testing ground for mining machines. In the conducted research, both systems worked in the same mine, which guarantees the same organisational structure, the same technical level of the staff and very similar working conditions of the machines. It has to be stressed that at the LW Bogdanka mine, the same machine reporting procedures are applied for the entire plant.
A detailed analysis of the failure rates for objects characterised by the highest number of failures allowed for the formulation of a number of conclusions. It covered the objects whose failure rate may depend on the type of technique used. It was assumed that the analysis would enable us to determine whether the applied technique (shearer or plow) has an impact on the number and time of failures related not only to the mining machine itself, but also to the face conveyor, beam stage loader, longwall support, longwall downtime and haulage.
In this article, a comprehensive analysis of the failure rate of the shearer and plow longwalls at the LW Bogdanka mine is described. The analysis concerned 10 long-term mining longwalls. The failure rate was analysed as the total number of events and the total duration of events, as well as the average number and time of failures per day of longwall operation and per 1000 Mg of excavated material. Detailed analyses based on unique data were carried out. The obtained results challenge the current opinion about the advantage of plow systems over shearer ones in this respect. The conducted comparative analysis of the longwall failures indicates a noticeably higher failure rate of the longwalls equipped with plow systems.

Author Contributions

Z.R.: analysis of literature and state of knowledge; J.S.: planning and methodology of research; Ł.B., Z.R. and J.S.: implementation of research; J.S.: elaboration of research results; Ł.B.: analysis and interpretation of results; Ł.B.: elaboration of paper. All authors have read and agreed to the published version of the manuscript.

Funding

This research received no external funding.

Institutional Review Board Statement

Not applicable.

Informed Consent Statement

Not applicable.

Data Availability Statement

Data are contained within the article.

Acknowledgments

Many thanks to LW Bogdanka for providing materials, cooperation and enabling and supporting analysis.

Conflicts of Interest

The authors declare no conflict of interest.

References

  1. Bołoz, Ł. Longwall shearers for exploiting thin coal seams as well as thin and highly inclined coal seams. Min. Inform. Autom. Electr. Eng. 2018, 4, 59. [Google Scholar] [CrossRef]
  2. Bołoz, Ł. Unique project of single-cutting head longwall shearer used for thin coal seams exploitation. Arch. Min. Sci. 2013, 58, 1057–1070. [Google Scholar]
  3. Bołoz, Ł. Model tests of longwall shearer with string feed system. Arch. Min. Sci. 2018, 63, 61–74. [Google Scholar]
  4. Bołoz, Ł.; Castañeda, L. Computer-aided support for the rapid creation of parametric models of milling units for longwall shearers. Manag. Syst. Prod. Eng. 2018, 26, 193–199. [Google Scholar] [CrossRef]
  5. Bołoz, Ł. Interpretation of the results of mechanical rock properties testing with respect to mining methods. Acta Montan. Slovaca 2020, 25, 81–93. [Google Scholar]
  6. Kotwica, K.; Małkowski, P. Methods of Mechanical Mining of Compact-Rock—A Comparison of Efficiency and Energy Consumption. Energies 2019, 12, 3562. [Google Scholar] [CrossRef]
  7. Bołoz, Ł.; Biały, W. Automation and Robotization of Underground Mining in Poland. Appl. Sci. 2020, 10, 7221. [Google Scholar] [CrossRef]
  8. Kozłowski, A.; Bołoz, Ł. Design and Research on Power Systems and Algorithms for Controlling Electric Underground Mining Machines Powered by Batteries. Energies 2021, 14, 4060. [Google Scholar] [CrossRef]
  9. Bołoz, Ł.; Kozłowski, A. Methodology for Assessing the Stability of Drilling Rigs Based on Analytical Tests. Energies 2021, 14, 8588. [Google Scholar] [CrossRef]
  10. Hrinov, V.; Khorolskyi, A. Improving the process of coal extraction based on the parameter optimization of mining equipment. E3S Web Conf. 2018, 60, 17. [Google Scholar] [CrossRef]
  11. Jedliński, Ł.; Syta, A.; Gajewski, J.; Jonak, J. Nonlinear analysis of cylindrical gear dynamics under varying tooth breakage. Measurement 2022, 190, 110721. [Google Scholar] [CrossRef]
  12. Kotwica, K.; Stopka, G.; Kalita, M.; Bałaga, D.; Siegmund, M. Impact of Geometry of Toothed Segments of the Innovative KOMTRACK Longwall Shearer Haulage System on Load and Slip during the Travel of a Track Wheel. Energies 2021, 14, 2720. [Google Scholar] [CrossRef]
  13. Małkowski, P.; Ostrowski, Ł.; Stasica, J. Modeling of Floor Heave in Underground Roadways in Dry and Waterlogged Conditions. Energies 2022, 15, 4340. [Google Scholar] [CrossRef]
  14. Rak, Z.; Stasica, J.; Burtan, Z.; Chlebowski, D. Technical Aspects of Mining Rate Improvement in Steeply Inclined Coal Seams: A Case Study. Resources 2020, 9, 138. [Google Scholar] [CrossRef]
  15. Szurgacz, D.; Trzop, K.; Gil, J.; Zhironkin, S.; Pokorný, J.; Gondek, H. Numerical Study for Determining the Strength Limits of a Powered Longwall Support. Processes 2022, 10, 527. [Google Scholar] [CrossRef]
  16. Biały, W. Application of quality management tools for evaluating the failure frequency of cutter-loader and plow mining systems. Arch. Min. Sci. 2017, 62, 243–252. [Google Scholar]
  17. Skotnicka-Zasadzien, B.; Witold, B. An analysis of possibilities to use a pareto chart for evaluating mining machines’ failure frequency. Maint. Reliab. 2011, 3, 51–55. [Google Scholar]
  18. Zasadzień, M. Using the Pareto diagram and FMEA (Failure Mode and Effects Analysis) to identify key defects in a product. Manag. Syst. Prod. Eng. 2014, 4, 153–156. [Google Scholar]
  19. Zasadzien, M.; Midor, K. Innovative application of quality management tools in a hard coal mine. In Proceedings of the Science and Technologies in Geology, Exploration and Mining SGEM 2015, Albena, Bulgaria, 16–25 June 2015; pp. 415–422. [Google Scholar]
  20. Brodny, J.; Tutak, M. Applying Sensor-Based Information Systems to Identify Unplanned Downtime in Mining Machinery Operation. Sensors 2022, 22, 2127. [Google Scholar] [CrossRef]
  21. Brodny, J.; Tutak, M.; Michalak, M. The Use of the TGŚP Module as a Database to Identify Breaks in the Work of Mining Machinery. In International Conference: Beyond Databases, Architectures and Structures, in Communications in Computer and Information Science; Springer: Berlin/Heidelberg, Germany, 2017; Volume 716. [Google Scholar]
  22. Brodny, J.; Tutak, M.; Michalak, M. A Data Warehouse as an Indispensable Tool to Determine the Effectiveness of the Use of the Longwall Shearer. In International Conference: Beyond Databases, Architectures and Structures, in Communications in Computer and Information Science; Springer: Berlin/Heidelberg, Germany, 2017; Volume 716. [Google Scholar]
  23. Elevli, S.; Elevli, B. Performance Measurement of Mining Equipments by Utilizing OEE. Acta Montan. Slovaca 2010, 15, 95–101. [Google Scholar]
  24. Lanke, A.A.; Hoseinie, S.H.; Ghodrati, B. Mine production index (MPI)-extension of OEE for bottleneck detection in mining. Int. J. Min. Sci. Technol. 2016, 26, 753–760. [Google Scholar] [CrossRef]
  25. Paithankar, A.; Chatterjee, S. Forecasting time-to-failure of machine using hybrid Neuro-genetic algorithm—A case study in mining machinery. Int. J. Min. Reclam. Environ. 2018, 32, 182–195. [Google Scholar] [CrossRef]
  26. Król, R.; Zimroz, R.; Stolarczyk, L. Failure analysis of hydraulic systems used in mining machines operating in copper ore mine KGHM Polska Miedz S.A. Min. Sci. 2009, 128, 127–139. [Google Scholar]
  27. Antosz, K.; Stadnicka, D. Evaluation measures of machine operation effectiveness in large enterprises: Study results. Maint. Reliab. 2015, 17, 107–117. [Google Scholar] [CrossRef]
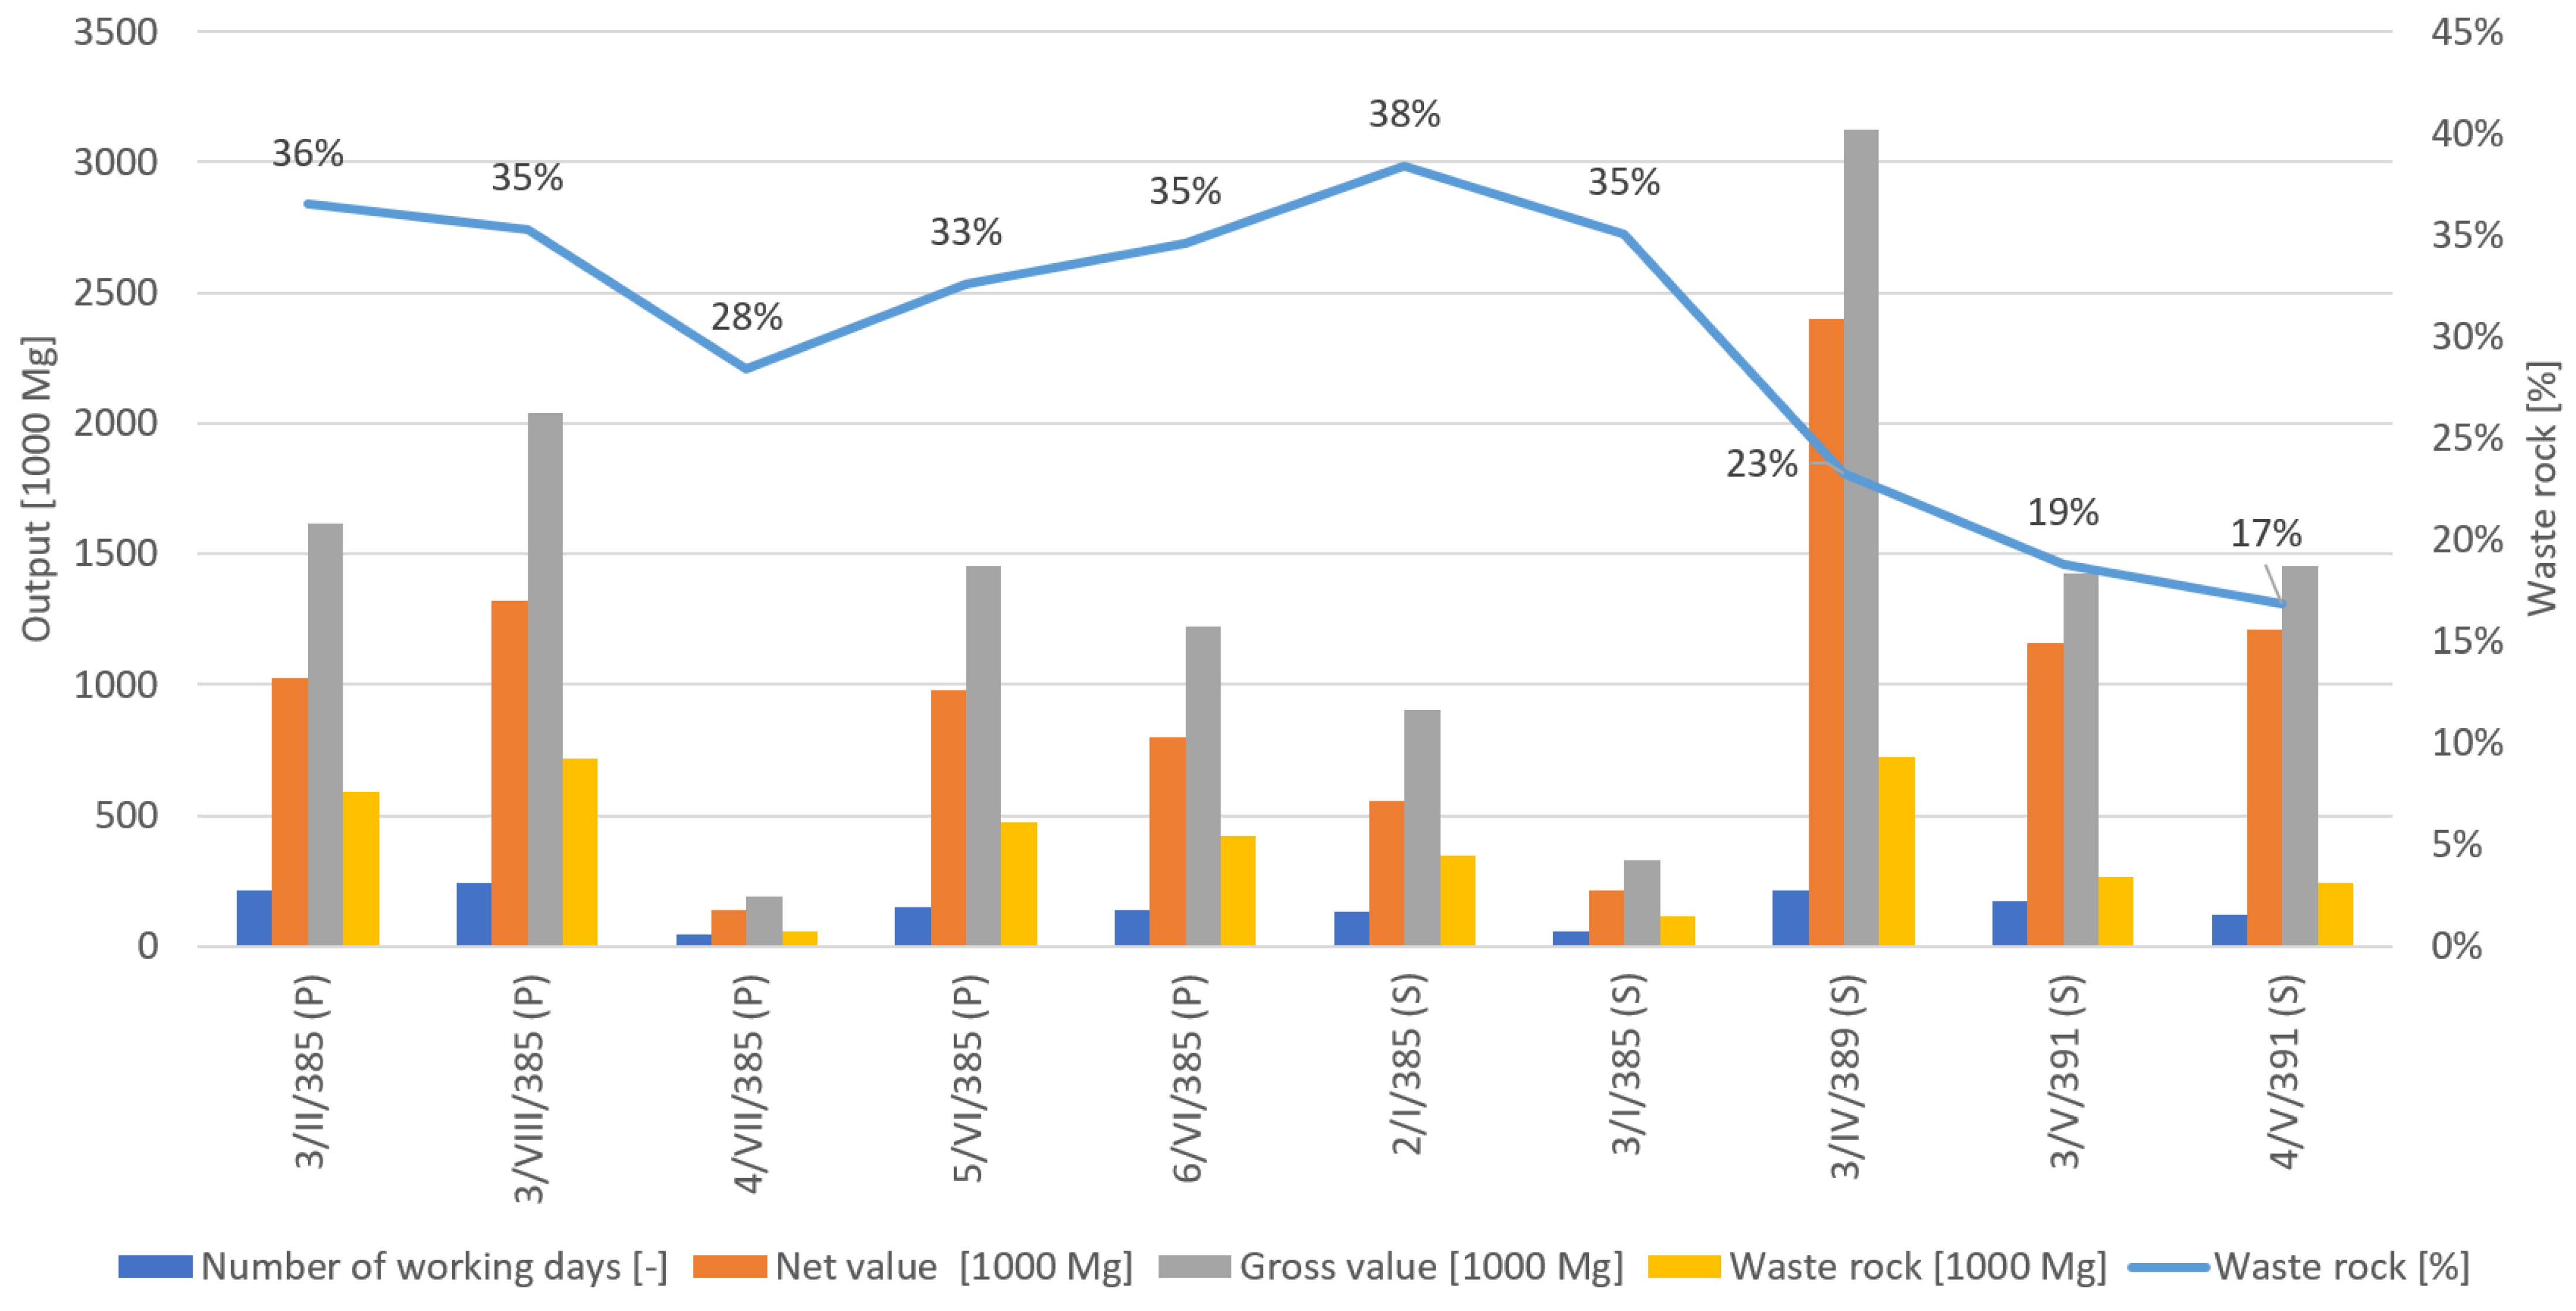
Figure 1. Total output and waste rock share for individual longwalls.
Energies 15 06170 g001
Figure 2. Summary of the daily output and total working time for longwalls in the analysed period of time.
Energies 15 06170 g002
Figure 3. Total duration, number and average duration of mining, electrical and mechanical failures.
Energies 15 06170 g003
Figure 4. Number of failures and average duration of failures of shearer longwalls in total.
Energies 15 06170 g004
Figure 5. Duration of failures and average duration of failures of shearer longwalls in total.
Energies 15 06170 g005
Figure 6. Pareto chart for the total number of shearer longwall failures.
Energies 15 06170 g006
Figure 7. Pareto chart for the total duration of shearer longwall failures.
Energies 15 06170 g007
Figure 8. Number of failures and average duration of failures of plow longwalls in total.
Energies 15 06170 g008
Figure 9. Duration of failures and average duration of failures of plow longwalls in total.
Energies 15 06170 g009
Figure 10. Pareto chart for the total number of plow longwall failures.
Energies 15 06170 g010
Figure 11. Pareto chart for the total failure time/duration of failures of plow longwalls.
Energies 15 06170 g011
Figure 12. Comparison the total number of failures per one day of longwall operation.
Energies 15 06170 g012
Figure 13. Comparison of the total duration of failures per one day of longwall operation.
Energies 15 06170 g013
Figure 14. Comparison of the total number of failures per 1000 Mg of excavated material.
Energies 15 06170 g014
Figure 15. Comparison of the total failure duration per 1000 Mg of excavated material.
Energies 15 06170 g015
Table 1. List of parameters of the analysed longwalls in the LW Bogdanka mine.
ItemSectionLongwallTechniqueMining MachineDeposit Thickness [m]Longwall Length [m]Panel Length [m]
1G-13/II/385PlowGH1600 CAT41.20–1.703141640
2G-43/VIII/385PlowGH1600 CAT21.40–2.003053395
3G-44/VII/385PlowGHH1600 CAT31.35–1.953054634
4G-65/VI/385PlowGH1600 CAT3+21.10–1.803041820
5G-66/VI/385PlowGH1600 CAT3+21.40–2.003051600
6G-52/I/385ShearerJOY 4LS31.40–1.903181600
7G-53/I/385ShearerJOY 4LS31.40–2.103181640
8G-33/IV/389ShearerJOY 4LS221.40–2.702962410
9G-23/V/391ShearerJOY 4LS221.90–2.703102450
10G-24/V/391ShearerJOY 4LS221.90–2.703111810
Table 2. Failure rates of shearer and plow systems.
TotalMiningElectricalMechanical
ShearerPlowShearerPlowShearerPlowShearerPlow
Number of failures [-]99015995511107267354169132
Failure duration [min]100,137160,66566,95612,268417,93622,21915,16015,427
Average duration of failure [min]101100122111676390117
Number of failures [%]38.2%61.8%33.2%66.8%43.0%57.0%56.1%43.9%
Failure time [%]38.4%61.6%35.3%64.7%44.7%55.3%49.6%50.4%
Number of failures [1/d]1.432.020.791.400.380.450.240.17
Failure time [min/d]144.3203.496.5155.325.828.121.819.5
Number of failures [1/thous. Mg]0.1370.2450.0760.1700.0370.0540.0230.020
Failure time [min/thous. Mg]13.824.69.218.82.53.42.12.4
Table 3. Percentage of failures in plow longwalls in relation to shearer longwalls.
IndicatorTotalMiningElectricalMechanical
Number of failures [1/d]42%76%16%−31%
Failure duration [min/d]41%61%9%−11%
Number of failures [1/thous. Mg]79%123%47%−13%
Failure duration [min/thous. Mg]78%104%38%13%
Table 4. Information on the time and number of failures of shearer longwalls.
WallLongwall ShearerAFCBSLSupportHaulageFull Retention BunkersMobile Tail PieceCrusherShaftAir-ConditioningRoadheader
Number of failures [-]143161193762624812244334
Failure time [min]22,04715,04320,012604096516,79718,36321014513070230
Average time [min]154931047937681515336432358
Number of failures [%]14.5%16.3%19.6%7.7%2.6%25.1%12.4%0.4%0.4%0.3%0.3%0.4%
Failure time [%]22.0%15.0%20.0%6.0%1.0%16.8%18.4%0.2%0.1%0.1%0.1%0.2%
Number of failures [1/d]0.210.230.280.110.040.360.180.010.010.000.000.01
Failure time [min/d]31.821.728.88.71.424.226.50.30.20.20.10.3
Number of failures [1/thous. Mg]0.0200.0220.0270.0100.0040.0340.0170.0010.0010.0000.0000.001
Failure time [min/thous. Mg]3.02.12.80.80.12.32.50.00.00.00.00.0
Table 5. Summary of information on the time and number of failures in plow longwalls.
WallPlowAFCBSLSupportHaulageFull-Retention BunkersMobile Tail PieceCrusherShaftAir ConditioningRoadheader
Number of failures [-]4622752037051324185313214
Failure time [min]39,96835,11422,7604160238917,09436,770135685610100545
Average time [min]871281125947531994553305100136
Number of failures [%]29.0%17.3%12.7%4.4%3.2%20.3%11.6%0.2%0.8%0.1%0.1%0.3%
Failure time [%]24.9%21.9%14.2%2.6%1.5%10.7%22.9%0.1%0.4%0.4%0.1%0.3%
Number of failures [1/d]0.580.350.260.090.060.410.230.000.020.000.000.01
Failure time [min/d]50.644.428.85.33.021.646.50.20.90.80.10.7
Number of failures [1/thous. Mg]0.0710.0420.0310.0110.0080.0500.0280.0000.0020.0000.0000.001
Failure time [min/thous. Mg]6.15.43.50.60.42.65.60.00.10.10.00.1
Table 6. Comparison of the total failure rates for shearer (S) and plow (P) longwalls.
S/PAFCBSLSupportWallHaulageFull-Retention Bunkers
Number of failures [1/d]S0.230.280.110.040.210.360.18
P0.350.260.090.060.580.410.23
%50%−8%−19%72%184%15%33%
Failure time [min/d]S21.6828.848.701.3931.7724.2026.46
P44.4528.815.273.0250.5921.6446.54
%105%0%−39%117%59%−11%76%
Number of failures [1/thous. Mg]S0.0220.02700100.0040.0200.0340.017
P0.0420.0310.0110.0080.0710.0500.028
%90%17%2%118%259%45%68%
Failure time [min/thous. Mg]S2.082.760.830.133.042.322.53
P5.383.490.640.376.132.625.64
%159%26%−23%175%101%13%122%
Publisher’s Note: MDPI stays neutral with regard to jurisdictional claims in published maps and institutional affiliations.