Article

Effects of Solubilizer and Magnetic Field during Crystallization Induction of Ammonium Bicarbonate in New Ammonia-Based Carbon Capture Process

1
School of Energy Science and Engineering, Harbin Institute of Technology, Harbin 150001, China
2
School of Mechatronics Engineering, Harbin Institute of Technology, Harbin 150001, China
3
School of Chemical Engineering and Technology, Harbin Institute of Technology, Harbin 150001, China
*
Author to whom correspondence should be addressed.
Energies 2022, 15(17), 6231; https://doi.org/10.3390/en15176231
Submission received: 5 August 2022 / Revised: 23 August 2022 / Accepted: 24 August 2022 / Published: 26 August 2022
(This article belongs to the Special Issue Carbon Dioxide Capture, Utilization and Storage (CCUS))

Abstract

:
As a chemical absorption method, the new ammonia carbon capture technology can capture CO2. Adding ethanol to ammonia can reduce the escape of ammonia to a certain extent and increase the absorption rate of CO2. The dissolution and crystallization of ethanol can realize the crystallization of ammonium bicarbonate and generate solid products. The induction of the crystallization process is influenced by many parameters, such as solution temperature, supersaturation, and solvating precipitant content. The basic nucleation theory is related to the critical size of nucleation. Accurate measurement of the induction period and investigating relevant factors can help to assess the nucleation kinetics. The effects of solubilizer content, temperature, and magnetic field on the induction period of the crystallization process of ammonium bicarbonate in the ethanol–H2O binary solvent mixture and determining the growth mechanism of the crystal surface by solid–liquid surface tension and surface entropy factor are investigated. The results indicate that under the same conditions of mixed solution temperature, the crystallization induction period becomes significantly longer, the solid–liquid surface tension increases, and the nucleation barrier becomes more significant and less likely to form nuclei as the content of solvating precipitants in the components increases. At the same solubilizer content, there is an inverse relationship between the solution temperature and the induction period, and the solid–liquid surface tension decreases. The magnetic field can significantly reduce the induction period of the solvate crystallization process. This gap tends to decrease with an increase in supersaturation; the shortening reduces from 96.9% to 84.0%. This decreasing trend becomes more and more evident with the rise of solvent content in the solution. The variation of surface entropy factor under the present experimental conditions ranges from 0.752 to 1.499. The growth mode of ammonium bicarbonate in the ethanol–H2O binary solvent mixture can be judged by the surface entropy factor as continuous growth.

1. Introduction

As the primary source of greenhouse gas in recent years, CO2 affects the living environment of humans. Carbon capture and storage (CCS) technology is considered the most economical and feasible way to reduce greenhouse gas emissions and slow down global warming on a large scale in a short period of the future. The new ammonia-based carbon capture technology using ammonia water as an absorbent is essentially a liquid-phase CO2 capture technology of chemical absorption. It is one of the most potent ways to effectively achieve large-scale CO2 emission reduction [1,2,3,4].
Since the new absorbent ammonia was proposed, many researchers have explored the reaction mechanism, absorption, and regeneration law of ammonia decarbonization with various reaction devices and processes [5,6,7,8,9]. The CCS technology route for industry contains pre-combustion decarbonization, oxygen-enriched combustion, chemical chain combustion, and post-combustion decarbonization [10]. For conventional coal-fired power plant units, the flue gas volume is about 4 × 10⁵ to 5 × 10⁵ Nm3/h per 100 MW unit, with a CO2 concentration of about 8% to 16% in the main composition and the rest containing 4% to 10% O2, 70% to 75% N2, 4% to 6% H2O, and some micro/trace components. The post-combustion CO2 capture technology is the most mature, complete, applicable to most industrial plants, and easy to retrofit. Chemical absorption, the most feasible post-combustion carbon capture technology, shows great promise for industrial applications. Currently, the primary industrial method is alcohol-amine solution ethanolamine (MEA) absorption. Still, in the practical application, there are many insurmountable problems such as high energy consumption for regeneration, severe equipment corrosion, and easy solvent volatilization and decomposition [11]. The ideal CO2 chemical absorbent should have a high CO2 absorption rate, low reaction heat, low corrosiveness, low viscosity, low degradation rate, low raw material price, and environmental friendliness. Therefore, ammonia decarbonization technology was probably one of the most likely technologies to be applied to industrial large-scale post-combustion carbon capture. Compared with MEA, the ammonia solution as a CO2 absorber has many advantages [12,13]: CO2 solid absorption capacity, low heat of absorption reaction, low degradation by O2 in flue gas, low corrosiveness, and low raw material price, which helps to form an integrated system of energy gradient utilization and integrated removal of multiple pollutants. At the same time, its by-products also have some agricultural utilization value. In a typical post-combustion ammonia decarbonization system flow, the typical existing processes of this technology are as follows: the Alstom frozen ammonia process mainly uses ammonium carbonate and ammonium bicarbonate mixed slurry as recycled absorbent and can achieve an absorption capacity of up to 1.2 kg CO2/kg NH3 and its removal rate is as high as 90% with regeneration energy consumption of only 1.0 GJ/t CO2 [2]. The Powerspan ECO2 process does not require cooling like the CAP method, and the ECO2 pilot plant has a power loss of only 16% and energy consumption of 1.1 GJ/t CO2, which is only 27% of the energy consumption of the MEA method and can achieve a removal efficiency of more than 90% [14]. The CSIRO ammonia process in Australia has an absorption temperature of 15–30 °C; ammonia concentration below 6 wt.%; carbon burden of the lean liquor between 0.2 and 0.4; CO2 removal efficiency of more than 85% [15]. The new ammonia carbon capture technology is promising, and the addition of ethanol can reduce the ammonia escape to a certain extent and increase the rate of CO2 absorption, among other advantages. The application of this technology for industry is reflected in the mixture of CO2 and ammonia to produce ammonium bicarbonate, which can provide a new way to produce ammonium fertilizer by solubilization and crystallization. It can also be coupled with sucrose production to synthesize nitrogen fertilizer. The new ammonia carbon capture technology can provide a new way to synthesize nitrogen fertilizer and other similar fertilizers, and can also be used for industrial applications in industries such as agricultural products and heating and power generation.
The induction period and metastable zone width are two essential parameters in the crystal nucleation process and play an important role in the crystallization process and the design of the crystallizer [16,17,18]. The core process of ammonium bicarbonate dissolution and crystallization in the new ammonia-based carbon capture system is the crystallization of ammonium bicarbonate. Nucleation has a significant impact on crystallization products. Improper operation easily causes problems such as small particle size, wide particle size distribution, and poor fluidity [19,20,21], which affect the application of the overall carbon capture process. Therefore, it is necessary to systematically study the induction period of the ammonium bicarbonate crystallization process.
The induction period can be generally divided into several parts. The relaxation time tr requires for the system to reach the quasi-steady state of the molecular cluster. The time tn is required to form a stable nucleus and the growth time tg is required for the nucleus to grow to the size detected by the detection device [22,23,24]. The length of the induction period mainly depends on the supersaturation of the solution. The larger the supersaturation of the solution is, the shorter the induction time. When the magnitude of supersaturation tends to the middle line of the first metastable zone and the second metastable zone, the induction period is more significant. If the supersaturation is in the first metastable zone and no crystalline seed is added, no crystals are produced [23,25].
In the crystallization process, the degree of influence of the solution itself and external forces on the degree of supersaturation is usually explored. Then the degree of supersaturation is controlled in the appropriate metastable zone to shorten the induction period while obtaining crystalline products with larger and more uniform particle sizes [26,27,28]. Maheswata Lenka et al. [19] systematically studied the induction period and the width of the metastable zone of cooling crystallization of l-aspartic acid hydrate, the variation of the induction period at different temperatures and in the range of supersaturation, and the resulting calculation of parameters such as surface tension and critical nucleation. You et al. [29] measured the metastable zone and induction period of the crystallization process of aluminum ammonium sulfate in water by the aggregated laser reflectivity method. The effect of temperature and supersaturation on the induction period was systematically investigated. The mechanism of primary homogeneous phase nucleation with liquid surface energy was determined using Sangwal’s classical three-dimensional nucleation method. Wang et al. [30] systematically measured the induction period and the width of the metastable zone of sodium vanadate crystallization in NaOH at different temperatures using laser scattering and analyzed the effects of NaOH concentration, supersaturation, stirring rate, cooling rate, and other influencing factors on the induction period, and determined the primary nucleation kinetics from the results of the induction period and metastable zone. Feng et al. [1] investigated the process of CO2 mass transfer in an amine absorption reactor under the action of a static magnetic field. They elucidated that ammonia as an absorbent can lead to effective mass transfer in CO2 absorption that the addition of an external influencing factor, the static magnetic field, can enhance the facilitation of the mass transfer process, and that the facilitation of the static magnetic field is more pronounced for low concentration CO2 absorption mass transfer.
In summary, it can be seen that the solution temperature, ultrasound, solubilizer content, magnetic field, and other factors influence the supersaturation of the induction period of the crystallization process. The induction period can calculate the nucleation rate, and accurate measurement can provide essential parameters for assessing the crystallization kinetics. There is no report on the induction period of the crystallization process of ammonium bicarbonate in the ethanol–H2O binary solvent mixture in the new ammonia carbon capture system. Therefore, this paper mainly studies the influence factors of the induction period of ammonium bicarbonate crystallization in the ethanol–H2O binary solvent mixture, investigates the influence of the ethanol content of the solvating agent and the magnetic field on the induction period, and determines the growth mechanism of crystal surface by calculating the solid–liquid surface tension and surface entropy factor. The relevant characteristics of nucleation and the growth of the ammonium bicarbonate crystallization process in ethanol–H2O binary mixed solvent, which has important guiding significance for the selection of temperature and solvent ratio in the core process of ammonium bicarbonate crystallization in the new ammonia carbon capture system, are investigated.

2. Materials and Methods

2.1. Experimental Chemicals

The drugs used in the experimental procedure to determine the crystallization induction period are shown in Table 1.

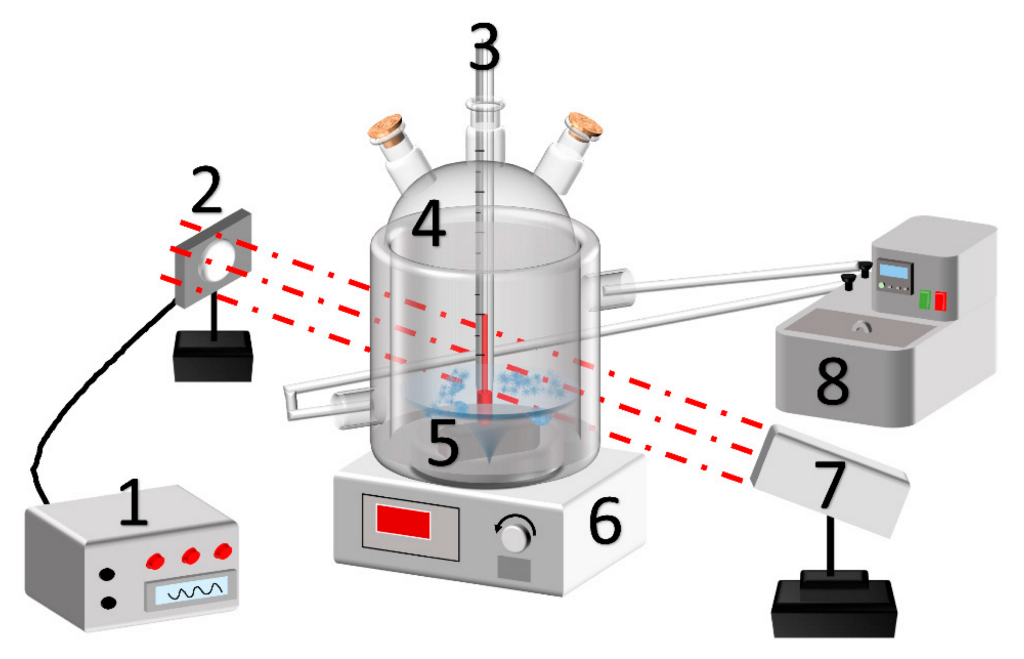
2.2. Experimental System

The experimental setup used during the experiment is shown in Figure 1. The photoelectric transmitter emits laser light, the laser receiver receives laser light, and the recorder converts the received optical signal into an electrical signal and outputs the relevant information. The glass jacketed crystallizer serves as the core reactor for the reaction with an inner diameter of 10 cm and a height of 12.0 cm. A super thermostatic water bath with a temperature control accuracy of ±0.1 °C is used to control the temperature of the induction phase process in the dissolver. A magnetic stirrer powers the magnetic stirring rotor and provides a specific stirring rate for the solution in the dissolver. A precision thermometer is used to record the temperature changes of the reaction process in the dissolver.

2.3. Experimental Steps

The steps for the determination of crystallization induction of ammonium bicarbonate in ethanol–H2O binary solvent are as follows: (a) Accurately weigh a certain mass of solute, configure a certain solvent ratio of mixed solvent, dissolve the weighed solute in the mixed solvent, and prepare the solution at a specific temperature. (b) Add the prepared solution into the crystallizer, turn on the super thermostat water bath, turn on the photoelectric emitter and the receiver, set a specific stirring rate, and preheat for 30 min. (c) Pour a certain amount of reaction solvent with the same set temperature into the crystallizer quickly, and start the recorder simultaneously. (d) Stop the recorder when there is a sudden change in the data displayed by the receiver. At this time, the data displayed by the recorder is the experimental data of the crystallization induction period. (e) Adjust the temperature and composition of the reaction solvent, adjust the operating conditions, and measure the induction period under each working condition. (f) Cycle the above experimental steps to obtain the induction periods under different supersaturation, temperature, and solvent composition.

2.4. Analytical Methods

The induction period can be expressed by Equation (1):
t i n d = t r + t n + t g
According to the crystal nucleation theory, it is known that the solid–liquid surface tension mainly expresses the physical properties of crystals, and the crystal nucleation mechanism is primarily determined by the solid–liquid surface tension [31,32,33]. Meanwhile, the solid–liquid surface tension is an essential thermodynamic parameter for the optimization process of the solvation and precipitation crystallization process, as well as for describing the nucleation of primary crystals and the crystal growth process [34,35]. Homogeneous nucleation can be generated only by overcoming the nuclear energy barrier, and the free energy required in the crystal nucleation process can be calculated using the following equation [36,37,38]:
Δ G = ( K A i 2 3 v 2 3 γ ) K V + i V k T ln S
When the change in free energy satisfies d ( Δ G ) d i = 0 , it is determined that a critical nucleus is formed [39]. The minimum number of molecules required to form a critical nucleus can be obtained and expressed as icr, and the minimum size to form a critical nucleus can be defined as rcr.
r c r = ( 2 K A v γ ) ( 3 K V V k T ln S )
i c r = [ 2 K A v 2 3 γ 3 K V 2 3 V k T ln S ] 3
Δ G = 4 K a 3 v γ 3 27 K V 2 V 2 k 2 T 2 ln 2 S
For spherical particles, the above equation can be simplified to [40]:
Δ G c r = 16 π v 2 γ 3 3 k 2 T 2 ln 2 S
Using the induction periods obtained for different supersaturation solution conditions, we can get the surface tension, which can be obtained by Equation (7) [41]:
ln τ = ln B + Δ G c r k T
In the equation, T is the solution temperature, ΔGcr is the critical nucleation free energy change, B is a constant, and k is the Boltzmann constant. Bringing (6) into (7), the following equation is obtained:
ln τ = ln B + 16 π γ 3 v 2 3 k 3 T 3 ln 2 S
lnτ is linearly related to 1/ln2S [42], and the solid–liquid surface tension can be obtained by calculating the slope of the straight line [25,43].
The surface entropy factor is defined as:
f = ε Δ H m R T
In the equation, ΔHm denotes the heat of melting, and ε denotes the surface anisotropy factor.
The smoothness of the crystal surface follows with the increase in the surface entropy factor. As the smoothness of the crystal surface increases with the rise of the surface entropy factor, the growth rate of the crystal decreases and the crystal growth at this time belongs to helical dislocation-type growth [44,45,46]. Conversely, when the surface entropy factor is low, the growth rate of the crystal surface is faster when the crystal exhibits reduced surface smoothness and when the growth satisfies the continuum-type growth mode [47,48]. However, if we follow Equation (9), calculating the surface entropy factor is difficult to achieve, so we need to simplify this equation. Barata et al. [49] proposed to predict the surface entropy factor in terms of molecular volume v, temperature, and solid–liquid surface tension γ, three variables.
f = 4 v 2 3 γ k T

3. Results and Discussion

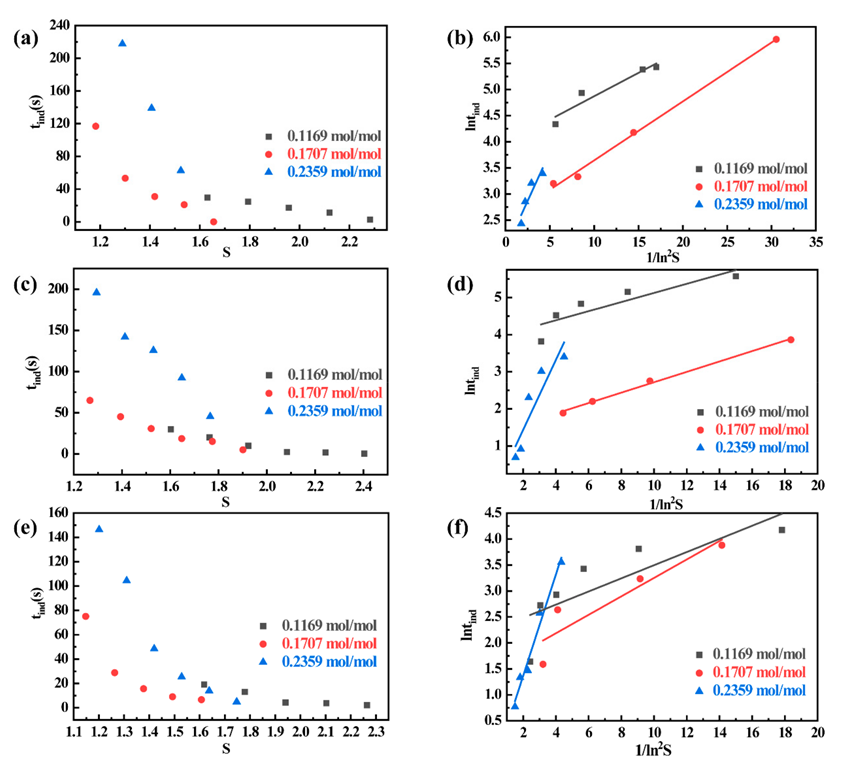
3.1. Effect of Lysis Precipitant Content on Induction Period

The relationship between the induction period and the supersaturation of the solution can be used in the experimental process to select a suitable supersaturation solution for the solvation crystallization test and the solid–liquid surface tension under different working conditions calculated to help understand the crystallization process mechanistically. Figure 2a,c,e are the relationships between the induction periods and the corresponding supersaturation degrees at 15 °C, 20 °C, and 25 °C, for different solubilizer contents in the mixed solvents. It can be found that the nucleation induction period is significantly shortened with the increase in the supersaturation of the solution under the condition of certain solubilizer content, and the supersaturation is mainly concentrated between 1.1 and 2.4 during this experiment. The shortening of the induction period is about 93.3% at 0.2359 mol/mol, 87.2% at 0.1707 mol/mol, and 60.0% at 0.1169 mol/mol. The shortening of the induction period is evident with the increase in supersaturation at high solubilizer contents. Meanwhile, under the same temperature and the same supersaturation, the crystallization induction period is prolonged significantly with the increase in ethanol content of the solubilizer in the mixed solvent fraction, and the induction period time is as high as 220 s at the solution temperature of 15 °C and supersaturation of 1.25. Because the solubility of the mixed solvent decreases when the solubilizer content increases, the solute in the mixed solvent decreases under the same supersaturation condition, which reduces the chance of practical collision and is not conducive to the generation of spontaneous nucleation, resulting in a significantly more extended induction period.
Figure 2b,d,f are the graphs of supersaturation versus induction period at different solubilizer contents in the mixed solvents at temperatures of 15 °C, 20 °C, and 25 °C. If the crystallization is a spontaneous homogeneous nucleation process, lntind~1/ln2S should be a straight line according to Equation (8). From Figure 2b,d,f, it can be found that the logarithm of the induction period in the binary ethanol–H2O solvent mixture at different temperatures in the experimental supersaturation range is linearly related to the inverse of the square of the logarithm of the supersaturation. The linearity of the two data sets indicates that the experimental process is homogeneous nucleation under these conditions. Since no crystalline species were added and the experiments were performed under dust-free conditions, no heterogeneous nucleation occurred. The homogeneous nucleation solid–liquid interfacial tension of the ethanol–H2O binary solvent system can be calculated from the slope of the straight line. When the solution temperature is 15 °C, the straight line slope is 0.0896 when the solubilizer content is 0.1169 mol/mol, 0.1128 when the solubilizer content is 0.1707 mol/mol, and 0.3719 when the solubilizer content is 0.2359 mol/mol.
It can also be found that at the same temperature, with the increase in the molar fraction of ethanol in the ethanol–H2O binary solvent mixture, the slope of the lntind~1/ln2S straight line increases and the induction period time is prolonged, indicating that the nucleation barrier becomes more significant and less likely to form nuclei.

3.2. Effect of Temperature on Induction Period

Figure 3a,c,e are the relationships between the induction period and the corresponding supersaturation at different temperatures of the solutions when the molar fractions of the solubilizer ethanol are 0.1169, 0.1707, and 0.2359 mol/mol. The induction period of the solution temperature of 15 °C is more extended than that of the solution temperature of 20 °C and 25 °C for a solution content of 0.1169 mol/mol under the premise of equal supersaturation. The above trend is also satisfied for other solubilizer content conditions. The inverse relationship between the solution temperature and the induction period is observed at a certain solubilizer content. The higher the temperature, the shorter the induction period, which indicates that the high temperature could promote homogeneous nucleation to a certain extent. The influence of temperature on the spontaneous nucleation of crystals is mainly reflected in two aspects: on the one hand, the increase in temperature can increase the diffusion coefficient of solute and strengthen the diffusion process of the solute; on the other hand, the temperature rise can make the energy of solute molecules increase, so that the probability of practical collision of solute molecules increases, and thus spontaneous nucleation is more likely to occur.
Figure 3b,d,f are the graphs of supersaturation versus induction period at different temperatures for the molar fractions of ethanol, and 0.1169, 0.1707, and 0.2359 mol/mol of a solubilizer. The slope of the straight line is 0.1092 when the solution temperature is 15 °C, 0.1608 when the solution temperature is 20 °C, and 0.2878 when the solution temperature is 25 °C under the condition of 0.2359 mol/mol solubilizer content. It is found that the slope of the straight line lntind~1/ln2S decreases with the increase in temperature for the same solubilizer content. Moreover, it can be seen that the solid–liquid surface tension between the solution and crystal surfaces tends to decrease when the temperature increases, indicating that the rise in temperature helps to lower the nucleation barrier and promote the homogeneous nucleation process. This is verified in Section 3.4.

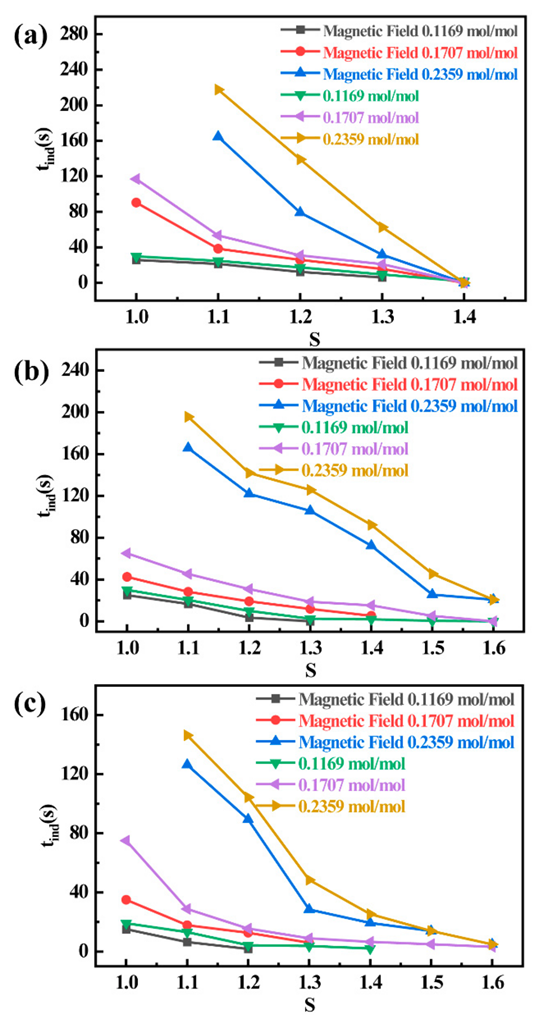
3.3. Effect of Magnetic Field on Induction Period

Figure 4a–c show the relationship between the induction periods and the corresponding supersaturation degrees at temperatures of 15 °C, 20 °C, and 25 °C with and without magnetic fields. It can be found that when the temperature and solubilizer content are the same, the induction period under the magnetic field is smaller than that without the magnetic field. The shortening of the induction period tends to decrease with the supersaturation increase. The induction period’s shortening becomes more evident with the rise of the content of the solubilizer in the solution. Because a magnetic field changes the hydrogen bonding in water molecules, the polarity of the water is enhanced. The viscosity of the water is reduced [50,51], so the diffusion process of solute is accelerated under the effect of the magnetic field, the range of motion of solute molecules is more extensive and more accessible, there are more opportunities for solute molecules to collide, the practical collision is increased, and the nucleation process is promoted. On the other hand, the presence of a magnetic field decreases the surface tension of the solution, and the free energy of the liquid–solid transition during crystallization decreases, which reduces the critical nucleation radius [52,53]. In summary of the above two reasons, the presence of a magnetic field can shorten the induction period time.
Comparing Figure 4a–c, it can be found that the effect of a magnetic field on shortening the induction period becomes weaker as the temperature increases. At a solubilizer content of 0.2359 mol/mol, the shortening of the induction period is about 96.9% at a solution temperature of 15 °C, 87.5% at a solution temperature of 20 °C, and 84.0% at a solution temperature of 25 °C. The above trends are also satisfied under the conditions of other solubilizer contents. This is mainly because when the temperature is lower, the average spacing between molecules is smaller, and the water molecules are bound together by hydrogen bonds [54]. When the temperature increases, the magnetization rate tends to decrease with the increased temperature, the intermolecular spacing increases, and the interaction between the magnetic moments of water molecules is weakened. At the same time, the thermal motion of molecules increases with temperature, and the orientation of molecular magnetic moments is disrupted, which eventually leads to the weakening of the magnetic field on the solution. The effect of a magnetic field shortens the induction period and decreases with temperature.

3.4. Crystal Surface Growth Mechanism

The line between lntind and 1/ln2S is straight, and the slope of the line can be obtained and combined with Equation (8), and the solid–liquid surface tension value can be found. The solid–liquid surface tension calculated using the relationship between supersaturation and induction period under this experimental condition is listed in Table 2. In studying crystal growth mechanisms, the surface entropy factor can theoretically be used to determine the crystal surface growth mechanism. In the experimental study of this paper, Equation (10) is used to calculate the surface entropy factor, and the calculation results are listed in Table 2.
Comparing the data in the table, the solid–liquid surface tension and surface entropy factor of ammonium bicarbonate in the binary ethanol–H2O solvent mixture show decreasing trends with increasing temperature. At the same temperature, the solid–liquid surface tension increases with the ethanol content of the solubilizer in the mixed solvent. In the range of experimental study conditions in this paper, the variation of surface entropy factor ranges from 0.752 to 1.499. The Monte Carlo method is used to simulate the crystal surface’s growth. The range of entropy factor variation can be determined when the crystal growth mechanism changes [55,56,57], and the results are shown in Table 3. It is found that the solubilizer content and temperature do not significantly affect the growth mechanism of ammonium bicarbonate crystal surface within the scope of this experiment, and the growth mode of ammonium bicarbonate in the binary mixture of ethanol and water could be determined as continuous growth. It can also be seen from the above data that as the temperature decreases and the content of ethanol in the binary solvent mixture increases, the surface entropy factor gradually increases, the crystal surface becomes smoother, and the crystal growth energy barrier gradually increases. The nucleation and growth characteristics of ammonium bicarbonate crystallization in ethanol–H2O binary solvents are essential for selecting the temperature and solubilizer ratio in the crystallization process.

4. Conclusions

(1) Under the same mixed solution temperature, the crystallization induction period becomes significantly longer with the increase in ethanol content of the solubilizer in the components. The nucleation induction period becomes significantly shorter with the increase in the solution’s supersaturation under certain solubilizer content, and the shortening is increased from 60.0% to 87.2% and 93.3%. The increase in supersaturation could significantly enhance the homogeneous nucleation process.
(2) Under the same solubilizer content, there is an inverse relationship between solution temperature and induction period. The increase in mixed solution temperature decreases the solid–liquid surface tension, and the induction period is significantly shortened. Temperature can promote homogeneous nucleation to a certain extent.
(3) At the same temperature of the mixed solution, the presence of a magnetic field can significantly reduce the induction period of the solvation crystallization process, and this gap tends to decrease with the increase in supersaturation. This decreasing trend becomes more and more evident with the rise of the solvating agent content in the solution. As the temperature increases, the magnetic field shortens the induction period less and less, and the shortening reduces from 96.9% to 84.0%.
(4) The solid–liquid surface tension and surface entropy factor gradually increase with the decrease in temperature and the increase in ethanol content of the solubilizer in the binary solvent mixture, and the variation of surface entropy factor under the present experimental conditions ranges from 0.752 to 1.499. The crystal surface becomes smoother and smoother, and the crystal growth energy barrier steadily increases. It can be judged that the growth mode of ammonium bicarbonate in the ethanol–H2O binary solvent mixture is continuous growth.
(5) This paper investigates the efficiency of the mass transfer characteristics and the enhancement of the CO2 absorption rate of the new carbon capture system from a quantitative point of view under the conditions of the new ammonia carbon capture system with the addition of the additional field, the solubilizer ethanol, and the addition of the static magnetic field. The new ammonia carbon capture technology can provide a new way to synthesize nitrogen fertilizer and other similar fertilizers and can also realize industrial applications for industries such as agricultural products and heating and power generation.

Author Contributions

Conceptualization, Y.Z. (Yu Zhang) and Y.H.; Data curation, L.D., H.D., Z.Z., Y.Z. (Yijun Zhao) and S.S.; Formal analysis, F.Z.; Funding acquisition, D.F., F.Z., Y.Z. (Yijun Zhao), S.S. and Y.H.; Investigation, Z.Z.; Methodology, J.G.; Project administration, H.D. and F.Z.; Resources, D.F. and J.G.; Software, Y.Z. (Yu Zhang); Validation, Y.Z. (Yu Zhang) and J.G.; Visualization, L.D.; Writing – original draft, L.D.; Writing – review & editing, D.F. All authors have read and agreed to the published version of the manuscript.

Funding

This work is supported by the National Natural Science Foundation of China (52006047), China Postdoctoral Science Foundation Funded Project (2020M670908), Heilongjiang Provincial Postdoctoral Science Foundation (LBH-Z19151), Foundation of State Key Laboratory of High-efficiency Utilization of Coal and Green Chemical Engineering (2021-K45), and Heilongjiang Higher Education Teaching Reform Project (SJGY20210322).

Conflicts of Interest

The authors declare no conflict of interest.

References

  1. Feng, D.; Gao, J.; Zhang, Y.; Li, H.; Du, Q.; Wu, S. Mass transfer in ammonia-based CO2 absorption in bubbling reactor under static magnetic field. Chem. Eng. J. 2018, 338, 450–456. [Google Scholar] [CrossRef]
  2. Kozak, F.; Petig, A.; Morris, E.B.; Rhudy, R.; Thimsen, D. Chilled ammonia process for CO2 capture. Energy Procedia 2009, 1, 1419–1426. [Google Scholar] [CrossRef]
  3. Yang, Y.; Liew, R.K.; Tamothran, A.M.; Foong, S.Y.; Yek, P.N.Y.; Chia, P.W.; Van Tran, T.; Peng, W.; Lam, S.S. Gasification of refuse-derived fuel from municipal solid waste for energy production: A review. Environ. Chem. Lett. 2021, 19, 2127–2140. [Google Scholar] [CrossRef] [PubMed]
  4. Hu, Y.; Guo, Y.; Sun, J.; Li, H.; Liu, W. Progress in MgO sorbents for cyclic CO2 capture: A comprehensive review. J. Mater. Chem. A 2019, 7, 20103–20120. [Google Scholar] [CrossRef]
  5. Bavarella, S.; Hermassi, M.; Brookes, A.; Moore, A.; Vale, P.; Moon, I.S.; Pidou, M.; McAdam, E.J. Recovery and concentration of ammonia from return liquor to promote enhanced CO2 absorption and simultaneous ammonium bicarbonate crystallisation during biogas upgrading in a hollow fibre membrane contactor. Sep. Purif. Technol. 2020, 241, 116631. [Google Scholar] [CrossRef]
  6. Al-Hamed, K.H.M.; Dincer, I. A novel multigeneration ammonia-based carbon capturing system powered by a geothermal power plant for cleaner applications. J. Clean. Prod. 2021, 321, 129017. [Google Scholar] [CrossRef]
  7. Al-Hamed, K.H.M.; Dincer, I. A comparative review of potential ammonia-based carbon capture systems. J. Environ. Manag. 2021, 287, 112357. [Google Scholar] [CrossRef]
  8. Kim, Y.; Lim, S.-R.; Jung, K.A.; Park, J.M. Process-based life cycle CO2 assessment of an ammonia-based carbon capture and storage system. J. Ind. Eng. Chem. 2019, 76, 223–232. [Google Scholar] [CrossRef]
  9. Ishaq, H.; Ali, U.; Sher, F.; Anus, M.; Imran, M. Process analysis of improved process modifications for ammonia-based post-combustion CO2 capture. J. Environ. Chem. Eng. 2021, 9, 104928. [Google Scholar] [CrossRef]
  10. Leung, D.Y.; Caramanna, G.; Maroto-Valer, M.M. An overview of current status of carbon dioxide capture and storage technologies. Renew. Sustain. Energy Rev. 2014, 39, 426–443. [Google Scholar] [CrossRef] [Green Version]
  11. Rochelle, G.T. Amine scrubbing for CO2 capture. Science 2009, 325, 1652–1654. [Google Scholar] [CrossRef] [PubMed]
  12. Bai, H.; Yeh, A.C. Removal of CO2 greenhouse gas by ammonia scrubbing. Ind. Eng. Chem. Res. 1997, 36, 2490–2493. [Google Scholar] [CrossRef]
  13. Zhao, B.; Su, Y.; Tao, W.; Li, L.; Peng, Y. Post-combustion CO2 capture by aqueous ammonia: A state-of-the-art review. Int. J. Greenh. Gas Control 2012, 9, 355–371. [Google Scholar] [CrossRef]
  14. Mclarnon, C.R.; Duncan, J.L. Testing of Ammonia Based CO2 Capture with Multi-Pollutant Control Technology. Energy Procedia 2009, 1, 1027–1034. [Google Scholar] [CrossRef]
  15. Yu, H.; Qi, G.; Wang, S.; Morgan, S.; Allport, A.; Cottrell, A.; Do, T.; McGregor, J.; Wardhaugh, L.; Feron, P. Results from trialling aqueous ammonia-based post-combustion capture in a pilot plant at Munmorah Power Station: Gas purity and solid precipitation in the stripper. Int. J. Greenh. Gas Control 2012, 10, 15–25. [Google Scholar] [CrossRef]
  16. Di Profio, G.; Tucci, S.; Curcio, E.; Drioli, E. Selective Glycine Polymorph Crystallization by Using Microporous Membranes. Cryst. Growth Des. 2007, 7, 526–530. [Google Scholar] [CrossRef]
  17. Li, L.; Zhao, S.; Xin, Z.; Zhou, S. Nucleation kinetics of clopidogrel hydrogen sulfate polymorphs in reactive crystallization: Induction period and interfacial tension measurements. J. Cryst. Growth 2020, 538, 125610. [Google Scholar] [CrossRef]
  18. Feng, D.; Guo, D.; Zhang, Y.; Sun, S.; Zhao, Y.; Chang, G.; Guo, Q.; Qin, Y. Adsorption-enrichment characterization of CO2 and dynamic retention of free NH3 in functionalized biochar with H2O/NH3·H2O activation for promotion of new ammonia-based carbon capture. Chem. Eng. J. 2021, 409, 128193. [Google Scholar] [CrossRef]
  19. Lenka, M.; Sarkar, D. Determination of metastable zone width, induction period and primary nucleation kinetics for cooling crystallization of l-asparaginenohydrate. J. Cryst. Growth 2014, 408, 85–90. [Google Scholar] [CrossRef]
  20. Prasad, R.; Dalvi, S.V. Sonocrystallization: Monitoring and controlling crystallization using ultrasound. Chem. Eng. Sci. 2020, 226, 115911. [Google Scholar] [CrossRef]
  21. Wang, M.; Zhu, J.; Zhang, S.; You, G.; Wu, S. Influencing factors for vulcanization induction period of accelerator / natural rubber composites: Molecular simulation and experimental study. Polym. Test. 2019, 80, 106145. [Google Scholar] [CrossRef]
  22. Zhou, L.; Wang, Z.; Zhang, M.; Guo, M.; Xu, S.; Yin, Q. Determination of metastable zone and induction time of analgin for cooling crystallization. Chin. J. Chem. Eng. 2017, 25, 313–318. [Google Scholar] [CrossRef]
  23. Šimon, P.; Nemčeková, K.; Jóna, E.; Plško, A.; Ondrušová, D. Thermal stability of glass evaluated by the induction period of crystallization. Thermochim. Acta 2005, 428, 11–14. [Google Scholar] [CrossRef]
  24. He, D.; Ou, Z.; Qin, C.; Deng, T.; Yin, J.; Pu, G. Understanding the catalytic acceleration effect of steam on CaCO3 decomposition by density function theory. Chem. Eng. J. 2020, 379, 122348. [Google Scholar] [CrossRef]
  25. Söhnel, O.; Mullin, J.W. A method for the determination of precipitation induction periods. J. Cryst. Growth 1978, 44, 377–382. [Google Scholar] [CrossRef]
  26. Yadav, A.; Labhasetwar, P.K.; Shahi, V.K. Membrane distillation crystallization technology for zero liquid discharge and resource recovery: Opportunities, challenges and futuristic perspectives. Sci. Total Environ. 2022, 806, 150692. [Google Scholar] [CrossRef] [PubMed]
  27. Chabanon, E.; Mangin, D.; Charcosset, C. Membranes and crystallization processes: State of the art and prospects. J. Membr. Sci. 2016, 509, 57–67. [Google Scholar] [CrossRef]
  28. Di Profio, G.; Curcio, E.; Drioli, E. Supersaturation Control and Heterogeneous Nucleation in Membrane Crystallizers: Facts and Perspectives. Ind. Eng. Chem. Res. 2010, 49, 11878–11889. [Google Scholar] [CrossRef]
  29. You, S.; Zhang, Y.; Zhang, Y. Nucleation of ammonium aluminum sulfate dodecahydrate from unseeded aqueous solution. J. Cryst. Growth 2015, 411, 24–29. [Google Scholar] [CrossRef]
  30. Wang, S.; Feng, M.; Du, H.; Weigand, J.J.; Zhang, Y.; Wang, X. Determination of metastable zone width, induction time and primary nucleation kinetics for cooling crystallization of sodium orthovanadate from NaOH solution. J. Cryst. Growth 2020, 545, 125721. [Google Scholar] [CrossRef]
  31. Neumann, A.W.; Good, R.J.; Hope, C.J.; Sejpal, M. An equation-of-state approach to determine surface tensions of low-energy solids from contact angles. J. Colloid Interface Sci. 1974, 49, 291–304. [Google Scholar] [CrossRef]
  32. Neumann, A.W. Haftfestigkeit an Grenzflächen. Mater. Corros. 1969, 20, 19–22. [Google Scholar] [CrossRef]
  33. Yang, Y.; Liu, W.; Hu, Y.; Sun, J.; Tong, X.; Chen, Q.; Li, Q. One-step synthesis of porous Li4SiO4-based adsorbent pellets via graphite moulding method for cyclic CO2 capture. Chem. Eng. J. 2018, 353, 92–99. [Google Scholar] [CrossRef]
  34. Zhou, K.; Wang, H.P.; Chang, J.; Wei, B. Experimental study of surface tension, specific heat and thermal diffusivity of liquid and solid titanium. Chem. Phys. Lett. 2015, 639, 105–108. [Google Scholar] [CrossRef]
  35. Correia, N.T.; Ramos, J.J.M.; Saramago, B.J.V.; Calado, J.C.G. Estimation of the Surface Tension of a Solid: Application to a Liquid Crystalline Polymer. J. Colloid Interface Sci. 1997, 189, 361–369. [Google Scholar] [CrossRef]
  36. Sangwal, K. Novel Approach to Analyze Metastable Zone Width Determined by the Polythermal Method: Physical Interpretation of Various Parameters. Cryst. Growth Des. 2009, 9, 942–950. [Google Scholar] [CrossRef]
  37. Gu, C.-H.; Young, V.; Grant, D.J.W. Polymorph screening: Influence of solvents on the rate of solvent-mediated polymorphic transformation. J. Pharm. Sci. 2001, 90, 1878–1890. [Google Scholar] [CrossRef]
  38. Torkian, M.; Manteghian, M.; Safari, M. Caffeine metastable zone width and induction time in anti-solvent crystallization. J. Cryst. Growth 2022, 594, 126790. [Google Scholar] [CrossRef]
  39. Ma, L.; Qin, C.; Pi, S.; Cui, H. Fabrication of efficient and stable Li4SiO4-based sorbent pellets via extrusion-spheronization for cyclic CO2 capture. Chem. Eng. J. 2020, 379, 122385. [Google Scholar] [CrossRef]
  40. Sangwal, K. Some features of metastable zone width of various systems determined by polythermal method. CrystEngComm 2011, 13, 489–501. [Google Scholar] [CrossRef]
  41. Kashchiev, D.; Verdoes, D.; van Rosmalen, G.M. Induction time and metastability limit in new phase formation. J. Cryst. Growth 1991, 110, 373–380. [Google Scholar] [CrossRef]
  42. Su, W.; Hao, H.; Glennon, B.; Barrett, M. Spontaneous Polymorphic Nucleation of d-Mannitol in Aqueous Solution Monitored with Raman Spectroscopy and FBRM. Cryst. Growth Des. 2013, 13, 5179–5187. [Google Scholar] [CrossRef]
  43. Marichev, V.A. General thermodynamic equations for the surface tension of liquids and solids. Surf. Sci. 2010, 604, 458–463. [Google Scholar] [CrossRef]
  44. Wang, Y.; Xiao, X.; Feng, X. An accurate and parallel method with post-processing boundedness control for solving the anisotropic phase-field dendritic crystal growth model. Commun. Nonlinear Sci. Numer. Simul. 2022, 115, 106717. [Google Scholar] [CrossRef]
  45. Zhao, H.; Li, T.; Li, J.; Li, Q.; Wang, S.; Zheng, C.; Li, J.; Li, M.; Zhang, Y.; Yao, J. Excess polymer-assisted crystal growth method for high-performance perovskite photodetectors. J. Alloys Compd. 2022, 908, 164482. [Google Scholar] [CrossRef]
  46. Wang, P.F.; Li, M.W.; Zhou, C.; Hu, Z.T.; Yin, H.W. Numerical simulations of flow and mass transfer during large-scale potassium dihydrogen phosphate crystal growth via three-dimensional motion growth method. Int. J. Heat Mass Transf. 2018, 127, 901–907. [Google Scholar] [CrossRef]
  47. Sangwal, K. On the estimation of surface entropy factor, interfacial tension, dissolution enthalpy and metastable zone-width for substances crystallizing from solution. J. Cryst. Growth 1989, 97, 393–405. [Google Scholar] [CrossRef]
  48. Jáger, G.; Tomán, J.J.; Juhász, L.; Vecsei, G.; Erdélyi, Z.; Cserháti, C. Nucleation and growth kinetics of ZnAl2O4 spinel in crystalline ZnO–amorphous Al2O3 bilayers prepared by atomic layer deposition. Scr. Mater. 2022, 219, 114857. [Google Scholar] [CrossRef]
  49. Barata, P.A.; Serrano, M.L. Salting-out precipitation of potassium dihydrogen phosphate (KDP). I. Precipitation mechanism. J. Cryst. Growth 1996, 160, 361–369. [Google Scholar] [CrossRef]
  50. Guo, K.; Lv, Y.; He, L.; Luo, X.; Zhao, J. Experimental study on the effect of spatial distribution and action order of electric field and magnetic field on oil-water separation. Chem. Eng. Process. 2019, 145, 107658. [Google Scholar] [CrossRef]
  51. Ren, J.; Zhu, Z.; Qiu, Y.; Yu, F.; Ma, J.; Zhao, J. Magnetic field assisted adsorption of pollutants from an aqueous solution: A review. J. Hazard. Mater. 2021, 408, 124846. [Google Scholar] [CrossRef] [PubMed]
  52. Cheng, N.; Guo, R.; Shuai, S.; Wang, J.; Xia, M.; Li, J.; Ren, Z.; Li, J.; Wang, Q. Influence of static magnetic field on the heterogeneous nucleation behavior of Al on single crystal Al2O3 substrate. Materialia 2020, 13, 100847. [Google Scholar] [CrossRef]
  53. Taheri, M.H.; Mohammadpourfard, M.; Sadaghiani, A.K.; Kosar, A. Wettability alterations and magnetic field effects on the nucleation of magnetic nanofluids: A molecular dynamics simulation. J. Mol. Liq. 2018, 260, 209–220. [Google Scholar] [CrossRef]
  54. Koza, J.A.; Uhlemann, M.; Gebert, A.; Schultz, L. Nucleation and growth of the electrodeposited iron layers in the presence of an external magnetic field. Electrochim. Acta 2008, 53, 7972–7980. [Google Scholar] [CrossRef]
  55. Kadota, K.; Shirakawa, Y.; Wada, M.; Shimosaka, A.; Hidaka, J. Influence of clusters on the crystal surface of NaCl at initial growth stage investigated by molecular dynamics simulations. J. Mol. Liq. 2012, 166, 31–39. [Google Scholar] [CrossRef]
  56. Galmarini, S.; Bowen, P. Atomistic simulation of the adsorption of calcium and hydroxyl ions onto portlandite surfaces—towards crystal growth mechanisms. Cem. Concr. Res. 2016, 81, 16–23. [Google Scholar] [CrossRef]
  57. Separdar, L.; Rino, J.P.; Zanotto, E.D. Decoding crystal growth kinetics and structural evolution in supercooled ZnSe by molecular dynamics simulation. Comput. Mater. Sci. 2022, 212, 111598. [Google Scholar] [CrossRef]
Figure 1. Schematic diagram of the induction period determination device (1—recorder; 2—laser receiver; 3—precision thermometer; 4—dissolver; 5—magnetic stirring rotor; 6—magnetic stirrer; 7—photoelectric transmitter; 8—super thermostat water bath).
Energies 15 06231 g001
Figure 2. (a) Relationship between supersaturation and induction period at different solubilizer contents (t = 15 °C). (b) Relationship between lntind and 1/ln2S at different solubilizer contents (t = 15 °C). The lines are the linear fit curve of lntind and 1/ln2S. (c) Relationship between supersaturation and induction period at different solubilizer contents (t = 20 °C). (d) Relationship between lntind and 1/ln2S at different solubilizer contents (t = 20 °C). The lines are the linear fit curve of lntind and 1/ln2S. (e) Relationship between supersaturation and induction period at different solubilizer contents (t = 25 °C). (f) Relationship between lntind and 1/ln2S at different solubilizer contents (t = 25 °C). The lines are the linear fit curve of lntind and 1/ln2S.
Energies 15 06231 g002
Figure 3. (a) Relationship between supersaturation and induction period at different temperatures (xc = 0.1169). (b) Relationship between lntind and 1/ln2S at different temperatures (xc = 0.1169). The lines are the linear fit curve of lntind and 1/ln2S. (c) Relationship between supersaturation and induction period at different temperatures (xc = 0.1707). (d) Relationship between lntind and 1/ln2S at different temperatures (xc = 0.1707). The lines are the linear fit curve of lntind and 1/ln2S. (e) Relationship between supersaturation and induction period at different temperatures (xc = 0.2359). (f) Relationship between lntind and 1/ln2S at different temperatures (xc = 0.2359). The lines are the linear fit curve of lntind and 1/ln2S.
Energies 15 06231 g003
Figure 4. (a) Variation of induction period with supersaturation in the presence and absence of a magnetic field (t = 15 °C). (b) Variation of induction period with supersaturation in the presence and absence of a magnetic field (t = 20 °C). (c) Variation of induction period with supersaturation in the presence and absence of a magnetic field (t = 25 °C).
Energies 15 06231 g004
Table 1. List of experimental chemicals.
NameChemical FormulaPurity/Concentration
AmmoniaNH3·H2O25~28 wt.%
Ammonium bicarbonateNH4HCO3Analysis of pure
Ammonium carbamateNH2COONH4Analysis of pure
Anhydrous ethanolCH3CH2OHAnalysis of pure
Sulfuric acidH2SO40.05 mol/L
Table 2. The calculated results of interfacial tension and surface entropy factor.
T/KSolvent Composition/(mol·mol−1) γ /(J·m−2) f
283.150.11690.0041870.752
283.150.17070.0046830.8612
283.150.23590.0084041.499
288.150.11690.004140.777
288.150.17070.004330.818
288.150.23590.0081671.403
293.150.11690.0036640.804
293.150.17070.0039570.876
293.150.23590.005891.127
Table 3. Relationship between surface entropy factor and crystal growth.
Surface Entropy FactorGrowing PositionRoughness of Crystal SurfaceGrowth Type
f < 3A bumpy ride into the crystal planeRougherContinuous Growth
3 < f < 5Direct growth onto the crystal surface, and also diffusion to the crystal surface of the stepSmootherTransmissive growth
f > 5Dislocations through the surface into the latticeVery smoothSpiral dislocation growth
Publisher’s Note: MDPI stays neutral with regard to jurisdictional claims in published maps and institutional affiliations.

