Abstract
Worldwide mopeds and motorcycles are taking on a growing main role in private mobility with a direct impact on air pollution, particularly in urban contexts of many Asian and European countries. In a preceding experimental investigation, HC and CO emissions were measured in the exhaust of a last-generation motorcycle belonging to the Euro-3 legislative category. Since exhaust emissions and fuel consumption are very sensitive to variations in vehicles instantaneous speed and acceleration, in this research new experimental results are used to recognize the kinematic parameters that cause higher engine-out emissions. In this paper, the hybrid electric propulsion is proposed for motorcycle application to reduce exhaust emissions in particular driving conditions which include high levels of acceleration with resultant rapid steep increase in engine speed. In such operating conditions, an enrichment of the air/fuel mixture is required, which affects the catalyst conversion efficiency. Subsequently, the power requirements and the grade of electrical assistance in such driving situations are calculated by a procedure based on both the measured exhaust emissions and the kinematic parameters of the driving dynamics collected during the experimental tests. Lastly, the share of CO and HC emissions that could be saved utilizing a hybrid motorcycle instead of a conventional thermal motorcycle is estimated through a specific environmental analysis.
1. Introduction
Nowadays fossil fuels are still the main worldwide energy resource (almost 80%) and global energy consumption is expected to increase by about 33% by 2050 [1,2]. Moreover, the amount of readily available fossil fuels, such as natural gas and petroleum, is estimated to decrease quickly in the next 50 years. At the same time, combustion of fossil fuels is regarded as the main contributor to air pollution and GHG (greenhouse gas) emissions [3,4]. In this regard, air pollutants produced by the road transport sector (such as carbon monoxide (CO), nitrogen oxides (NOX), unburned hydrocarbons (HC), and particulate matter (PM)) are increasing meaningly worldwide and affecting the air quality in urban contexts with noteworthy negative effects on human health. In fact, recently, nearly 20% of worldwide GHG emissions are the result of the increasing number of circulating diesel and petrol cars [5].
For these reasons, nowadays, nations worldwide are sturdily supporting research activity towards hybrid electric propulsion and renewable fuels both to decrease dependency on fossil fuels and to reduce dangerous air pollutants. In addition, in the last decades, severe national regulations have been applied to emissions from the road transport sector to improve air quality state in urban areas, hence reducing negative impacts on human health [6].
In this context, in recent years, two-wheeled vehicles have taken on a growing main role in private mobility with a direct effect on the urban air quality of European countries. Realistically, the percentage contribution of emissions from motorcycles and mopeds to the whole air pollution will rise in the next few years if no corrective measures are assumed. Two-wheeled vehicles, in effect, are widely used as a means of urban transport in the chief European cities, in which they represent a significant share of motorized vehicles. In recent years, in fact, two-wheelers accounted for around 32 million vehicles in the EU-28, then being about 8% of the whole vehicle fleet [5]. In Italy, for instance, traffic congestion and parking difficulties affect the actual alternatives for urban transportation mobility to the point that the percentage contribution of motorcycles and mopeds to the total passenger mobility fleet is higher than 20% [6,7].
For all these reasons, nations worldwide must strive to develop both cleaner alternative fuels from renewable sources and hybrid electric propulsion to decrease the demand for fossil fuels and to decrease dangerous air pollutant emissions from two-wheelers [8]. This is precisely the purpose of this analytical-experimental investigation: to propose hybrid electric propulsion for motorcycle application to reduce engine-out emissions in urban contexts. However, to the best of the authors’ knowledge, little is known in scientific literature about hybrid electric propulsion for motorcycle application in ordinary working conditions. As a promising alternative for urban transportation mobility, at present, numerical-experimental assessments of the hybrid propulsion in SI engines for new generation motorcycles are lacking, and the emission performance at part-load operation has yet to be defined.
In a previous experimental investigation [9], emissions of regulated pollutants were detected in the exhaust of a motorcycle belonging to the Euro-3 legislative category, equipped with a four-stroke SI engine (displacement of 280 cm3) and a three-way catalytic converter. Since exhaust emissions and fuel consumption are very sensitive to variations in vehicles’ instantaneous speed and acceleration, in this research, new experimental results are used to recognize the kinematic parameters that cause higher HC and CO emissions. The hybrid electric propulsion is then proposed in this paper to reduce exhaust emissions in particular driving conditions which include high levels of acceleration with resultant fast, steep increase in engine speed. In such phases, in fact, an enrichment of the air/fuel mixture is generally needed which affects the conversion efficiency of the three-way catalyst. Then, the power requirements and the grade of electrical assistance in specific driving situations are estimated by a procedure based on both the measured exhaust emissions and the kinematic parameters of the driving dynamics collected during the experimental tests. Lastly, an environmental analysis is performed to predict a comparison between the tested thermal motorcycle and the proposed hybrid motorcycle, so estimating the share of saved CO and HC emissions. The results attained in this research can help to guide the existing research in emissions-reduction systems in motorised two-wheelers.
2. Experimental Tests: Vehicle and Emission Performance
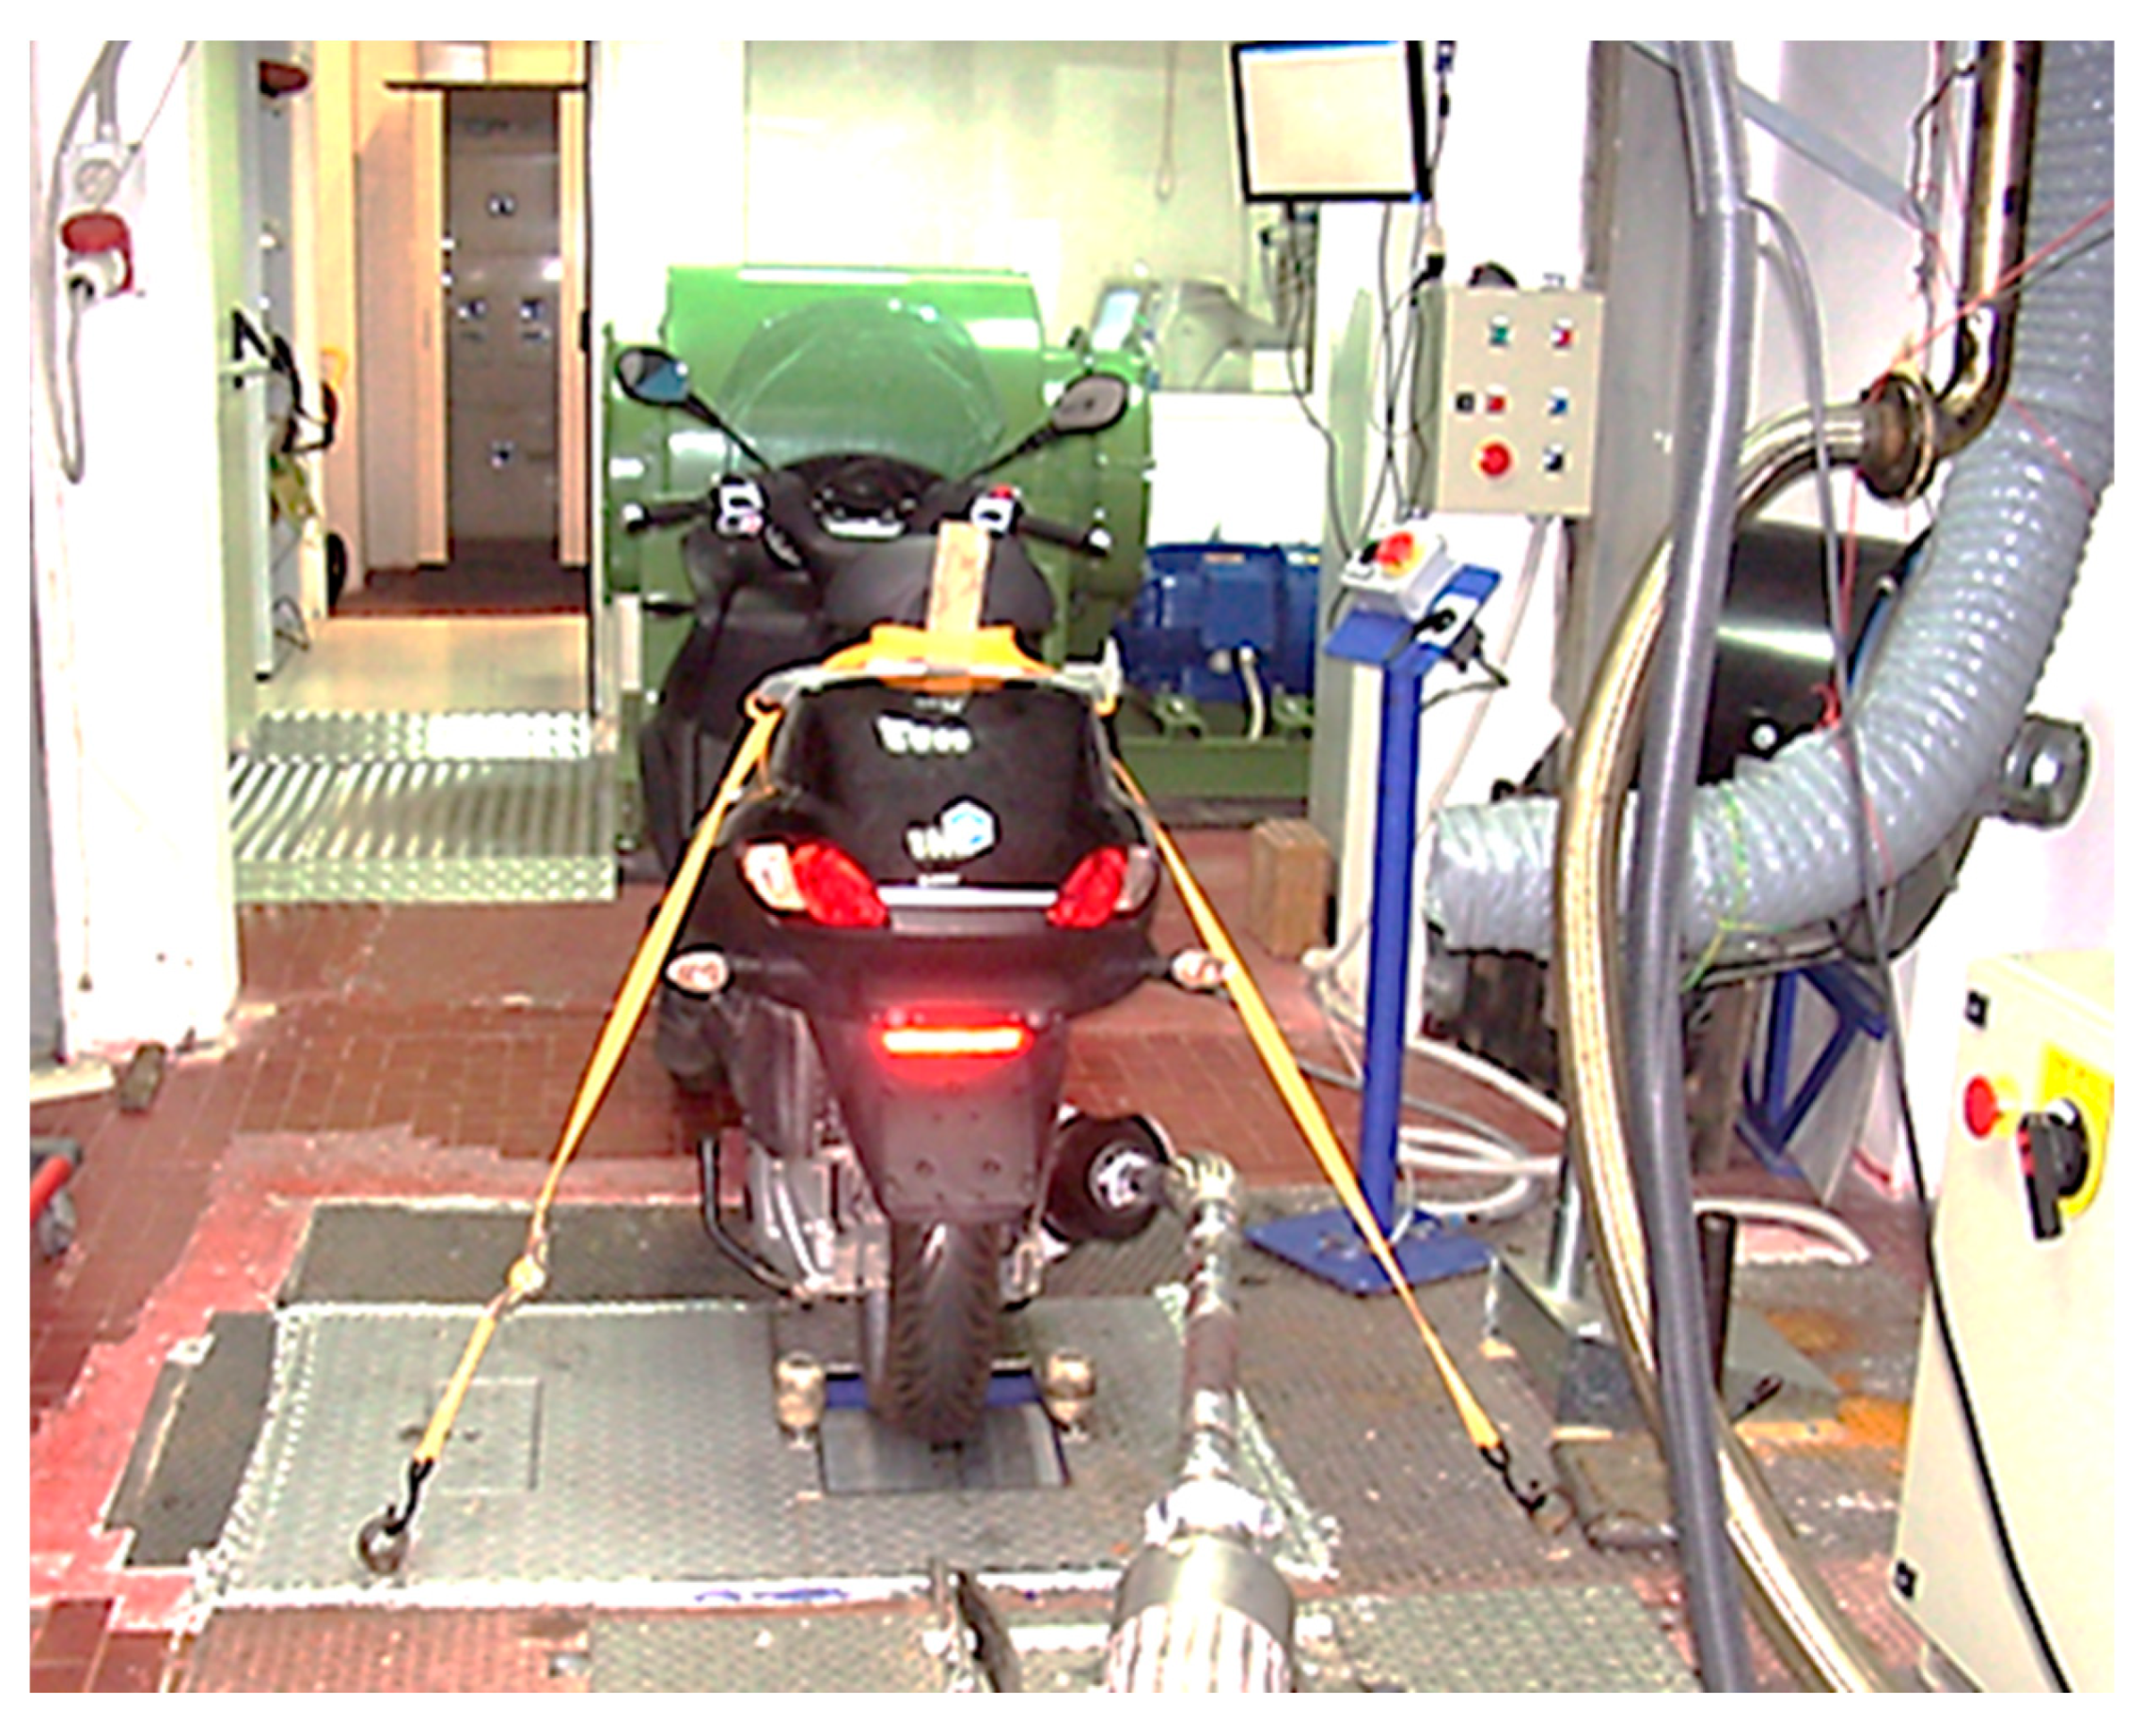
A last generation motorcycle, equipped with a four-stroke SI engine (displacement of 280 cm3), was tested for a previous experimental investigation [9] in the laboratories of National Research Council (Naples, Italy). The vehicle under investigation, which belongs to the Euro-3 legislative category, is represented on the test bench in Figure 1 and the main technical characteristics are summarized in Table 1. For this motorcycle, an accurate tuning of air/fuel mixture was reached through an electronic fuel injection system and a closed-loop exhaust after-treatment control system. As specified in Table 1, the technologies adopted on this vehicle to meet the latest emissive standards are a carbon canister and a three-way catalytic converter.
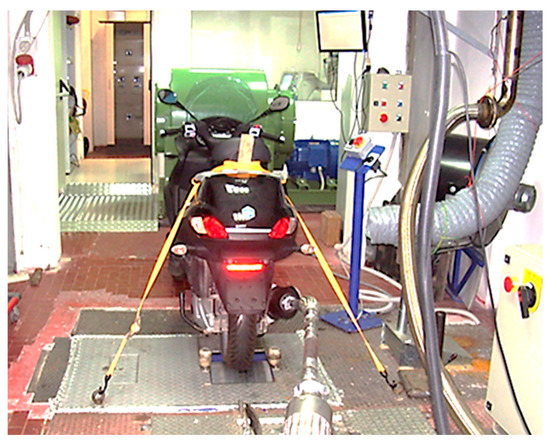
Figure 1.
The motorcycle under examination on the test bench.

Table 1.
Technical specifications of the tested motorcycle [9].
This motorcycle was tested on a two-wheeler chassis dynamometer (AVL Zollner 20″—single roller) which is designed to simulate road load resistance (comprising vehicle inertia) and to measure the engine-out emissions during the tests. During dynamic speed cycles, the exhaust gases are diluted with ambient air by adopting a Constant Volume Sampling with the Critical Flow Venturi (AVL CFV-CVS) unit. Subsequently, the diluted exhaust gases pass through a dilution tunnel to reach steady flow conditions. A fraction of diluted exhaust gases is sampled downstream of the dilution tunnel to measure continuously the concentration of CO and HC at 1 Hz by an exhaust gas analysis system (AVL AMA 4000) [9]. In more detail, CO and HC concentrations were measured by a non-dispersive infrared analyser (NDIR) and a flame ionization detector analyser (FID), respectively, which offer a precision of ±2%. Before being tested, these measuring instruments were also calibrated daily with zero gas. The gases utilized in the calibration of these analysers were nitric oxide, CO, carbon dioxide and propane, which were mixed with pure nitrogen. In addition, the background pollutant concentrations of indoor air were evaluated by subtracting them from the test results.
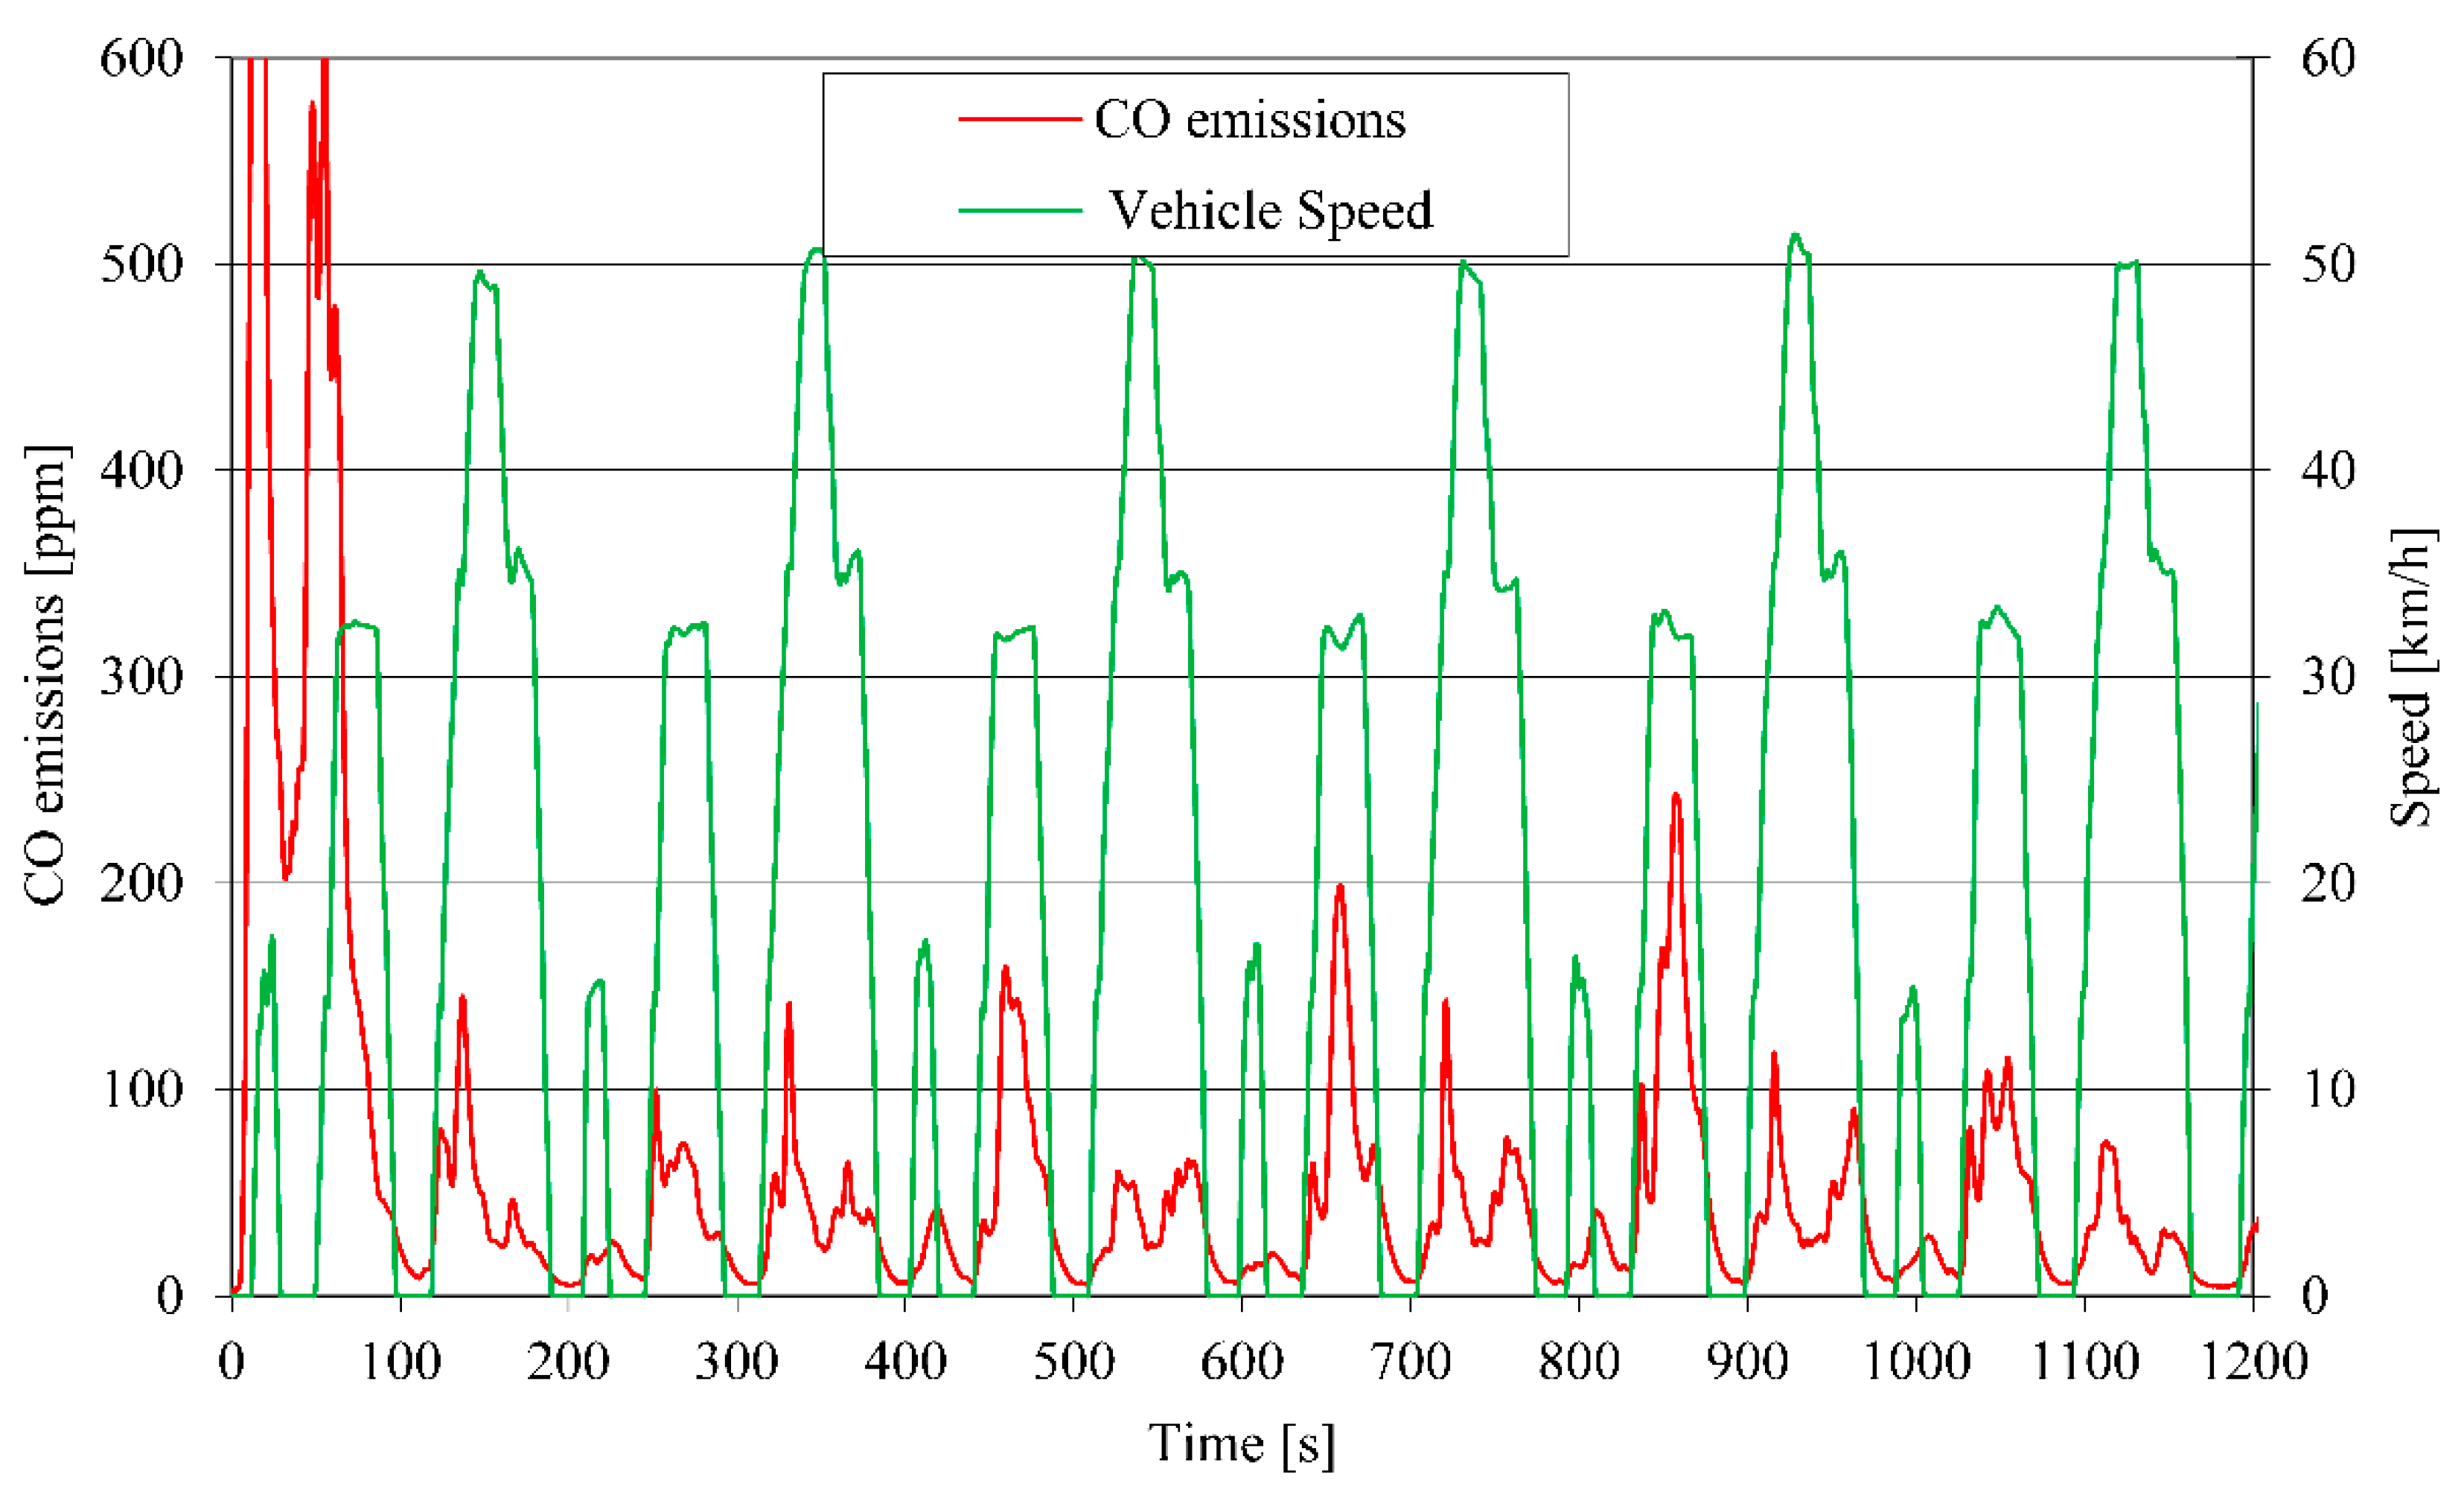
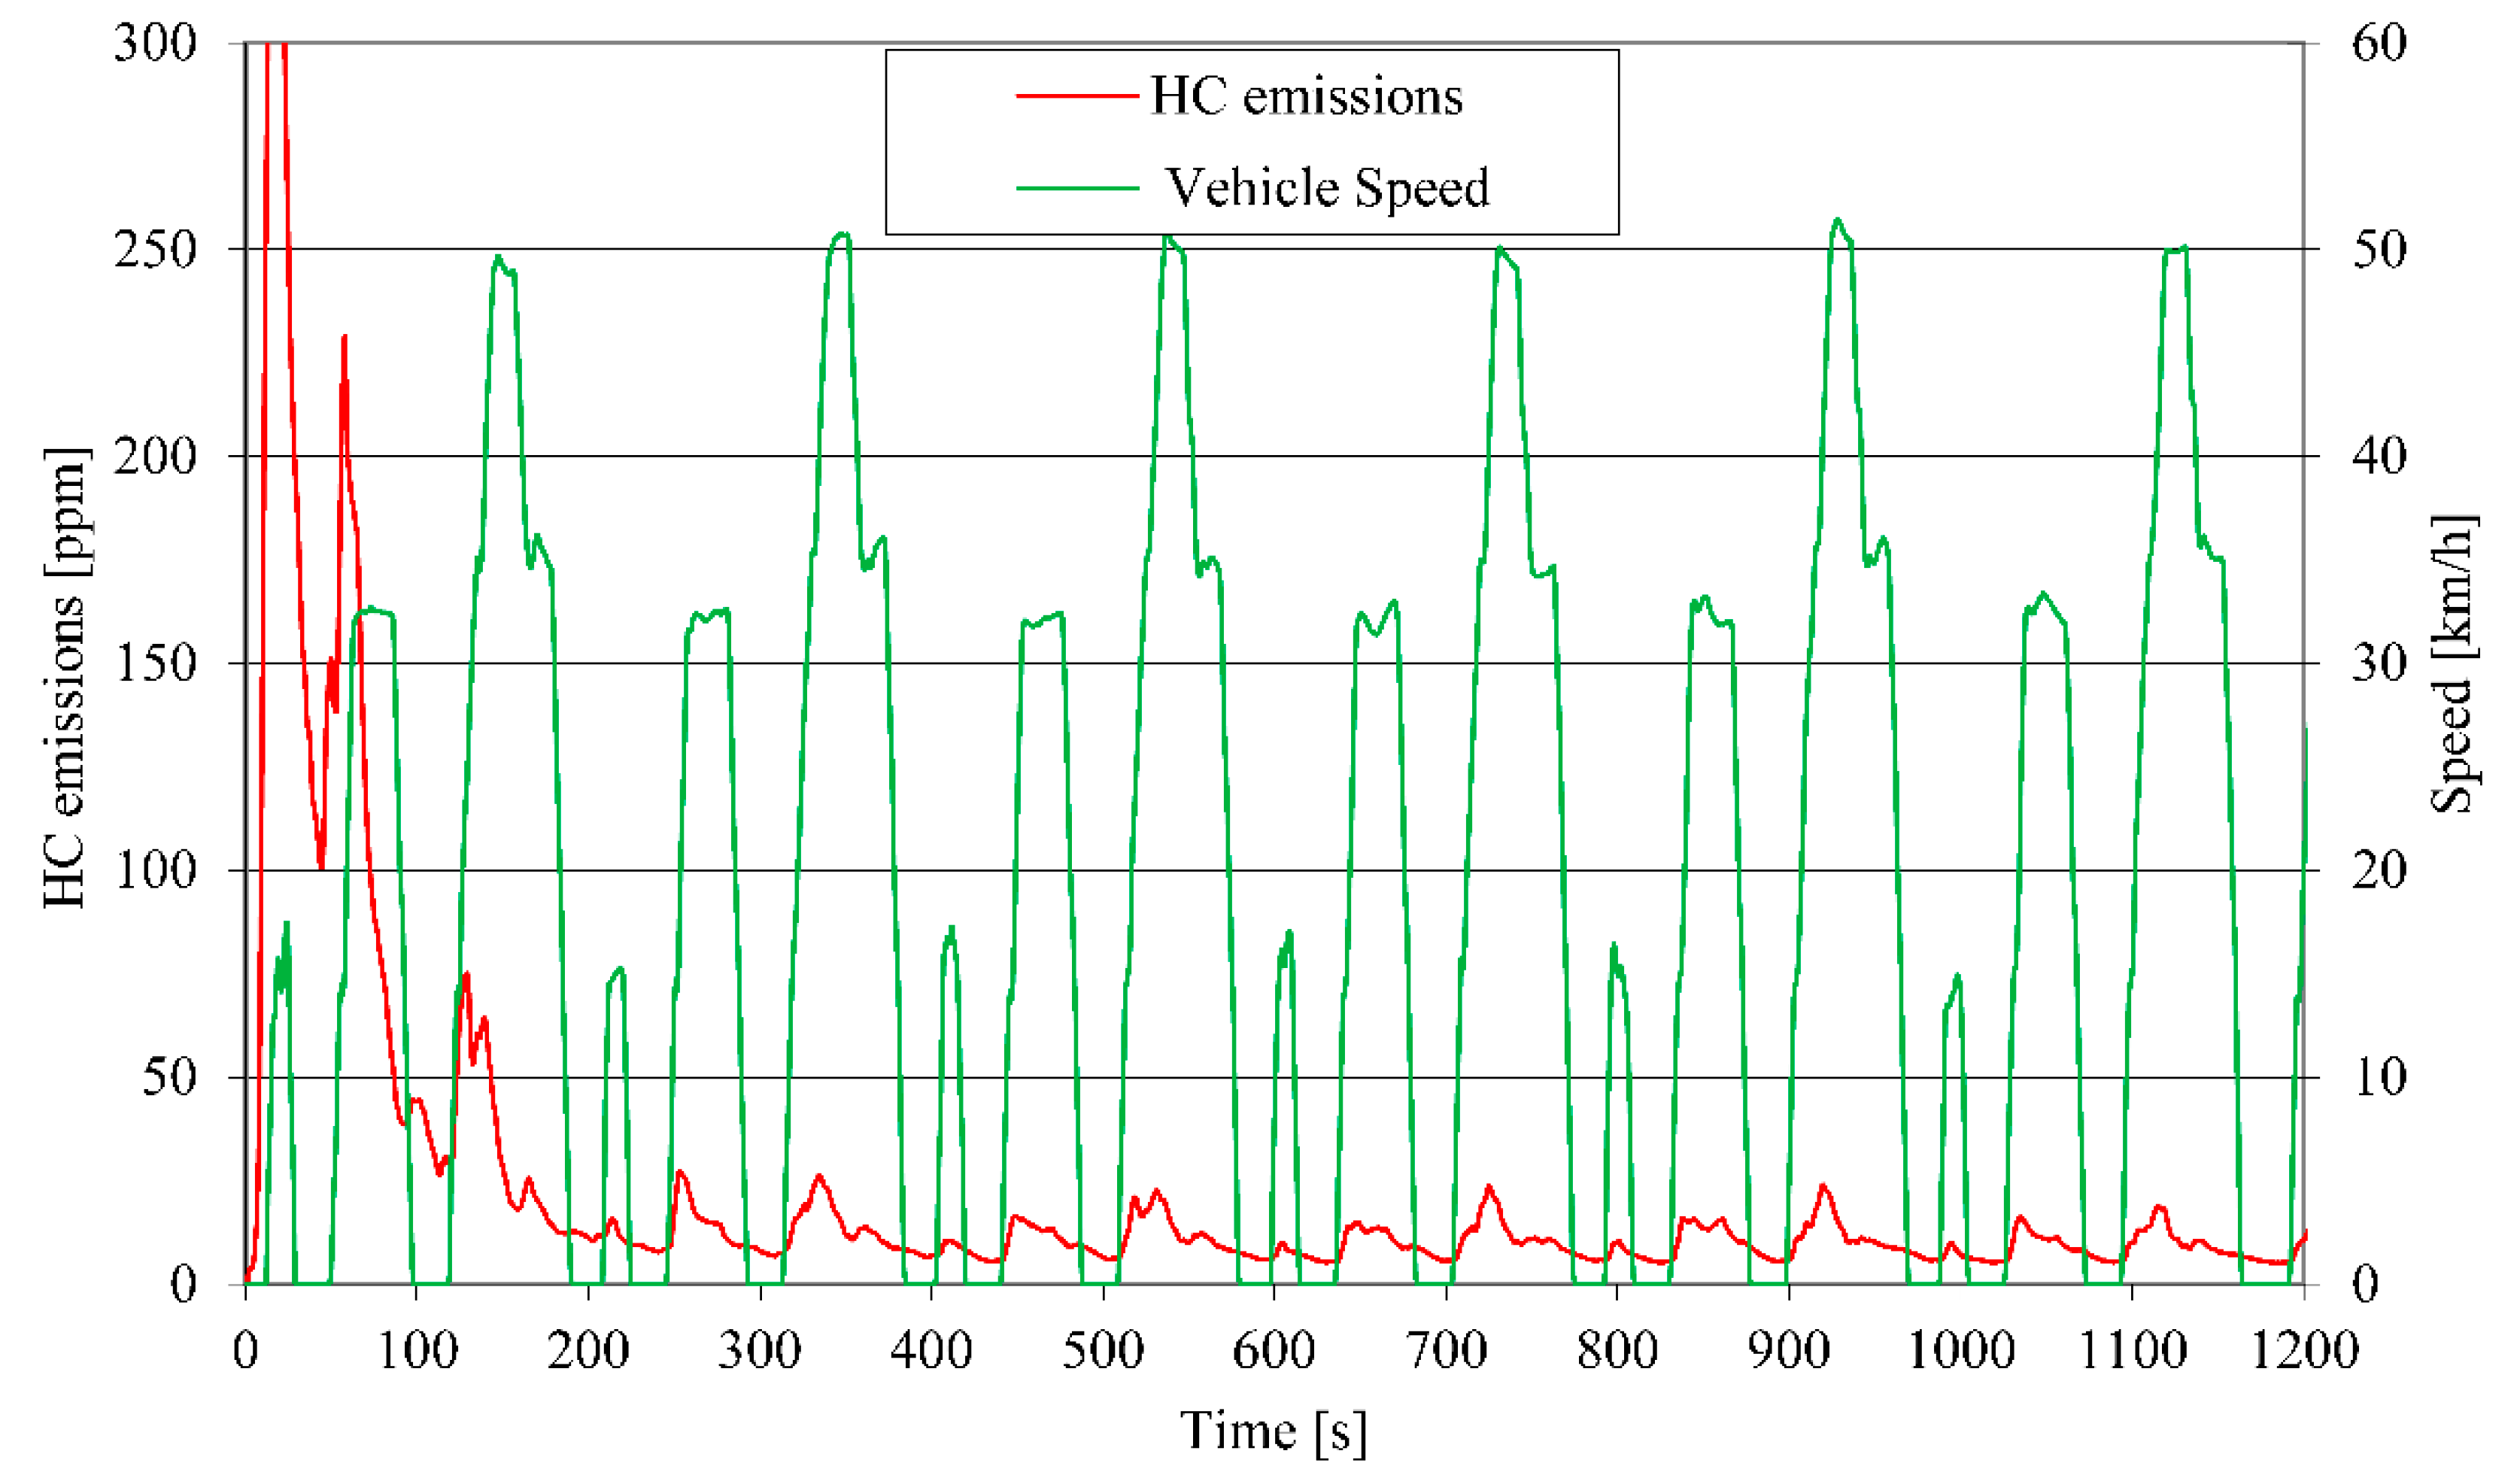
In the experimental campaign performed for the purpose of the present study, CO and HC instantaneous emissions (shown in Figure 2 and Figure 3, respectively) were measured during the UDC (Urban Driving Cycle) that is the Type Approval driving cycle according to the procedures laid down in the last Directives. Such figures also report the pertinent real speed profile. Several aspects must be considered to explain these results, which must be regarded as closely related: the kinematic characteristics of the different driving patterns (especially the acceleration phases with the related enrichment of air/fuel mixture), the light-off temperature and the conversion efficiency of the catalyst, and the additional mixture enrichment during the engine warm-up.
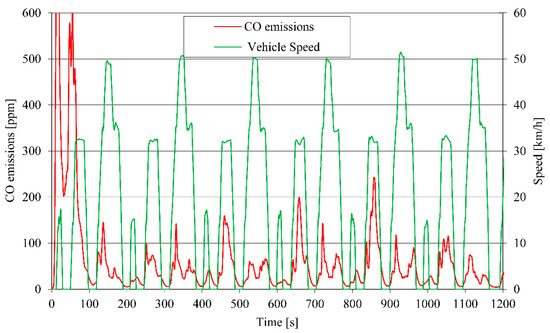
Figure 2.
CO instantaneous emissions and speed–time profile measured during the UDC driving cycle.
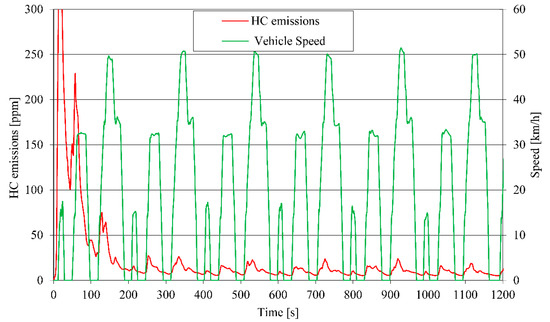
Figure 3.
HC instantaneous emissions and speed–time profile measured during the UDC driving cycle.
In these figures, first, it is evident that the instantaneous CO and HC emissions reach sudden and very high peaks during driving dynamics characterized by high levels of acceleration. In more detail, to ensure these operating situations, the electronic control unit bypasses the lambda sensor control and fixes a very rich air/fuel mixture which is sometimes outside the optimum efficiency range of the three-way catalyst, thus implying a significant increase in HC and CO emissions (open loop operating conditions). Indeed, the highest levels of CO and HC engine-out emissions were detected when rapid changes in vehicle speed are required. This is attributable not only to the three-way catalyst efficiency of this motorcycle, but also to imperfect combustion processes in specific driving conditions with a rapid, steep rise in engine speed that is no longer balanced by the catalyst [10,11]. Thus, not only does the required rich air/fuel ratio produce high levels of CO and HC exhaust emissions but the mechanism of controlling them is limited too.
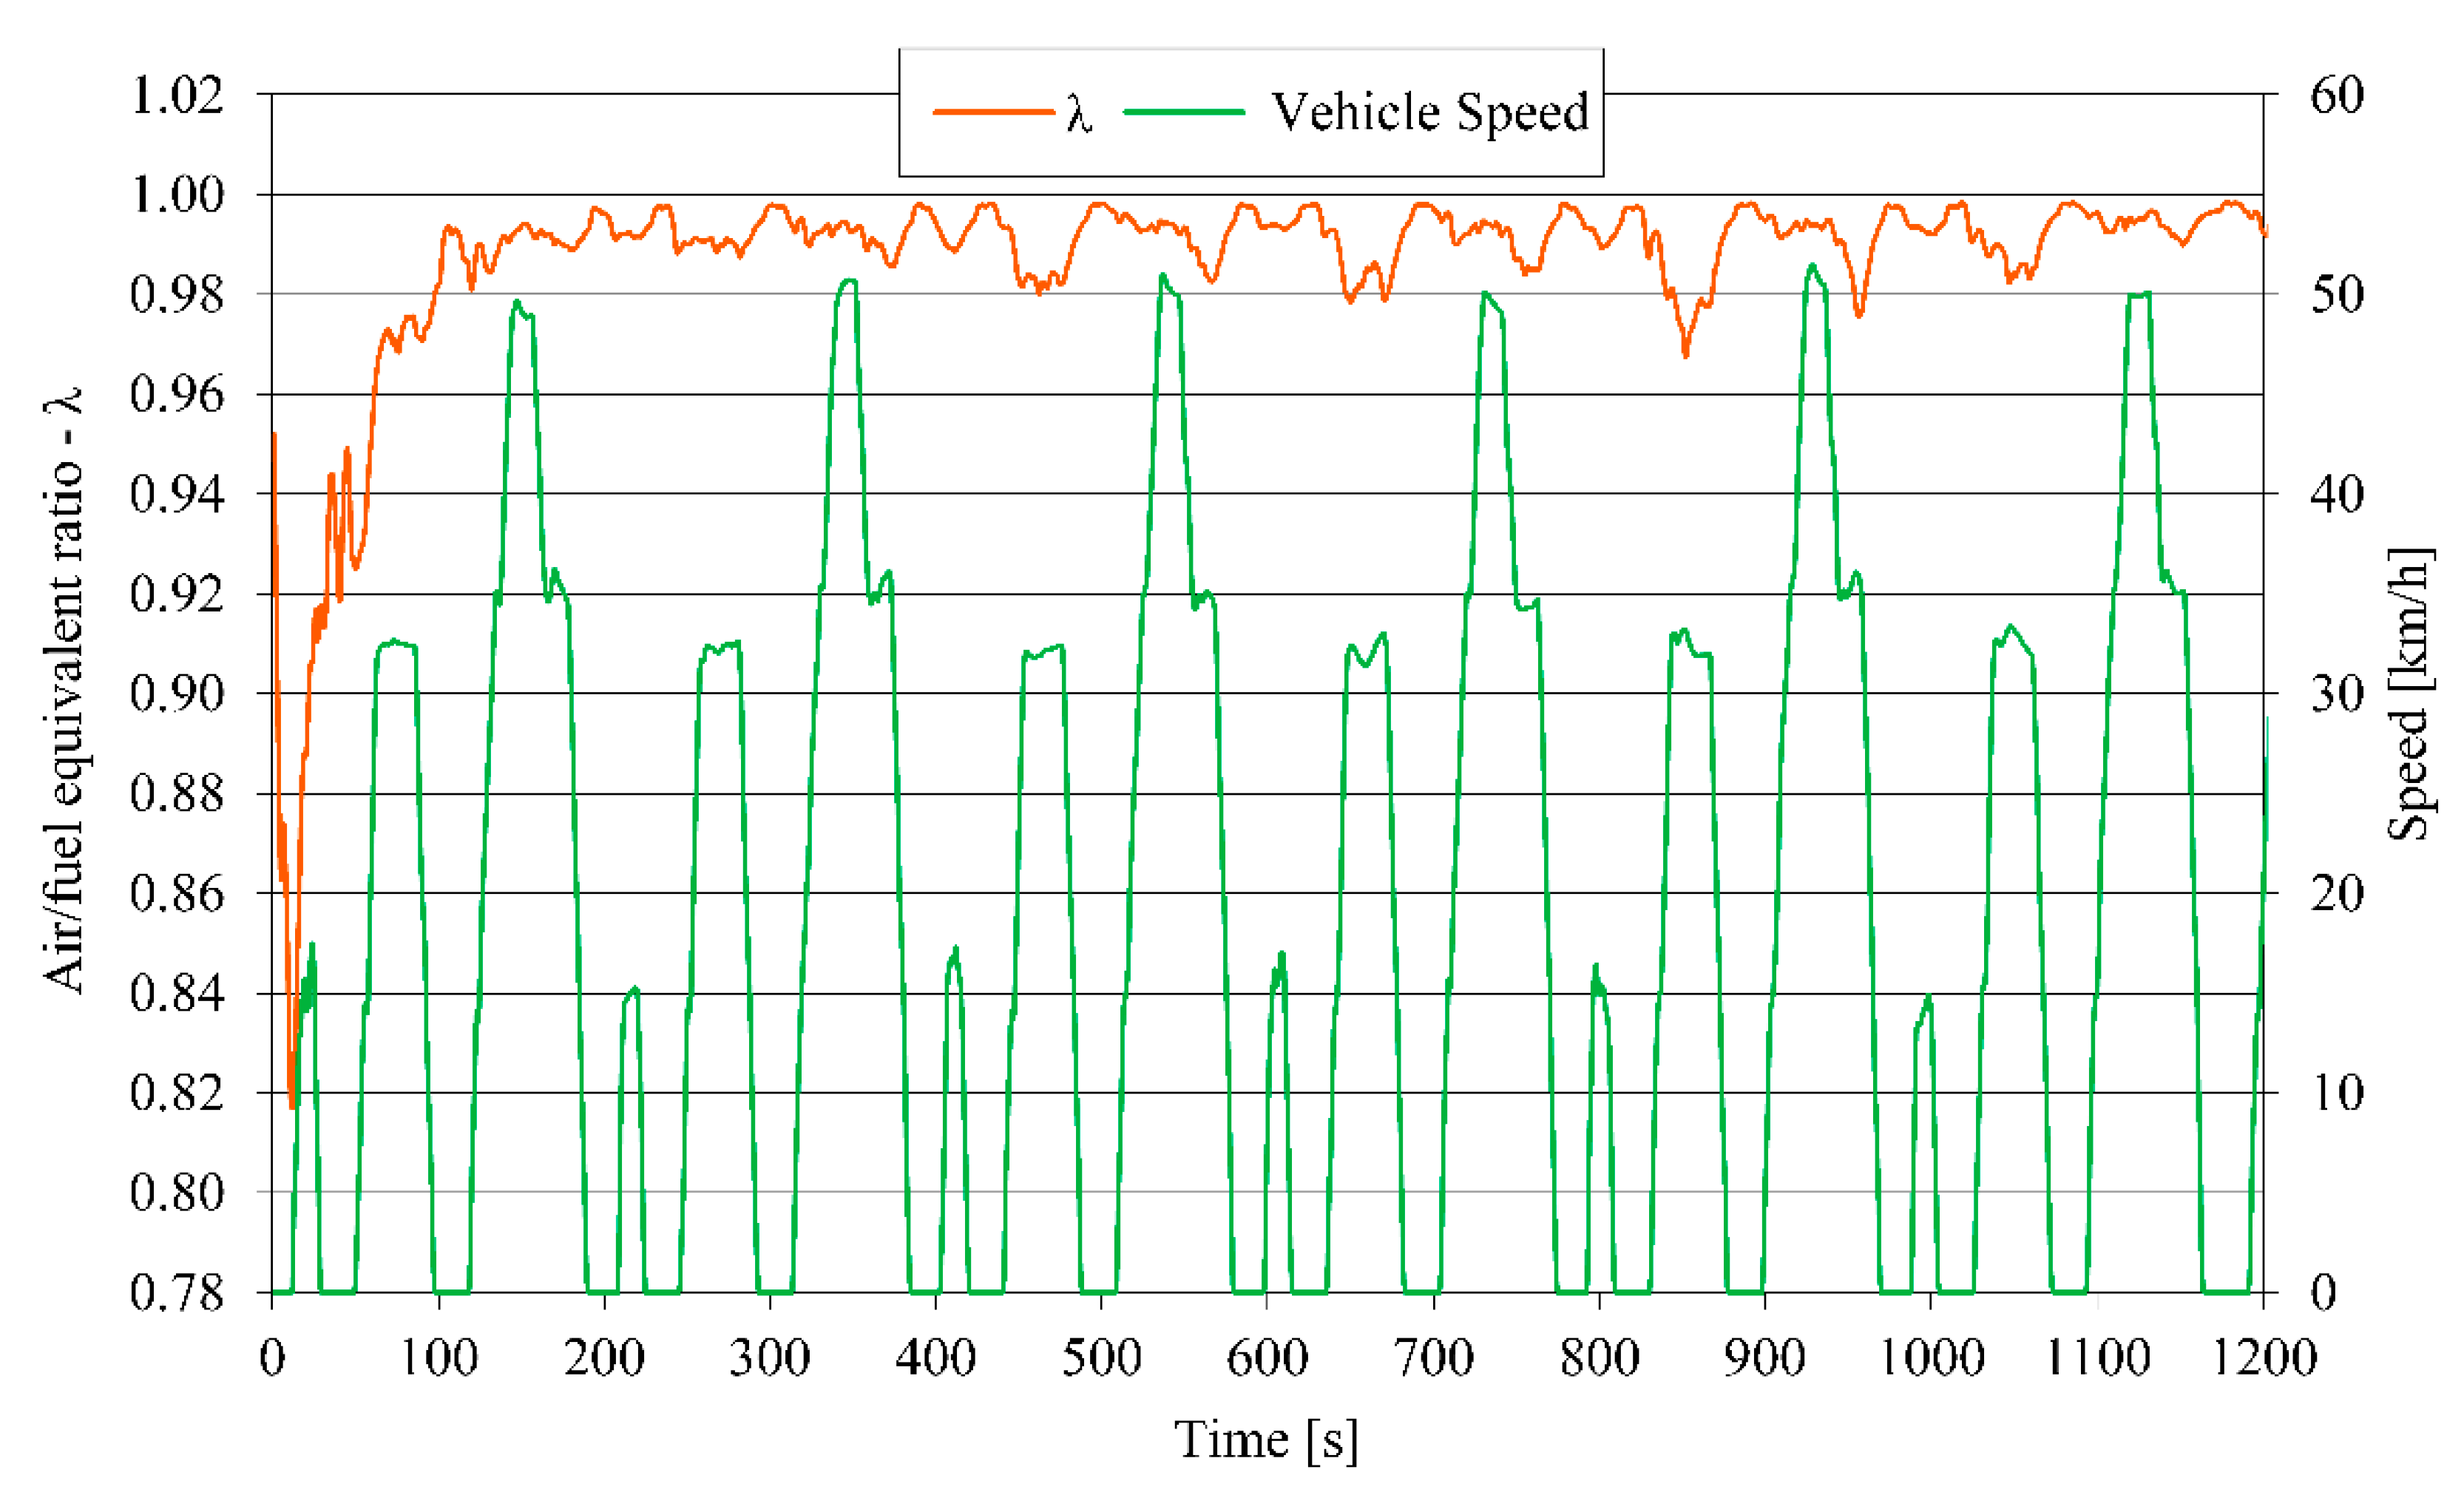
In this regard, Figure 4 shows the air/fuel equivalent ratio λ, which is calculated during the UDC driving cycle according to the compositions of the measured exhaust emissions of CO, CO2, HC and O2. The λ ratio periodically fluctuates around the stoichiometric value as the fuel flow is varied and, under specific driving conditions that include several acceleration phases, a rich air/fuel mixture is fixed to be provided to the combustion process, which accounts for the higher HC and CO exhaust emissions of the tested vehicle [12,13]. In effect, in Figure 4, it is shown that during the hot phase (after around 200 s), the equivalent ratio λ is only stoichiometric on average over time, while at high engine speeds and loads, and during acceleration phases, it decreases broadly from one time to the next. Hence, an enrichment of the air/fuel ratio is required in such driving conditions which affects the conversion efficiency of the catalyst, so producing higher emission levels [14].
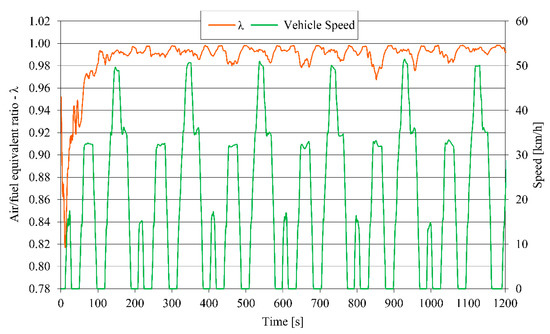
Figure 4.
Air/fuel equivalence ratio λ and speed–time profile measured during the UDC driving cycle.
The width of the optimum range of air/fuel ratios near stoichiometric, for the best conversion efficiencies of CO, HC and NOX, is very thin, about 0.1 air/fuel ratios (7 × 10⁻³ in equivalence ratio units) but, generally, it also depends on mileage use and catalyst formulation [15]. However, for an efficient closed-loop electronic control system, holding the air/fuel ratio accurately on the fixed stoichiometric value is also not an easy expectation.
In Figure 4 it is also evident that, during the cold phase of this motorcycle, the engine operates using a rich mixture in the cylinder to help overcome the poor mixing of the inlet charge because of fuel vaporization being slow and the cylinder walls being cold. Clearly, increasing the fuel flow to provide an easily combustible fuel-rich mixture increases the CO and HC emissions because of there being too much fuel present to attain regular and complete combustion. Therefore, until such an enrichment is removed and the temperature of the exhaust emissions is higher than the light-off temperature of the catalyst, HC and CO engine-out emissions remain very high.
To better analyze the HC and CO emission results shown in the previous figures, the kinematic characteristics of the different driving patterns will be examined in the following paragraphs. Indeed, for a constant level of average speed, high values of acceleration involve a rise in energy request for the execution of the specific driving pattern, with resultant enrichment of the air/fuel ratio.
3. Analytical Evaluation of Power Requirements
The power requirements in several typical riding situations can be estimated by a procedure based on the experimental kinematic parameters that characterize the driving dynamics collected during the UDC test cycle. The whole power (Ptotal) requested to move the motorcycle and the rider can be assessed as the sum of four terms: the power required to exceed the air strength (Pdrag), the power needed to overtake the hill (Phill), the power necessary to overcome rolling resistance (Pfriction) and the power needed to exceed vehicle inertia (Pacc) [16]. The calculations to assess these power requirements (expressed in kW) are shown in Equations (1)–(5).
In these equations, A [m2] and m [kg] are the frontal area and the total weight (motorcycle and driver), respectively, Cd [-] is the drag coefficient, δ [kg/m3] is the density of air, G is the slope grade, Rc is the rolling coefficient and, lastly, v [m/s] and a [m/s2] are the vehicle speed and acceleration, respectively. Clearly, for the vehicle under examination, all these values are well known.
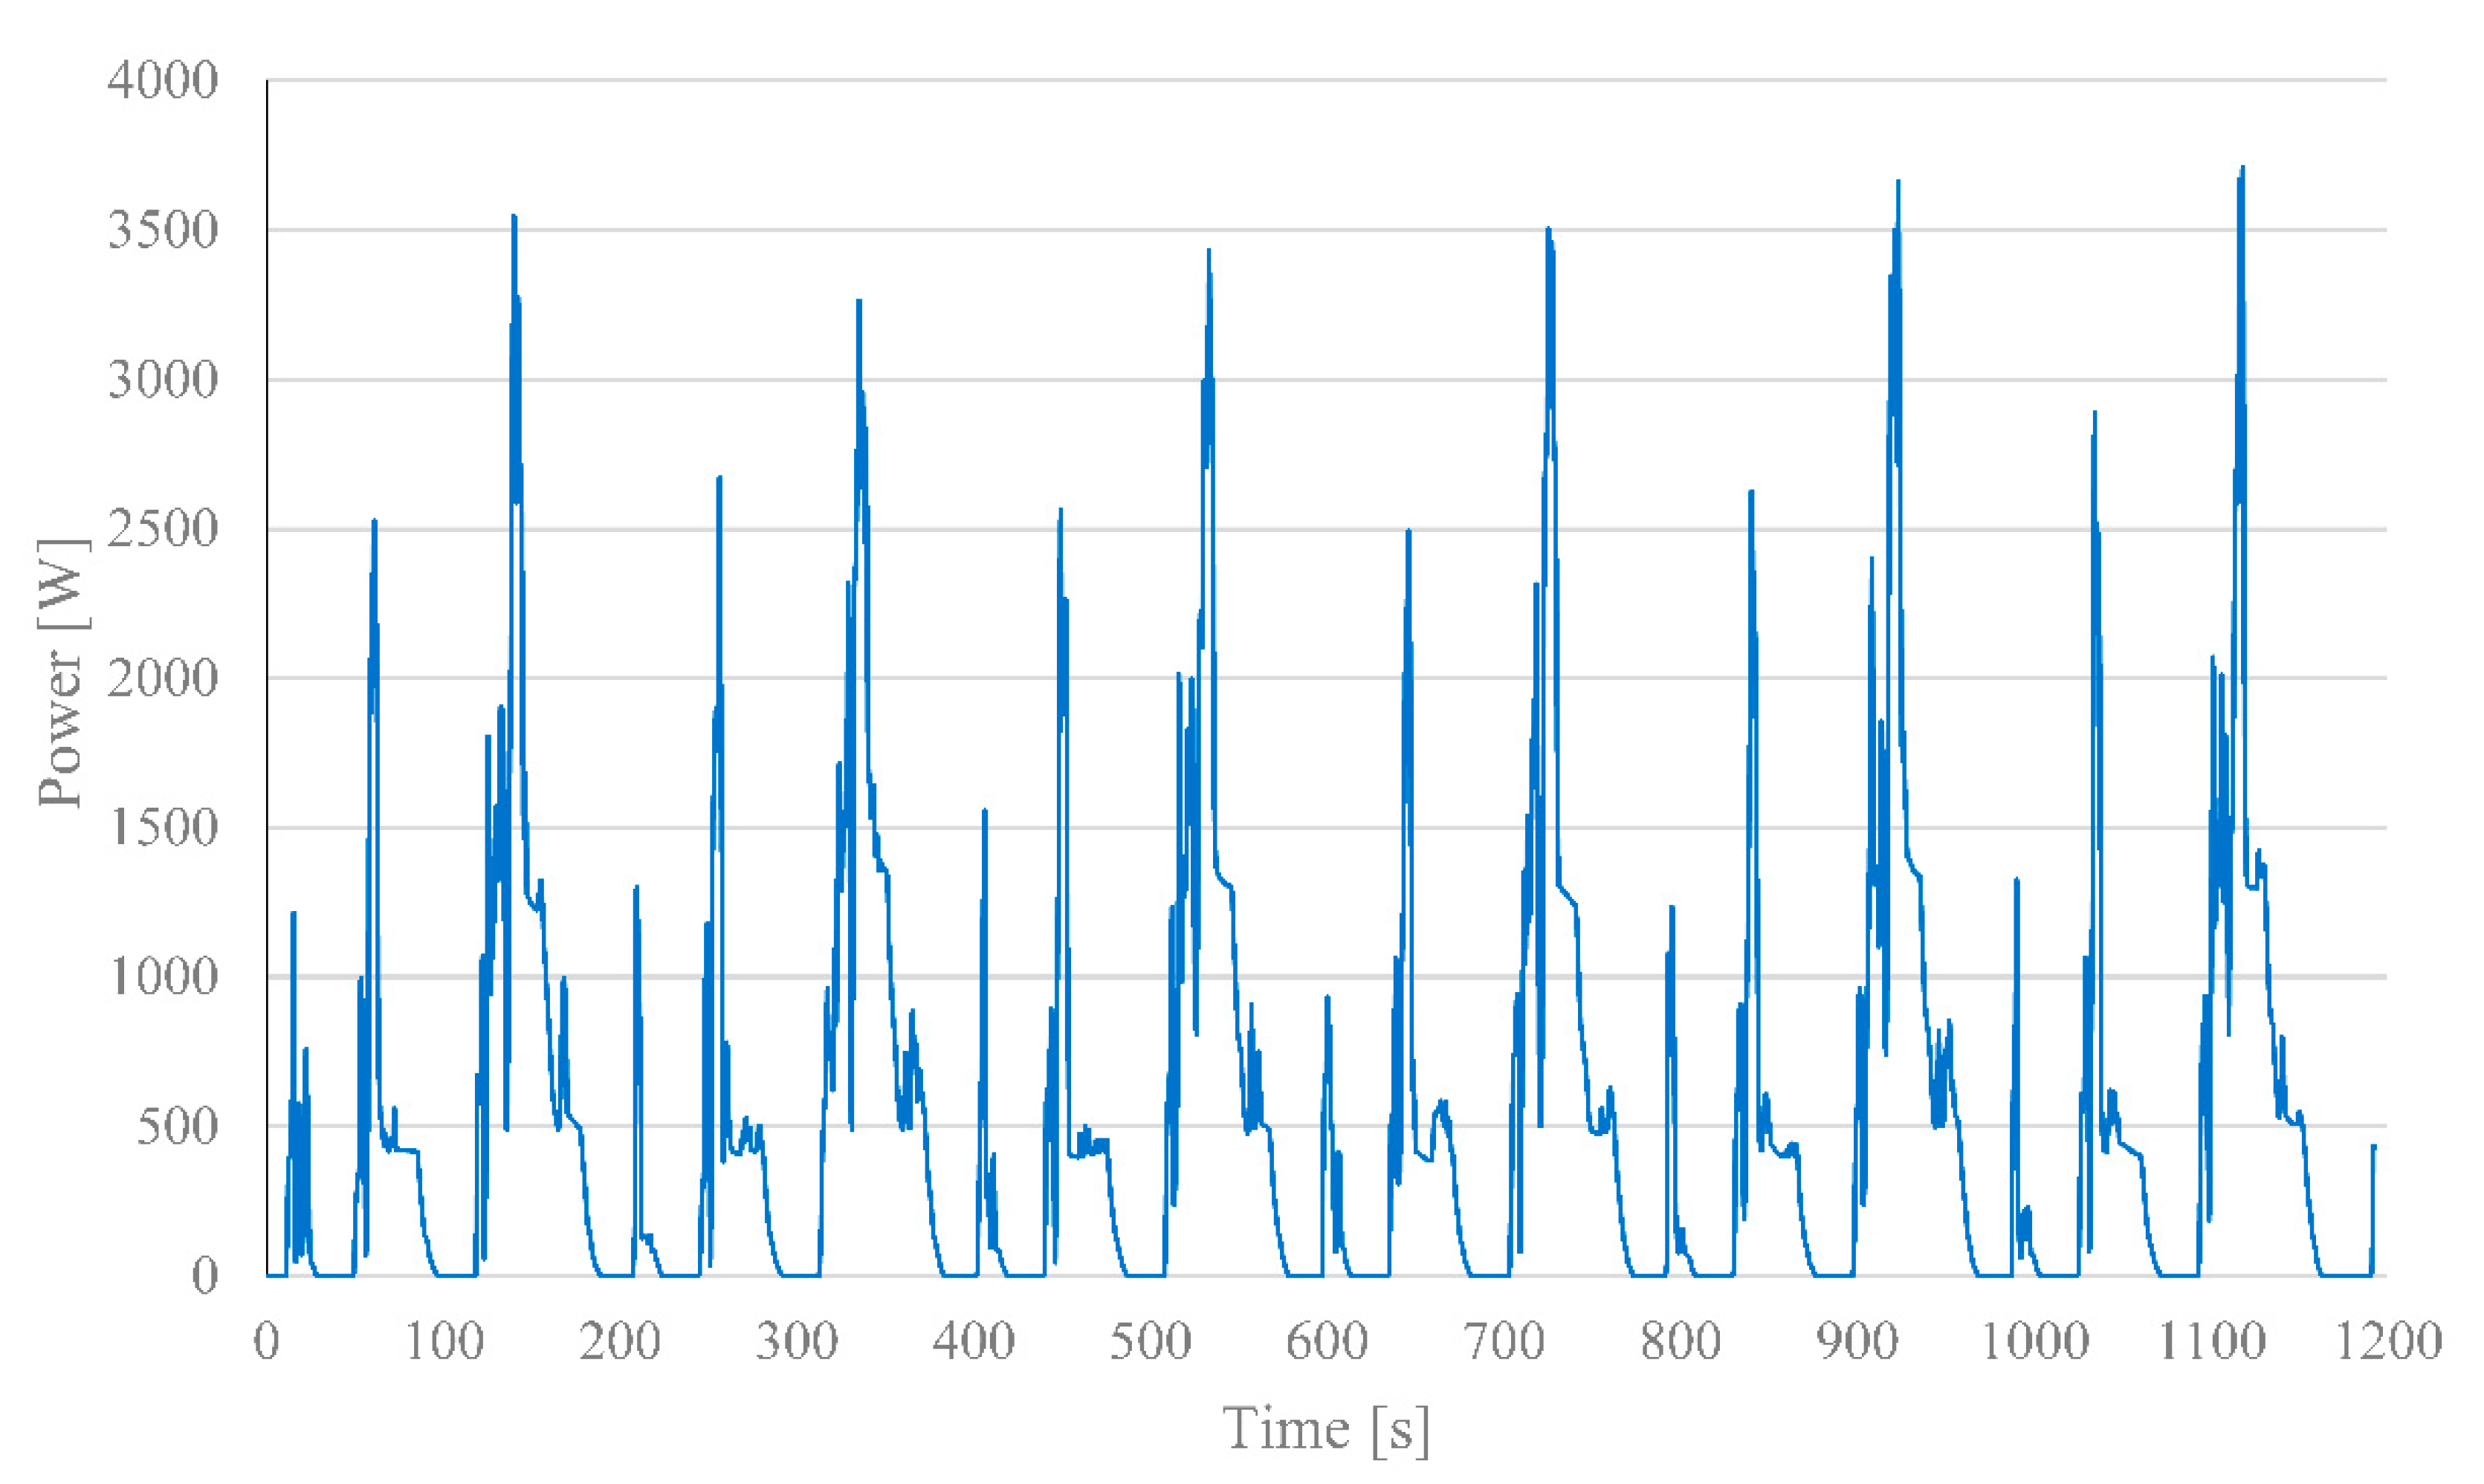
In Figure 5, the whole power requirements of the motorcycle under examination on the UDC driving cycle are estimated by using Equations (1)–(4) and the real speed–time profile (already reported in the previous Figure 2 and Figure 3). Clearly, since the motorcycle was tested on a two-wheeler chassis dynamometer, the power Phill needed to overtake the hill is not evaluated in these numerical simulations. Instead, regarding the power Pacc required to overcome the vehicle inertia during the acceleration phases of the UDC driving cycle, the kinematic parameters of the pertinent driving dynamics were considered and analyzed in detail. In general, for a constant level of average speed, high values of acceleration involve a rise in power request for the execution of the considered driving dynamics.
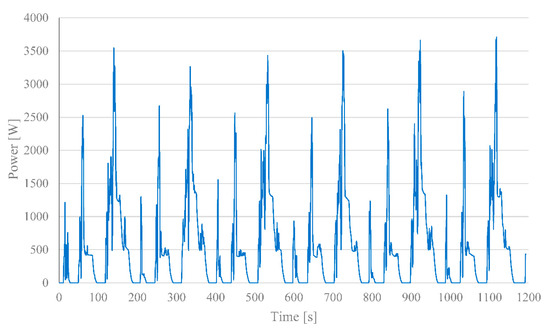
Figure 5.
Estimated global power requirements during the UDC driving cycle.
Thus, the driving dynamics of the UDC test cycle, which are assumed to cover various driving situations existing on urban roads, are analyzed by employing the collected real speed–time profiles. First, these online speed–time sequences were described with several kinematic factors to clearly differentiate its driving behaviour. Then, several driving situations were identified through a kinematic parameter that describes the driving behavior well in an urban context. This parameter is the product “v·a” of the instantaneous values of speed v and acceleration a, computed for a > 0 and expressed in m2/s3 (W/kg). Indeed, since this parameter characterizes (in Equation (3)) the tractive power Pacc per unit mass needed in order to overtake the vehicle’s inertia during the acceleration phases, it is strictly linked to the exhaust emissions and fuel consumption of the vehicle under investigation [16].
Table 2 shows the time-averaged levels of Pdrag, Pfriction and Pacc which are estimated according to the above-stated classification and by using the measured kinematic parameters of the UDC driving cycle collected during the experimental tests. The global energy request for the tested motorcycle on the whole UDC driving cycle is also shown in the same table, where Pmax represents the peak level of global power requirement (shown in Figure 4).

Table 2.
Power and energy requirements of the tested motorcycle during the UDC driving cycle.
4. Electrical Assistance on the Motorcycle: Modelling and Results
In this section, hybrid electric propulsion is proposed to reduce CO and HC exhaust emissions of the tested motorcycle in particular driving conditions that include high levels of acceleration, with resultant fast, steep increase in engine speed. In such phases, as exposed above, an enrichment of the air/fuel mixture is generally needed which affects the catalyst-conversion efficiency.
In the previous Figure 5, peak levels of power requirements correspond to driving dynamics with high levels of acceleration, which involve a growth in the tractive power per unit mass necessary to overtake the vehicle inertia of the motorcycle. As exposed above, these high levels of power requirement during the acceleration phases are accountable for CO and HC over-emissions from the thermal engine.
A minimally invasive solution to reduce the environmental impact of this vehicle is to install an electric motor directly on the wheel hub, which can assist the thermal engine during transient phases, i.e., during acceleration phases. To choose the correct motor size, it is necessary to make some preliminary assessments, including evaluation of the maximum torque during transient acceleration, the wheel’s angular speed, and the nominal supply voltage of the electric motor [17,18]
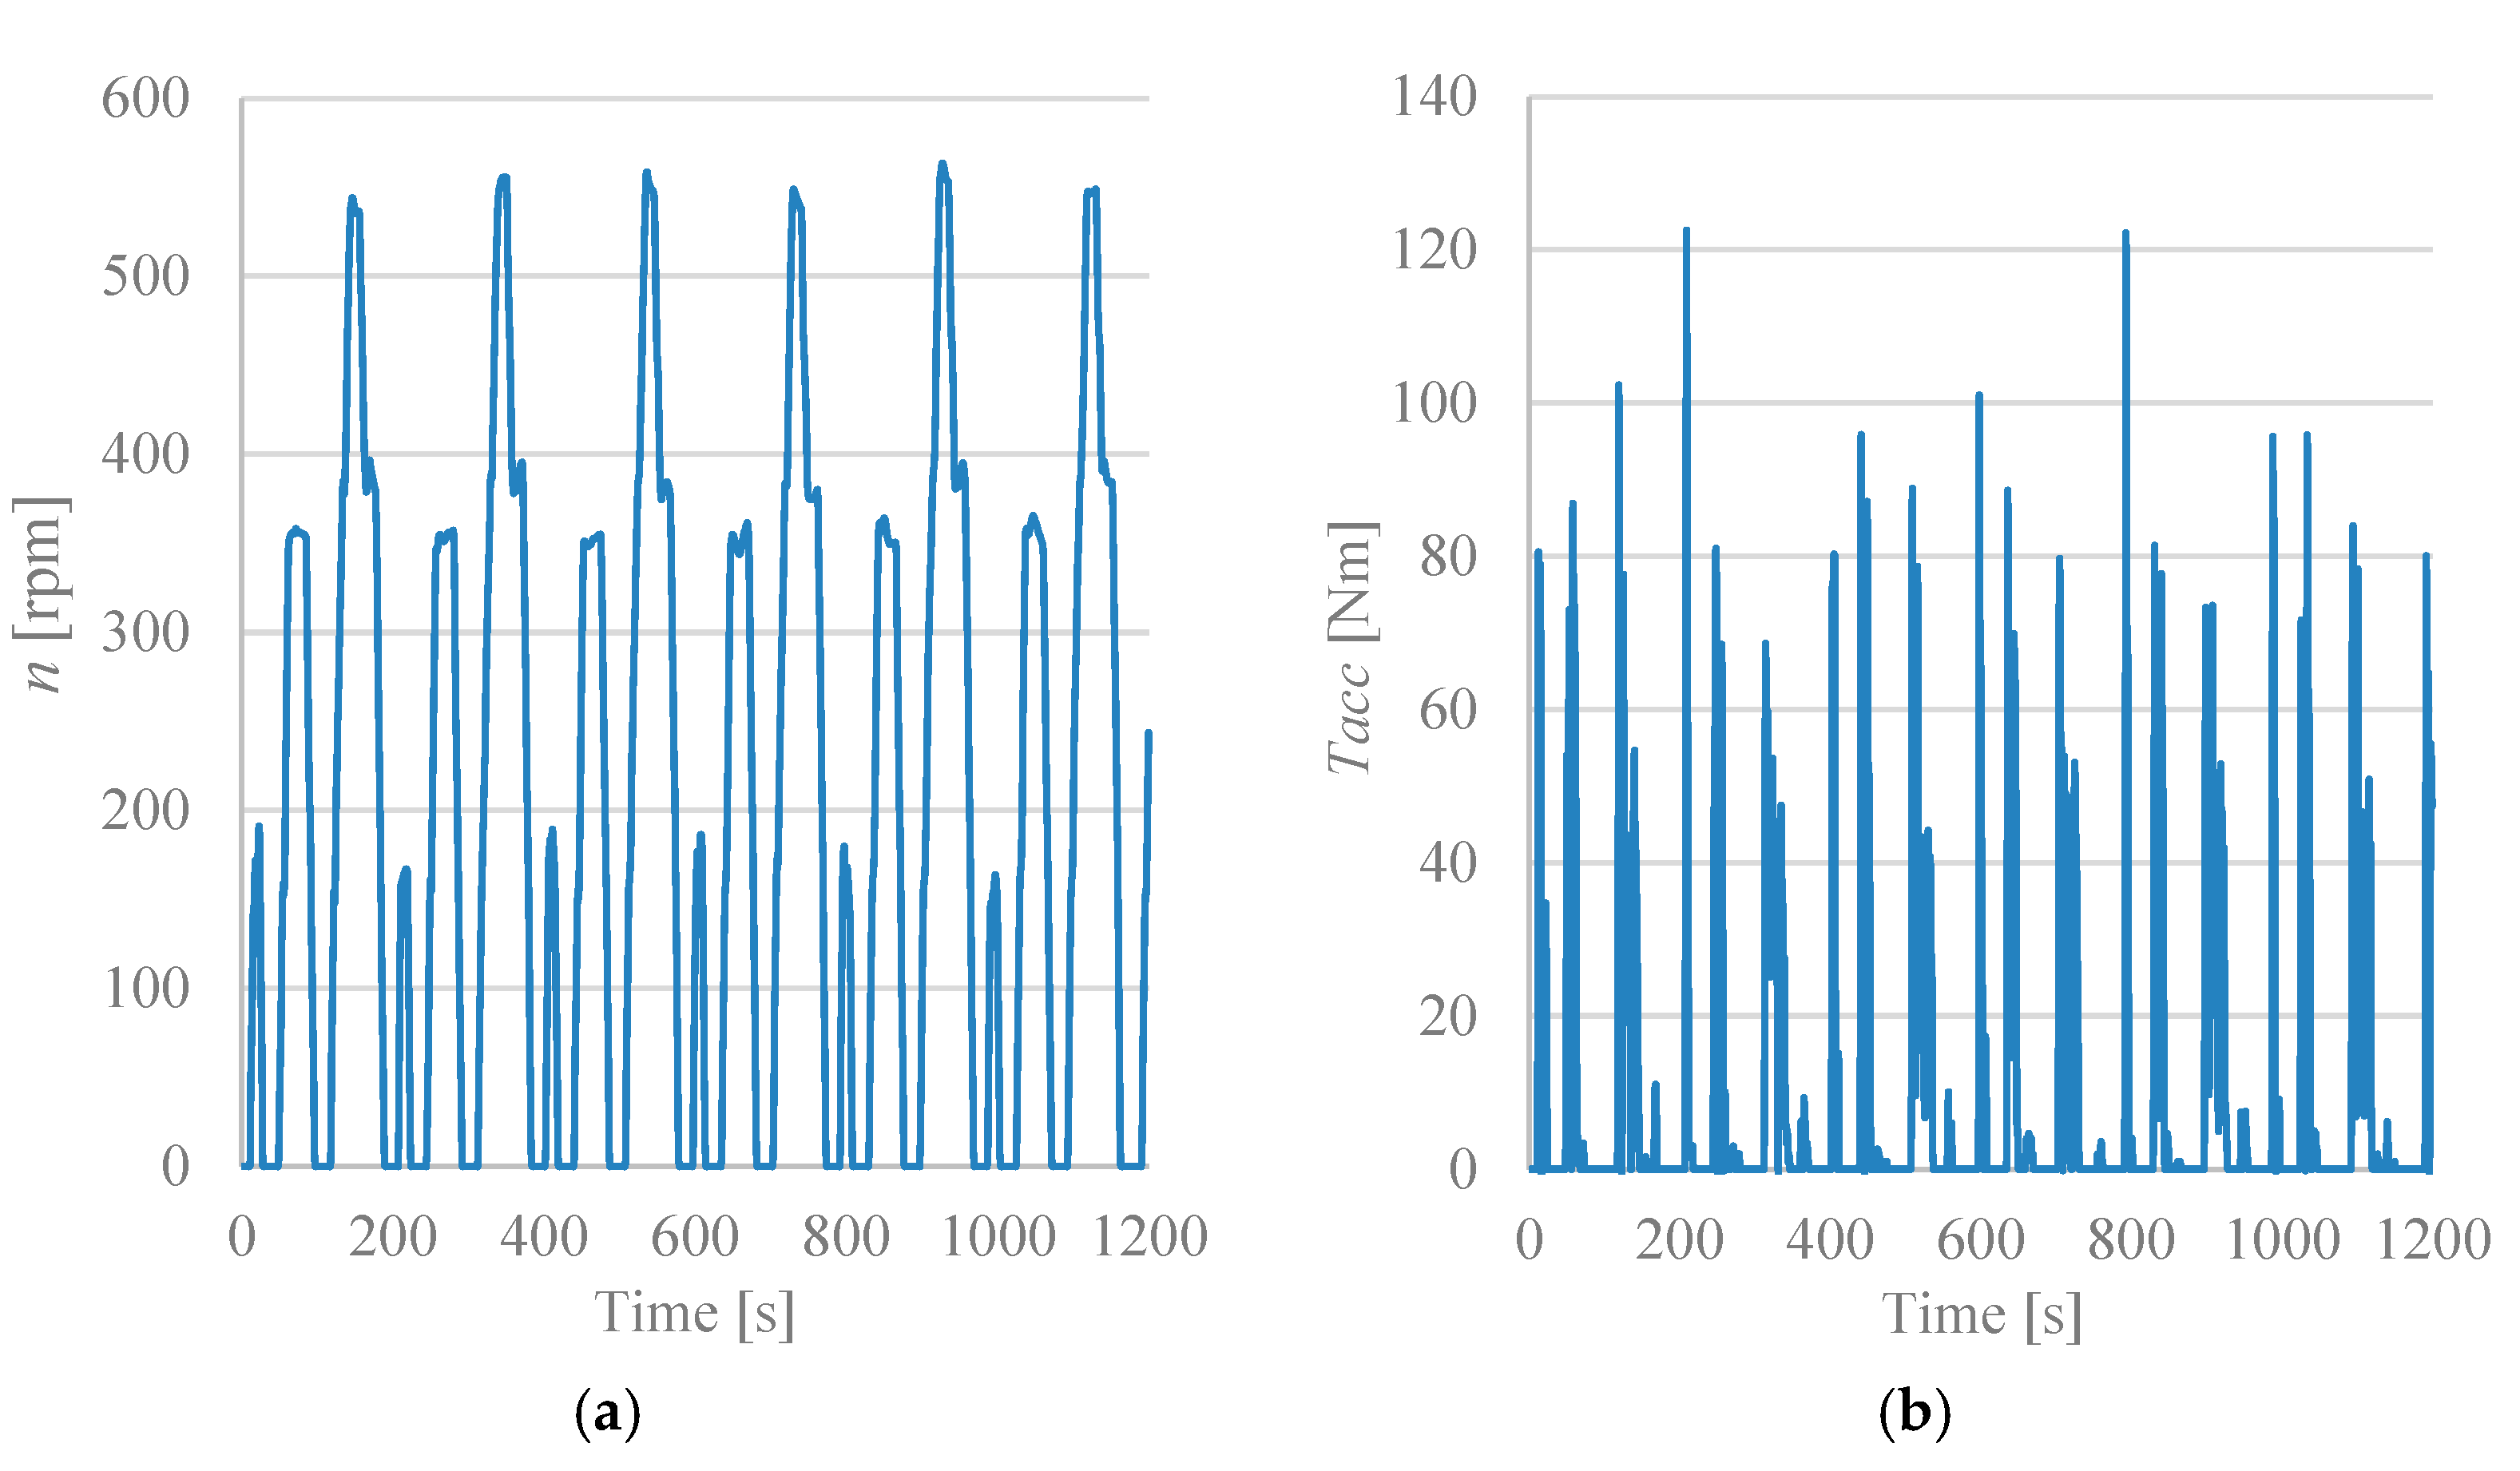
Starting from the power required for the acceleration phases Pacc and the angular speed n, the acceleration torque Tacc (which represents the acceleration mechanical load) can be obtained by adopting Equation (6). Once the wheel radius r is fixed, the angular speed n can be clearly evaluated in Equation (7), where v is the linear speed of the motorcycle (reported in green line in Figure 2 and Figure 3). The angular speed n and the acceleration torque Tacc during the UDC driving cycle are displayed in Figure 6.
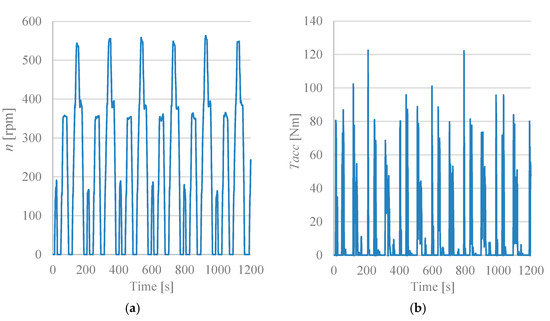
Figure 6.
The angular speed n (a) and the acceleration torque Tacc (b) during the UDC driving cycle.
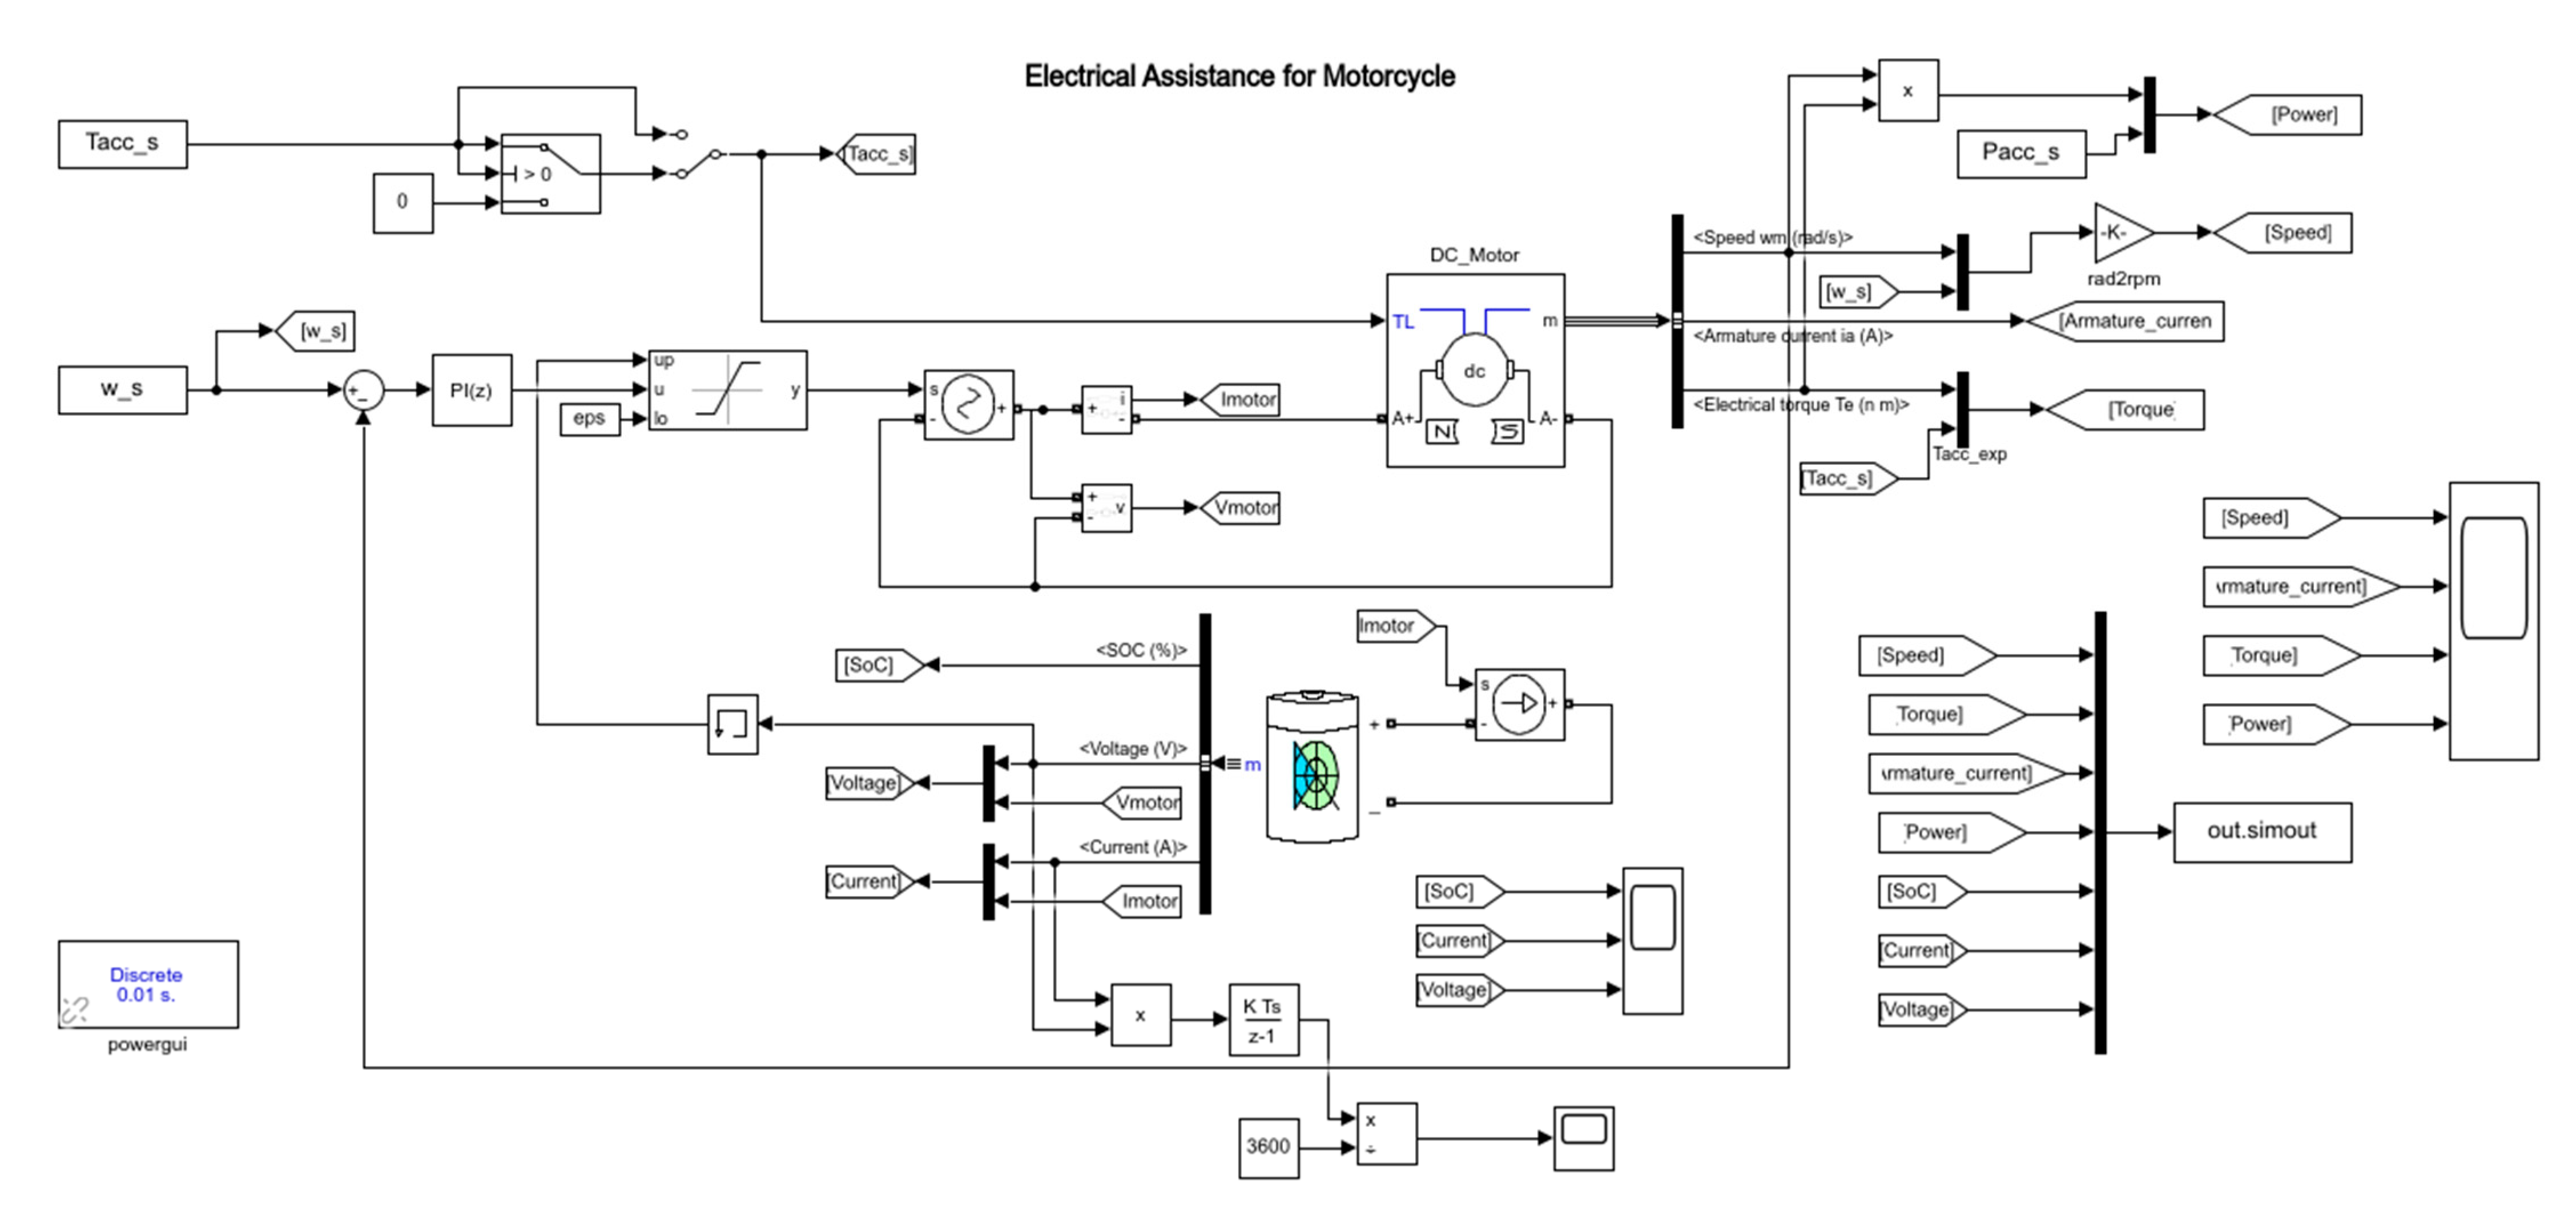
Moreover, for the purpose of this research, a PM (permanent magnet) BLDC motor was selected with a supply voltage of 72 Vdc, a maximum supply current of 150 A, and 160 Nm of continuous torque. Subsequently, the selected PM BLDC motor was modelled with a suite of Matlab/Simulink scripts and subroutines, as shown in Figure 7, where the DC machine model is described through the second principle of dynamics for a rotating body (Equation (8)).
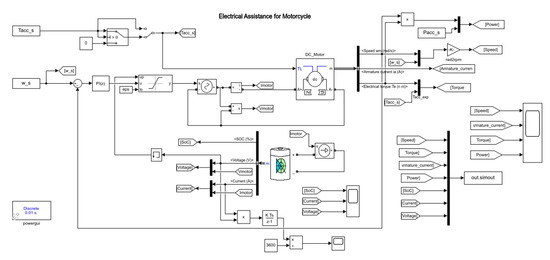
Figure 7.
Electrical assistance model in Matlab Simulink.
In such an equation, is the angular motor speed, is the electromechanical torque, where , and represent the motor inertia, the viscous friction coefficient and the Coulomb friction torque, respectively. In more detail, in this Matlab Simulink model, the mechanical acceleration torque is the DC Motor input, whereas the motor control consists of a PI controller, in which the experimental angular speed n and the simulated one are compared. Subsequently, the PI controller modulates the DC motor supply voltage and, consequently, the current Ia supplied to the motor. The electromechanical torque delivered by the BLDC motor is proportional to the armature current , as shown by Equation (9), where is a constant [19].
The sizing of the energy storage system must satisfy several electrical and mechanical constraints. With regard to electrical features, the battery pack must guarantee the following conditions: the minimal energy storage to ensure the execution of the UDC driving cycle, DC-link voltage values compatible with the chosen BLDC motor and, lastly, discharging C-rate values able to provide the necessary power during the supply phase. On the other hand, concerning mechanical constraints, the maximum battery weight and requirement space cannot be neglected. For the selected BLDC motor, a lithium-ion battery storage has been modelled with a 72 Vdc nominal voltage and 27.2 Ah nominal capacity.
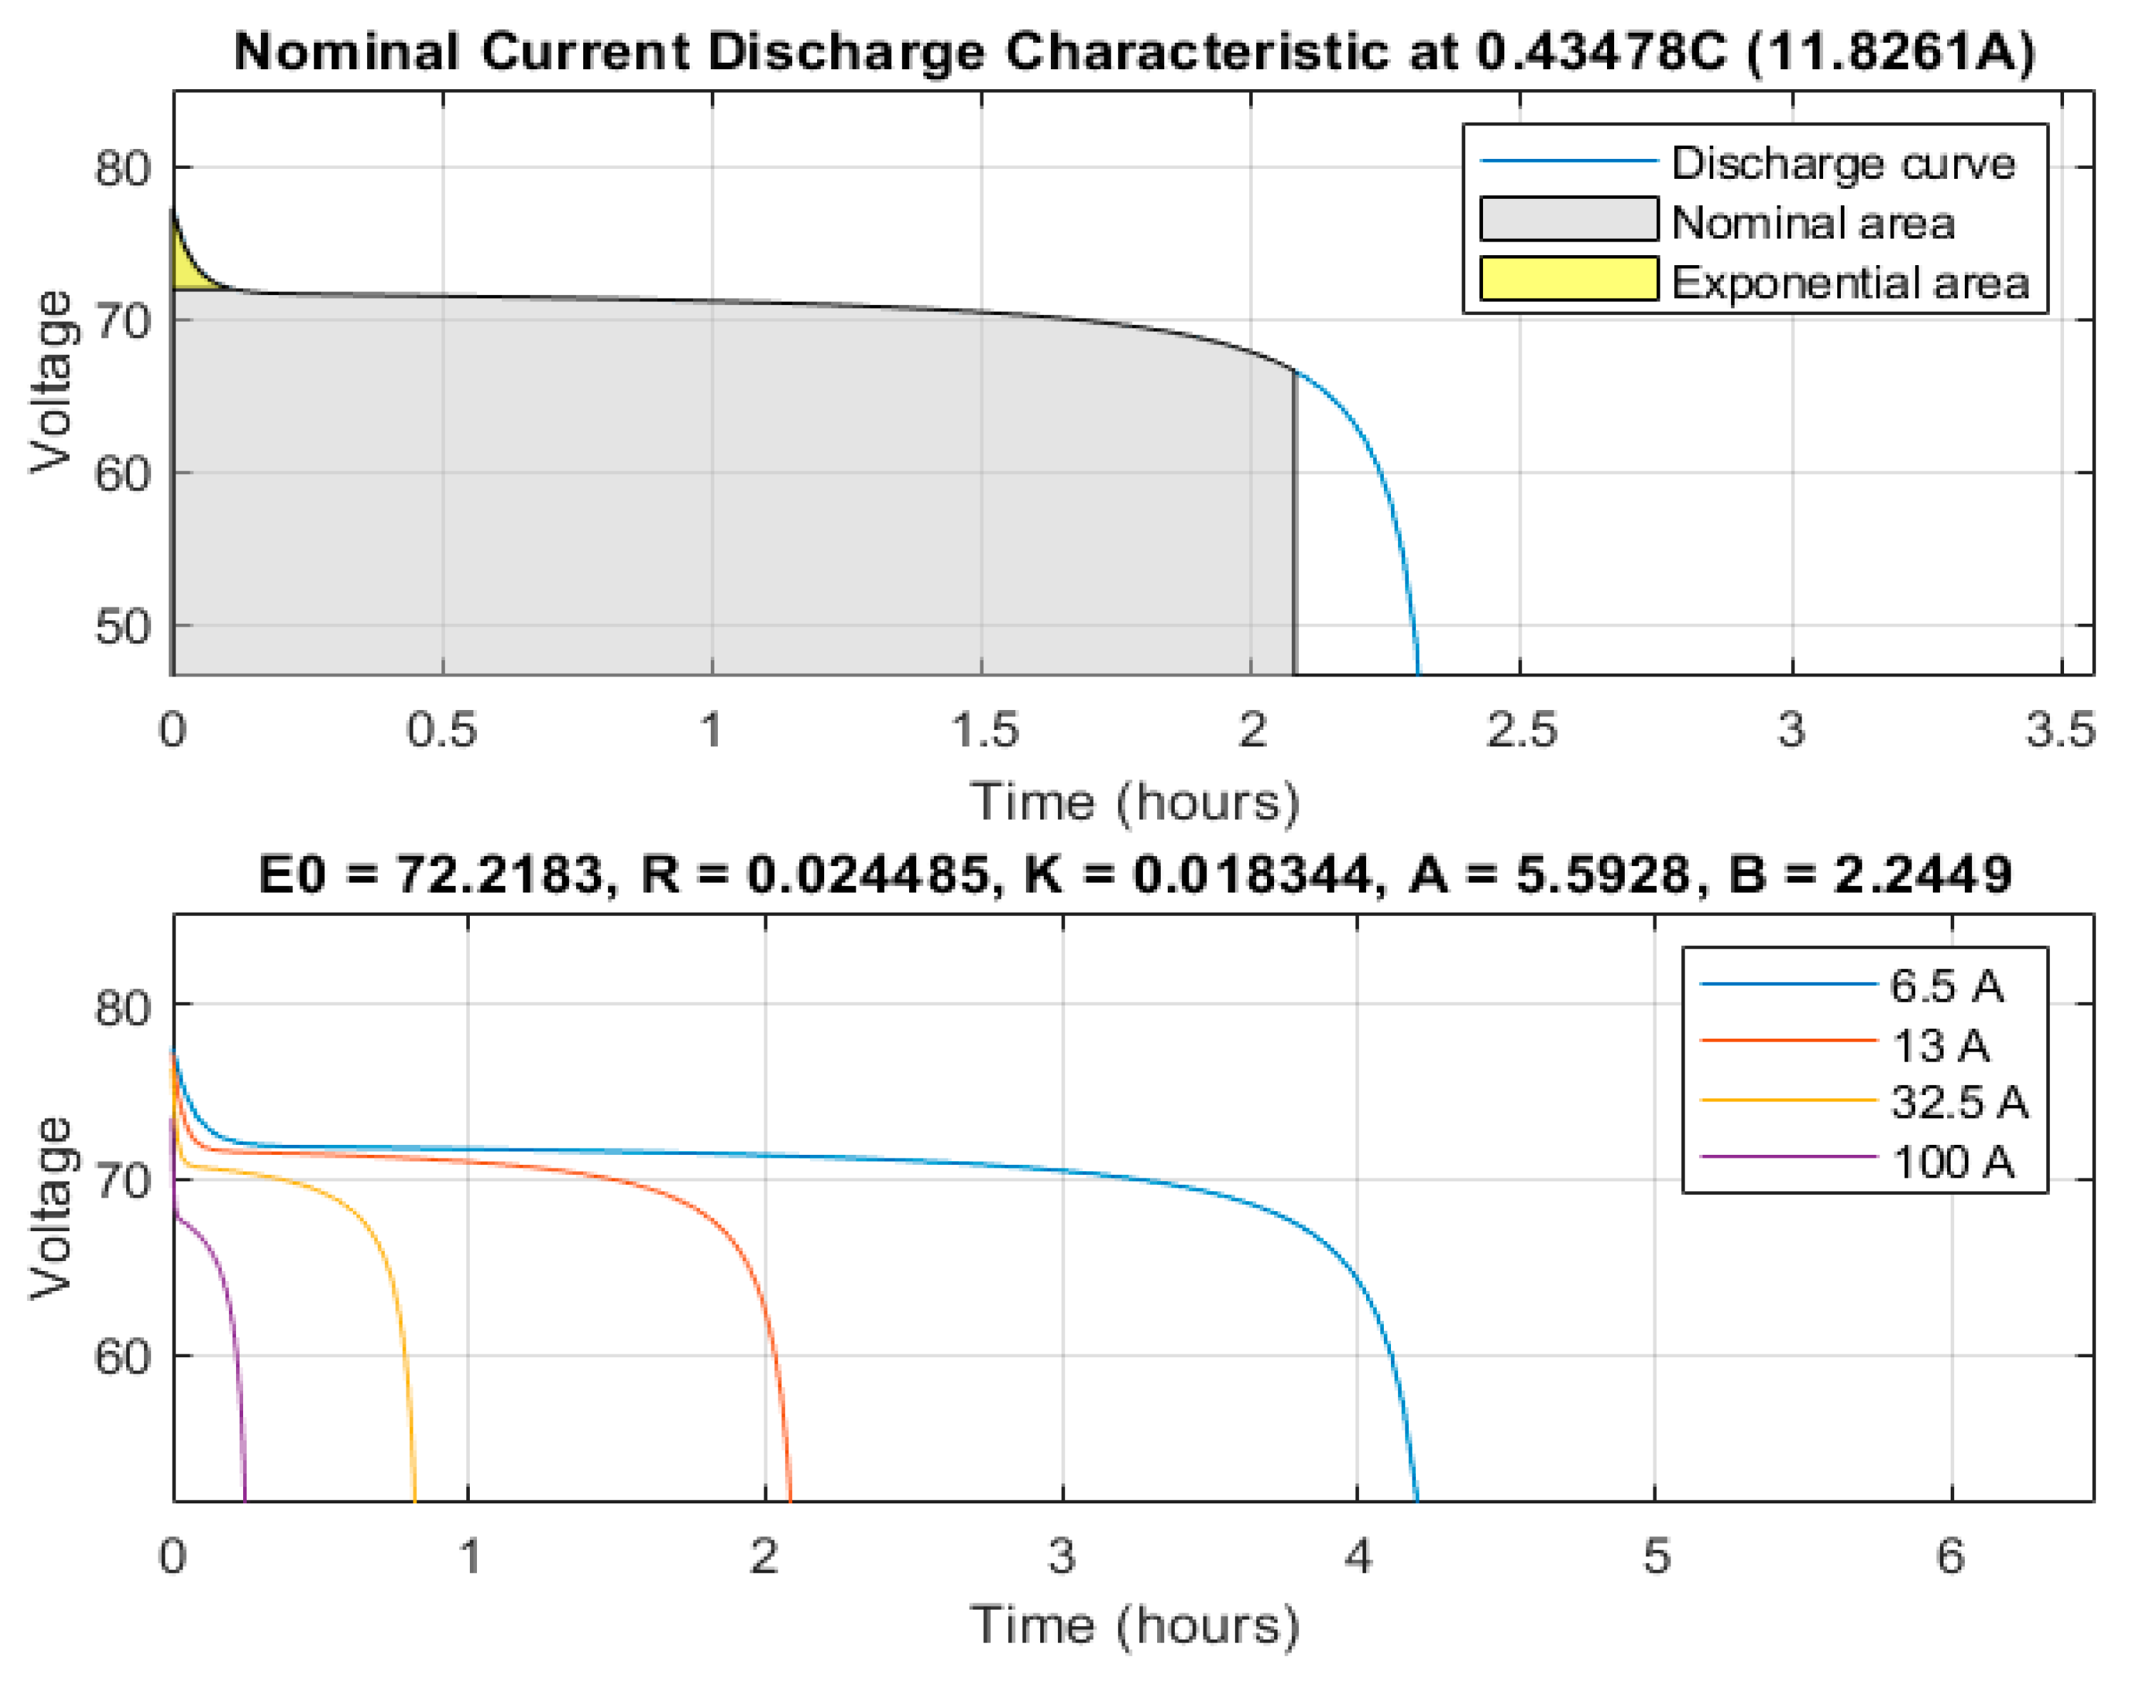
The battery voltage Vbatt has been modelled using the Simulink Battery block. This block implements a generic dynamic model that represents the most popular types of rechargeable battery [19]. In this study, a lithium-ion pack battery has been modelled, neglecting the battery aging effect. This battery was realized with 144 single cells, arranging 18 series and 8 parallel, each with a nominal voltage of V and a max capacity of Ah. The discharge model has been described through Equation (10), where represents the discharging current, is the filtered current value, is the battery capacity, and is the current time integral plus the initial battery charge [18]. Moreover, in Table 3, the most important parameters , , , A and considered in this model have been shown. These parameters, known for single cells, have been recalculated by battery model code to obtain the good parameters able to describe the battery pack discharge behaviour shown in Figure 8, composed of series and parallel combinations of cells.

Table 3.
Lithium-ion battery parameters.
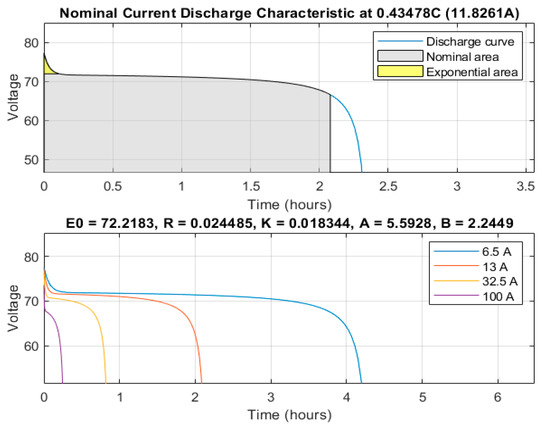
Figure 8.
Discharge battery characteristic modelled in Matlab Simulink.
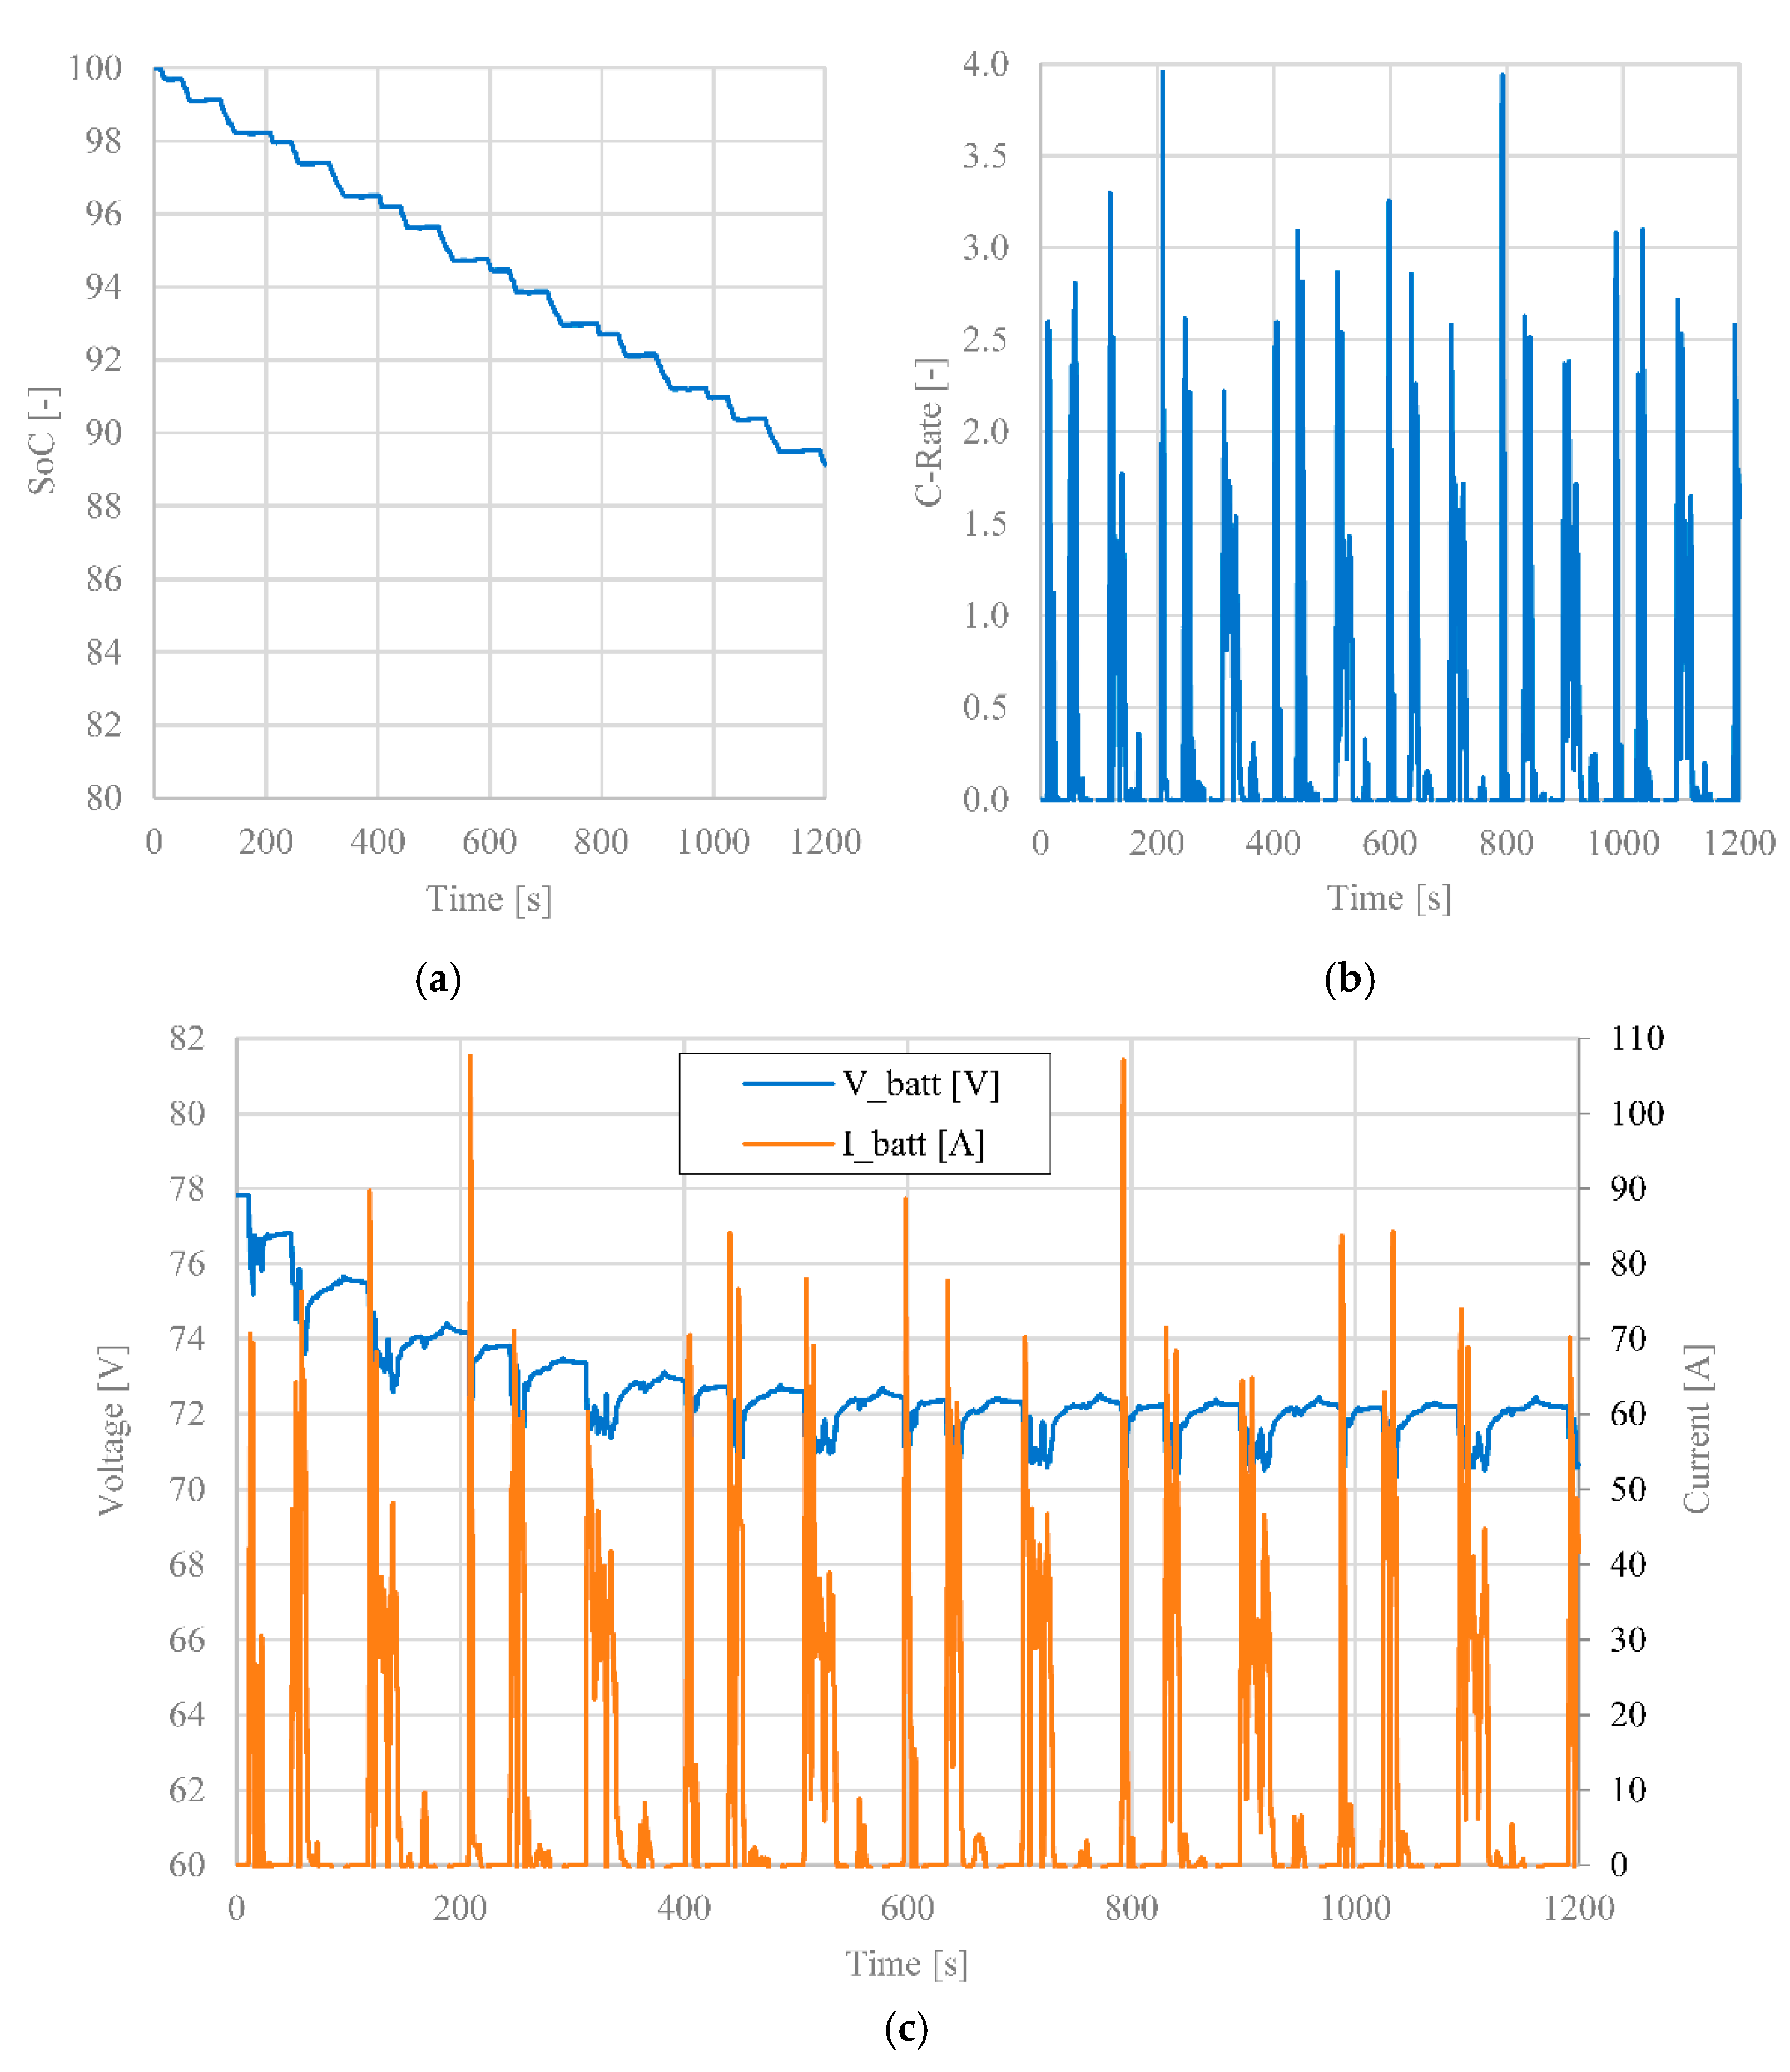
In this research, an initial full State of Charge (SoC) of the battery was assumed (namely ). The SoC after 1200 s, which is the duration of the UDC driving cycle, is equal to , as shown in Figure 9a. This means that, for the selected battery pack (which has a nominal capacity of 27.2 Ah and nominal tension of 72 Vdc), approximately 11.8% of the whole charge is consumed after the execution of one repetition of the UDC cycle.
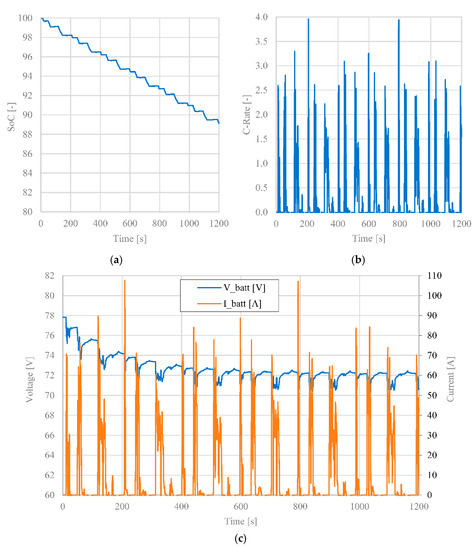
Figure 9.
Battery characteristics: (a) Battery State of Charge; (b) Discharge current; (c) Battery voltage and current.
In other words, approximately 211 Wh of battery energy is consumed in one test repetition. Therefore, considering a full battery discharge and never going below 20% of the SoC, up to around 6.4 repetitions of the UDC driving cycle can be guaranteed, which correspond to an autonomy of about 44.8 km. The chosen battery must also be able to supply high current for a short time, with a maximum discharge C-rate equal to 4, as clearly shown in Figure 9b. Moreover, the battery current supplied to the motor is always below 110 A, as shown in Figure 9c, in accordance with the limits set by the BLDC motor manufacturer.
Lastly, in this research, an environmental analysis was performed to compare the tested thermal motorcycle with a similar one, that has the same technical characteristics of the tested vehicle and is equipped with an electric motor directly installed on the wheel hub (that is the configuration proposed in this research). Since this environmental analysis was performed under the same driving conditions of the selected UDC driving cycle, it is possible to estimate the share of CO and HC emissions that could be saved utilizing a hybrid motorcycle instead of a conventional thermal motorcycle.
Then, if the hybrid motorcycle was used, the share of saved CO and HC emissions on the distance travelled of 44.8 km (corresponding to the autonomy of the battery) was estimated starting from the experimental values of CO and HC emissions measured on the conventional motorcycle (shown in Figure 1 and Figure 2, respectively). The main results of this environmental analysis are reported in Table 4. Clearly, as exposed in detail above, the autonomy of around 44.8 km has been calculated from the number of test repetitions of the UDC driving cycle which can be assured considering a full battery discharge when never going below 20% of the SoC.

Table 4.
Savings of emissions utilizing a hybrid motorcycle instead of a conventional motorcycle on the distance travelled of 44.8 km.
It is important to highlight that the simulation results shown in Table 4 for the hybrid motorcycle were obtained when the electric propulsion assists the thermal engine during specific driving dynamics characterized by high levels of acceleration (as already assumed in this research), so reducing the relevant high peaks of CO and HC exhaust emissions. In fact, high levels of power requirement during the acceleration phases of the UDC cycle (as shown in the previous section) are accountable for CO and HC over-emissions of the conventional motorcycle.
As can be clearly derived in relation to the results of Table 4, the electricity production needed to recharge the batteries of the hybrid motorcycle becomes a source of exhaust emissions. Clearly, various production systems for electricity produce emissions of a mixture of pollutants which depend on the produced electrical energy. In upcoming research, the authors will investigate this specific aspect, also evaluating the pollutants related to the European and Italian Electricity mix.
5. Conclusions
Owing to the increasing need for energy, increased fuel prices and large emissions from the road transport sector, many countries are energetically supporting research activity towards hybrid electric propulsion and alternative renewable fuels for their potential for reducing exhaust emissions and to supplant fossil fuels. The purpose of this analytical-experimental investigation was to propose hybrid electric propulsion for motorcycle application to reduce engine-out emissions. To achieve this aim, first, an analytical-experimental study based on roller-test bench measurements was executed to measure CO and HC emissive levels in the exhaust emissions of a motorcycle which is equipped with a four-stroke SI engine and a three-way catalyst. To reduce the environmental impact of the tested motorcycle, this study proposed a minimally invasive solution based on an electric motor directly installed on the wheel hub, which can assist the thermal engine during transient phases, i.e., during acceleration phases. The power requirements of this motorcycle were identified and assessed in diverse typical riding conditions by an analytical procedure based on the experimental kinematic factors gathered during real-life applications. Effectively, high levels of power requirement during the acceleration phases were accountable for CO and HC over-emissions from the thermal engine. Finally, an environmental analysis was performed to predict a comparison between the tested thermal motorcycle and a hybrid motorcycle, so that the shares of saved CO and HC emissions were estimated in detail.
To verify whether there is agreement between the predicted and measured CO and HC exhaust emissions of the hybrid motorcycle proposed in this research, experiments will be performed in the near future on the same test bench. These experimental tests will also serve to support and validate the emissive results at part-load operation as predicted in the present paper and, hence, to demonstrate the suitability of hybrid propulsion in SI engines for new generation motorcycles. Thus, future work based on such experiments could affect the actual alternatives for urban transportation mobility. In addition, the purpose of further research will also be to extend experiments in order to assess the engine performance and emissive levels of new generation hybrid motorcycles over a wider range of operating conditions.
Author Contributions
Conceptualization, P.I.; methodology, P.I. and E.F.; formal analysis, P.I. and M.C.; investigation, P.I. and E.F.; data curation, P.I. and M.C.; writing—original draft preparation, P.I. and E.F.; writing—review and editing, P.I. and E.F.; visualization, M.C.; supervision, P.I. and M.C.; project administration, M.C. and P.I.; funding acquisition, M.C. All authors have read and agreed to the published version of the manuscript.
Funding
This research received no external funding.
Institutional Review Board Statement
Not applicable.
Informed Consent Statement
Not applicable.
Conflicts of Interest
The authors declare no conflict of interest.
References
- Awada, O.I.; Mamata, R.; Alib, O.M.; Sidik, N.A.C.; Yusaf, T.; Kadirgama, K.; Kettnere, M. Alcohol and ether as alternative fuels in spark ignition engine: A review. Renew. Sustain. Energy Rev. 2018, 82, 2586–2605. [Google Scholar]
- Li, J.; Li, P.; Gao, G.; Pei, G.; Su, Y.; Ji, J. Thermodynamic and economic investigation of a screw expander-based direct steam generation solar cascade Rankine cycle system using water as thermal storage fluid. Appl. Energy 2017, 195, 137–151. [Google Scholar]
- Iodice, P.; Langella, G.; Amoresano, A. Exergetic analysis of a new direct steam generation solar plant using screw expanders. Energies 2020, 13, 720. [Google Scholar] [CrossRef]
- Hosseini, S.E.; Wahid, M.A. Feasibility study of biogas production and utilization as a source of renewable energy in Malaysia. Renew. Sustain. Energy Rev. 2013, 19, 454–462. [Google Scholar]
- Iodice, P.; Cardone, M. Ethanol/gasoline blends as alternative fuel in last generation spark-ignition engines: A review on CO and HC engine out emissions. Energies 2021, 14, 4034. [Google Scholar] [CrossRef]
- Iodice, P.; Amoresano, A.; Langella, G. A review on the effects of ethanol/gasoline fuel blends on NOX emissions in spark-ignition engines. Biofuel Res. J. 2021, 8, 1465–1480. [Google Scholar] [CrossRef]
- Kumar, B.R.; Saravanan, S. Use of higher alcohol biofuels in diesel engines: A review. Renew. Sustain. Energy Rev. 2016, 60, 84–115. [Google Scholar] [CrossRef]
- Geng, P.; Cao, E.; Tan, Q.; Wei, L. Effects of alternative fuels on the combustion characteristics and emission products from diesel engines: A review. Renew. Sustain. Energy Rev. 2017, 71, 523–534. [Google Scholar]
- Iodice, P.; Senatore, A. New research assessing the effect of engine operating conditions on regulated emissions of a 4-stroke motorcycle by test bench measurements. Environ. Impact Assess. Rev. 2016, 61, 61–67. [Google Scholar]
- Genchi, G.; Pipitone, E. Octane rating of natural gas-gasoline mixtures on CFR engine. SAE Int. J. Fuels Lubr. 2014, 7, 1041–1049. [Google Scholar] [CrossRef]
- Hsieh, W.D.; Chen, R.H.; Wu, T.L.; Lin, T.H. Engine performance and pollutant emission of an SI engine using ethanol–gasoline blended fuels. Atmos. Environ. 2002, 36, 403–410. [Google Scholar] [CrossRef]
- Park, C.; Choi, Y.; Kim, C.; Oh, S.; Lim, G.; Moriyoshi, Y. Performance and exhaust emission characteristics of a spark ignition engine using ethanol and ethanol-reformed gas. Fuel 2010, 89, 2118–2125. [Google Scholar] [CrossRef]
- Chen, R.H.; Chiang, L.B.; Wu, M.H.; Lin, T.H. Gasoline displacement and NOx reduction in an SI engine by aqueous alcohol injection. Fuel 2010, 89, 604–610. [Google Scholar] [CrossRef]
- Li, Y.; Gong, J.; Deng, Y.; Yuan, W.; Fu, J.; Zhang, B. Experimental comparative study on combustion, performance and emissions characteristics of methanol, ethanol and butanol in a spark ignition engine. Appl. Therm. Eng. 2017, 115, 53–63. [Google Scholar] [CrossRef]
- Samhaber, C.; Wimmer, A.; Loibner, E. Modeling of Engine Warm-Up with Integration of Vehicle and Engine Cycle Simulation; SAE International: Warrendale, PA, USA, 2001; SAE Technical Paper 2001-01-1697. [Google Scholar] [CrossRef]
- Abagnale, C.; Cardone, M.; Iodice, P.; Strano, S.; Terzo, M.; Vorraro, G. Power requirements and environmental impact of a pedelec. A case study based on real-life applications. Environ. Impact Assess. Rev. 2015, 53, 1–7. [Google Scholar] [CrossRef]
- Fornaro, E.; Cardone, M.; Dannier, A. A Comparative Assessment of Hybrid Parallel, Series, and Full-Electric Propulsion Systems for Aircraft Application. IEEE Access 2022, 10, 28808–28820. [Google Scholar]
- Cardone, M.; Gargiulo, B.; Fornaro, E. Development of a flexible test bench for a Hybrid Electric Propulsion System. In Proceedings of the 2021 IEEE International Workshop on Metrology for Automotive (MetroAutomotive), Bologna, Italy, 1–2 July 2021; pp. 221–225. [Google Scholar]
- Cardone, M.; Gargiulo, B.; Fornaro, E. Modelling and Experimental Validation of a Hybrid Electric Propulsion System for Light Aircraft and Unmanned Aerial Vehicles. Energies 2021, 14, 3969. [Google Scholar] [CrossRef]
Publisher’s Note: MDPI stays neutral with regard to jurisdictional claims in published maps and institutional affiliations. |
© 2022 by the authors. Licensee MDPI, Basel, Switzerland. This article is an open access article distributed under the terms and conditions of the Creative Commons Attribution (CC BY) license (https://creativecommons.org/licenses/by/4.0/).

