Article

Insights into a Mineral Resource Chlorite Mica Carbonate Schist by Terahertz Spectroscopy Technology

School of Science, China University of Geosciences (Beijing), Beijing 100083, China
*
Authors to whom correspondence should be addressed.
These authors contributed equally to this work.
Energies 2022, 15(17), 6314; https://doi.org/10.3390/en15176314
Submission received: 19 July 2022 / Revised: 27 August 2022 / Accepted: 28 August 2022 / Published: 29 August 2022
(This article belongs to the Section H: Geo-Energy)

Abstract

:
Nowadays, the mineral resources formed by geological processes have been effectively utilized with the boom exploration of novel technologies. Traditional analytical methods, such as X-ray Fluorescence, X-ray diffraction, and Scanning electron microscopy, remain the commonly used approaches for resource detection. However, recent accelerations in terahertz component progress have promoted researchers to discover more potential technologies in mineral resource exploration. In this article, the various porosities and calcination products of Chlorite mica carbonate schist, a mineral resource and potent medicine, are detected using the terahertz time–domain spectroscopy. The terahertz constant measurement of Chlorite mica carbonate schist tablets including the amplitude and phase values was carried out. After Fourier transforms, notable differences of absorption coefficients and refractive index are observed from these experimental samples, which have compelling indications to quantitatively analyze the pore conditions and pyrolytic properties of mineral resources. This active research has vital implications for the rock reservoir properties analysis and mineral energy utilization. It is also identified that terahertz time–domain spectroscopy can be considered as a promising method for the qualitative, reliable, and efficient detection of mineral resources.

1. Introduction

As an irreplaceable material basis for social development, rich mineral resources play key roles in socioeconomic operation, industrial reform, and medical advancement [1,2,3], and thus, the relevant research in their characteristics, detection analysis, and application possess stupendous significance [4]. The Chlorite mica carbonate schist (Lapis Chloriti), as an essential mineral resource and traditional medicine, is a kind of layered mineral composed of metamorphic biotite schist and chlorite mica carbonates [5]. The main elements of Lapis Chloriti are Si, Fe, Mg, Al, K, etc. As a mica mineral, the structure is an octahedral cation layer between two Silicone tetrahedra. The layered structure of Lapis Chloriti allows possessing static potential differences, promoting cation exchange and having favorable adsorption properties [6]. For such properties, it has the effects of eliminating phlegm and calming diseases such as asthma and epilepsy [7]. As a raw material for the decoction of traditional Chinese medicine, its calcined products and the ingredients’ properties, as well as the rate of disintegration, play a crucial role in the efficacy [8,9].
On the other hand, Lapis Chloriti is a carbonate mineral that can be widely applied to the research of energy storage electrolytes of fuel cells and can be dissolved in electrolytes to enhance carbon electro-oxidation [10]. In addition, the rock also contains the mineral chlorite which acts as a good pointer mineral for the oil reservoir [11]. The chlorites can obstruct the pore throats, which is critical to the development of reservoirs. Based on the above background, this study of the mineral Lapis Chloriti has significance for energy utilization. Therefore, a reliable and non-destructive mineral resource detecting method is critical to quantitatively analyze various mineral resource characteristics. At present, the research of mineral resources and their material properties is mainly detected by X-ray Fluorescence (XRF), X-ray diffraction (XRD), and Scanning electron microscope (SEM). G. Y. S. K. Swamy et al. characterized the metal concentrations of Indian Ayurvedic medicines by using WD-XRF spectrometry [12]. Yang, F et al. studied the biochar–mineral interfacial behavior of incubated biochar using XRD and SEM-ED [13]. B. Lubelli et al. investigated the porosity and pore size distribution of kaolin and bentonite based on the freeze-dried samples and cryo-FIB-SEM observations [14]. L. Mei et al. assessed the mean optical path length and the gas absorption in gas-filled porous media with a combination method of frequency–domain photon migration and gas in scattering media absorption spectroscopy [15]. However, these traditional methods may damage the pharmacological properties of the non-renewable mineral resources or involve adverse chemical pollution. In addition, the XRD and XRF technologies hardly support the detection of organic matter due to the strong ionization characteristics of X-rays. The inefficiency makes it necessary to find a feasible and non-destructive method. THz-TDS can provide an appropriate complement for the existing detection technologies. Terahertz waves, lying between the microwave and infrared bands of the electromagnetic spectrum, have many unique properties, such as low energy security, strong selective penetration, and high coherence properties [16]. In recent years, the terahertz “gap” has received widespread attention and extensive research from domestic and international researchers.
Terahertz technology has emerged with the development of lasers and electronics. Outstandingly, terahertz time–domain spectroscopy (THz-TDS), as an emerging detection method, is a non-destructive measuring device, from which the real-time power of terahertz pulses can be obtained with a high signal-to-noise ratio (SNR) compared to infrared spectroscopy, and THz-TDS can directly measure the amplitude of the electric field without contacting samples [17,18,19]. These advantages have made THz-TDS technology gain significant progress in biology, energy, and geology [20,21,22]. In this paper, the THz-TDS is employed to characterize a Chinese medicine of Lapis Chloriti. The extent of the porosity and the variance of the calcined pharmaceutical composition are mainly focused on. Absorption coefficients and refractive indices both have illuminated that Lapis Chloriti can be well identified with the aid of traditional testing methods. Therefore, it provides a convenient and contactless medium for the identification of mineral resource detection.

2. Materials and Methods

The Lapis Chloriti gravels purchased from the mineral medicine market were used as the raw material in this study. The gravels were crushed in an agate mortar and passed through a 200 mesh to obtain powders of particle size of about 75 μm. Then, one part of the powders was placed in a tableting machine to form porous tablets with pressures of 1 to 5 pressure for THz-TDS measurements. The others were calcined with a muffle furnace. The temperatures of calcination treatments were 100 °C, 350 °C, 500 °C, 600 °C, and 700 °C, respectively. The heating rate was 10 °C/min and the thermal insulation time was 2 h, then they were left to naturally cool. After calcination treatments, the Lapis Chloriti powders and polytetrafluoroethylene (PTFE) powders were mixed in a ratio of 2:1. Each tablet was 0.3 g in the experiments, and the thicknesses of the tablets were measured by a micrometer.
The THz-TDS measurements with a transmission configuration were performed using a spectrometer [23,24]. The femtosecond pulse with a central wavelength of 800 nm, a pulse width of 100 fs, and a repetition frequency of 80 MHz was generated by a mode-locked Ti-sapphire laser. The initial light was divided by a beam splitter into the pump beam and probe beam, and the stronger pump light went through the delayed system and conducted the gallium arsenide crystal to produce terahertz waves. After being reflected, collimated, and focused by a parabolic mirror, the terahertz pulses penetrated samples and carried their optical information. Finally, both the terahertz bumps simultaneously reached the ZnTe photodetector crystal with a thickness of 2 mm. Terahertz waves are relatively unaffected by far-infrared band noise and this THz-TDS device can deliver a higher signal-to-noise ratio (dynamic range >60 dB). In the experiment, the time delay between pumping and detecting light was modified by a software-controlled translating stage movement with a moving step of 0.005 mm and a time window range of 20 ps. The range of terahertz spectrum was 0.1–3.5 THz, the actual frequency resolution based on the signal acquisition frequency conversion was 50 GHz, and the minimum resolution of the instrument was 5 GHz.
Here, the waveform signals before and after placing samples were both recorded in the transmissive measurement. The sample-free result was calculated as the reference signal, and the other one was the sample signal. During the data processing, the Fourier transformations were applied to convert the time–domain signals into frequency–domain with the assumption that the sample surfaces are smooth and homogeneous. The refractive index of air is 1. E 0 shows the incident wave function, and frequency–domain signal of the terahertz wave after passing through samples can be denoted as:
E s a m = η 4 n ˜ ( n ˜ + 1 ) 2 · e x p [ j n ˜ ω d c ] · E 0  
The reference wave function without placing the sample is expressed as:
E r e f = η · e x p [ j ω d c ] · E 0  
By combining Equations (1) and (2), the complex refractive index and the ratio of the propagation function H can be obtained as follows:
H = 4 n ˜ ( n ˜ + 1 ) 2 · e x p [ κ n ˜ ω d c ] · e x p [ j ( n ˜ 1 ) ω d c ]  
n ˜ = n j κ  
The real and imaginary parts of the complex refractive index in Formula (4) are known as the refractive index (n) and extinction coefficient ( κ ), respectively. n ˜ is approximated with the refractive index. The amplitude angle and logarithm can be extracted as following transformations:
H = ( n 1 ) ω d c
ln | H | = ln 4 n ( n + 1 ) 2 κ ω d c
Based on Formulas (5) and (6), the refractive index (n) and the extinction coefficient ( κ ) which is the phase and amplitude described in the following are then calculated as:
n = 1 c ω d H  
κ = c ω d { ln [ 4 n ( n + 1 ) 2 ] ln | H | }
The relationship between the extinction coefficient κ and the absorption coefficient α can be obtained as:
κ = α c 2 ω
α = ω κ c  
In the above formulas, η represents the transmission factor, d is the sample thickness, ω is the angular frequency, and c is the propagation speed of light, respectively. Based on the above calculation of the algorithm model, the optical constants of the sample can be obtained finally.

3. Results and Discussion

There are so many novel approaches to measure the porosity of minerals, such as pycnometry [25], nitrogen gas sorption, mercury porosimetry [26], and X-ray micro-computed tomography (micro-CT) [27]. In this work, to explore various porosities of tablets, terahertz spectra are used for identification, as shown in Figure 1. The terahertz time–domain data of different pressures are shown in Figure 1a. The reference represents the signal with no sample in the cell. It can be found that the amplitude of the terahertz pulse decreases with the increasing pressures. Simultaneously, increasing pressures also induce the regularity of a time delay in the phase of terahertz pulses, which can be attributed to the variation in the optical path of the terahertz wave transmission in the tablets, which is induced by the refractive index and thicknesses of the tablets. The time–domain spectrum is subjected to a Fast Fourier transform (FFT) to obtain the frequency–domain spectrum. It is worth mentioning that the impact of data set loss from this process was suppressed with the cooperation of the hardware stability and an algorithm smooth function. Regarding the configuration of the spectral detection system, the terahertz time–domain spectroscopy system (TDS) produced by China Daheng Technology Co., Ltd. (Beijing, China) was applied and its instruments are all fixed in a one-piece unit to be stable and reliable. The Gallium Arsenide (GaAs) photoconductive antenna used at the signal generating end can generate a relatively high signal-to-noise ratio terahertz pulse. In addition, the unique penetrating properties of terahertz waves prevent them from being scattered as much as other bands, and the window material, Teflon, that we mixed into the sample also reduces this from happening. At the same time, in order to prevent the water vapor from interfering with the experiment, the spectrometer was purged with dry air during the measurements and the relative humidity was less than 5%. The whole measurements were performed at a room temperature of 23 degrees Celsius. On the other hand, there are six hundred initial data points used for the field strength FFT, and the adjacent array means the smoothing function was introduced to avoid jerky avalanches [28] during the data calculation process. The experimental results are shown in Figure 1b, where the frequency–domain spectrum of the sample tends to zero around 1.6 THz, so the data analysis range is selected from 0.2 to 1.6 THz. It can be observed that the amplitude of the frequency–domain spectrum also decreases as the pressure increases. The following formula is used to estimate the porosity.
P = 1 V l V T
V l = m / ρ l ,   V T = π ( d 2 ) 2 H
where P is the porosity, V l is the volume of Lapis Chloriti, V T is the volume of tablets, m is the weight of tablets, ρ l is the density of Lapis Chloriti, and d and H are the diameter and the thickness of the tablet, respectively. For each tablet, m is 0.3 g, ρ l is 2.7 g/cm3, and d is 13 mm. The thicknesses and porosities of the tablets are summarized in Table 1. As the pressure increases, the thickness of the tablet decreases, which induces the reduction of porosity.
As shown in Figure 1c, the absorption coefficients increase as the frequency increases. This could be ascribed to the high-frequency response of the rotation or vibration of molecules [29,30]. In the continuous frequency range, absorption coefficients have a negative correlation with porosity. Moreover, compared with absorption coefficients, the refractive index is another important parameter that can also reflect optical information about the tablet. The porosity presents a decreasing tendency as the value of the refractive index increases from about 2.1 to 2.45, as shown in Figure 1d.
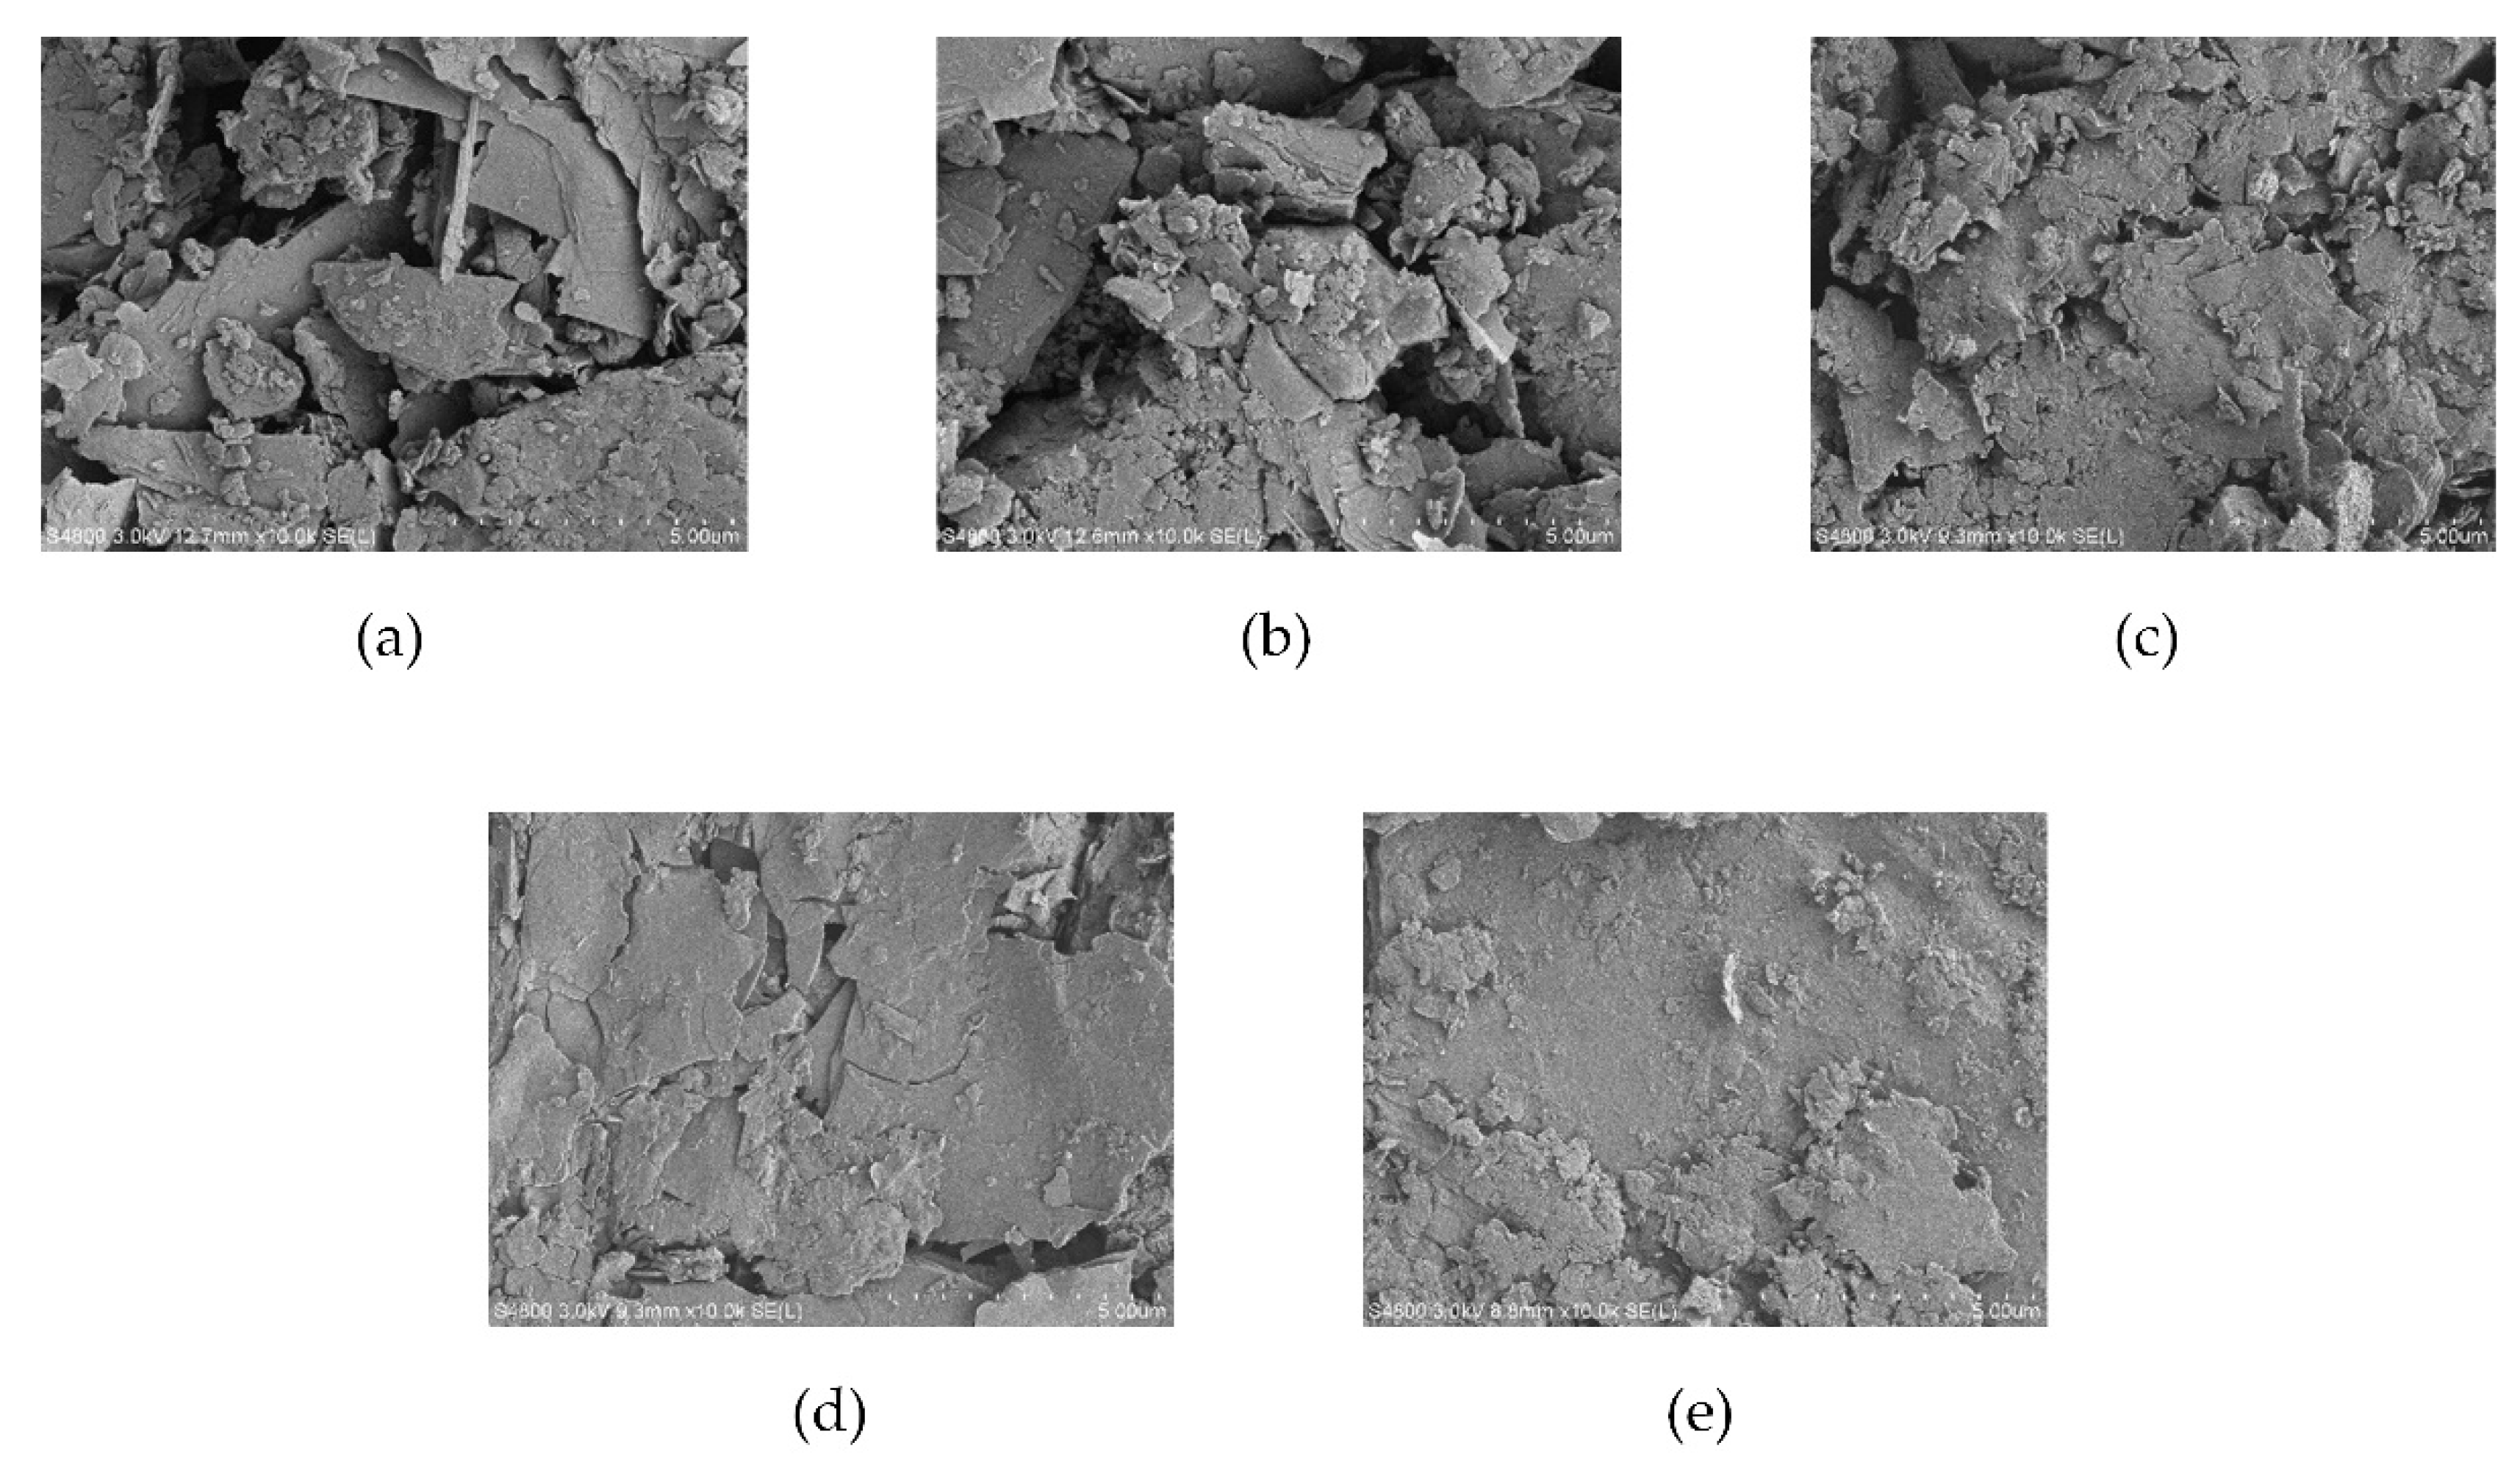
In order to directly observe the porosities of tablets, SEM images of tablets with various porosities are displayed in Figure 2. As the porosity decreases, the tablet surface has become denser. It illuminates that the existence of porosities in the mineral tablet is related to the surface roughness of the tablet. Due to the tablet prepared by a powder status of the Lapis Chloriti, a little debris is observed on the tablet surface. All those factors will affect the release and absorption of the tablet ingredient. It shows a positive correlation between the surface roughness and the porosity [31].
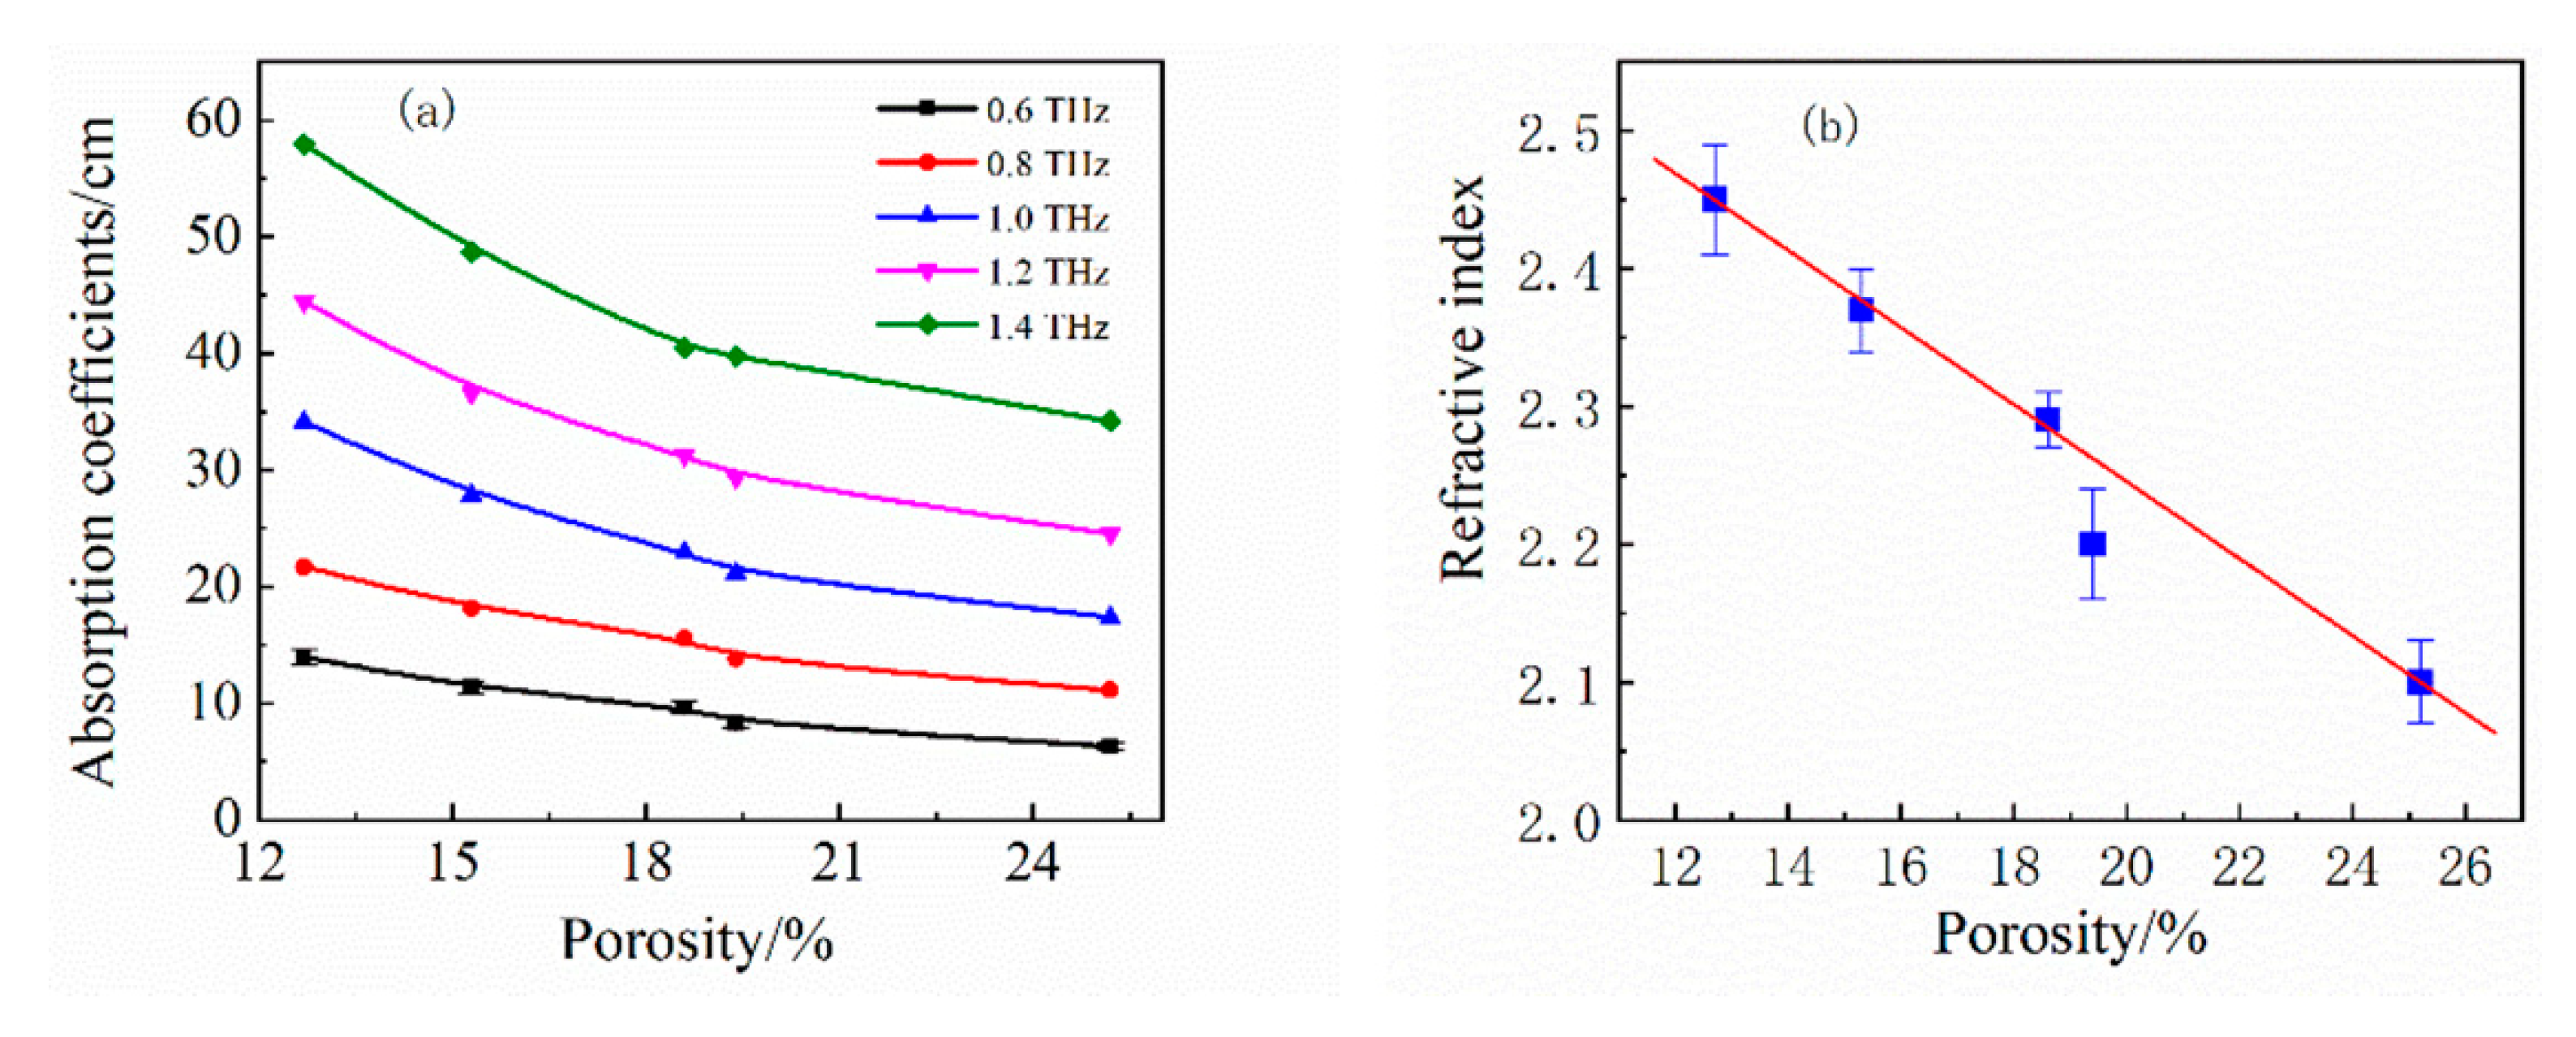
It is acknowledged that the porosities are in a specific relation to the terahertz frequencies from the above discussions. To clearly illustrate the dependency, absorption coefficients at five selected frequencies of 0.6, 0.8, 1.0, 1.2, and 1.4 THz from Figure 1c are picked and fit as a function of porosity, as shown in Figure 3a. It is found that the porosity and absorption coefficients fit well with an Allometric model [30]. Figure 3b shows the relationship between the refractive index and the porosity. There, the refractive index is the average value of the refractive indices in the frequency range of 0.2 to 1.6 THz. The error bar is the average value between the maximum and minimum values of the refractive index. It presents almost a linear tendency as the porosity increases (from 12% to 26%).
Moreover, the research of calcination products has great significance for the determination of energy pyrolysis characteristics and this process can reduce impurities and the toxicity of harmful substances as well as help to exert efficacy of traditional medicine, especially for mineral medicine. Therefore, calcination treatments of Lapis Chloriti are also worth being investigated. Table 2 shows the XRF results of the calcination of the Lapis Chloriti samples from 23 °C to 700 °C. In addition to the main compositions shown in the table, other trace elements are below 1% and some harmful heavy metal elements are below 0.005%. The variance of the main components is insensitive to the calcination temperatures. Meanwhile, the change of carbonate constitutes cannot be accurately obtained by XRF.
To further characterize the Lapis Chloriti after calcination at different temperatures, the XRD patterns are shown in Figure 4. The characteristic peaks between 5 and 30° indicate that biotite and chlorite are the main constituents of Lapis Chloriti [32]. With the increasing calcination temperatures, the positions of characteristic peaks have not altered substantially while the intensity of the characteristic peaks has changed. Those results indicate that the calcination of Lapis Chloriti does not induce the obvious variation of the phase composition, which means that the size and shape of the unit cell are almost identical [33]. There is also some research indicating that the solvent molecules with large atomic displacement parameters or disordered solvent molecules contribute little to the XRD intensities [34]. Consequently, both the XRF and XRD patterns show the difficulties of the analysis and identification of Lapis Chloriti under different calcination temperatures.
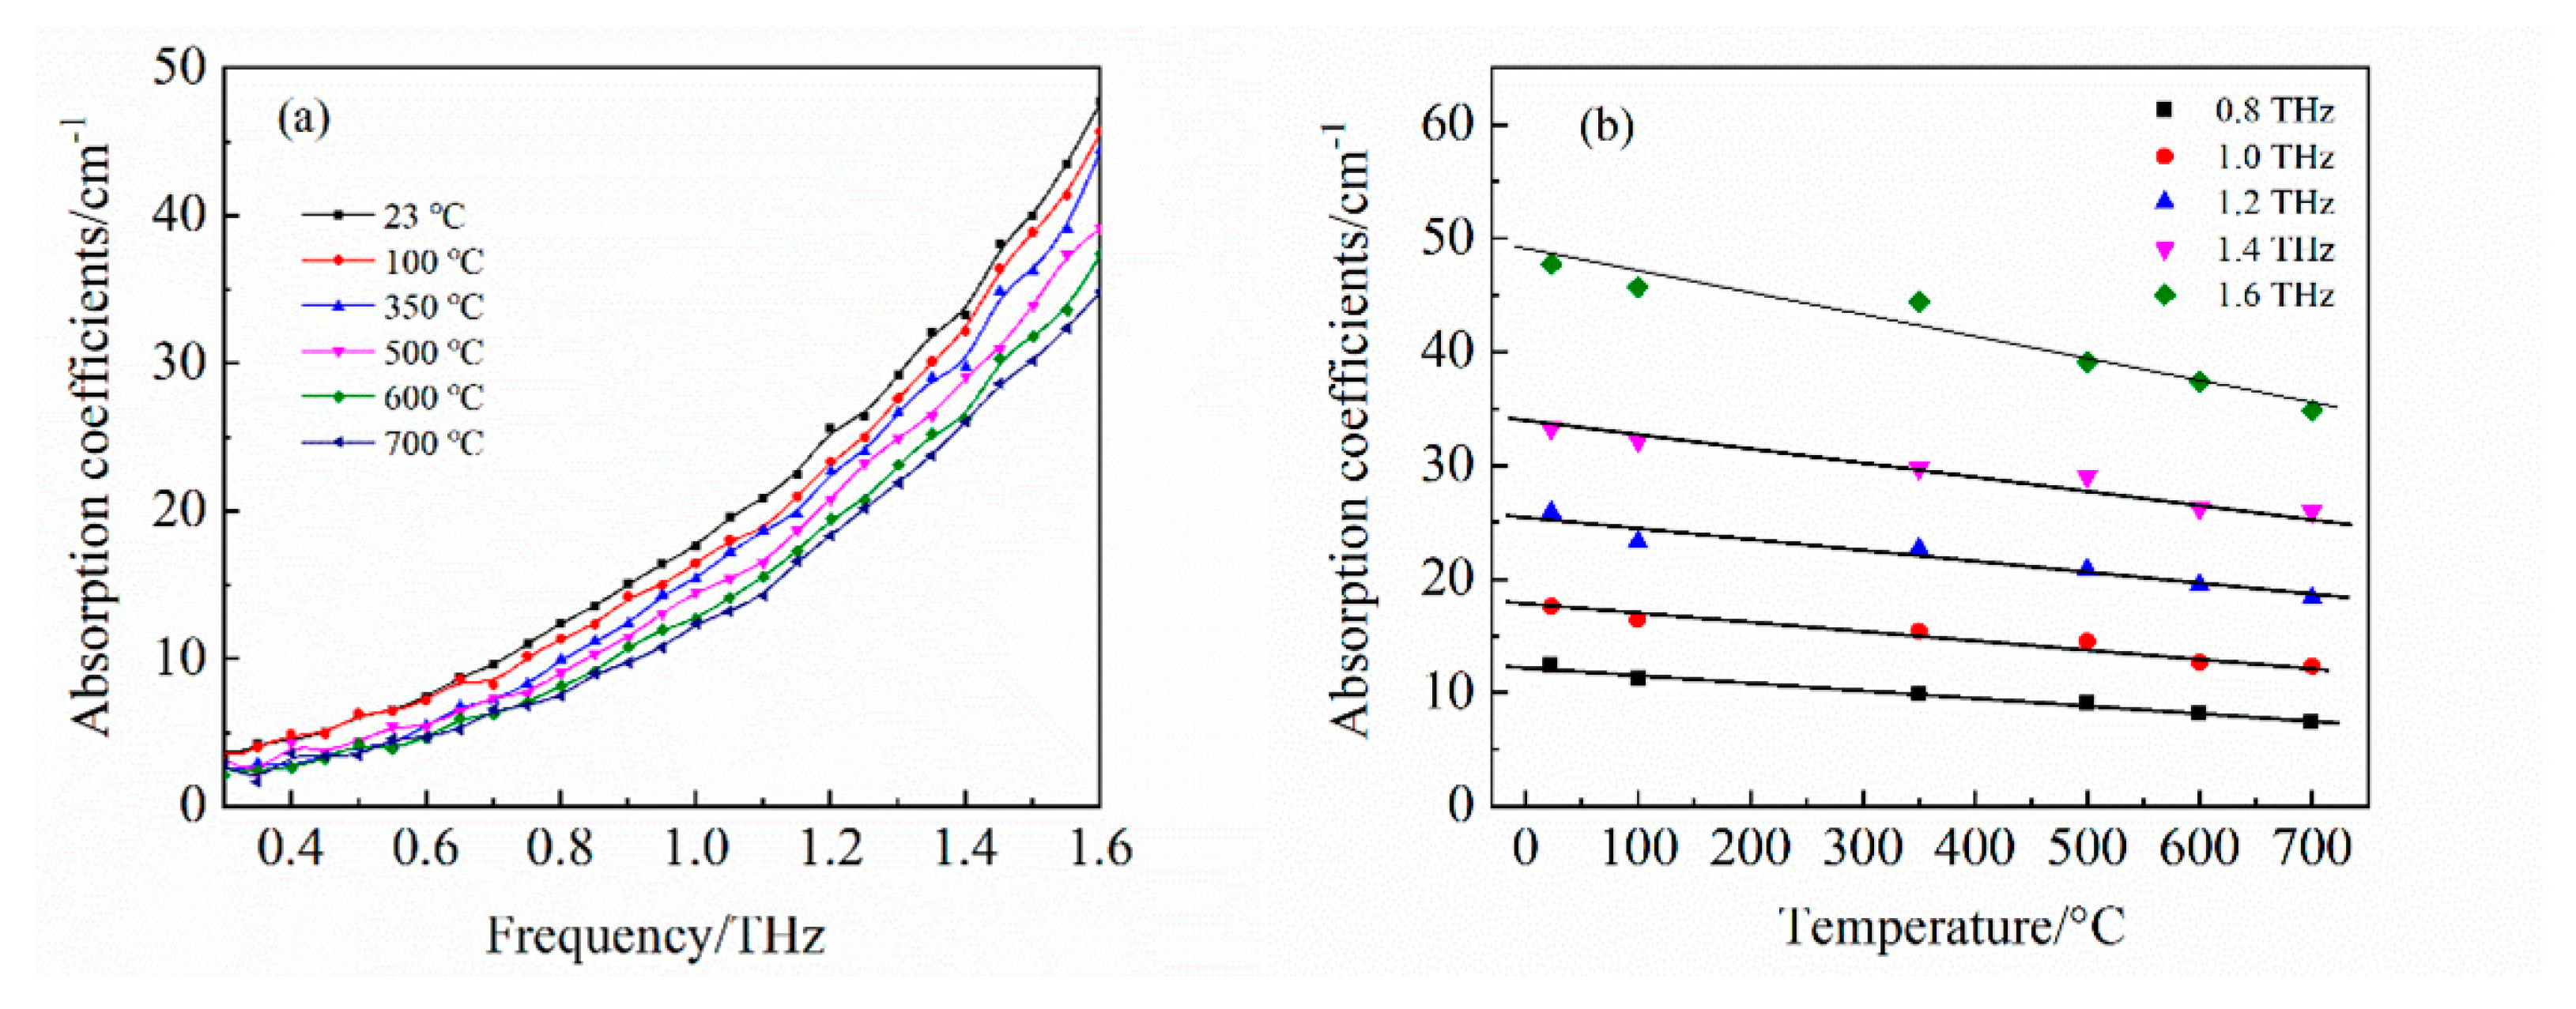
As a versatile evaluation method, THz-TDS can not only determine the porosity of tablets, but also can characterize different calcination products of Lapis Chloriti. Figure 5a displays the frequency-dependent absorption coefficients of different calcination temperatures. It presents a certain tendency that the absorption coefficients decrease upon the increase in the calcination temperatures. This is due to the layered structure of the mineral Lapis Chloriti, which is filled with various metal ions coordinated to the hydroxyl group. High temperatures can destroy the hydroxyl group and lead to subtle variances of dielectric properties. In this case, compared to XRD patterns, where the detection peaks which appear in the figure are almost identical, the terahertz wave has a sensitive response to this alternation which attributes to the high absorption coefficients of the hydrogen bonds at terahertz frequencies [35]. Furthermore, absorption coefficients present an excellent linear correlation with specific frequencies, as shown in Figure 5b. Those results indicate that THz-TDS can distinguish Lapis Chloriti under different calcination temperatures.

4. Conclusions

In summary, THz-TDS is demonstrated to be a sensitive method for detecting the optical properties of the mineral Lapis Chloriti. As essential material properties of mineral resources, the porosity and pyrolysis properties are characterized in this paper by terahertz time–domain spectroscopy techniques with comparisons of various traditional analytical methods. According to the absorption coefficients and refractive indices, the identifications of porosities and calcination products of Lapis Chloriti are realized at 0.2–1.6 THz. This work not only highlights the validity of THz-TDS in monitoring the mineral resource Lapis Chloriti, but also opens a non-invasive horizon for the in-line detection of traditional medicine. What is more, the research on the pyrolysis characteristics of Lapis Chloriti in this paper can provide theoretical and experimental references for the energy utilization of mineral materials. Mineral resource detection is meaningful research with enormous geological significance and economic benefits, which contributes to such novel analytical technology and is critical to energy development.

Author Contributions

H.H. and Z.Z. (Zhiyuan Zheng) initiated the experiments. Y.M., S.H. and Z.Z. (Zili Zhang) prepared the samples. Y.M. and S.H. performed the experiments. M.Y. and S.Z. developed the idea, analyzed the results, and wrote the manuscript. H.H. and Z.Z. (Zhiyuan Zheng) provided funding acquisition and project administration. All authors have read and agreed to the published version of the manuscript.

Funding

This work was supported by the National Natural Science Foundation of China (61805214), the Fundamental Research Funds for the Central Universities (2652022203, 2652019107, 2652020032). China University of Geosciences (Beijing) 2020 Educational Reform Project (XNFZ202014, HHSKE202017), Young Talents Promotion Project of Beijing Association for Science and Technology (2020–2022).

Data Availability Statement

Not applicable.

Conflicts of Interest

The authors declare no conflict of interest.

References

  1. Dubiński, J. Sustainable Development of Mining Mineral Resources. J. Sustain. Min. 2013, 12, 1–6. [Google Scholar] [CrossRef]
  2. Aryee, B.N.A. Ghana’s mining sector: Its contribution to the national economy. Resour. Policy 2001, 27, 61–75. [Google Scholar] [CrossRef]
  3. Zhou, B.; Li, Z.; Chen, C. Global Potential of Rare Earth Resources and Rare Earth Demand from Clean Technologies. Minerals 2017, 7, 203. [Google Scholar] [CrossRef]
  4. Dumakor-Dupey, N.K.; Arya, S. Machine Learning—A Review of Applications in Mineral Resource Estimation. Energies 2021, 14, 4079. [Google Scholar] [CrossRef]
  5. Lee, S.; Xu, H.F. Powder XRD and TEM study on crystal structure and interstratification of Zn-chlorite (baileychlore). Powder Diffr. 2017, 32, 118–123. [Google Scholar] [CrossRef]
  6. Makbul, S.A.A.; Jahan, N.; Ahmad, G. Hajrul yahood (Lapis judaicus): An important mineral drug of Unani system of medicine for the management of urolithiasis. J. Ethnopharmacol. 2018, 222, 165–170. [Google Scholar] [CrossRef]
  7. Ridgway, C.; Bawuah, P.; Markl, D.; Zeitler, J.A.; Ketolainen, J.; Peiponen, K.-E.; Gane, P. On the role of API in determining porosity, pore structure and bulk modulus of the skeletal material in pharmaceutical tablets formed with MCC as sole excipient. Int. J. Pharm. 2017, 526, 321–331. [Google Scholar] [CrossRef]
  8. Johansson, B.; Alderborn, G. The effect of shape and porosity on the compression behaviour and tablet forming ability of granular materials formed from microcrystalline cellulose. Eur. J. Pharm. Biopharm. 2001, 52, 347–357. [Google Scholar] [CrossRef]
  9. Wang, Y.; Feng, F.; Wang, Z. Determination of Selected Elements in Aqueous Extractions of a Traditional Chinese Medicine Formula by ICP-MS and FAAS: Evaluation of Formula Rationality. Anal. Lett. 2010, 43, 983–992. [Google Scholar] [CrossRef]
  10. Jang, W.-J.; Kim, H.-M.; Shim, J.-O.; Yoo, S.-Y.; Jeon, K.-W.; Na, H.-S.; Lee, Y.-L.; Lee, D.-W.; Roh, H.-S.; Yoon, W.L. Deactivation of SiO2 supported Ni catalysts by structural change in the direct internal reforming reaction of molten carbonate fuel cell. Catal. Commun. 2017, 101, 44–47. [Google Scholar] [CrossRef]
  11. Wang, G.; Chang, X.; Yin, W.; Li, Y.; Song, T. Impact of diagenesis on reservoir quality and heterogeneity of the Upper Triassic Chang 8 tight oil sandstones in the Zhenjing area, Ordos Basin, China. Mar. Pet. Geol. 2017, 83, 84–96. [Google Scholar] [CrossRef]
  12. Swamy, G.Y.S.K.; Ravikumar, K. Characterization of Indian Ayurvedic herbal medicines for their metal concentrations using WD-XRF spectrometry. X-ray Spectrom. 2010, 39, 216–220. [Google Scholar] [CrossRef]
  13. Yang, F.; Zhao, L.; Gao, B.; Xu, X.; Cao, X. The Interfacial Behavior between Biochar and Soil Minerals and Its Effect on Biochar Stability. Environ. Sci. Technol. 2016, 50, 2264–2271. [Google Scholar] [CrossRef]
  14. Lubelli, B.; de Winter, D.A.M.; Post, J.A.; van Hees, P.J.; Drury, M.R. Cryo-FIB–SEM and MIP study of porosity and pore size distribution of bentonite and kaolin at different moisture contents. Appl. Clay Sci. 2013, 81, 358–365. [Google Scholar] [CrossRef]
  15. Mei, L.; Svanberg, S.; Somesfalean, G. Combined optical porosimetry and gas absorption spectroscopy in gas-filled porous media using diode-laser-based frequency domain photon migration. Opt. Express 2012, 20, 16942–16954. [Google Scholar] [CrossRef]
  16. Cheng, H.; Huang, H.-C.; Yang, M.-F.; Yang, M.-H.; Yan, H.; Panezai, S.; Zheng, Z.-Y.; Zhang, Z.; Zhang, Z.-L. Characterization of the remediation of chromium ion contamination with bentonite by terahertz time-domain spectroscopy. Sci. Rep. 2022, 12, 11149. [Google Scholar] [CrossRef] [PubMed]
  17. Miao, X.Y.; Zhan, H.L.; Zhao, K. Application of THz technology in oil and gas optics. Sci. China Phys. Mech. Astron. 2017, 60, 88–90. [Google Scholar] [CrossRef]
  18. Huang, H.C.; Qiu, P.Y.; Panezai, S.; Hao, S.B.; Zhang, D.L.; Yang, Y.Q.; Ma, Y.Y.; Gao, H.; Gao, L.; Zhang, Z.L.; et al. Continuous-wave terahertz high-resolution imaging via synthetic hologram extrapolation method using pyroelectric detector. Opt. Laser Technol. 2019, 120, 105683. [Google Scholar] [CrossRef]
  19. Ferguson, B.; Zhang, X.-C. Materials for terahertz science and technology. Nat. Mater. 2002, 1, 26–33. [Google Scholar] [CrossRef]
  20. Yang, Y.P.; Lei, X.Y.; Yue, A.; Zhang, Z.W. Temperature-dependent THz vibrational spectra of clenbuterol hydrochloride. Sci. China Ser. G Phys. Mech. Astron. 2013, 56, 713–717. [Google Scholar] [CrossRef]
  21. Jiang, C.; Zhao, K.; Fu, C.; Xiao, L.Z. Characterization of Morphology and Structure of Wax Crystals in Waxy Crude Oils by Terahertz Time-Domain Spectroscopy. Energy Fuels 2017, 31, 1416–1421. [Google Scholar] [CrossRef]
  22. Miao, X.Y.; Zhan, H.L.; Zhao, K.; Zhang, Z.W.; Xu, L.; Zhang, C.L.; Xiao, L.Z. Terahertz-dependent PM2.5 monitoring and grading in the atmosphere. Sci. China Ser. G Phys. Mech. Astron. 2018, 61, 104211. [Google Scholar] [CrossRef]
  23. Hao, S.B.; Huang, H.C.; Ma, Y.Y.; Liu, S.J.; Zhang, Z.L.; Zheng, Z.Y. Characterizations of the Calamine tablets by terahertz time-domain spectroscopy. Optik 2019, 187, 278–284. [Google Scholar] [CrossRef]
  24. Ma, Y.Y.; Huang, H.C.; Hao, S.B.; Qiu, K.-F.; Gao, H.; Gao, L.; Tang, W.C.; Zhang, Z.L.; Zheng, Z.Y. Insights into the water status in hydrous minerals using terahertz time-domain spectroscopy. Sci. Rep. 2019, 9, 9265. [Google Scholar] [CrossRef] [PubMed]
  25. Brewer, C.E.; Chuang, V.J.; Masiello, C.A.; Gonnermann, H.; Gao, X.; Dugan, B.; Driver, L.E.; Panzacchi, P.; Zygourakis, K.; Davies, C.A. New approaches to measuring biochar density and porosity. Biomass-Bioenergy 2014, 66, 176–185. [Google Scholar] [CrossRef]
  26. Cychosz, K.A.; Guillet-Nicolas, R.; García-Martínez, J.; Thommes, M. Recent advances in the textural characterization of hierarchically structured nanoporous materials. Chem. Soc. Rev. 2017, 46, 389–414. [Google Scholar] [CrossRef]
  27. Ramandi, H.L.; Mostaghimi, P.; Armstrong, R.T.; Saadatfar, M.; Pinczewski, W.V. Porosity and permeability characterization of coal: A micro-computed tomography study. Int. J. Coal Geol. 2016, 154–155, 57–68. [Google Scholar] [CrossRef]
  28. Salje, E.K.H.; Jiang, X. Crackling noise and avalanches in minerals. Phys. Chem. Miner. 2021, 48, 1–15. [Google Scholar] [CrossRef]
  29. Chakraborty, M.; Bawuah, P.; Tan, N.; Ervasti, T.; Pääkkönen, P.; Zeitler, J.A.; Ketolainen, J.; Peiponen, K.-E. On the Correlation of Effective Terahertz Refractive Index and Average Surface Roughness of Pharmaceutical Tablets. J. Infrared Millim. Terahertz Waves 2016, 37, 776–785. [Google Scholar] [CrossRef]
  30. Eleveld, D.J.; Proost, J.H.; Vereecke, H.; Absalom, A.R.; Olofsen, E.; Vuyk, J.; Struys, M.M.R.F. An Allometric Model of Remifentanil Pharmacokinetics and Pharmacodynamics. Anesthesiology 2017, 126, 1005–1018. [Google Scholar] [CrossRef]
  31. Wang, W.Y.; Sun, J.J.; Dong, C.L. Biotite weathering by Aspergillus niger and its potential utilization. J. Soil. Sediment 2016, 16, 1901–1910. [Google Scholar] [CrossRef]
  32. Boles, A.; Mulch, A.; Pluijm, B.D. Near-surface clay authigenesis in exhumed fault rock of the Alpine Fault Zone (New Zealand); O-H-Ar isotopic, XRD and chemical analysis of illite and chlorite. J. Struct. Geol 2018, 111, 27–41. [Google Scholar] [CrossRef]
  33. Matěj, Z.; Matějová, L.; Kužel, R. XRD analysis of nanocrystalline anatase powders prepared by various chemical routes: Correlations between micro-structure and crystal structure parameters. Powder Diffr. 2013, 28, S161–S183. [Google Scholar] [CrossRef]
  34. Ito, M.; Nambu, K.; Sakon, A.; Uekusa, H.; Yonemochi, E.; Noguchi, S.; Terada, K. Mechanisms for Improved Hygroscopicity of L-Arginine Valproate Revealed by X-ray Single Crystal Structure Analysis. J. Pharm. Sci. 2017, 106, 859–865. [Google Scholar] [CrossRef]
  35. Ito, M.; Tokuda, R.; Suzuki, H.; Sakamoto, T.; Terada, K.; Noguchi, S. Desolvation behavior of indinavir sulfate ethanol and follow-up by terahertz spectroscopy. Int. J. Pharm. 2019, 567, 118446. [Google Scholar] [CrossRef]
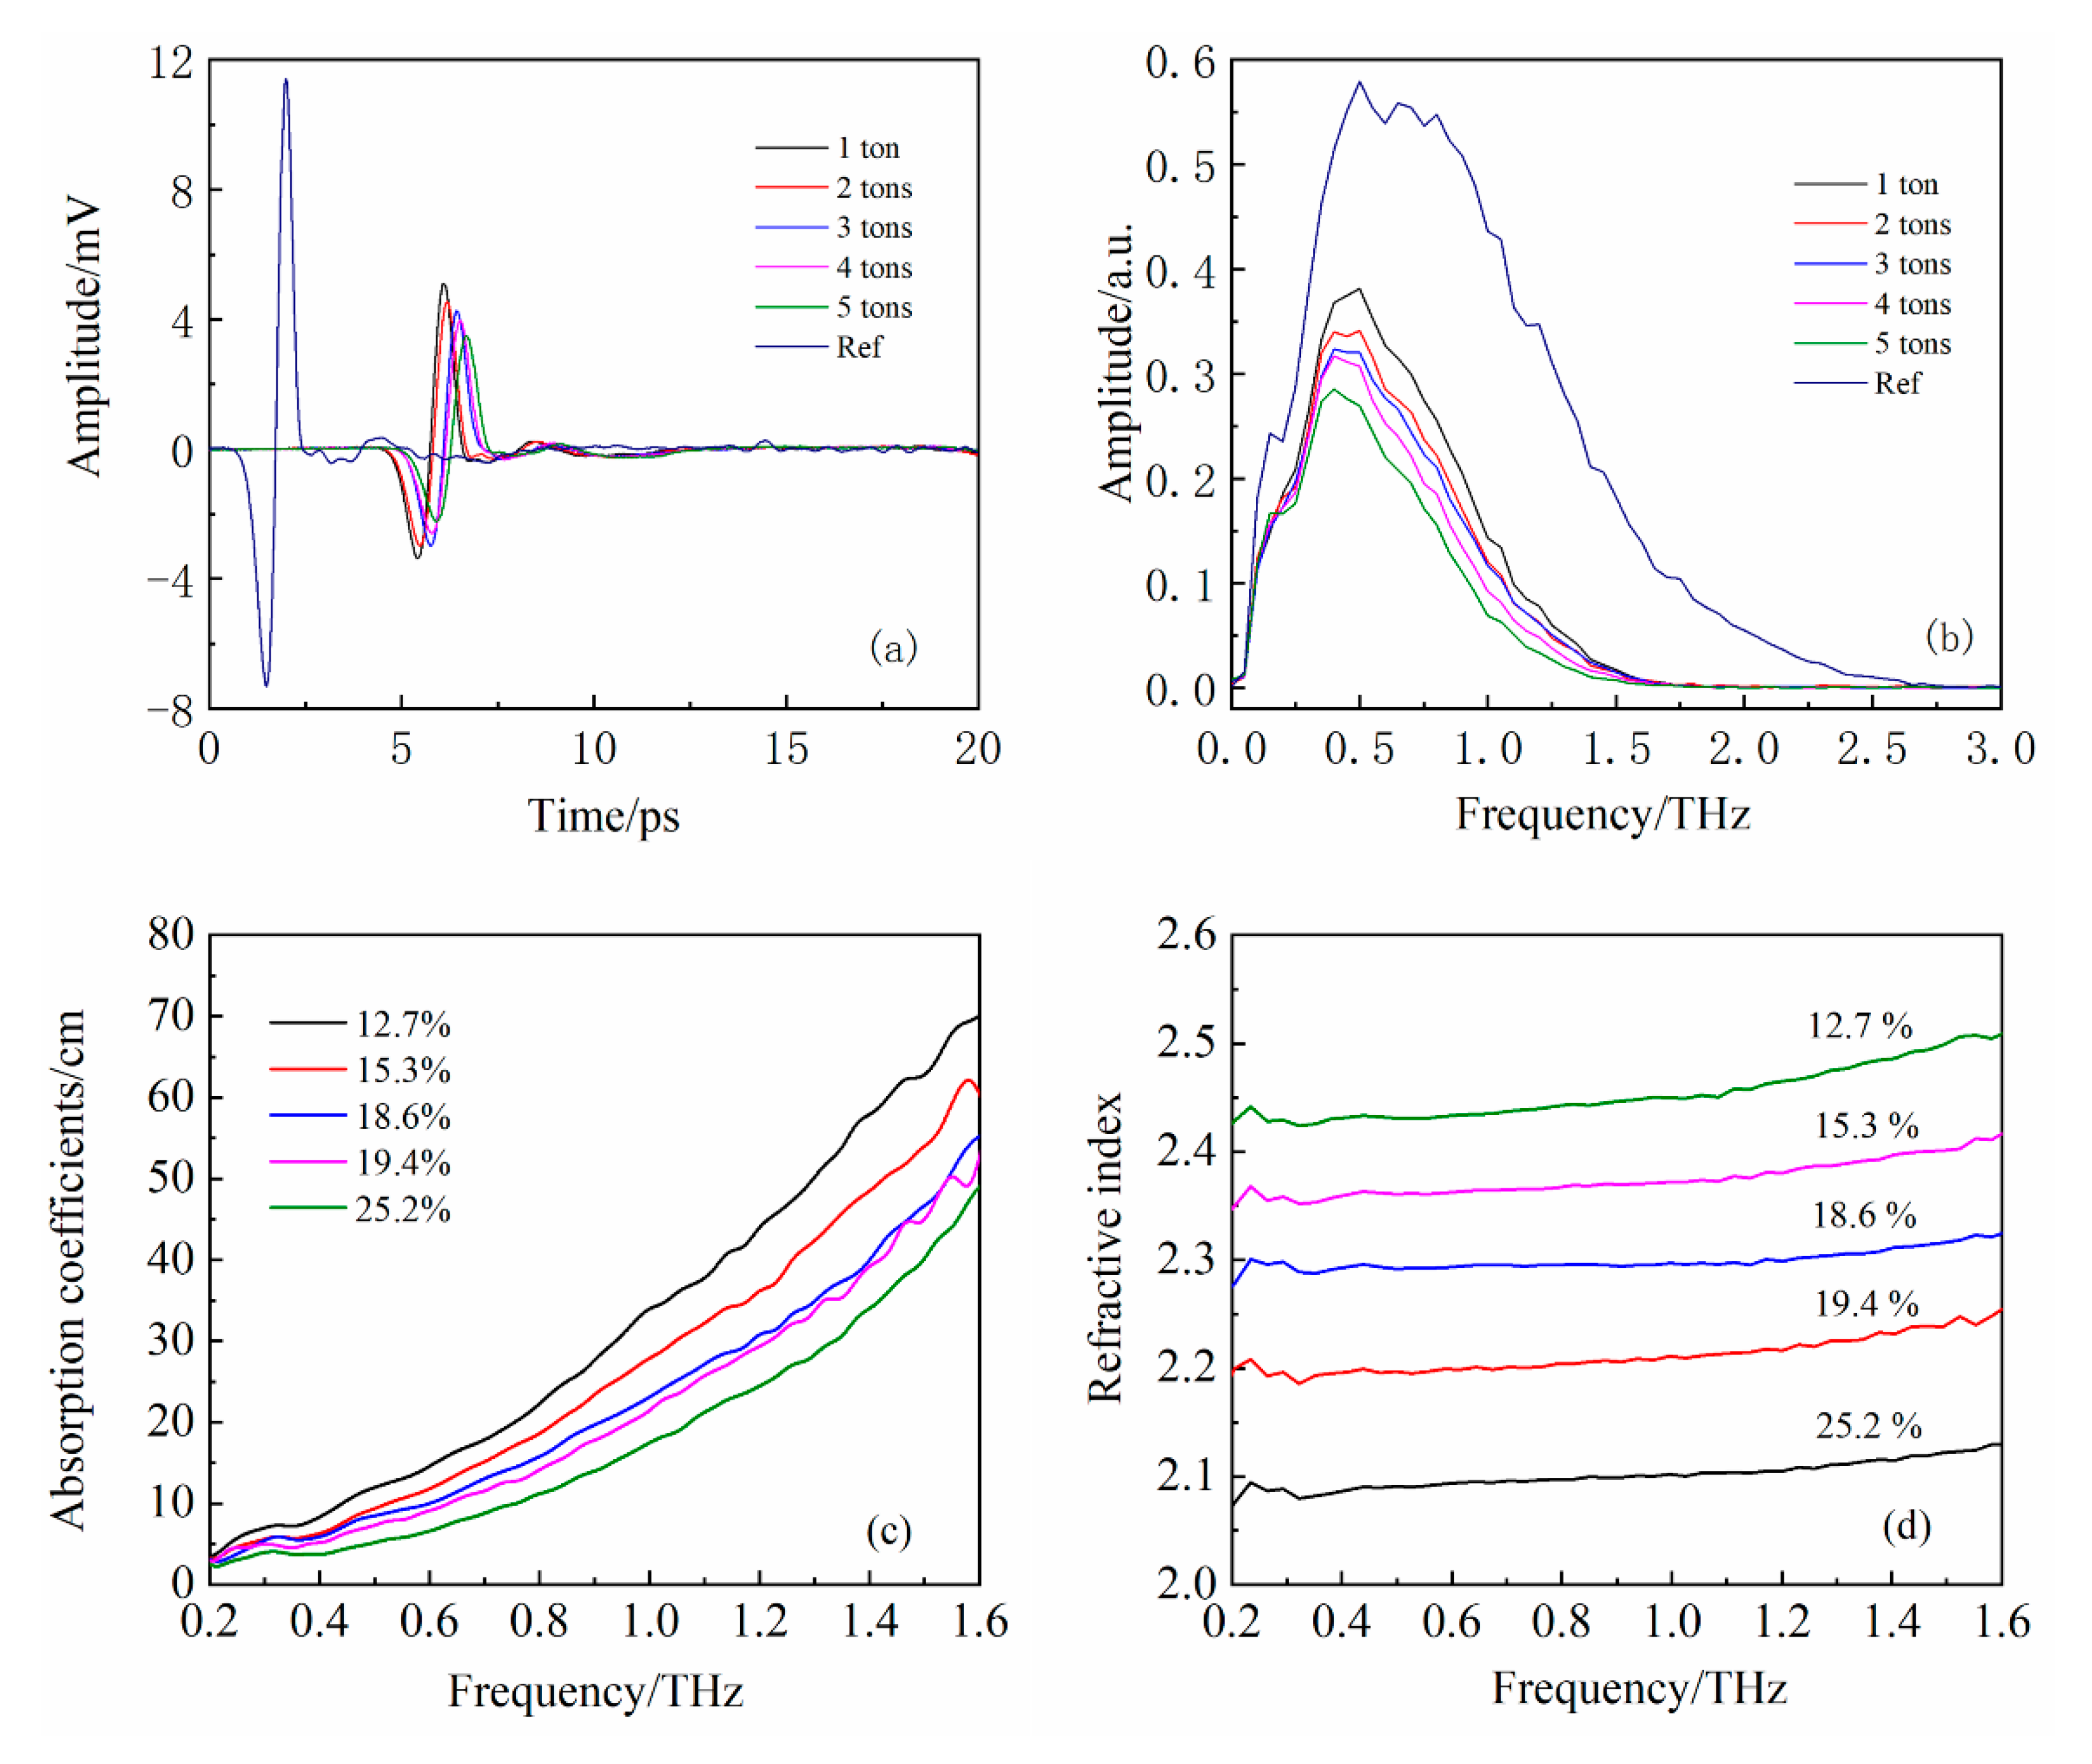
Figure 1. Terahertz time–domain spectra (a) and terahertz frequency–domain spectra (b) of tablets under various pressures. Frequency-dependent absorption coefficients (c) and refractive index (d) of tablets with various porosities.
Energies 15 06314 g001
Figure 2. SEM images of tablets with various porosities. From (ae), the porosities are 25.2%, 19.4%, 18.6%, 15.3%, and 12.7%, respectively.
Energies 15 06314 g002
Figure 3. Absorption coefficients fit as a function of the porosity at selected frequencies (a) and the refractive index fits as a function of the porosity (b).
Energies 15 06314 g003
Figure 4. The XRD patterns of the Lapis Chloriti sample after calcination at different temperatures.
Energies 15 06314 g004
Figure 5. Frequency-dependent absorption coefficients of various calcination temperatures (a) and the absorption coefficients fit as a function of temperatures at different frequencies (b).
Energies 15 06314 g005
Table 1. Values of the thickness and the porosity of the tablets.
Pressure (ton)H (mm)P (%)
11.10925.2
21.02919.4
31.01918.6
40.97915.3
50.95012.7
Table 2. XRF results about main compositions of Lapis Chloriti samples at different temperatures.
Main Compositions (%)23 °C100 °C350 °C500 °C600 °C700 °C
MgO10.38610.13510.46410.51810.39210.491
Al2O312.06911.94312.08612.14812.18812.236
SiO241.66041.97641.85841.78142.01241.903
K2O6.6926.6576.6316.6866.6636.664
CaO5.3815.3395.3215.2125.1565.230
Fe2O319.85119.74419.67819.65219.69619.580
TiO22.0462.0532.0382.0472.0422.027
Publisher’s Note: MDPI stays neutral with regard to jurisdictional claims in published maps and institutional affiliations.