Article

NMR-Based Shale Core Imbibition Performance Study

1
Research Institute of Petroleum Exploration and Development, Beijing 100083, China
2
PetroChina Southwest Oil and Gasfield Company, Chengdu 610000, China
3
Shandong Institute of Petroleum and Chemical Technology, Dongying 257061, China
*
Author to whom correspondence should be addressed.
Energies 2022, 15(17), 6319; https://doi.org/10.3390/en15176319
Submission received: 25 June 2022 / Revised: 17 August 2022 / Accepted: 18 August 2022 / Published: 30 August 2022
(This article belongs to the Special Issue Advances in the Development of Unconventional Oil and Gas Resources)

Abstract

:
Shale gas reservoirs are unconventional resources with great potential to help meet energy demands. Horizontal drilling and hydraulic fracturing have been extensively used for the exploitation of these unconventional resources. According to engineering practice, some shale gas wells with low flowback rate of fracturing fluids may obtain high yield which is different from the case of conventional sandstone reservoirs, and fracturing fluid absorbed into formation by spontaneous imbibition is an important mechanism of gas production. This paper integrates NMR into imbibition experiment to examine the effects of fractures, fluid salinity, and surfactant concentration on imbibition recovery and performance of shale core samples with different pore-throat sizes acquired from the Longmaxi Formation in Luzhou area, the Sichuan Basin. The research shows that the right peak of T2 spectrum increases rapidly during the process of shale imbibition, the left peak increases rapidly at the initial stage and changes gently at the later stage, with the peak of the left peak shifting to the right. The result indicates that water first enters the fracture system quickly, then enters the small pores near the fracture wall due to the effect of the capillary force, and later gradually sucks into the deep and large pores. Both imbibition rate and capacity increase with increased fracture density, decreased solution salinity, and decreased surfactant concentration. After imbibition flowback, shale permeability generally increases by 8.70–17.88 times with the average of 13.83 times. There are also many microcracks occurring on the end face and surface of the core sample after water absorption, which may function as new flowing channels to further improve reservoir properties. This research demonstrates the imbibition characteristics of shale and several relevant affecting factors, providing crucial theory foundations for the development of shale gas reservoirs.

1. Introduction

Shale gas is an important type of unconventional energy with large size resources. Shale reservoirs feature extremely low porosity and permeability, and economic production mostly has to be realized through horizontal-well fracturing [1]. Different from the case of conventional sandstone reservoirs, the post-frac flowback rate of fracturing fluids in shale reservoirs is generally below 50% and even 10% at some shale gas wells, resulting in a great quantity of fracturing fluids remaining in subsurface formations [2,3], which may increase water saturation and lead to the Jamin effect owing to water blocking. The consequent increased filtration resistance makes it more difficult to recover shale gas. According to engineering practice, some shale gas wells with low flowback rate of fracturing fluids may obtain high yield [4,5]. Thus, it is necessary to probe into the physical phenomenon of shale imbibition, water intake capacity of shales, and major controls to guide flowback designing and shale gas production.
Imbibition is a process of displacement of non-wetting phase fluids by wetting-phase fluids spontaneously flowing into rocks due to the effect of capillary force, which could be tested using direct weight, indirect method, and volume measurement. Gao [6] used the weight method to test the water intake capacity of shales for different fluids and discussed flowback-control mechanism from the perspectives of shale components and shale-water mechanics. Wu [7] obtained the flow regime curves of shale cores with different water saturations using the vapor adsorption method and examined the influence of water saturation on shale gas flow. Guo [8] performed water-phase imbibition experiments that involved reservoir temperature, confining pressure, and fluid pressure to analyze water-phase imbibition by shales and influential factors. Xu [9] used shale samples acquired from the Benxi Formation in the Ordos Basin to perform spontaneous imbibition nuclear-magnetic scanning to investigate the impacts of clay minerals, salinity, and surfactant on water saturation change in the process of imbibition and establish a dynamic imbibition model with chemical osmotic pressure. Xiong [10] paid attention to the influence of shale bedding plane and cation type on shale imbibition through imbibition experiments using shale samples from the Longmaxi Formation in the Sichuan Basin. Zhu [11] investigated the influence of pressure, temperature, cracking property of fracturing fluids, and liquid composition on shale imbibition through imbibition experiments of shale samples from the Longmaxi Formation in Pengshui area. Nuclear magnetic resonance (NMR) technique was employed to analyze shale imbibition at different pores. Yang [12] performed dynamic and static imbibition experiments to understand the relations between different factors and water-absorbing capacity as well as water absorption characteristics and their influence on flowback rate at shale gas wells. Ye [13] used shale powder device to perform spontaneous imbibition experiments for the shale oil-gas system and gas-water system to investigate water adsorption and oil washing features of shale powders and hence evaluate shale wettability. Xiao [14] conducted pressurized and unpressurized imbibition NMR experiments using gas-bearing shale samples from Sichuan to analyze the variation of imbibition capacity with time. They also used T2 spectra to analyze the volume of imbibition fluids moving into different pore spaces and used scanning electron microscopy to reveal how the fracture system formed after imbibition. Duan [15] used a high-temperature high-pressure on-line NMR detection system to test free methane and adsorbed methane yields during shale gas recovery and analyzed shale gas recovery and yield in different forms of occurrence. Deng [16] performed imbibition and drainage experiments among water, oil, and gas phases in a visible circular capillary tube to characterize the imbibition behavior, discovered and analyzed the effect of additional force on imbibition. Zhu [17] performed nuclear magnetic resonance (NMR) and high-pressure mercury intrusion (HPMI) experiments to determine pore-scale water distribution, movable water saturation, and pore throat distribution in the core plugs, and derived a semiempirical model to describe the correlation between TPG, movable water saturation, and permeability. Lin [18] presented a chemical potential-dominated flow mechanism model, and nuclear magnetic resonance was adopted to obtain the water saturation distribution curve in the shale rock sample during spontaneous imbibition.
Shale gas reservoir fracturing stimulation and fracturing fluid flowback make up a continuous process. Previous studies mostly focused on the process of shale imbibition, but rarely dealt with imbibition–flowback as a whole. Moreover, flowback system and law have impacts on the effect of subsequent development. In this paper, we integrate NMR into imbibition and flowback experiments to evaluate the imbibition recovery of shale core samples with different pore-throat sizes acquired from the Longmaxi Formation in Luzhou area, the Sichuan Basin, and determine the dynamic distribution of fluids during imbibition. On this basis, we analyze how different parameters affect shale imbibition law and clarify the characteristics and mechanism of imbibition flowback, providing theoretical reference and technical support to effective development of shale gas reservoirs.

2. Materials and Methods

2.1. Principle of NMR Imbibition Experiment

NMR is the inter action between the hydrogen nucleus in oil and water and the magnetic field. Total NMR relaxation includes surface relaxation, bulk relaxation of fluid precession, and diffusion relaxation caused by gradient field. Therefore, total NMR relaxation in porous media can be described by the following mathematical formula [19]:
1 T 2 = ρ 2 S V + 1 T 2 b + D ( G γ TE ) 2 12
Here T2 is the total NMR relaxation time of fluids, ms; ρ2 is the surface relaxivity, μs/m; S/V is the specific surface area of pores, μm−1; T2b is the bulk relaxation time of fluids, ms; D is the free diffusion coefficient for the fluid, μs/cm2; G is the magnetic field gradient, which includes the external and interior magnetic field gradient, Gauss/cm; γ is the gyromagnetic ratio; TE is the echo spacing of the measurement sequence, ms.
From Equation (1), total T2 relaxation time is related to specific surface area, fluids in rocks, as well as diffusion coefficient and echo spacing. Usually, the measurement of NMR experiment is under uniform magnetic field, and the diffusion relaxation term could be ignored, so the specific surface area can reflect the pore size distribution in the rock samples. Large pores with small specific surface area correspond to large T2 relaxation time; in contrast, small pores correspond to small relaxation time. This means that T2 relaxation time spectrum could be used to denote fluid distribution in different pores.
After the shale core sample is soaked into the simulated formation water, fluids will be spontaneously imbibed into rock pores. Based on T2 spectrum at different times, it could analyze fluid distribution and imbibition in different pores. Shales contain a lot of substance with 1H nuclei, e.g., kerogen in organic matter and clay minerals in inorganic matter, which may also generate NMR signals. Thus, initial signals of the dry sample will be treated as the reference signals to analyze signal variation in the process of imbibition.

2.2. Equipment and Samples

NMR experiments were performed using the NMR analyzer MicroMR12-025V manufactured by Suzhou Niumag Analytical Instrument Corporation, as shown in Figure 1. The resonance frequency was 12 MHz, magnetic field intensity was 0.28 T, and the magnet temperature was controlled at 35 ± 0.02 °C. In order to avoid signals loss from smaller pores, the echo spacing TE was set at 0.1 ms, and waiting time Tw at 3000 ms, the number of echoes was set at 1024, and the number of scanning and stacking was set at 128. Test solutions included simulated formation water with different salinities and aqueous solutions with concentration-varied surfactants.
All cores were acquired from the first member of Longmaxi Formation of Lower Silurian in Well Yang101H2-7, Luzhou area, the Sichuan Basin, where the structures are represented by low and steep anticline and wide and gentle syncline, with relatively developed faults. Shale gas reservoirs are mainly buried at the depth of 3500–4300 m, with the brittle mineral content of 60–70% (average 67%), TOC of 3.4–4.0% (average 3.7%), porosity of 4.5–5.5% (average 4.8%), gas saturation of 55–75% (average 65%), gas content of 5.0–7.0 m³/t (average 6.0 m³/ t), and free gas content of 65–75%. Moreover, the reservoirs correspond to the minimum horizontal principal stress of 86–99 MPa, horizontal stress difference of 11–16 MPa, and formation pressure coefficient of 2.0–2.2. Parallel samples were drilled from the full-diameter core and then processed to be standard samples of 2.5 cm in diameter and 5 cm long for check experiments. Table 1 shows core data and experimental program.

2.3. Methodology and Workflow

The workflow is shown in Figure 2. The test solution was injected into the beaker. The core sample was fastened using a fishing line, the other end of which was hung to the support above the balance. A high-precision balance was used to measure the core mass during imbibition. The workflow is detailed as follows.
(1)
All the shale core samples were put into a constant temperature oven at 80 °C for 48 h;
(2)
The porosity and permeability of the samples were measured;
(3)
The dry shale sample was placed in an NMR analyzer, and the initial T2 spectra distribution was tested, which is taken as the reference signals;
(4)
The cores were placed into a corresponding beaker containing test solution vertically, ensuring that the total core was immersed into the solutions, and the starting time was recorded for each sample, record balance reading in real time;
(5)
The core was removed at a designated time and the surface fluids were instantly removed using test paper. The sample was placed into the NMR analyzer to measure post-imbibition T2 spectrum;
(6)
The imbibition experiment was stopped at a constant sample weight. The core sample was taken out, and the T2 spectrum was tested at state of saturation.

3. Results

3.1. Shale Core Imbibition

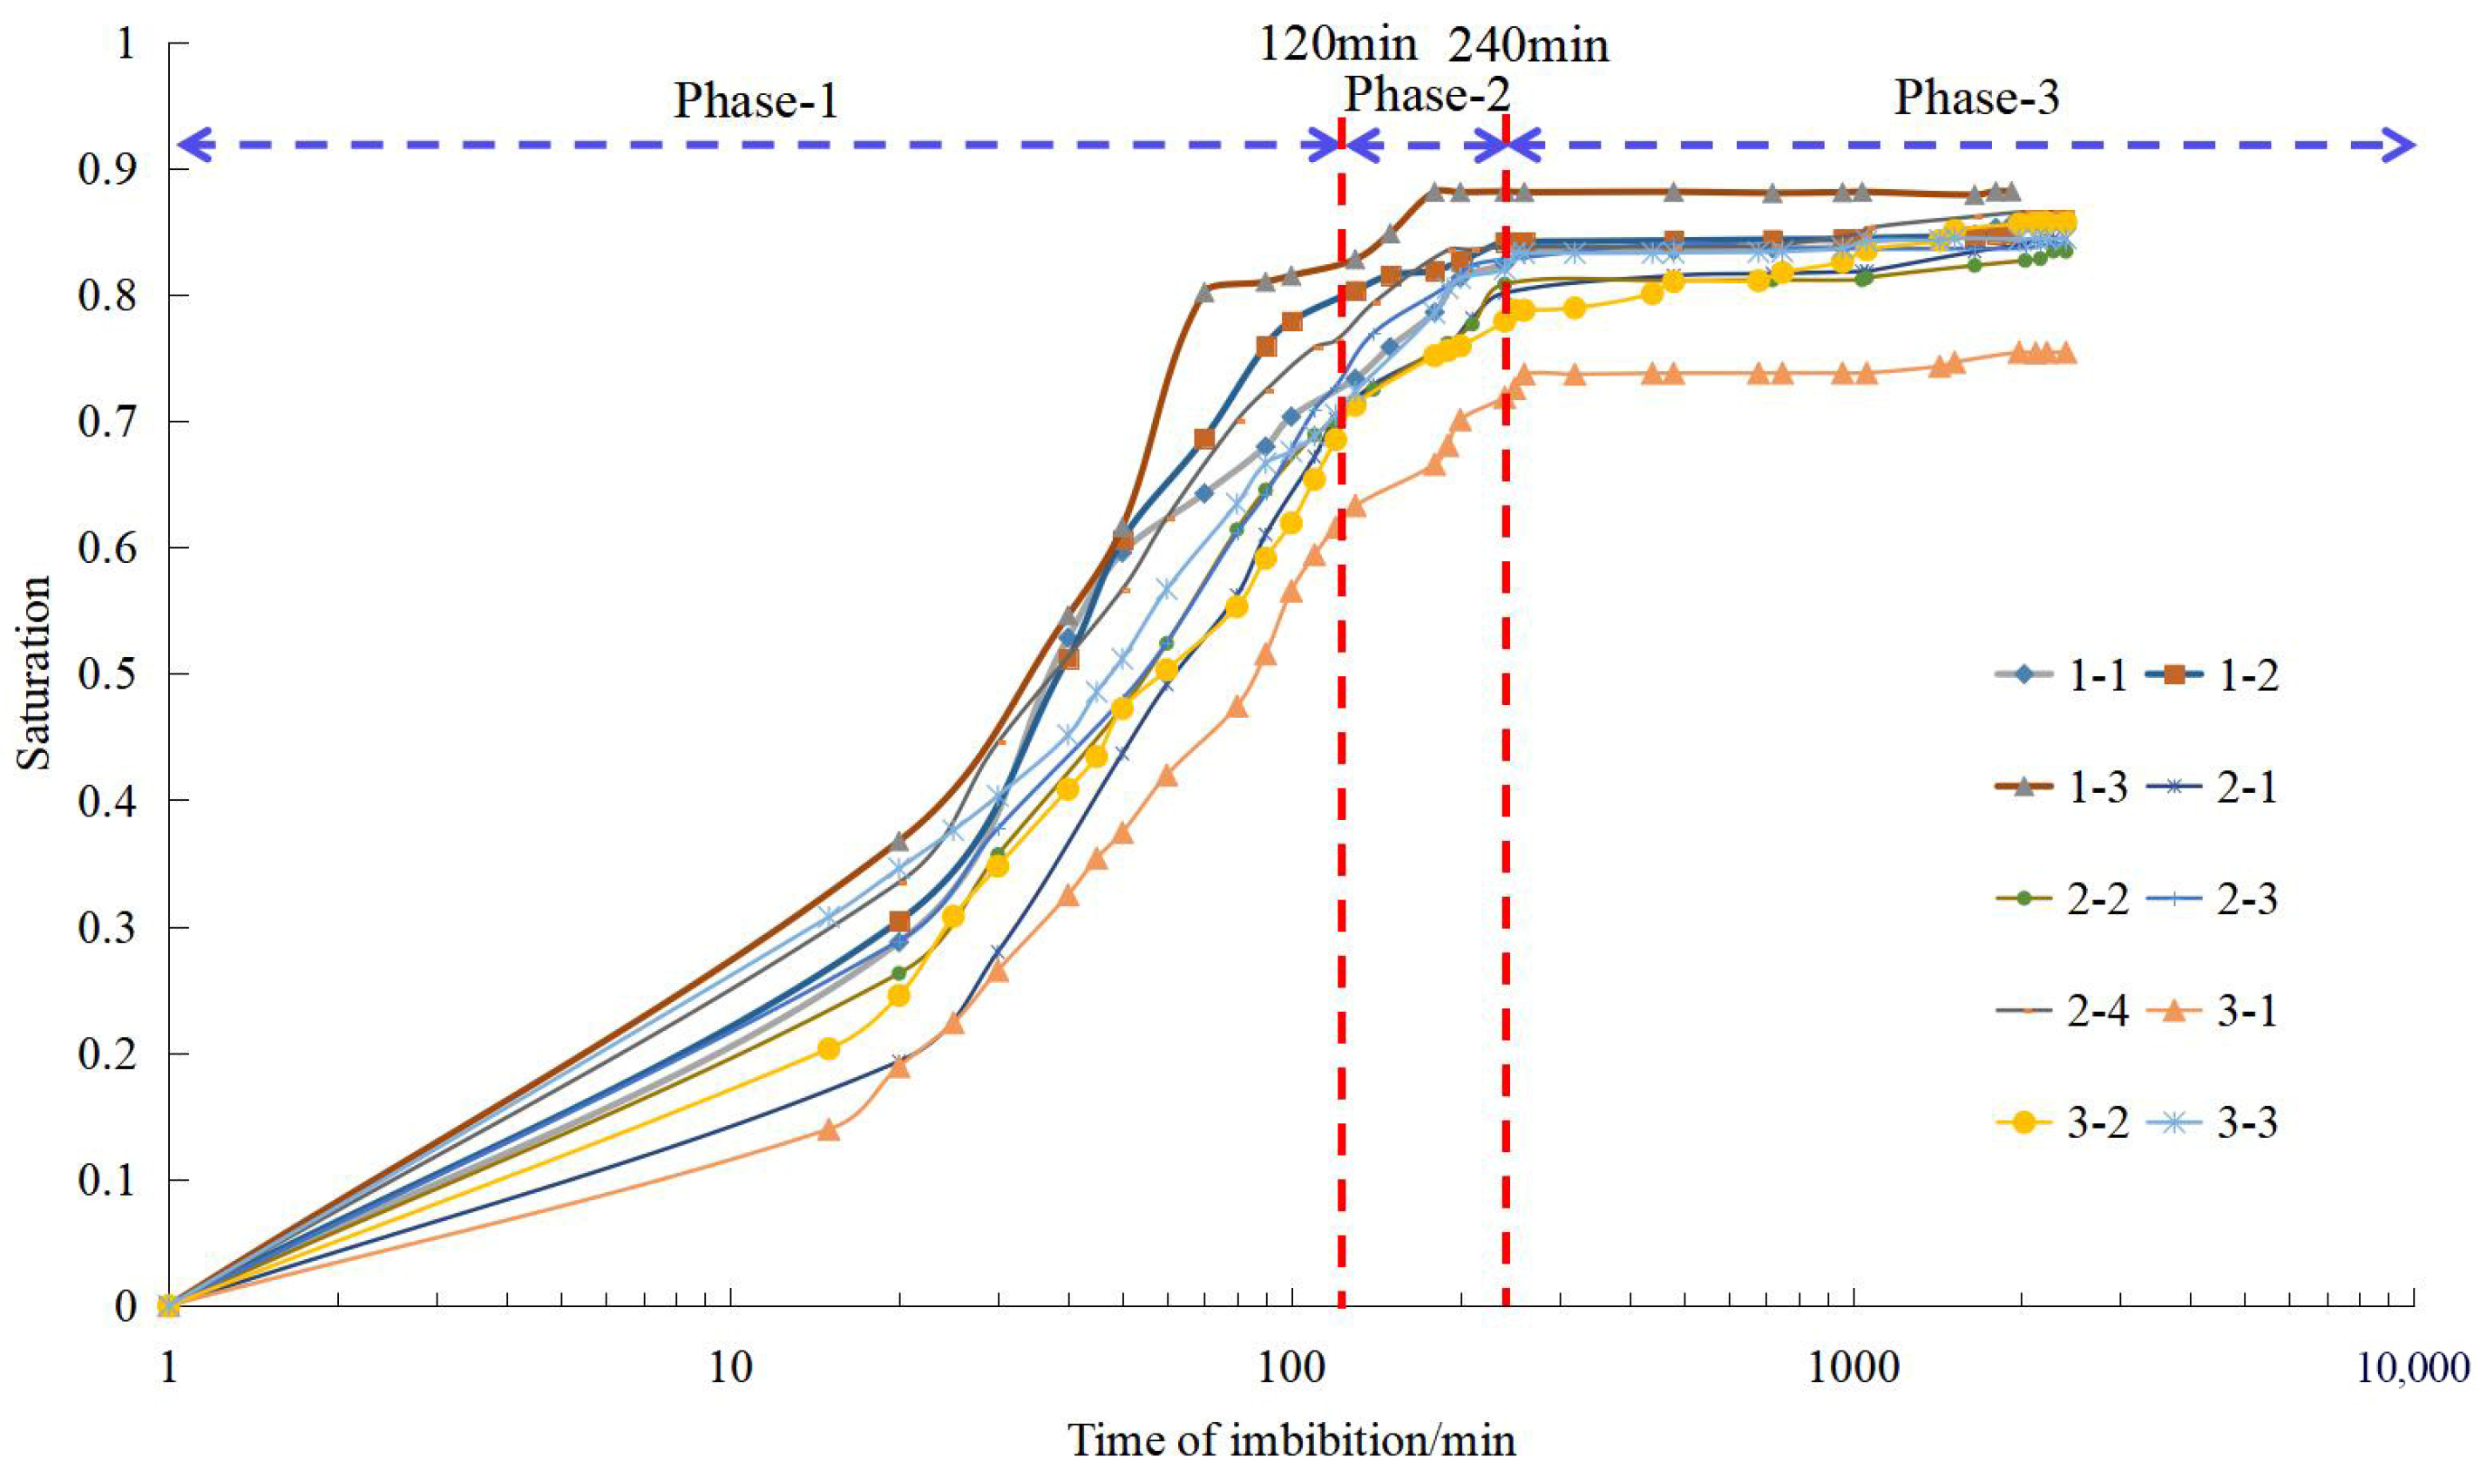
Imbibition recovery variation with time is shown in Figure 3. The whole process of imbibition could be divided into three phases. Phase-1 occurred within 120 min, when the imbibition was controlled by fractures and the degree of imbibition recovery increased quickly owing to strong capillary force and consequent large imbibition rate. Phase-2 occurred in 120–240 min, when fluids in the core sample moved deeper into more pores and the degree of imbibition recovery gradually declined due to weakened capillary force. Phase-3 occurred after 240 min, when hydration appeared and imbibition capacity and the degree of imbibition recovery remained mostly unchanged.
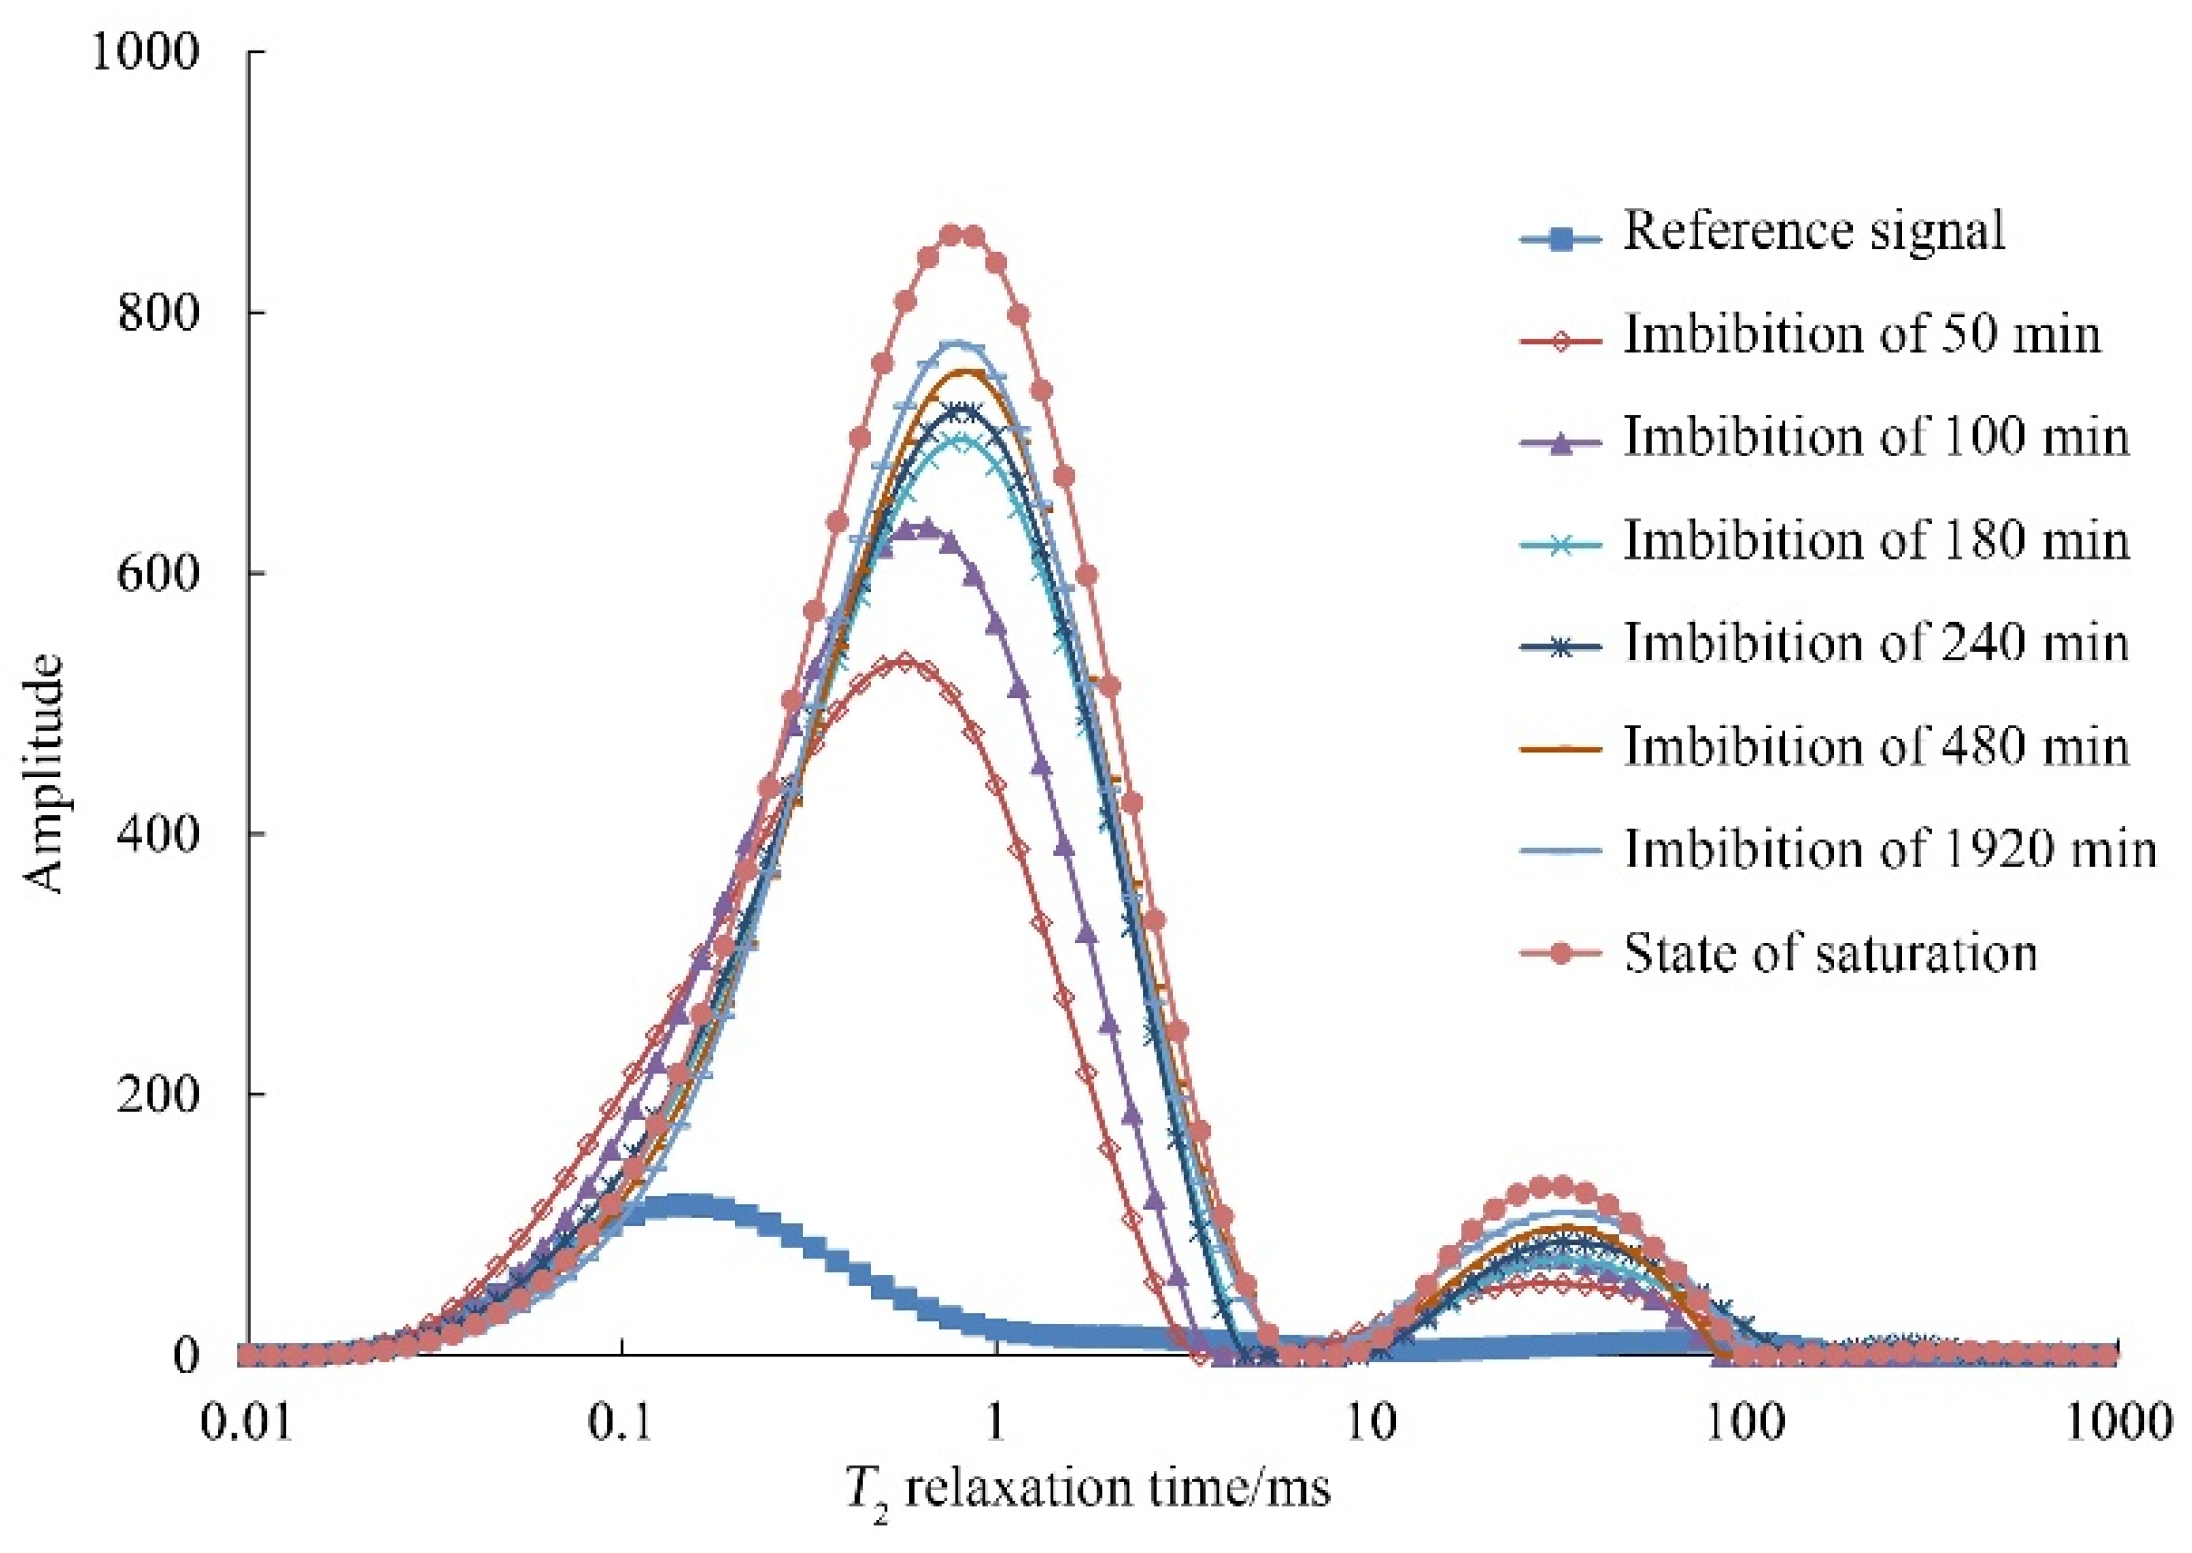
T2 spectral variation in the process of spontaneous imbibition could be used to analyze the degree of recovery at different times and fluid distribution in different pores. Figure 4 shows the T2 spectral variation with the time of imbibition for No.1-1 sample. Reference signals mainly distribute in 0.01–1 ms. Dual peaks, with the left peak higher than the right peak, show two pore types, i.e., micro pores in organic matter indicated by the left peak and large pores indicated by the right peak. In addition, micro pores in organic matter constitute the most of the pore space. Small transverse relaxation time indicates small pore size.
Quickly increased envelop area of the right peak at 50 min in T2 spectrum indicates that the large pores were quickly filled with fluids by fracture system at the initial stage of spontaneous imbibition. Small area change at the late stage indicates small variation of imbibition. Remarkably increased envelop area of the left peak before 180 min of imbibition indicates large imbibition rate at the initial stage and a rapid boost in imbibition capacity. Small variation of left-peak envelop-area after 240 min of imbibition reflects the slow-down in imbibition. Left peak height increases with imbibition time, indicating water intrusion into matrix pore space and gradually increased water content. Right shift of the left peak denotes water flowing into small matrix pores first, followed by large matrix pores or the occurrence of new large pores. In conclusion, water quickly imbibed into the fracture system in the process of imbibition, then into the small pores close to the fracture wall owing to the effect of capillary force, and finally into the deep and relatively larger pores.

3.2. Imbibition Controls

3.2.1. Fractures

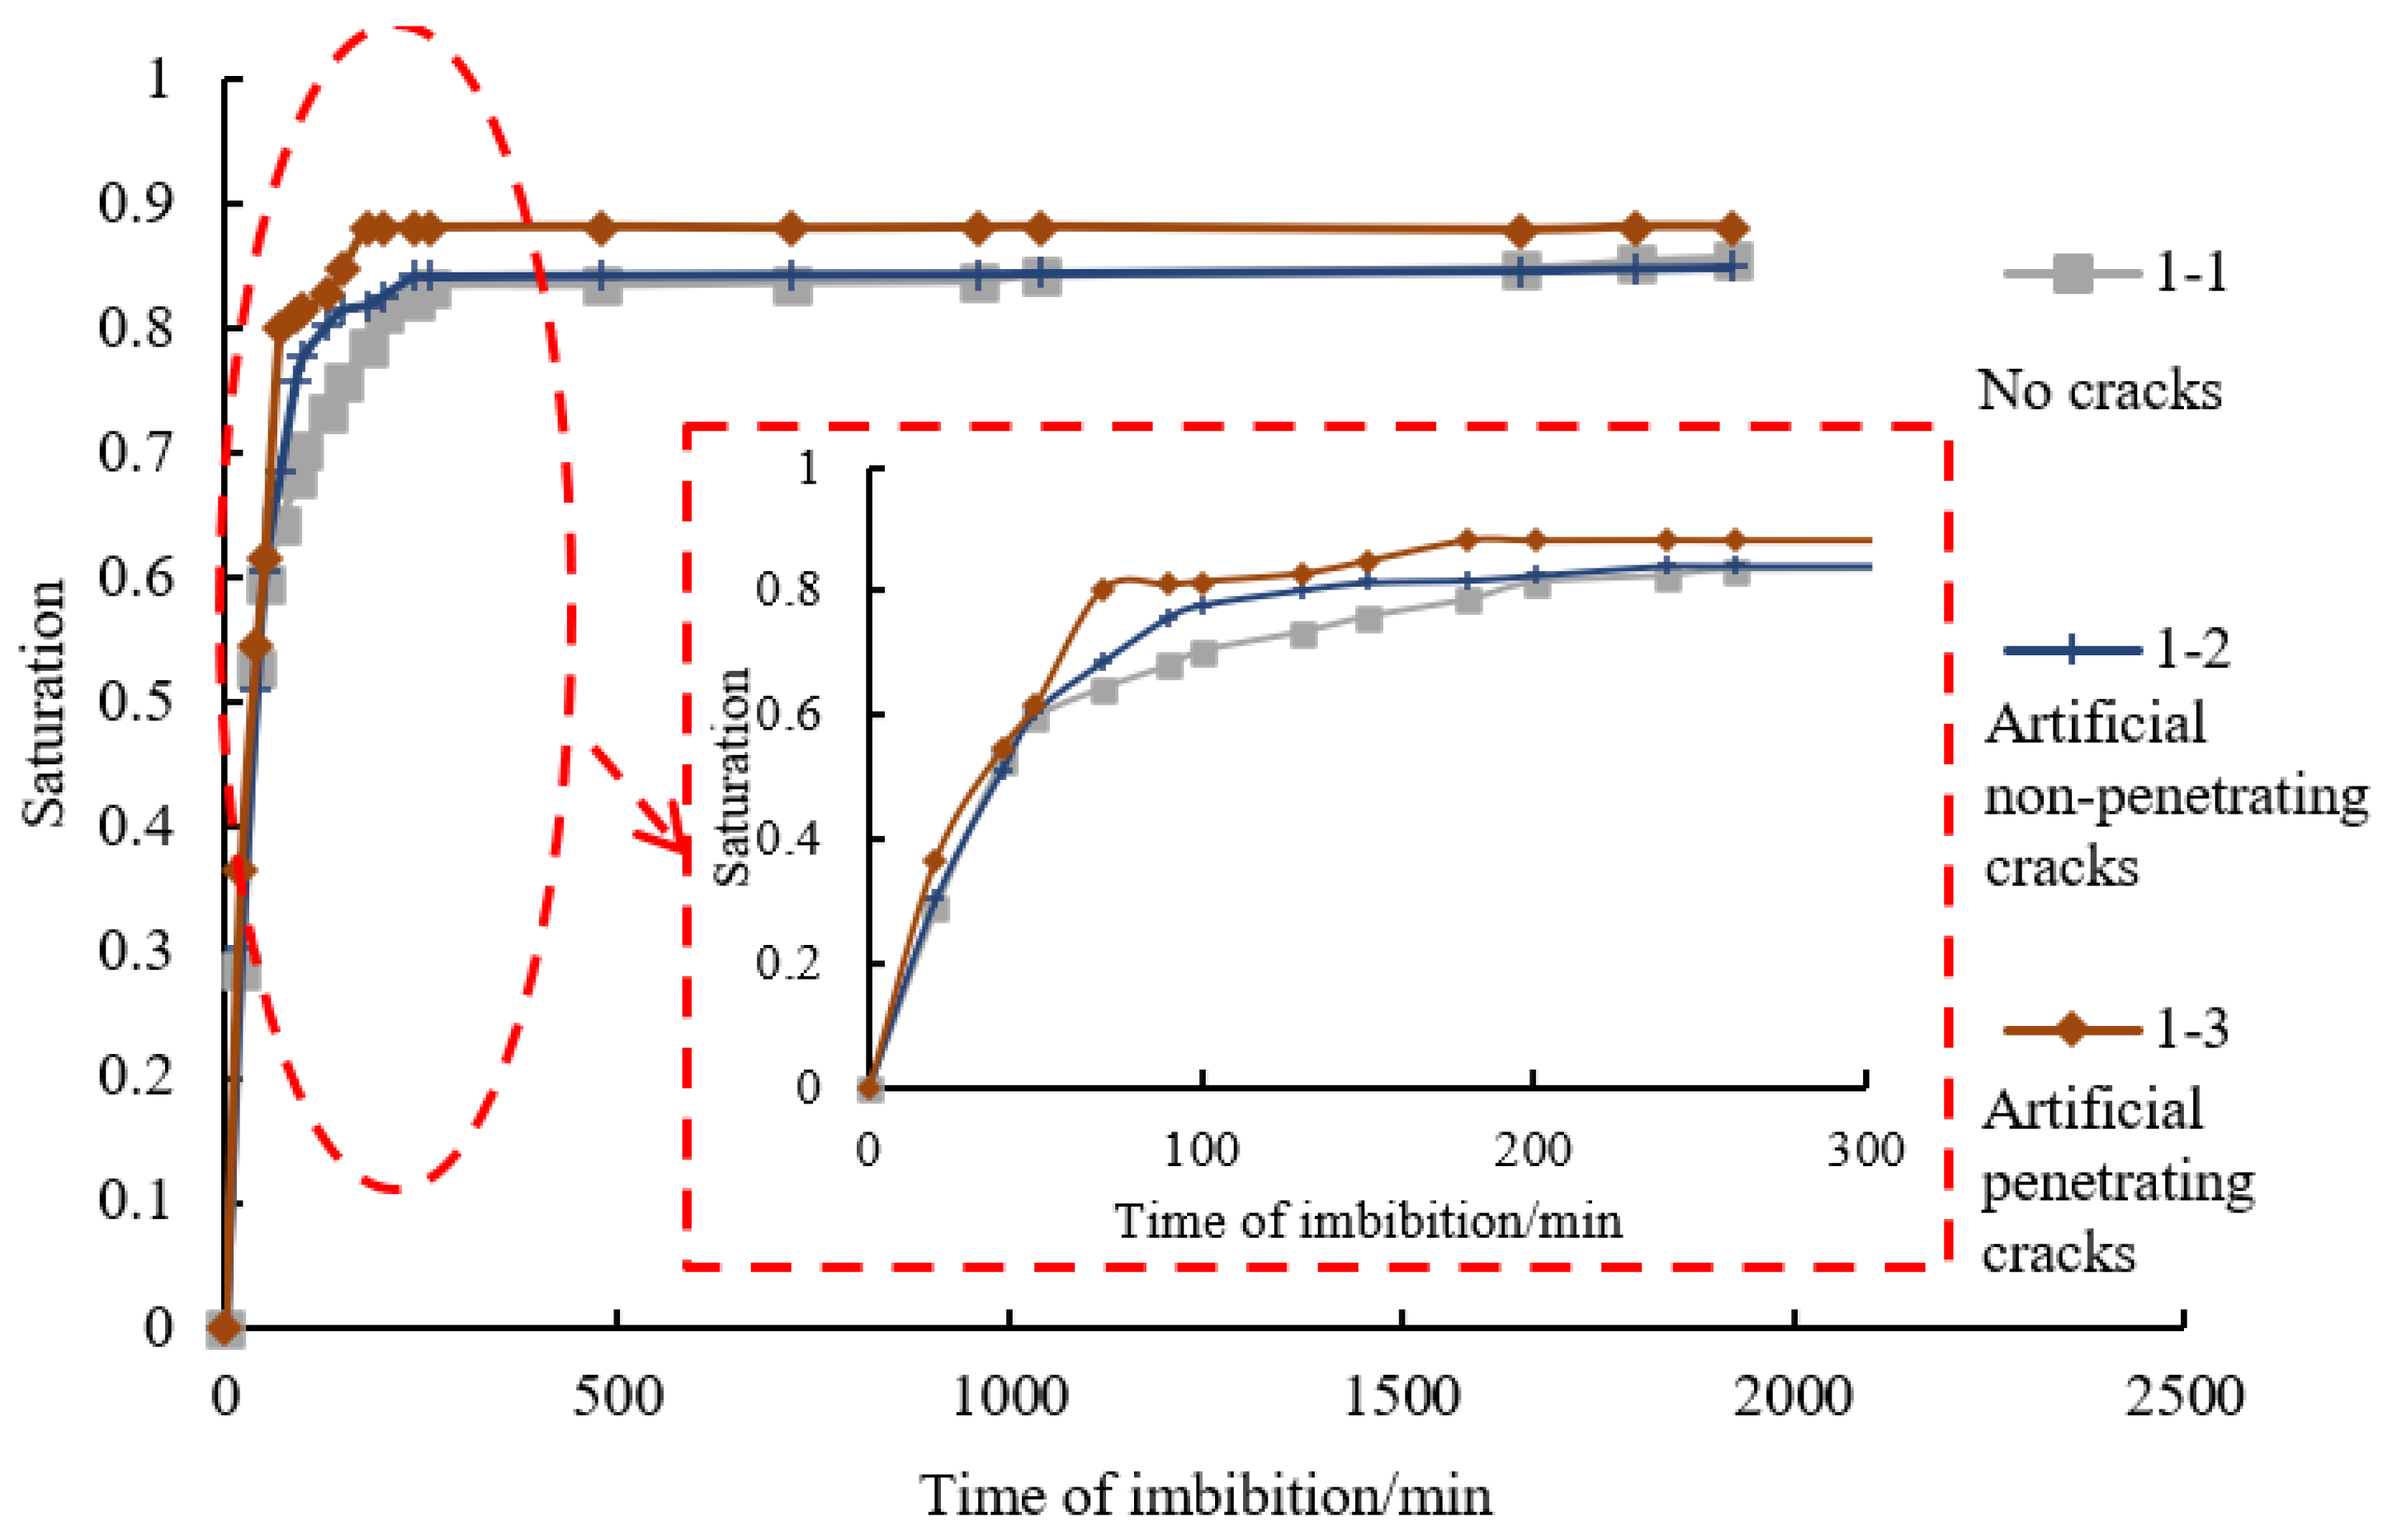
Figure 5 shows the order of 1-1 < 1-2 < 1-3 in accordance with shale core imbibition rate and capacity, which is reconciled with the order of fracture density of shale cores being investigated (shale core 1-1 with no cracks, shale core 1-2 with artificial non-penetrating cracks, shale core 1-3 with artificial penetrating cracks). This means that imbibition rate and capacity increase with increasing fracture density, and fractures facilitate the imbibition of fracturing fluids. In accordance with the analysis, capillary force and hydration mainly occur close to the contact with fluid media. Fluids cannot intrude deeply along the contact surface. As fracture density increases, the area of imbibition, and consequently imbibition capacity and rate increase accordingly. Hence, the area of imbibition has an important effect on imbibition capacity.

3.2.2. Salinity

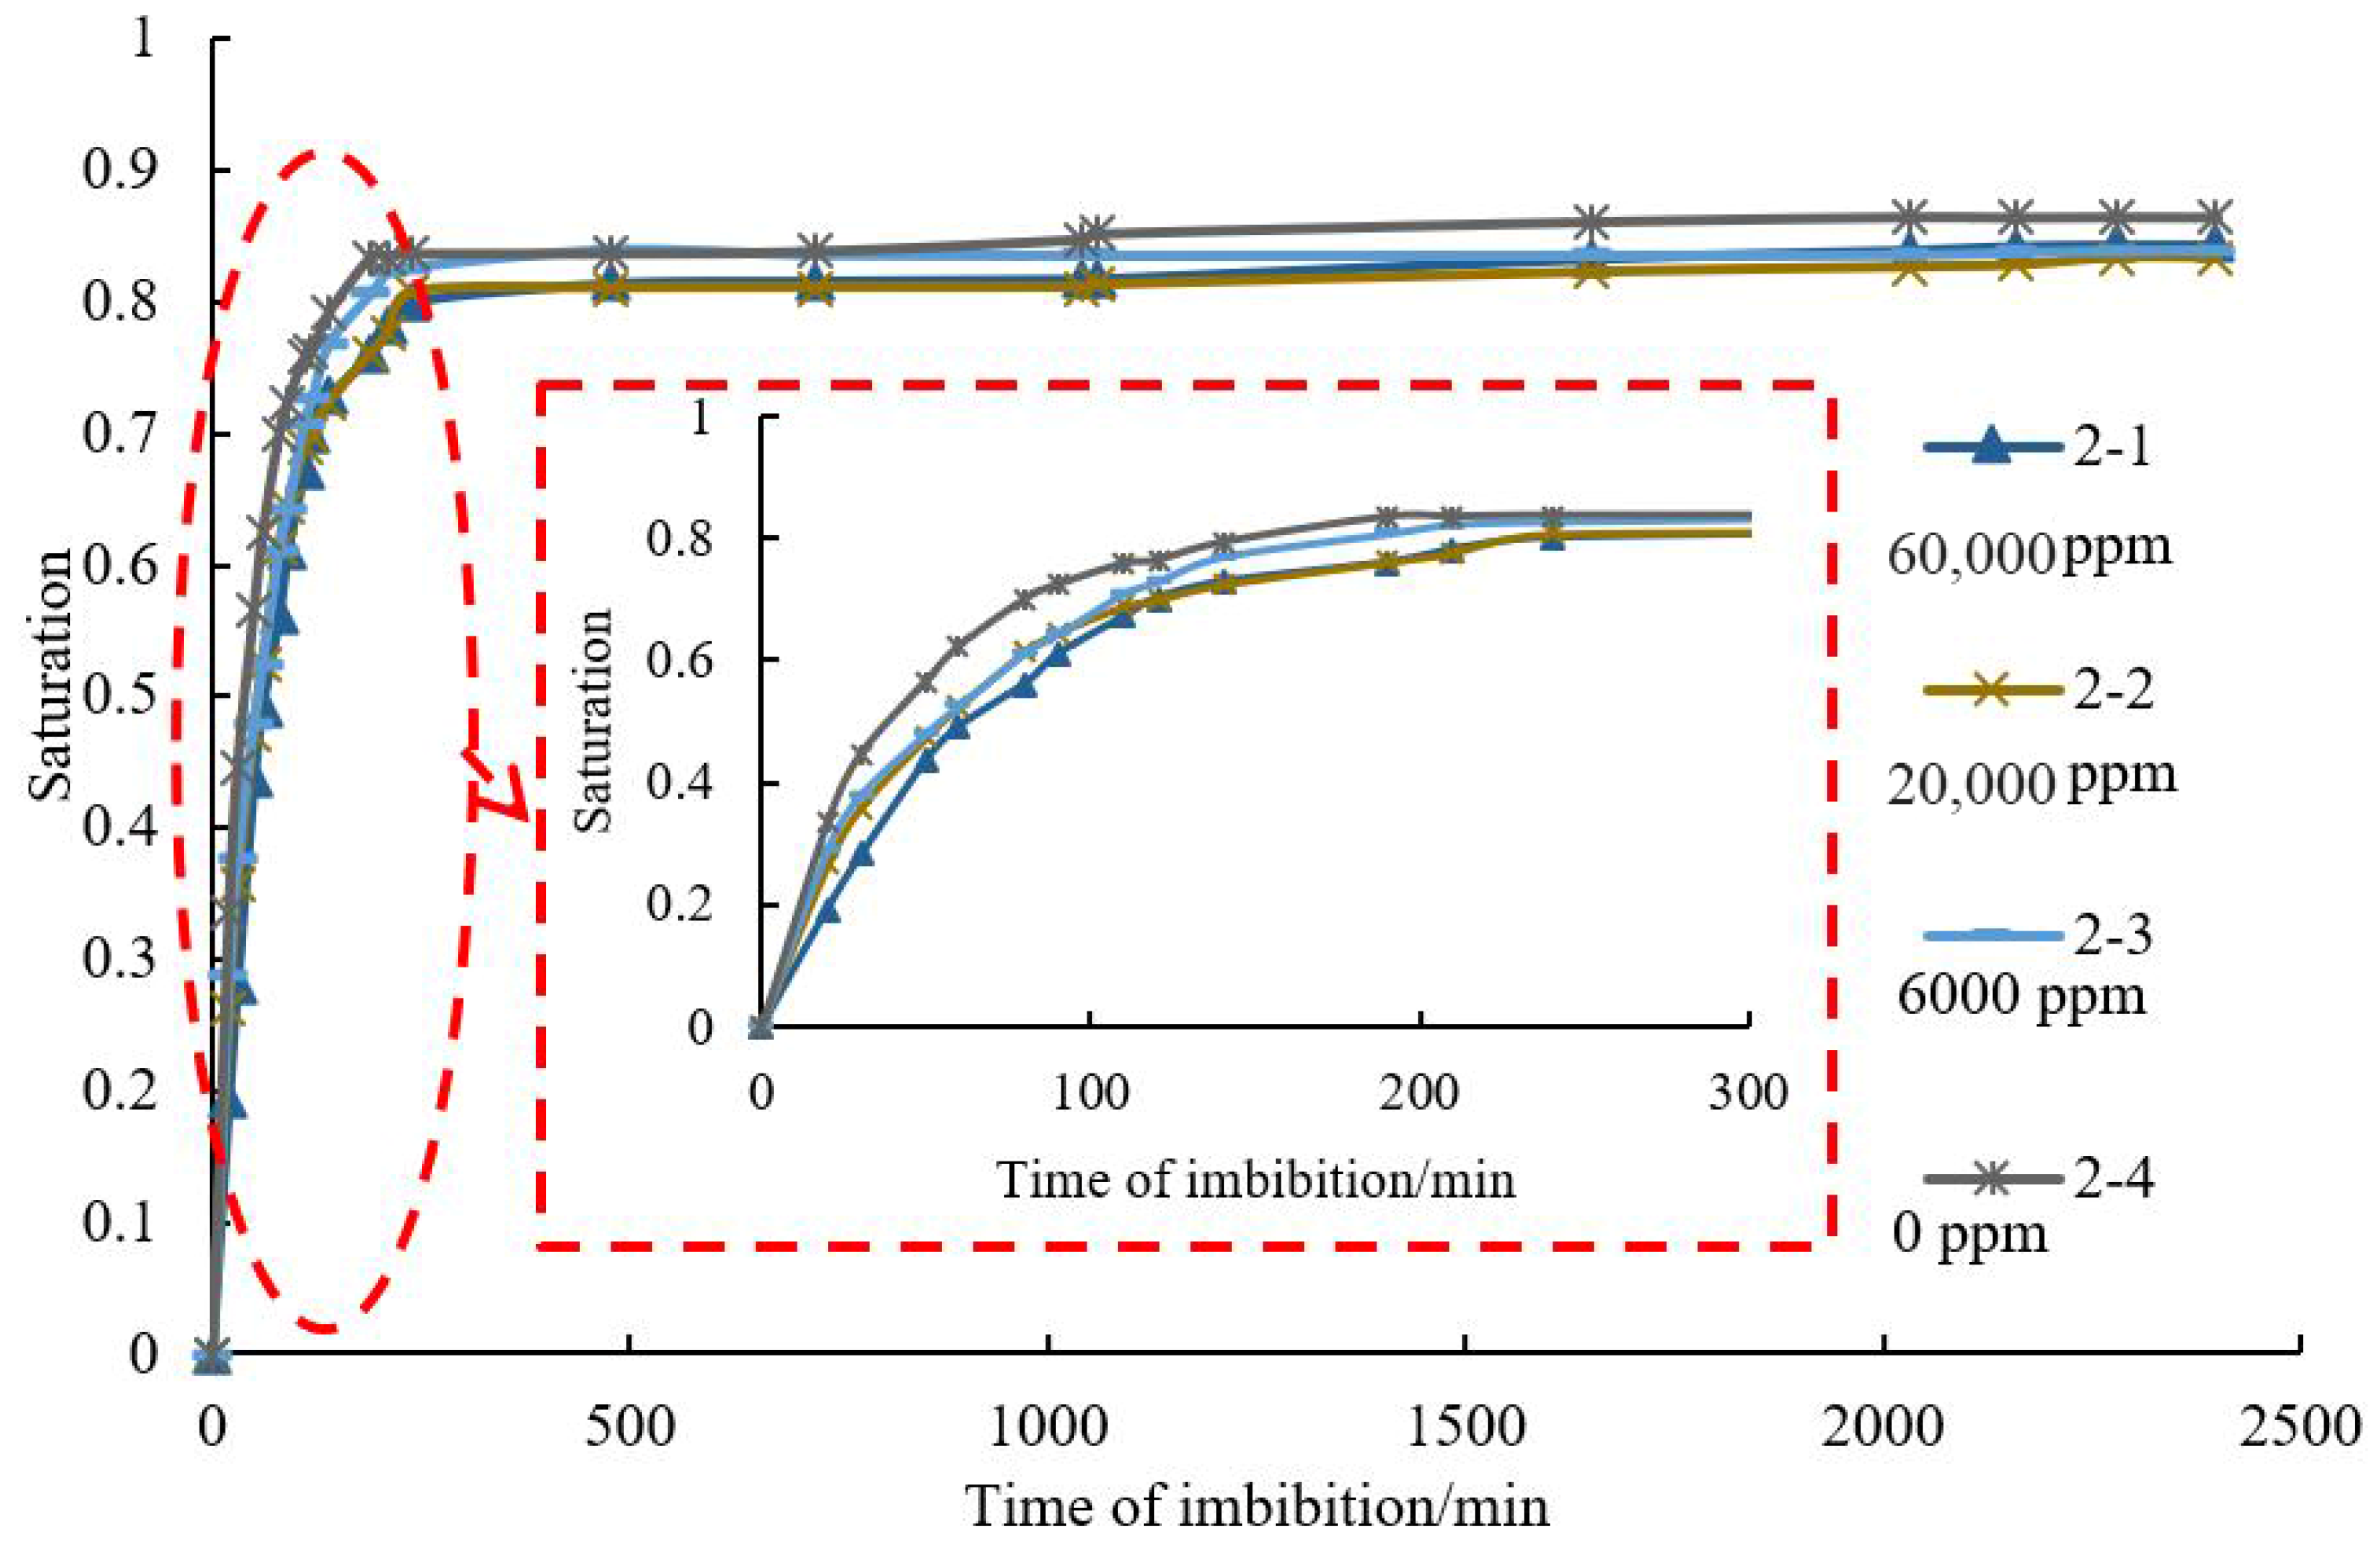
Figure 6 shows the order of 2-1 < 2-2 < 2-3 < 2-4 according to shale core imbibition rate and capacity, which means imbibition rate and capacity decrease with increasing salinity of the solution (the water salinity of the imbibition solution for shale core 2-1 is 60,000 ppm, the water salinity of the imbibition solution for shale core 2-2 is 20,000 ppm, the water salinity of the imbibition solution for shale core 2-3 is 6000 ppm, the imbibition solution for shale core 2-4 is deionized water). According to the analysis, water intake by shales, which are a type of clay-bearing porous media, is mainly dependent on capillary force and hydration. Clay hydration includes surface hydration and osmotic hydration. High salinity could inhibit clay hydration and decrease the chemical potential difference and driving force of imbibition.

3.2.3. Surfactant Concentration

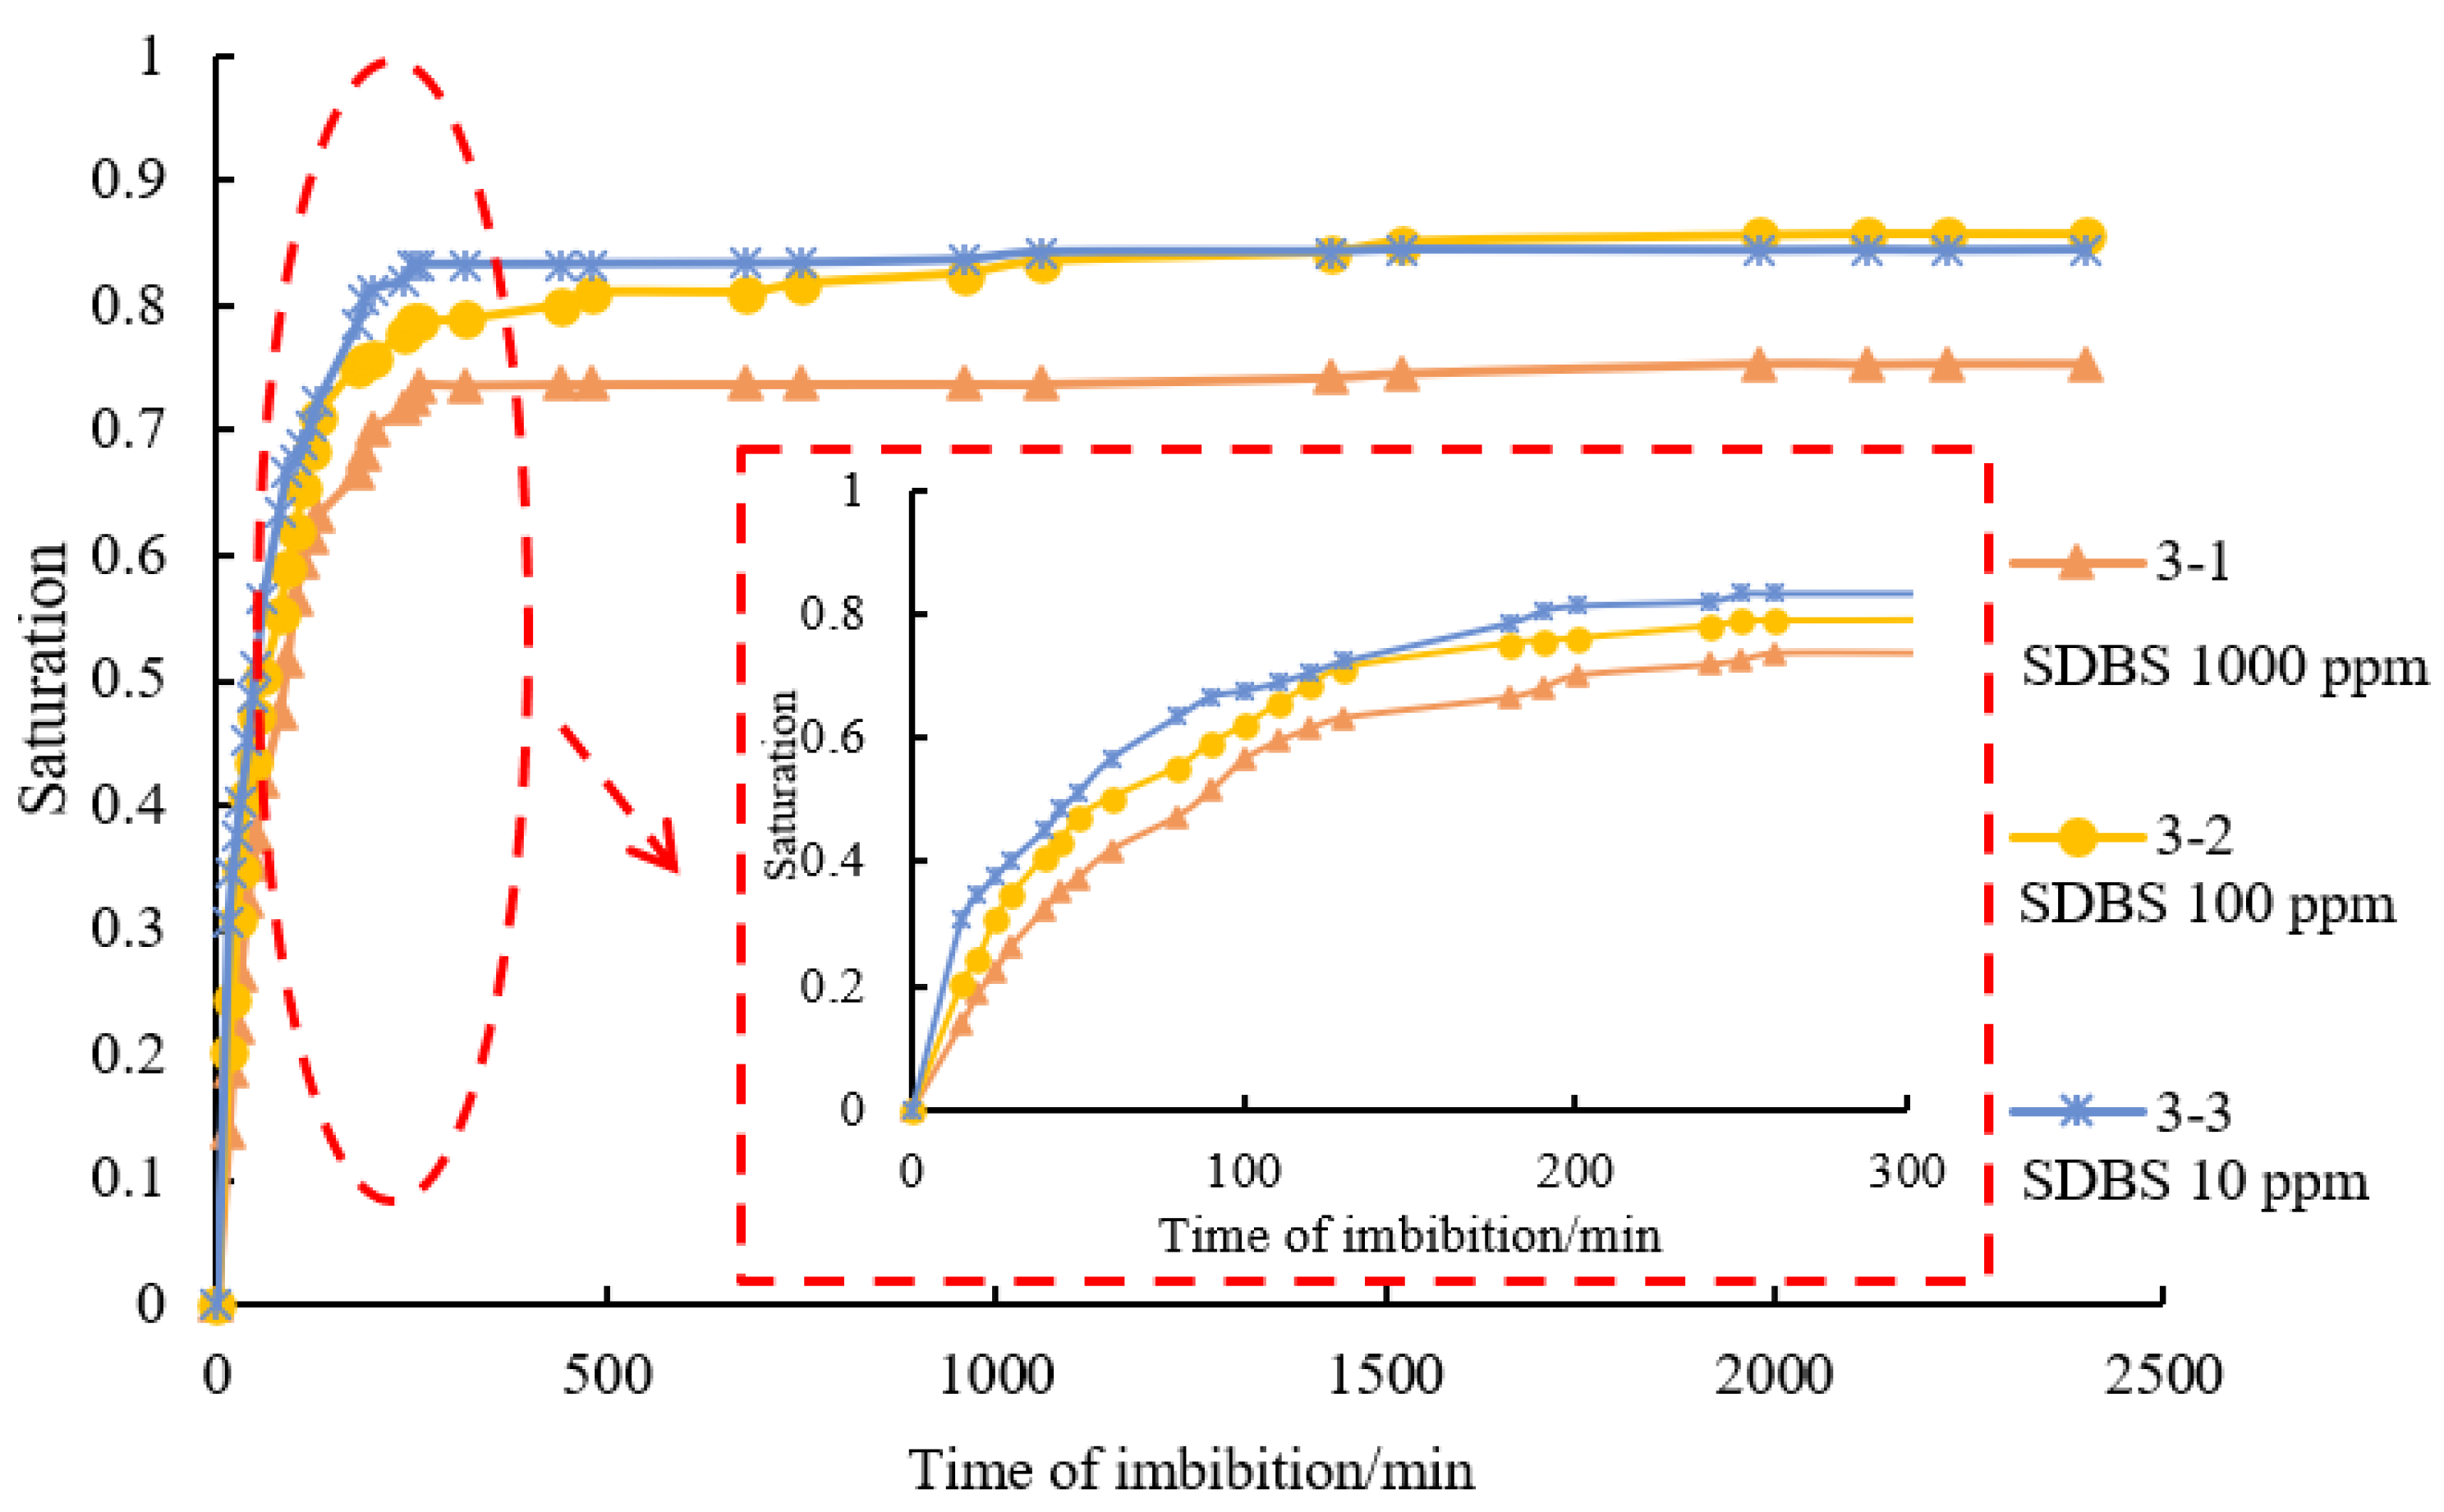
Figure 7 shows the order of 3-1 < 3-2 < 3-3 in accordance with shale core imbibition rate and capacity, which means imbibition rate and capacity decrease with increasing surfactant concentration (the SDBS concentration of the imbibition solution for shale core 3-1 is 1000 ppm, the SDBS concentration of the imbibition solution for shale core 3-2 is 100 ppm, the SDBS concentration of the imbibition solution for shale core 3-3 is 10 ppm). As per the analysis, the surface tension of the solution will significantly decrease when surfactant concentration goes up, leading to remarkably decreasing capillary force and driving force of imbibition.

3.3. Imbibition Flowback

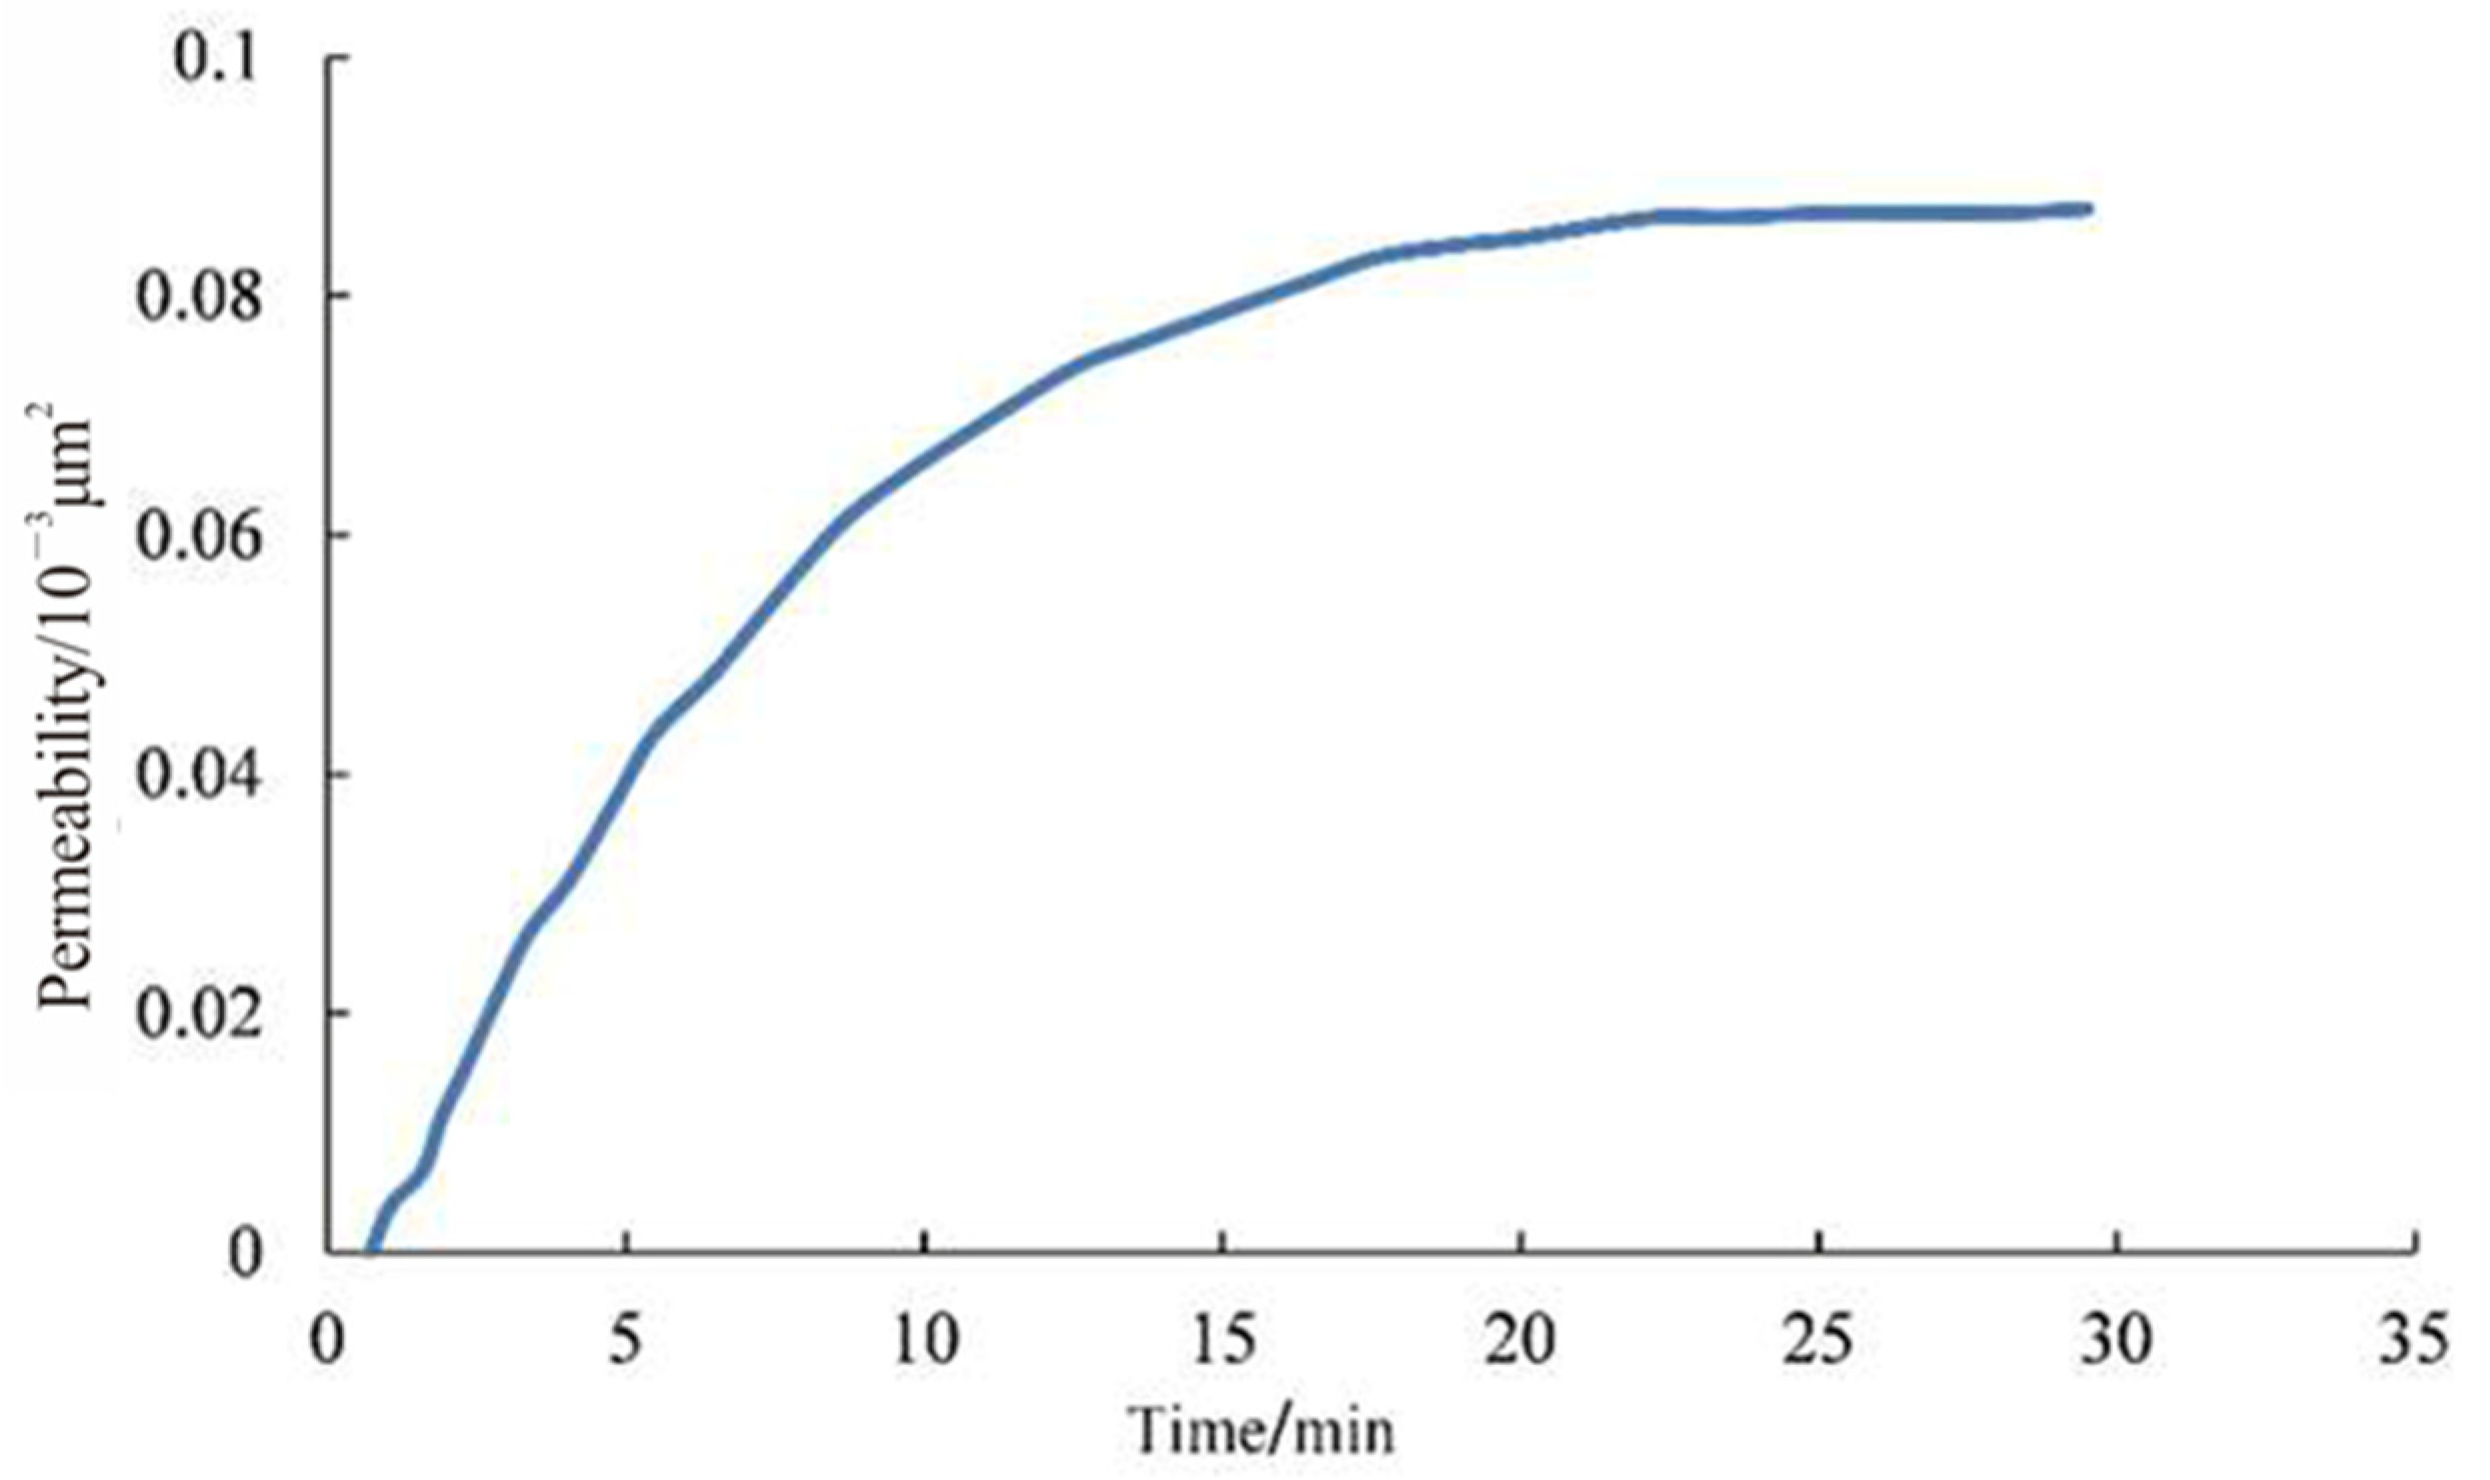
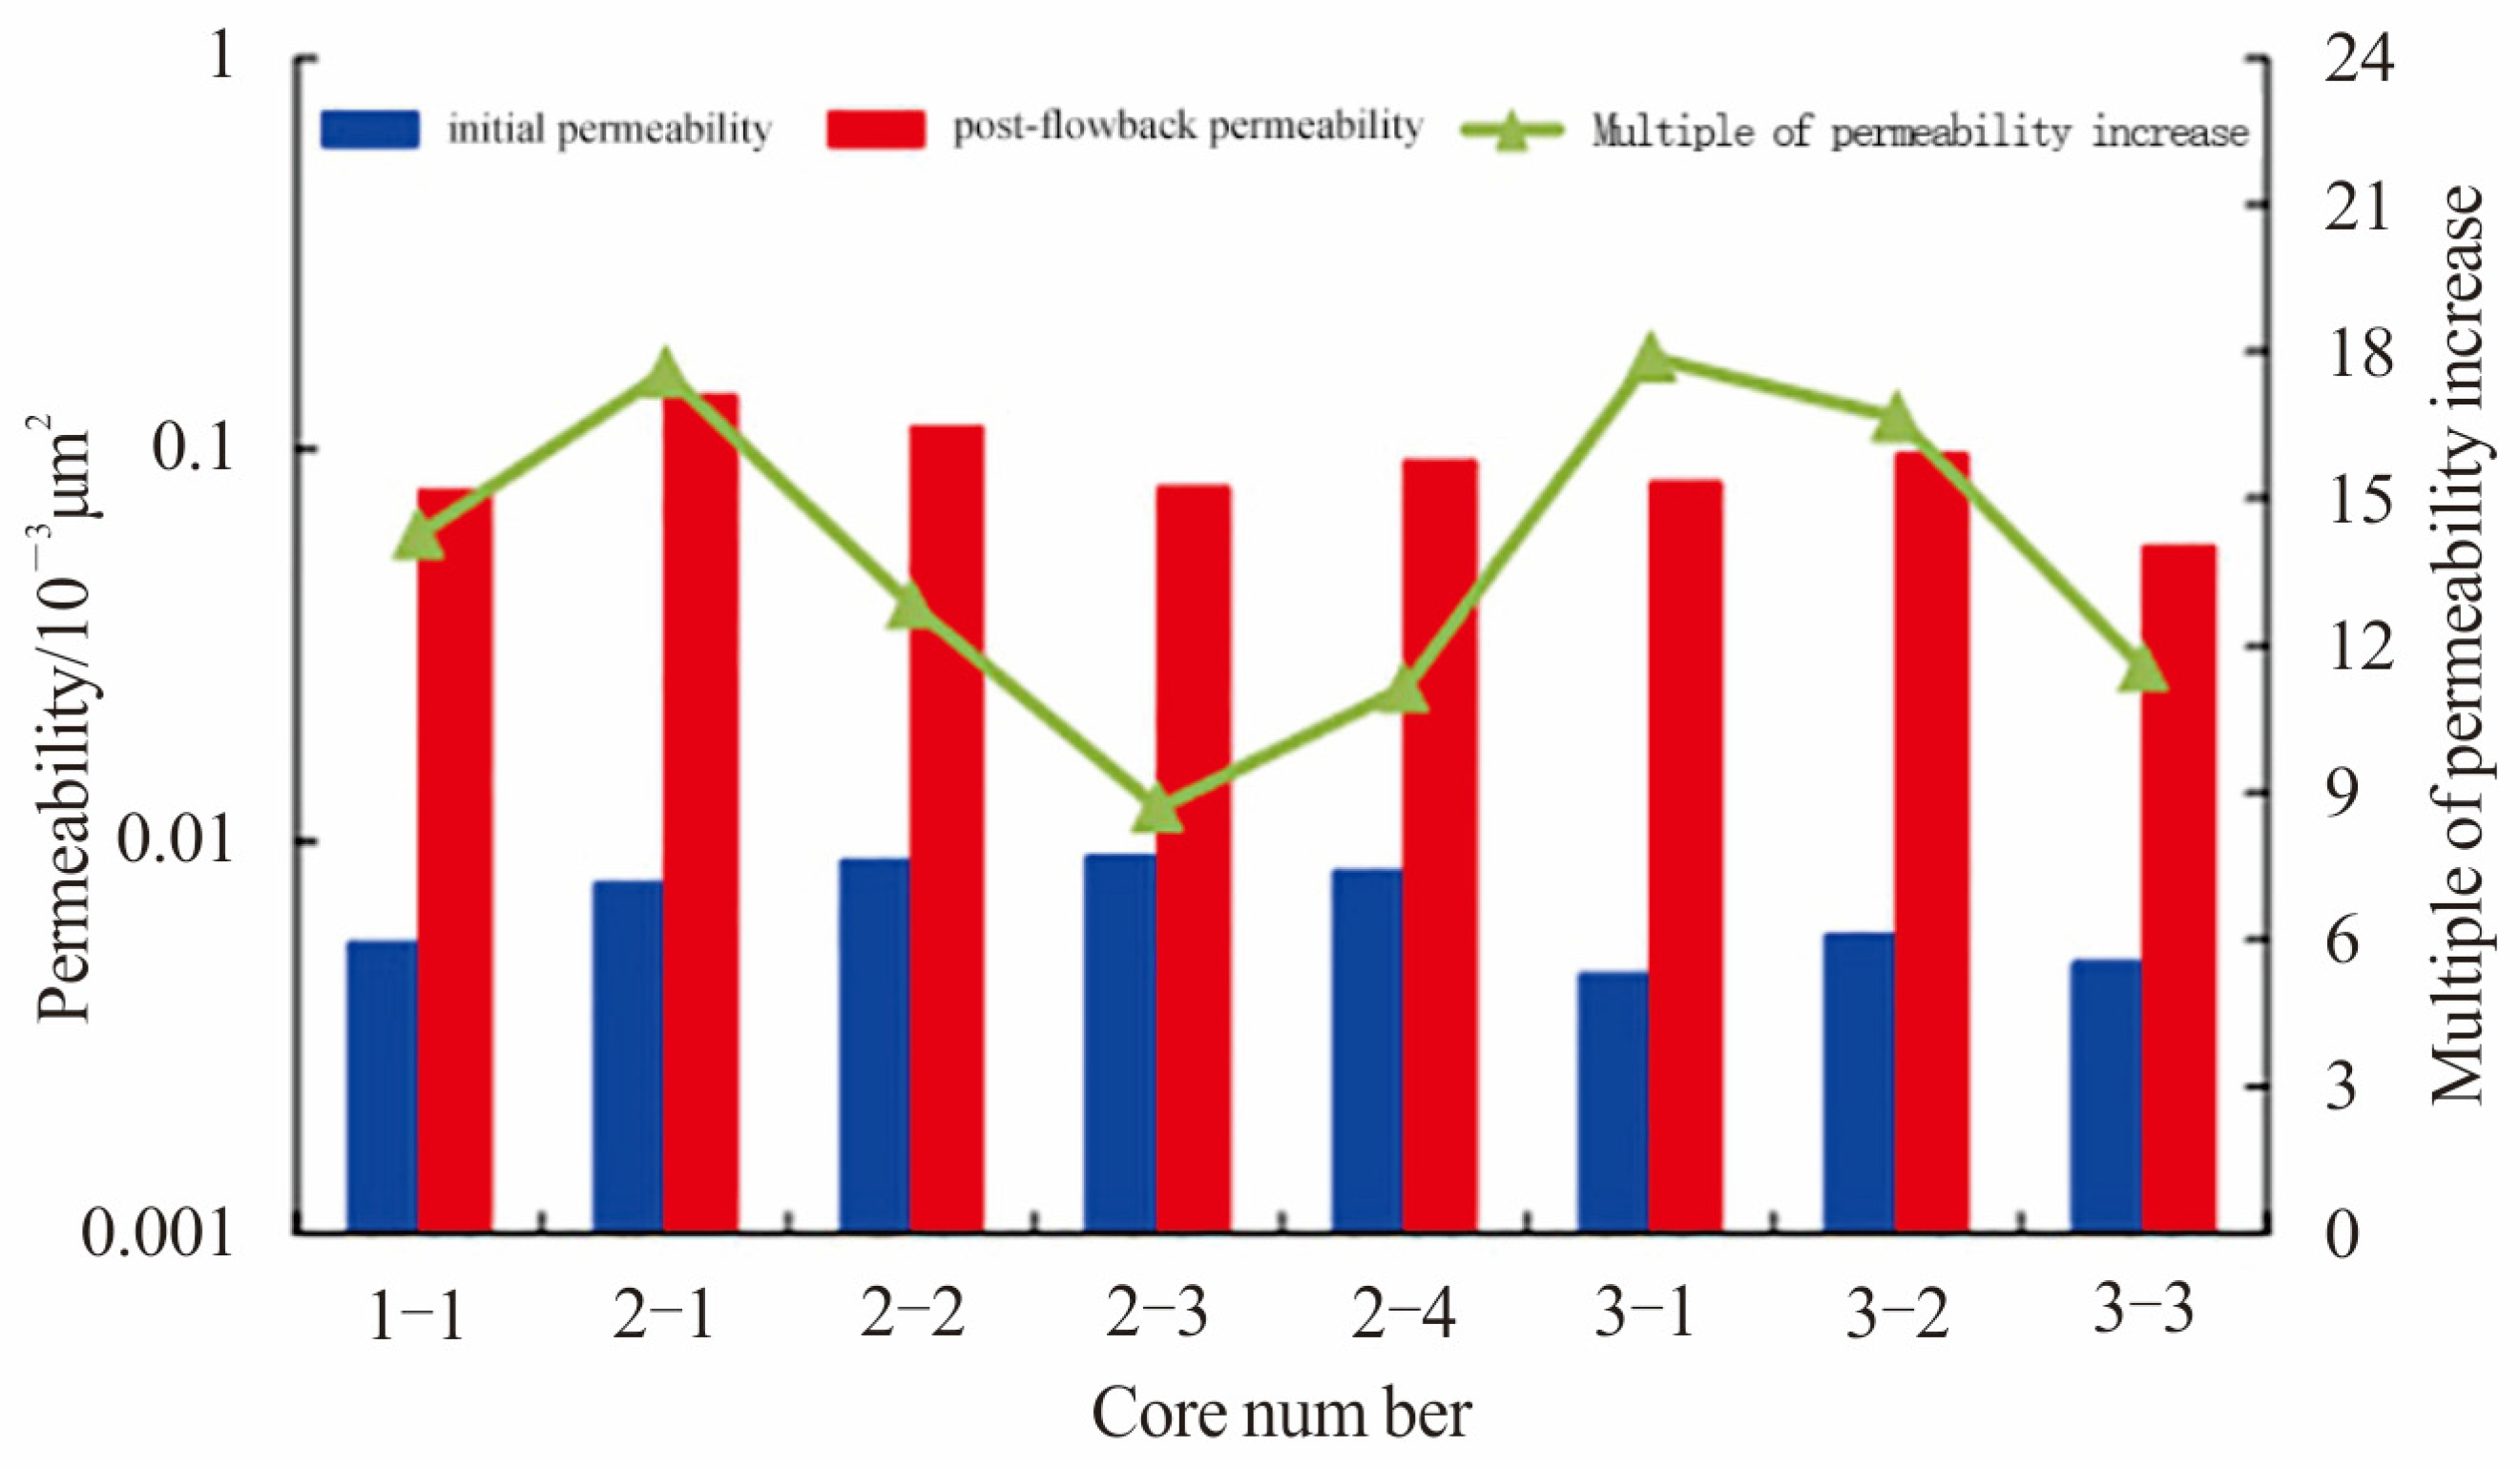
Permeability change during imbibition flowback of gas displacing water was recorded in real time, as shown in Figure 8. Permeability first increased quickly with decreasing water saturation and then became stable. Figure 9 compares initial permeability with post-flowback permeability, and the latter is universally larger than the former. In the area of interest, core permeability increased by 8.70–17.88 times with the average of 13.83 times.
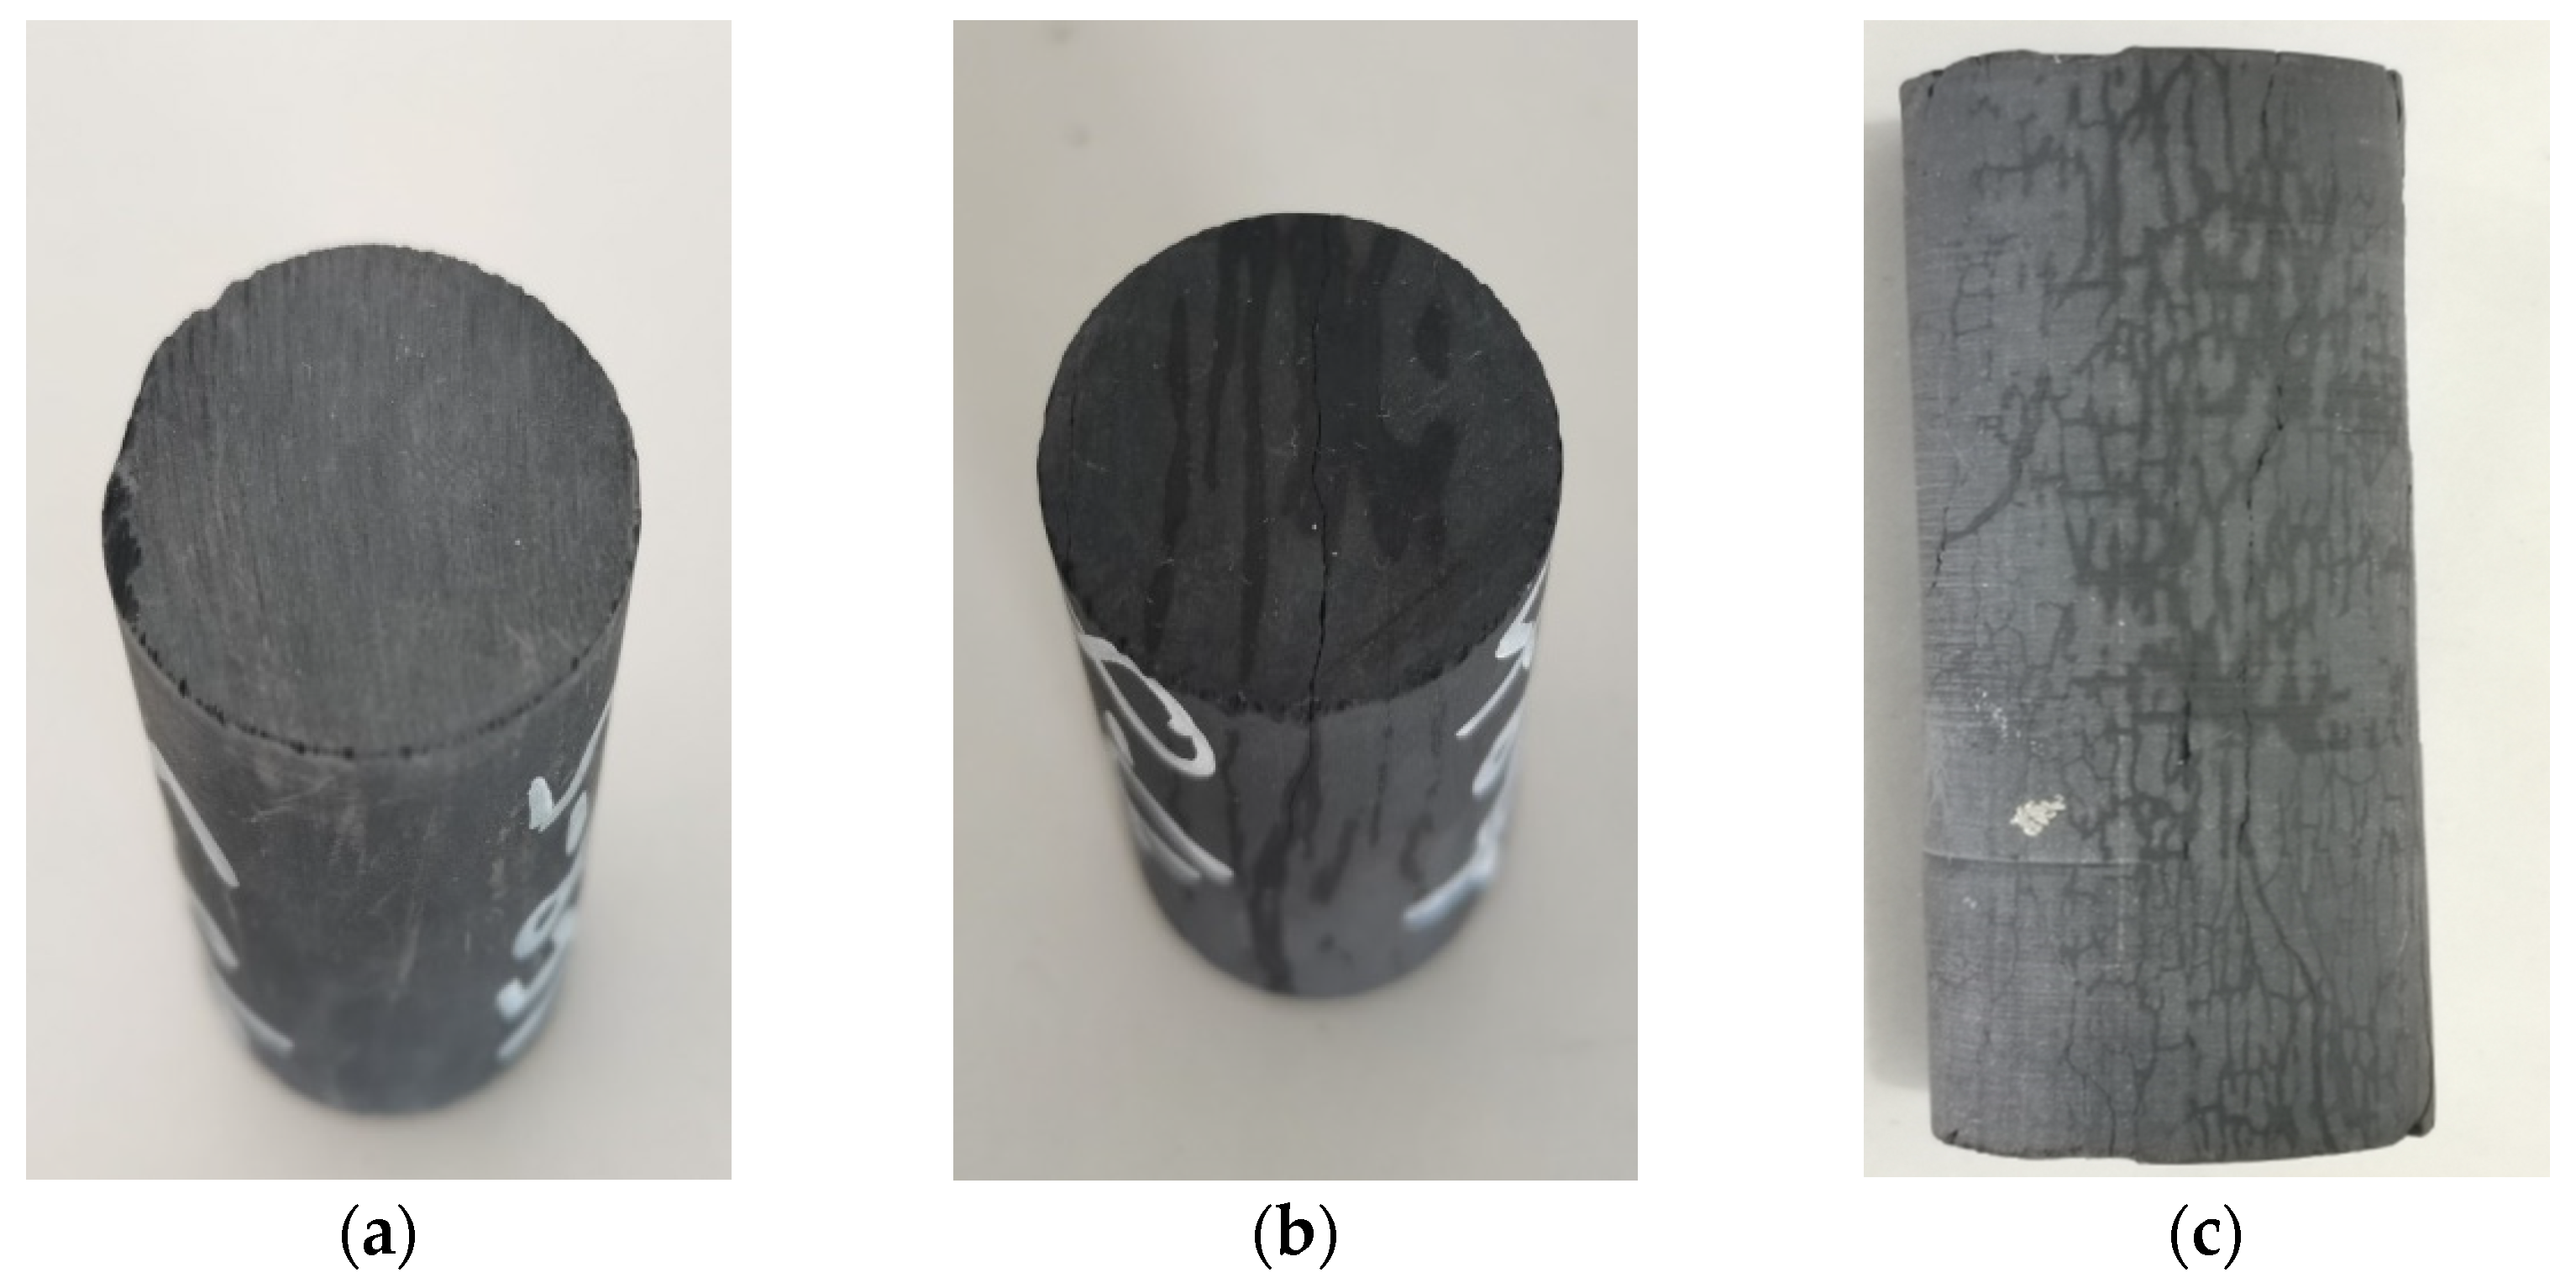
Figure 10 compares a dry core with the same core after imbibition flowback. Distinct cracks occurred on the end face of the core after imbibition flowback and functioned as the major channels of flowback. A crack network forming on the surface of the core indicates many microcracks generated by water absorption. According to the analysis, fluids were imbibed into matrix pores and hydrated and eroded pore walls to form larger dissolved pores, which were hydrated, separated, and delaminated to form microcracks. Microcracks further extended and expanded to form a crack network, which improved core permeability. This means that increasing shut-in time to ensure a complete reaction between fracturing fluids and reservoir rocks may facilitate fracture expansion and connectivity to generate new filtration channels and further improve reservoir properties and deliverability.

4. Conclusions

In this paper, based on NMR measurements and imbibition experiment of shale core samples, the physical phenomenon and mechanism of shale imbibition were investigated, and some influencing factors were analyzed. This research provided crucial theory foundations for guide flowback designing and shale gas production. Some conclusions were drawn as follows:
(1)
Quickly increased right-peaks in T2 spectra, and first quickly increased and then slow-moving left-peaks that shifted right in the process of shale imbibition indicated rapid water intrusion into fractures at first and then small pores close to fracture walls and deep large pores due to the effect of capillary force.
(2)
Imbibition rate and capacity increased with increasing fracture density, decreasing salinity, and decreasing surfactant concentration.
(3)
Shale core permeability increased by 8.70–17.88 times with the average of 13.83 times after imbibition flowback in the area of interest. Cracks occurring on the end face and surface of the core indicated that after fluids were imbibed into the matrix pores, microcracks generated by hydration extended and expanded to form a crack network and new filtration channels, which further improved reservoir properties.

Author Contributions

Resources, X.W.; Validation, C.C. and X.Y.; Writing—original draft, Y.S.; Writing—review & editing, Q.L. All authors have read and agreed to the published version of the manuscript.

Funding

This research received no external funding.

Institutional Review Board Statement

Not applicable.

Informed Consent Statement

Informed consent was obtained from all subjects involved in the study.

Data Availability Statement

The data is confidential, so the details are not disclosed.

Conflicts of Interest

The authors declare no conflict of interest.

References

  1. Zou, C.; Zhao, Q.; Cong, L.; Wang, H.; Shi, Z.; Wu, J.; Pan, S. Development progress, potential and prospect of shale gas in China. Natural. Gas Ind. 2021, 41, 1–14. [Google Scholar]
  2. Zhang, T.; Li, X.; Yang, L.; Li, J.; Wang, Y.; Feng, D.; Yang, J.; Li, F. Effects of shut-in timing on flowback rate and productivity of shale gas wells. Nat. Gas Ind. 2018, 37, 48–60. [Google Scholar]
  3. Singh, H. A critical review of water uptake by shales. J. Nat. Gas Sci. Eng. 2016, 34, 751–766. [Google Scholar] [CrossRef]
  4. Cheng, Y. Impact of water dynamics in fractures on the performance of hydraulically fractured wells in gas shale reservoirs. J. Can. Pet. Technol. 2012, 51, 143–151. [Google Scholar] [CrossRef]
  5. Liu, N.; Liu, M.; Zhang, S. Flowback patterns of fractured shale gas wells. Nat. Gas Ind. 2015, 35, 50–54. [Google Scholar] [CrossRef]
  6. Gao, S.; Hu, Z.; Guo, W.; Zuo, L.; Shen, R. Water absorption characteristics of gas shale and the fracturing fluid flowback capacity. Nat. Gas Ind. 2013, 33, 71–76. [Google Scholar]
  7. Wu, K.; Xiong, W.; Hu, Z.; Gao, S. Experimental Study on Influence of Different Degrees of Water Saturation on Seepage Capacity of Shale. Res. Explor. Lab. 2018, 37, 32–35. [Google Scholar]
  8. Guo, J.; Tao, L.; Chen, C.; Zhao, Y.; He, S.; Liu, Y. Water Imbibition Law of Longmaxi Formation Shale in the South of Sichuan Basin. Chin. J. Comput. Phys. 2021, 38, 565–572. [Google Scholar]
  9. Xu, F. Spontaneous imbibition characteristics of fracturing fluid in shale gas reservoir considering chemical osmotic pressure. Lithol. Reserv. 2021, 33, 145–152. [Google Scholar]
  10. Xiong, J.; Chen, S.; Liang, L.; Xiao, Y.; Chen, L.; Yang, L. Imbibition characteristics and influencing factors of Longmaxi Formation shale. J. Guilin Univ. Technol. 2020, 40, 688–694. [Google Scholar]
  11. Zhu, Y.; Li, Z. Imbibition Behavior and Fluid Dynamic Distribution of Longmaxi Formation Shale in Pengshui Area. Chin. J. Comput. Phys. 2021, 38, 555–564. [Google Scholar]
  12. Yang, F.; Zuo, L.; Hu, Z.; Wu, G.; Wu, J.; Luo, L. Researching the Water Imbibition Characteristic of Shale by Experiment. Sci. Technol. Eng. 2016, 16, 63–66. [Google Scholar]
  13. Ye, H.; Ning, Z.; Wang, Q.; Cheng, Z.; Huang, L.; Mu, D. Spontaneous imbibition experiment and wettability of shale reservoir. Fault-Block Oil Gas Field 2019, 26, 84–87. [Google Scholar]
  14. Xiao, W.; Zhang, J.; Du, Y.; Zhao, J.; Zhao, Z. An Experimental Study on NMR Response Characteristics of Imbibition Subjected to Pressure in Shale. J. Southwest Pet. Univ. 2019, 41, 13–18. [Google Scholar]
  15. Duan, X.; Hu, Z.; Gu, Z.; Chang, J.; Shen, R.; Sun, W.; Mu, Y.; Zhou, G. Study on the production laws of shale gas in different occurrence states in the use of NMR online detection technology. Nat. Gas Ind. 2021, 41, 76–83. [Google Scholar]
  16. Deng, W.; Liang, T.; Yuan, S.; Zhou, F. Abnormal Phenomena and Mathematical Model of Fluid Imbibition in a Capillary Tube. Energies 2022, 15, 4994. [Google Scholar] [CrossRef]
  17. Zhu, W.; Zou, G.; Liu, Y.; Liu, W.; Pan, B. The Influence of Movable Water on the Gas-Phase Threshold Pressure Gradient in Tight Gas Reservoirs. Energies 2022, 15, 5309. [Google Scholar] [CrossRef]
  18. Lin, H.; Zhang, S.; Wang, F.; Pan, Z.; Mou, J.; Zhou, T.; Ren, Z. Experimental investigation on imbibition-front progression in shale based on nuclear magnetic resonance. Energy Fuels 2016, 30, 9097–9105. [Google Scholar]
  19. Xiao, L. MRI Logging, Rock MR, and Their Application; Science Press: Beijing, China, 1998. [Google Scholar]
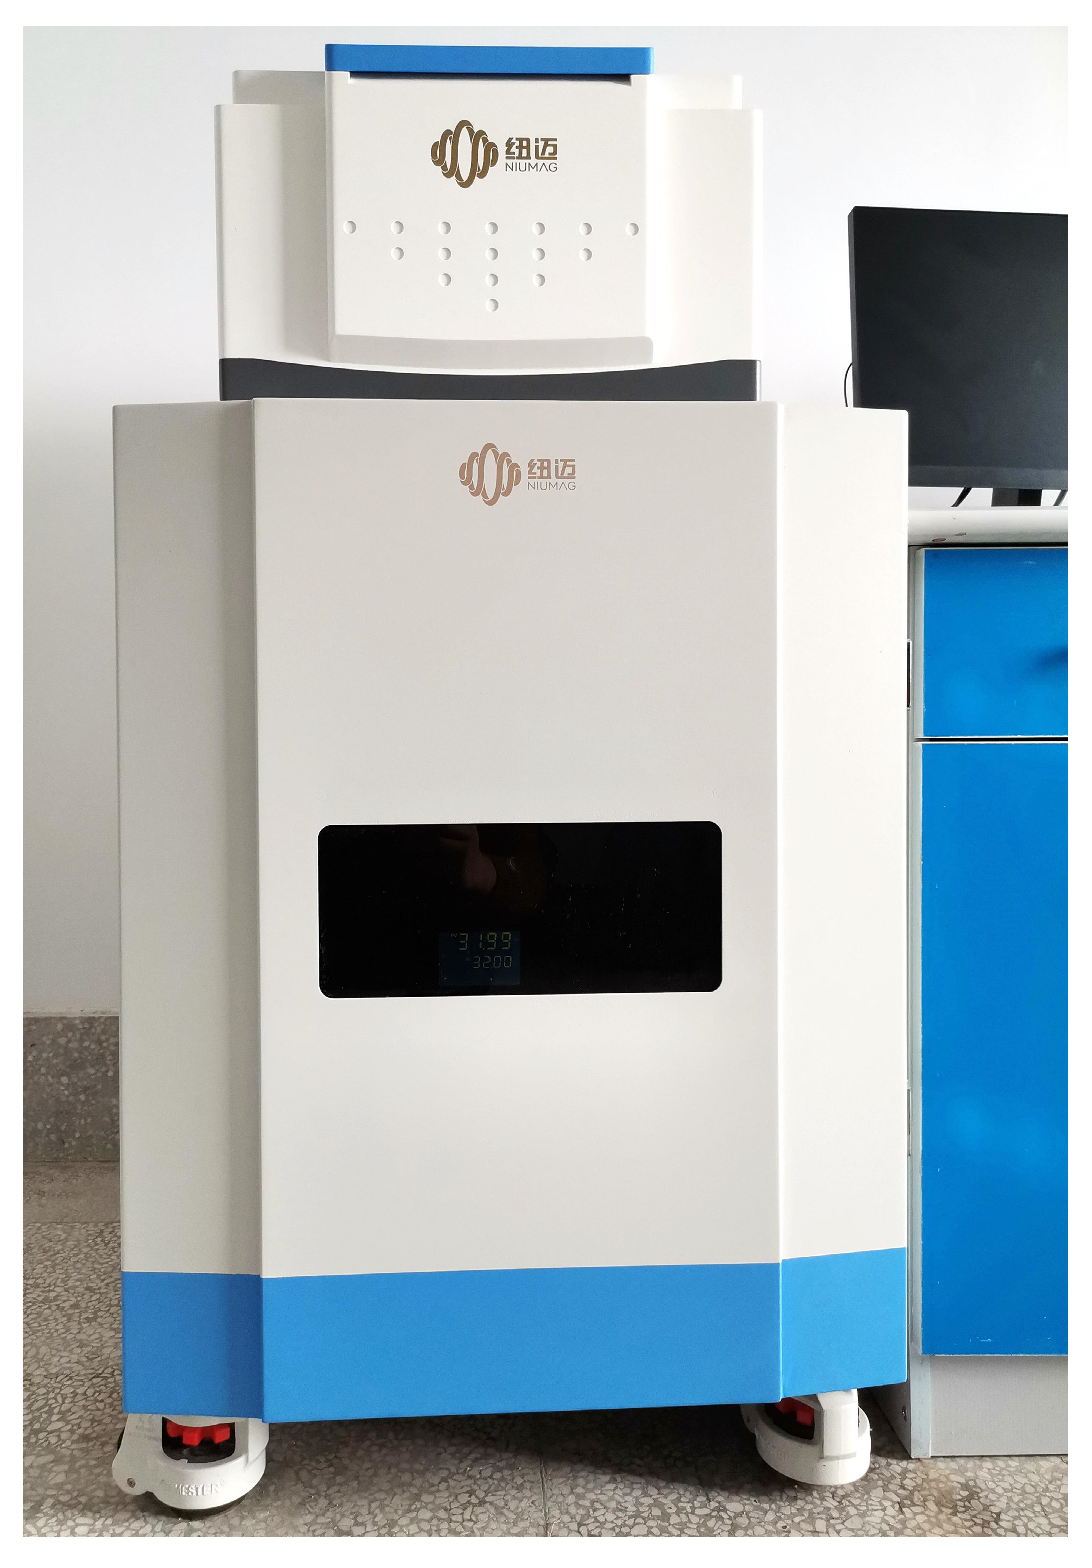
Figure 1. NMR analyzer.
Energies 15 06319 g001
Figure 2. Schematic layout of shale core imbibition experimental installation.
Energies 15 06319 g002
Figure 3. Imbibition recovery variations with time for different shale core samples.
Energies 15 06319 g003
Figure 4. T2 spectra of No.1-1 sample at different times.
Energies 15 06319 g004
Figure 5. Shale core imbibition at different fracture density.
Energies 15 06319 g005
Figure 6. Shale core imbibition at different salinities.
Energies 15 06319 g006
Figure 7. Shale core imbibition at different surfactant concentrations.
Energies 15 06319 g007
Figure 8. Shale permeability change in the process of flowback.
Energies 15 06319 g008
Figure 9. Comparison between initial permeability with post-flowback permeability.
Energies 15 06319 g009
Figure 10. The core before and after imbibition flowback (a) dry core; (b) end face of the core after flowback; (c) surface of the core after flowback.
Energies 15 06319 g010
Table 1. Core data and experimental program.
GroupCore No.Diameter
/cm
Length
/cm
Porosity
/%
Permeability
/10−3 μm2
Experimental Design
Group 1 (for the effect of fractures)1-12.495.023.920.0055No cracks
1-22.495.063.870.2320Artificial non-penetrating cracks
1-32.505.003.560.6284Artificial penetrating cracks
Group 2 (for the effect of formation water salinity)2-12.504.983.980.0078Simulated formation water salinity 60,000 ppm
2-22.505.084.250.0089water salinity 20,000 ppm
2-32.494.964.120.0092water salinity 6000 ppm
2-42.495.024.060.0084water salinity 0 ppm
Group 3 (for the effect of surfactant concentration)3-12.505.103.560.0046SDBS concentration 1000 ppm
3-22.505.033.740.0058SDBS concentration 100 ppm
3-32.495.063.780.0049SDBS concentration 10 ppm
Publisher’s Note: MDPI stays neutral with regard to jurisdictional claims in published maps and institutional affiliations.