Article

Effect of Tip Clearance on the Cavitation Flow in a Shunt Blade Inducer

1
School of Mechanical and Automotive Engineering, Zhejiang University of Water Resources and Electric Power, Hangzhou 310018, China
2
School of Mechanical and Engineering, Ningxia University, Yinchuan 750021, China
3
Key Laboratory of Fluid Transmission Technology of Zhejiang Province, Zhejiang Sci-Tech University, Hangzhou 310018, China
*
Author to whom correspondence should be addressed.
Energies 2022, 15(17), 6330; https://doi.org/10.3390/en15176330
Submission received: 11 August 2022 / Revised: 24 August 2022 / Accepted: 26 August 2022 / Published: 30 August 2022

Abstract

:
In order to study the effect of tip clearance on the internal cavitation stability of a shunt blade inducer, an external characteristics experiment of a centrifugal pump with a shunt blade inducer was carried out. Based on the turbulence model and mixture model, the cavitating flow in a centrifugal pump with the inducer was numerically simulated. The influence of tip clearance on the cavitating flow in a shunt inducer was studied and analyzed. Through the research, it was found that tip clearance has a certain influence on the critical cavitation coefficient. The existence of the tip clearance caused a significant leakage vortex near the inducer’s inlet and a strong transient effect was shown. The location and degree of cavitation caused by the tip leakage are clarified in this paper. Tip clearance has a great impact on the pressure distribution on a shunt blade inducer. The influence law of tip clearance on an inducer’s blade load distribution was clarified. The results showed that tip clearance has a significant effect on the cavitation of a shunt blade inducer under low flow rate conditions.

1. Introduction

There are many types of inducer structures, and a large number of studies have shown that equipping an inducer can improve the cavitation resistance of a centrifugal pump [1,2,3,4]. As a new structure of an inducer, the type of shunt blade inducer has good cavitation resistance [1,2,5]. There is a certain tip clearance (TC) between the inducer and the pipe’s wall. Much research [6,7,8,9,10,11,12,13] about impellers’ tip clearances has been carried out but there has been little research on inducers’ TCs, especially on shunt blade inducers. The existence of tip clearance has a certain impact on the cavitation of the inducer. Parikh T. et al. [14] used the multi-objective optimization method to discuss the influence of the geometric parameters of the inducer on the flow characteristics and performance in order to find an optimal geometric structure of an inducer. The results showed that the TC and blade thickness should be kept at low values to achieve better hydraulic performance. Xiaomei Guo et al. [5] found that TC has a certain impact on the location and severity of the inducer cavitation. In order to study the influence of TC on the cavitation characteristics in the inducer of a turbo pump, Xiang, Le et al. [15] carried out visual experimental research. The results showed that if the TC is too large, it will reduce the non-cavitation and cavitation performances significantly. In order to study the influence of TC on the internal cavitation characteristics of the inducer, Suke et al. [16] carried out a numerical simulation of the internal flow field of a high-speed inducer centrifugal pump under three different TCs. The results showed that properly increasing the TC had little effect on the head and efficiency of the pump, but it weakened the wall jet, which improved the inlet pressure distribution of the inducer blade and its cavitation performance. Karakas es et al. [17] studied the effect of an inducer’s TC on the cavitation and non-cavitation performances of a centrifugal pump. Through the research, it was found that with the increase in the inducer’s TC, there was excessive back leakage and large eddy current recirculation at the tip of the inducer. This led to pressure loss in the inducer, which reduced the cavitation performance. It was also found that TC had little effect on the non-cavitation performance of the pump. Kim, Changhyun et al. [18] conducted numerical and experimental studies on cavitation flow in turbo pumps under four TCs. The results showed that under the condition of cavitation, the inducer with a large TC was vulnerable to low suction pressure and there was floating between the inducer blades, which aggravated the degree of the cavitation. Campos Amezcu R. et al. [19] believed that TC had a great impact on an inducer’s cavitation. Kim S. et al. [20] studied the influence of TC on the performance and flow characteristics of a turbine pump inducer. The results showed that when the TC was large, the backflow went deep upstream, causing the performance of the pump to decline rapidly. When the TC was small, the range of the backflow decreased but the blockage phenomenon also led to a performance decline. Yanxia F et al. [21] studied the influence of TC on its internal flow and hydraulic performance. The results showed that the induced wheel structure with appropriate TC size has high pressure and hydraulic efficiency. Unsteady tip leakage cavitating flow generated by a straight NACA0009 hydrofoil was studied numerically by Huaiyu Cheng et al. [22,23,24] using the LES method combined with the Schnerr–Sauer cavitation model. The team also proposed a new control method for tip-leakage vortex (TLV) cavitation. This method, which combined the effects of grooves and winglets, was made of overhanging grooves (OHGs) fitted at the tip of a hydrofoil. The results showed that OHGs can effectively inhibit TLV cavitation. The Lagrangian coherent structures (LCSs) obtained from the numerical results indicated that the TLV cavitation significantly influenced the local flow patterns.
In summary, the effect of TC on an inducer’s cavitation performance has been researched by some researchers and it was found that TC has a certain impact on the cavitation performance of an inducer. However, there are few reports on the influence of a shunt inducer’s TC on the stability of cavitation flow and the value range of TCs. We have accumulated some research on the influence of a shunt blade inducer’s TC on its performance and found that TC has a more significant effect on the cavitation phenomenon and influence of a high-speed inducer under low flow rate conditions [5]. Therefore, in order to obtain the best range of a shunt blade inducer’s TC, relevant research on the influence of TC on the internal cavitation flow instability of a shunt blade inducer under low flow rate conditions is carried out in this paper. The cavitation mechanism of the TC leakage vortex is clarified.

2. Structure and Main Parameters of a Shunt Blade Inducer

2.1. Main Parameters of a Pump and a Shunt Blade Inducer

In order to improve the cavitation resistance of a high-speed centrifugal pump, a shunt blade inducer is equipped in front of the impeller. The structural form of the centrifugal pump, including the inducer, is shown in Figure 1. The specific parameters of the pump are listed in Table 1.

2.2. The Test System

The closed test-bed and test systems of the high-speed inducer centrifugal pump are shown in Figure 2. In this test system, the pump was installed in the test system horizontally.

3. Analysis of the External Characteristics Test and the Numerical Calculation Results

In order to ensure the reliability of the numerical calculation results, the external characteristics experiment and numerical calculations for a high-speed inducer centrifugal pump with TC = 0.5 mm were carried out, and the external characteristics curve was obtained through experiments and simulations (Figure 3).
The results obtained from Figure 3 are as follows: (1) From the η-Q curves, it can be seen that the numerical results are consistent with the experimental results. The maximum relative error is 2.3%. (2) From the H-Q curves, it can be seen that the numerical calculation results are consistent with the experimental results and the maximum relative error is about 0.7%. This paper focused on the cavitation flow in the induced wheel under low flow conditions. For Q = 3 m3/h and TC = 0.5, the relative error of head is about 0.30% and the relative error of efficiency is about 2.01%. In conclusion, the numerical calculations can be used to predict the experimental results and the numerical calculation results in this paper are reliable.

4. Numerical Calculation Method

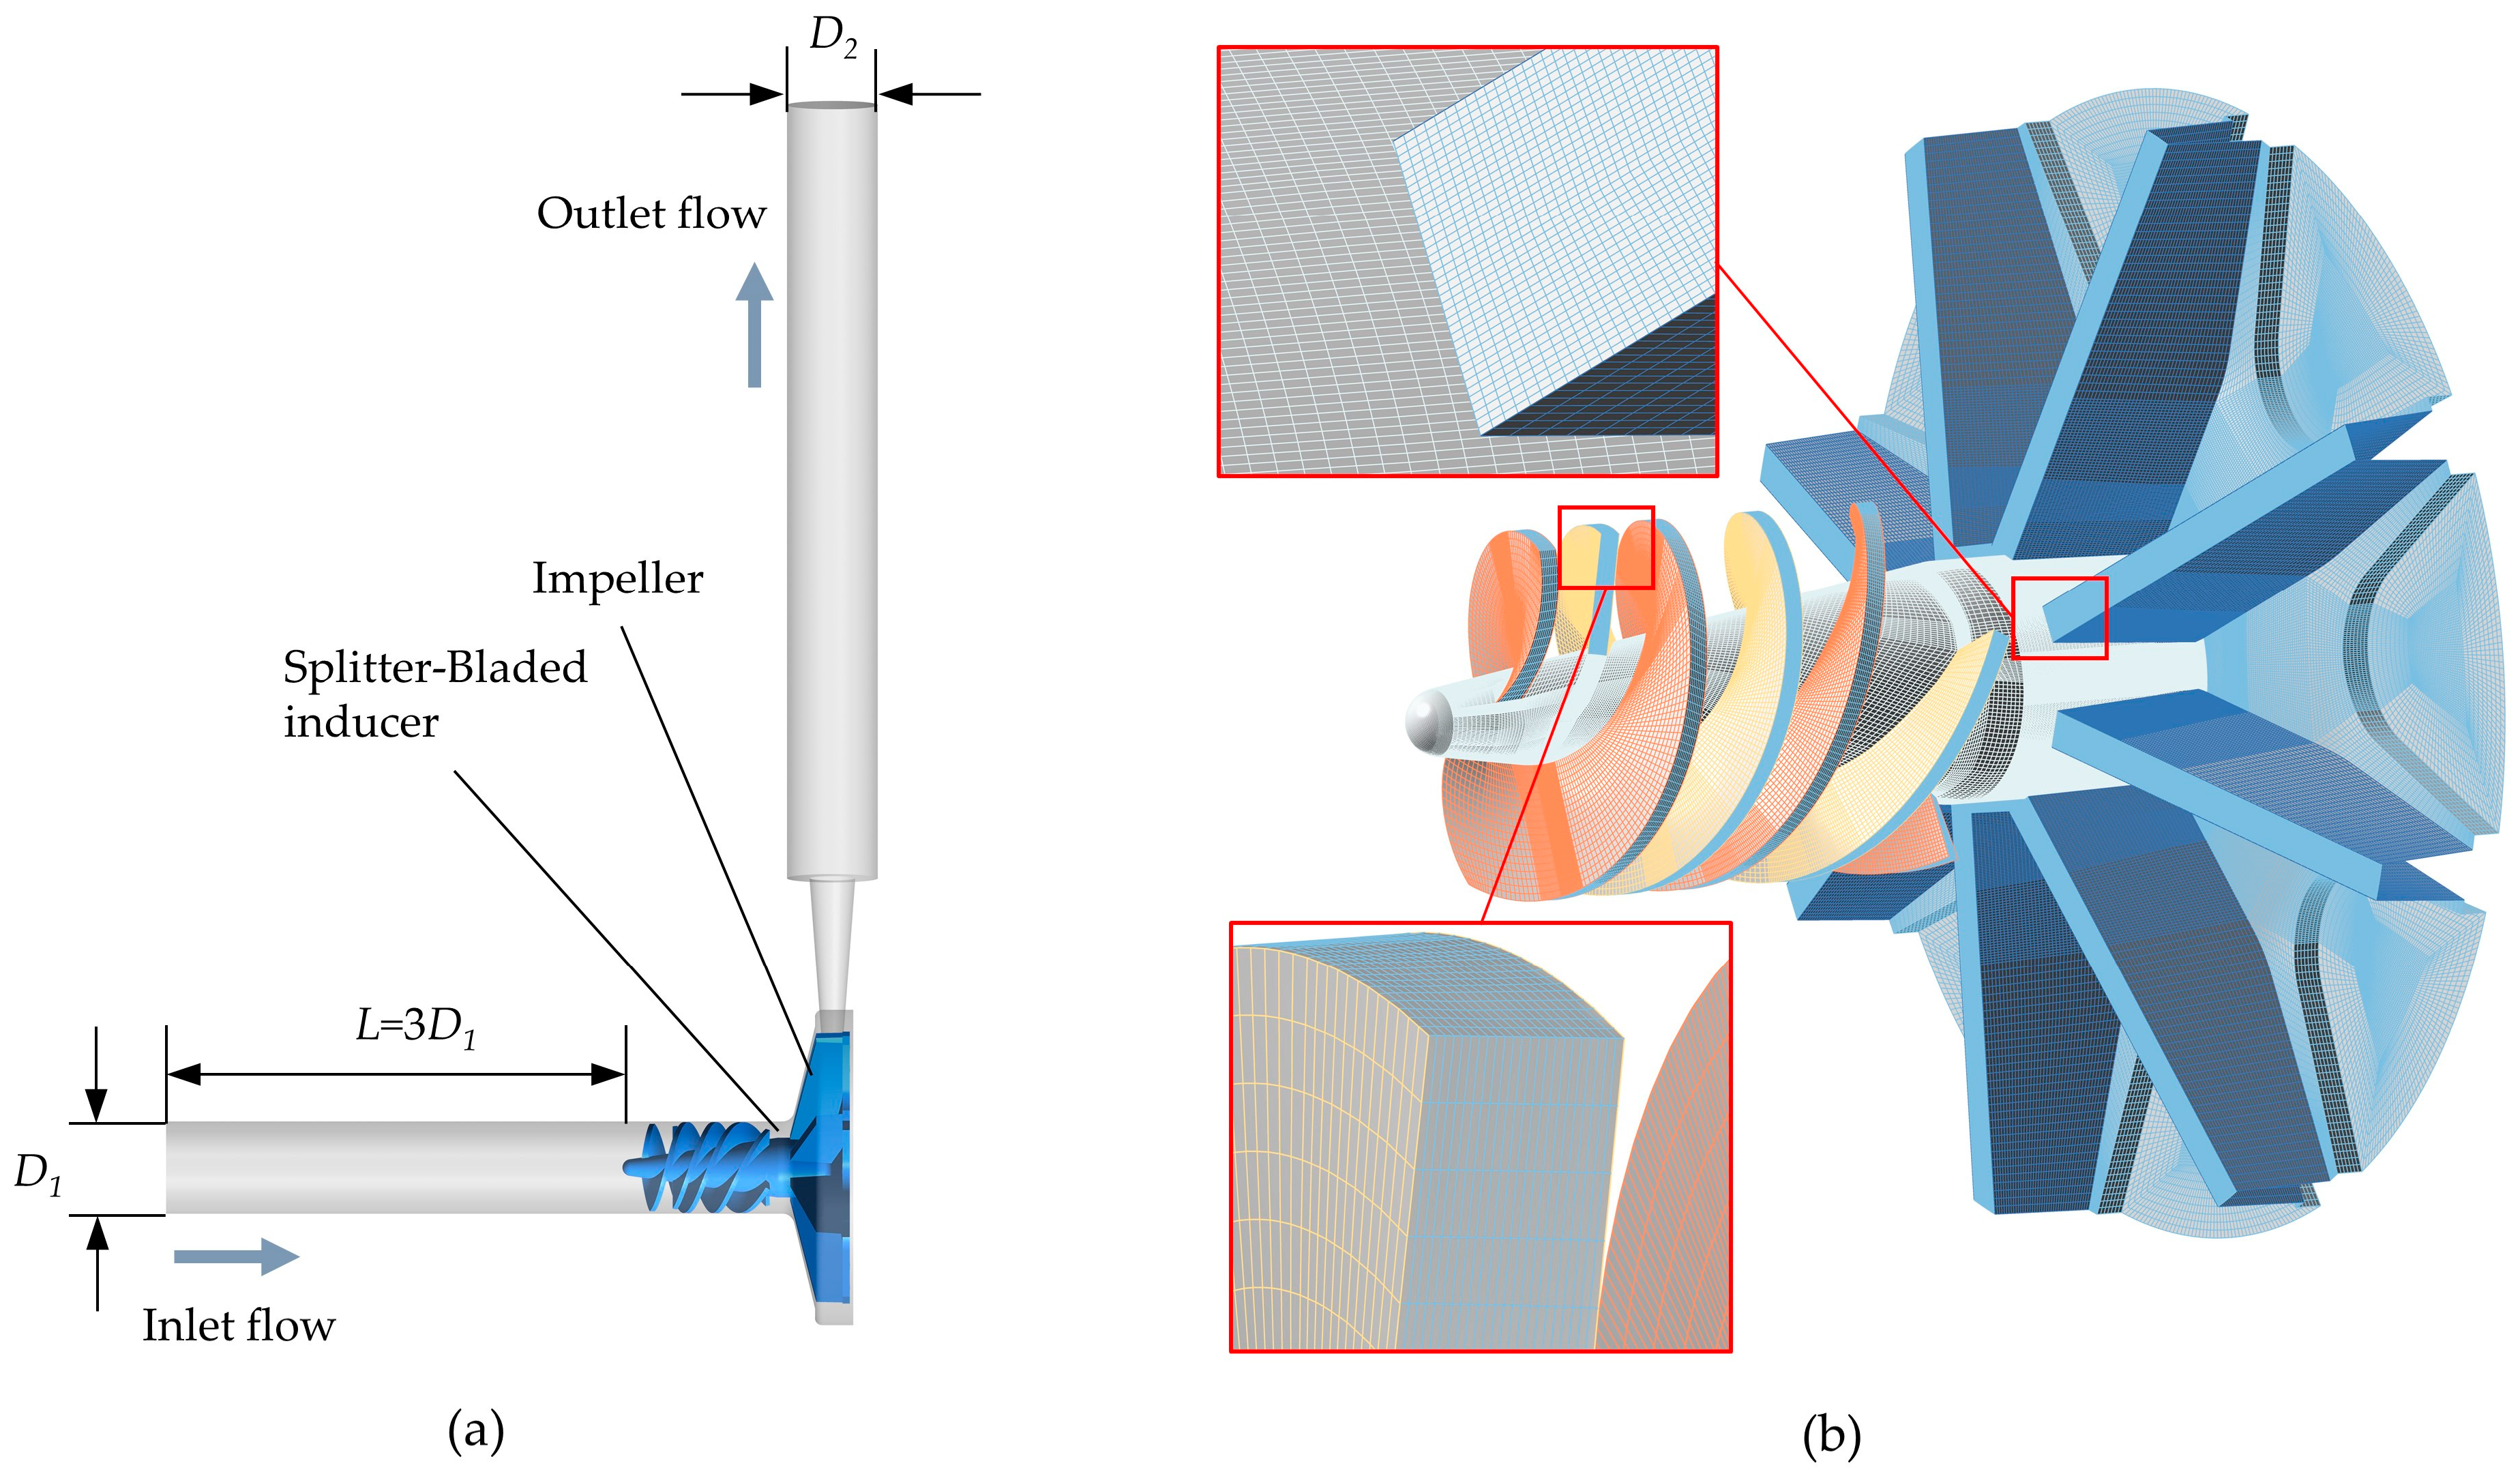
4.1. Computational Region and Verification of Grid Independence

The whole flow field’s three-dimensional calculation area is shown in Figure 4a. The simulation liquid area includes the inlet pipeline (the length is 3 times that of the inlet diameter), shunt blade inducer, main impeller, volute, and other flow-passing components. In order to improve the accuracy of the simulation, structured grids are plotted both in the impeller and the shunt inducer. The total grid of the pump is 9.15 million. The shunt blade inducer’s grids are shown in Figure 4b. Its grid independence was verified in the previous paper [5].

4.2. Boundary Conditions

In this paper, the computational fluid dynamics (CFD) software ANSYS-CFX version 18.0 [25] is used to numerically simulate the different operating conditions of centrifugal pumps. The inlet is defined as a pressure inlet with the value 15,590 Pa and the outlet is defined as the mass flow outlet. No slip boundary condition is specified for the wall. All components except for the induced wheel and impeller rotor components are set to the static region, and the speed is set to n = 6000 r/min. The constant calculation convergence accuracy is 10−4. Under cavitation conditions, the inlet liquid volume fraction is set as 1 and the bubble is set as 0. The calculation results of the non-cavitation flow field are taken as the initial value of the cavitation flow field calculation, and the cavitation calculation is completed by changing the total inlet pressure.

4.3. Turbulence Model

The RNG model was developed using the Re-Normalization Group (RNG) method to renormalize the Navier–Stokes equations to account for the effects of smaller scales of motion. The RNG k-ε turbulence model is based on the standard k-ε turbulence model, and the turbulence dissipation rate ε equation is modified, so that the theory is more comprehensive and the scope of application is wider.
The RNG k-ε turbulence model [26] becomes
ρ k t + ρ u i k x i = x i ( ( μ + μ t σ k ) k x i ) + μ t u i x j ( u i x j + u j x i ) ρ ε
ρ ε t + ρ u k ε x k = x k ( ( μ + μ t σ ε ) ε x k ) + C 1 ε ε k μ t u j x j ( u i x j + u j x i ) C 2 ε ρ ε 2 k
and
μ t = C μ ρ k 2 ε
where k is the turbulent kinetic energy; ε is the turbulent kinetic energy dissipation rate; ρ is the fluid density; xi, xj are the coordinate components; and μ is the dynamic viscosity coefficient. The model constants are Cμ = 0.0845, C = 1.24, C = 1.68, σk = 0.72, and σε = 0.75 [25].

4.4. Cavitation Model

During simulation, the Reynolds average N-S approach and Mixture model are used in this work. The two phases are referred to as water and vapor [1,2]. The equations of the continuity and momentum conservation used here are
ρ t + x j ( ρ u j ) = 0
t ( ρ u j ) + x j ( ρ u i u j ) = P x i + x j ( μ u i x j )
ρ = α w ρ w + α v ρ v
where w, v, and ρ indicate the liquid water, vapor, and density. The volume fraction equation for the vapor phase is
t ( α v ρ v ) + x i ( α v ρ v u ) = x i ( α v ρ v u d r , v )
U is the mass-averaged mixture velocity and udr,v is the vapor phase drift velocity. They are defined below:
u = α w ρ w u w + α v ρ v u v ρ
u d r , v = ( ρ ρ v ) d v 2 18 μ c f [ g ( u v u v ) ] 1 ρ i = 1 n a i ρ i u w i
In which n is the phase number, and in this case, n = 2. ai is the volume fraction of the i phase in which f is given as below:
f = { 1 + 0.05 R e 0.687 , R e < 1000 0.018 R e , R e 1000
In this case, the Reynolds number (Re) value is 29,713.

5. Prediction of the Cavitation Performance and Analysis of the Numerical Calculation Results

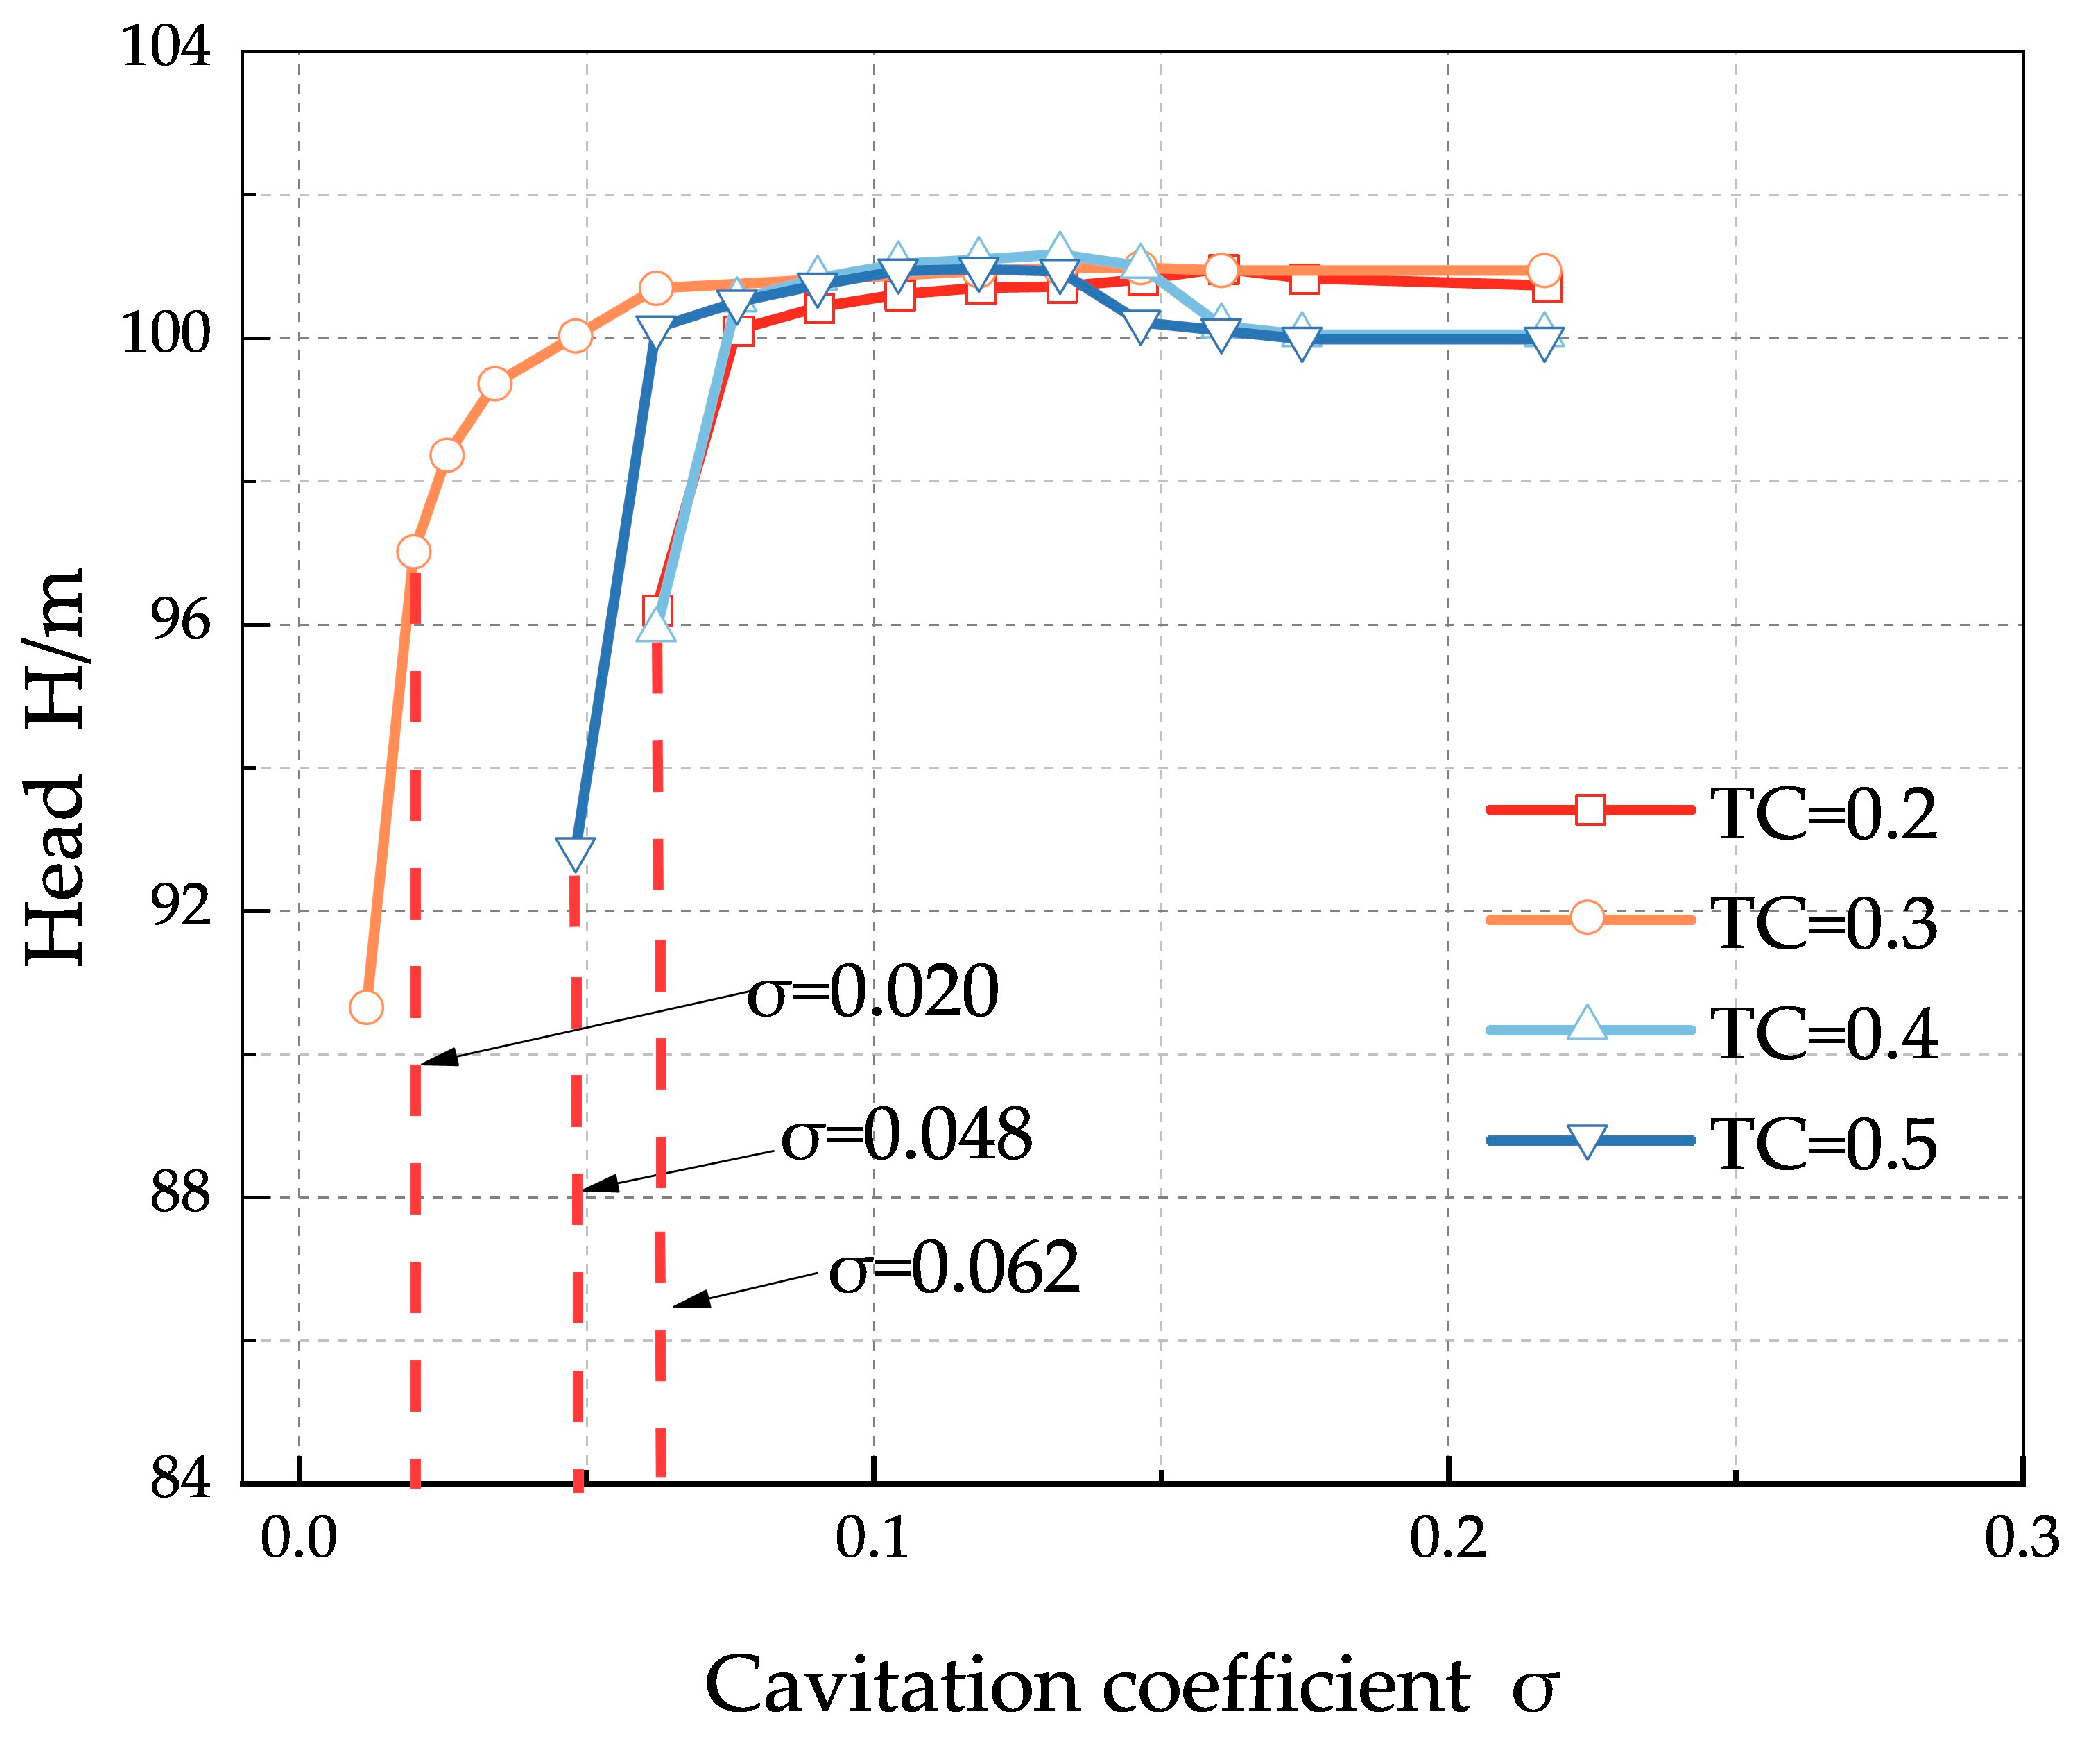
5.1. Cavitation Performance Curve of the Centrifugal Pump with the Shunt Blade Inducer under Different TCs

The cavitation performance of the high-speed inducer centrifugal pump under different TCs is evaluated by continuously reducing the inlet cavitation coefficient. The cavitation performance is evaluated by observing the sudden drop point of the centrifugal pump’s head. The cavitation coefficient is defined as
σ = p i n p v 0.5 ρ V t i p 2
where pv refers to the saturated vapor pressure corresponding to the incoming flow temperature, Pa. pin refers to the inlet pressure of the centrifugal pump, Pa. ρ refers to the density of the liquid, kg/m3, and Vtip refers to the tangential velocity of the inducer blade tip in m/s.
Figure 5 is the cavitation performance curves of the centrifugal pump under different TCs obtained by numerical calculations under designed working conditions.
It can be seen in Figure 5 that TC has a certain influence on the value of the critical cavitation coefficient. The larger the TC, the greater the leakage loss of the top gap. With the increase in TC, the head decreases, and the critical cavitation point advances. In this case, TC = 0.3 is the best value. When σ ≥ 0.062, the head of the pump does not break under every TC. When the head drops by about 3% suddenly, critical cavitation occurs. The critical cavitation coefficients are shown in Table 2.
It can be seen that the cavitation performance is best when TC = 0.3 mm, whereas the cavitation performance is worst when TC = 0.2. The cavitation performance in this study does not deteriorate with the increase in TC but there is an optimal value, which is consistent with previous studies [5,15,19].

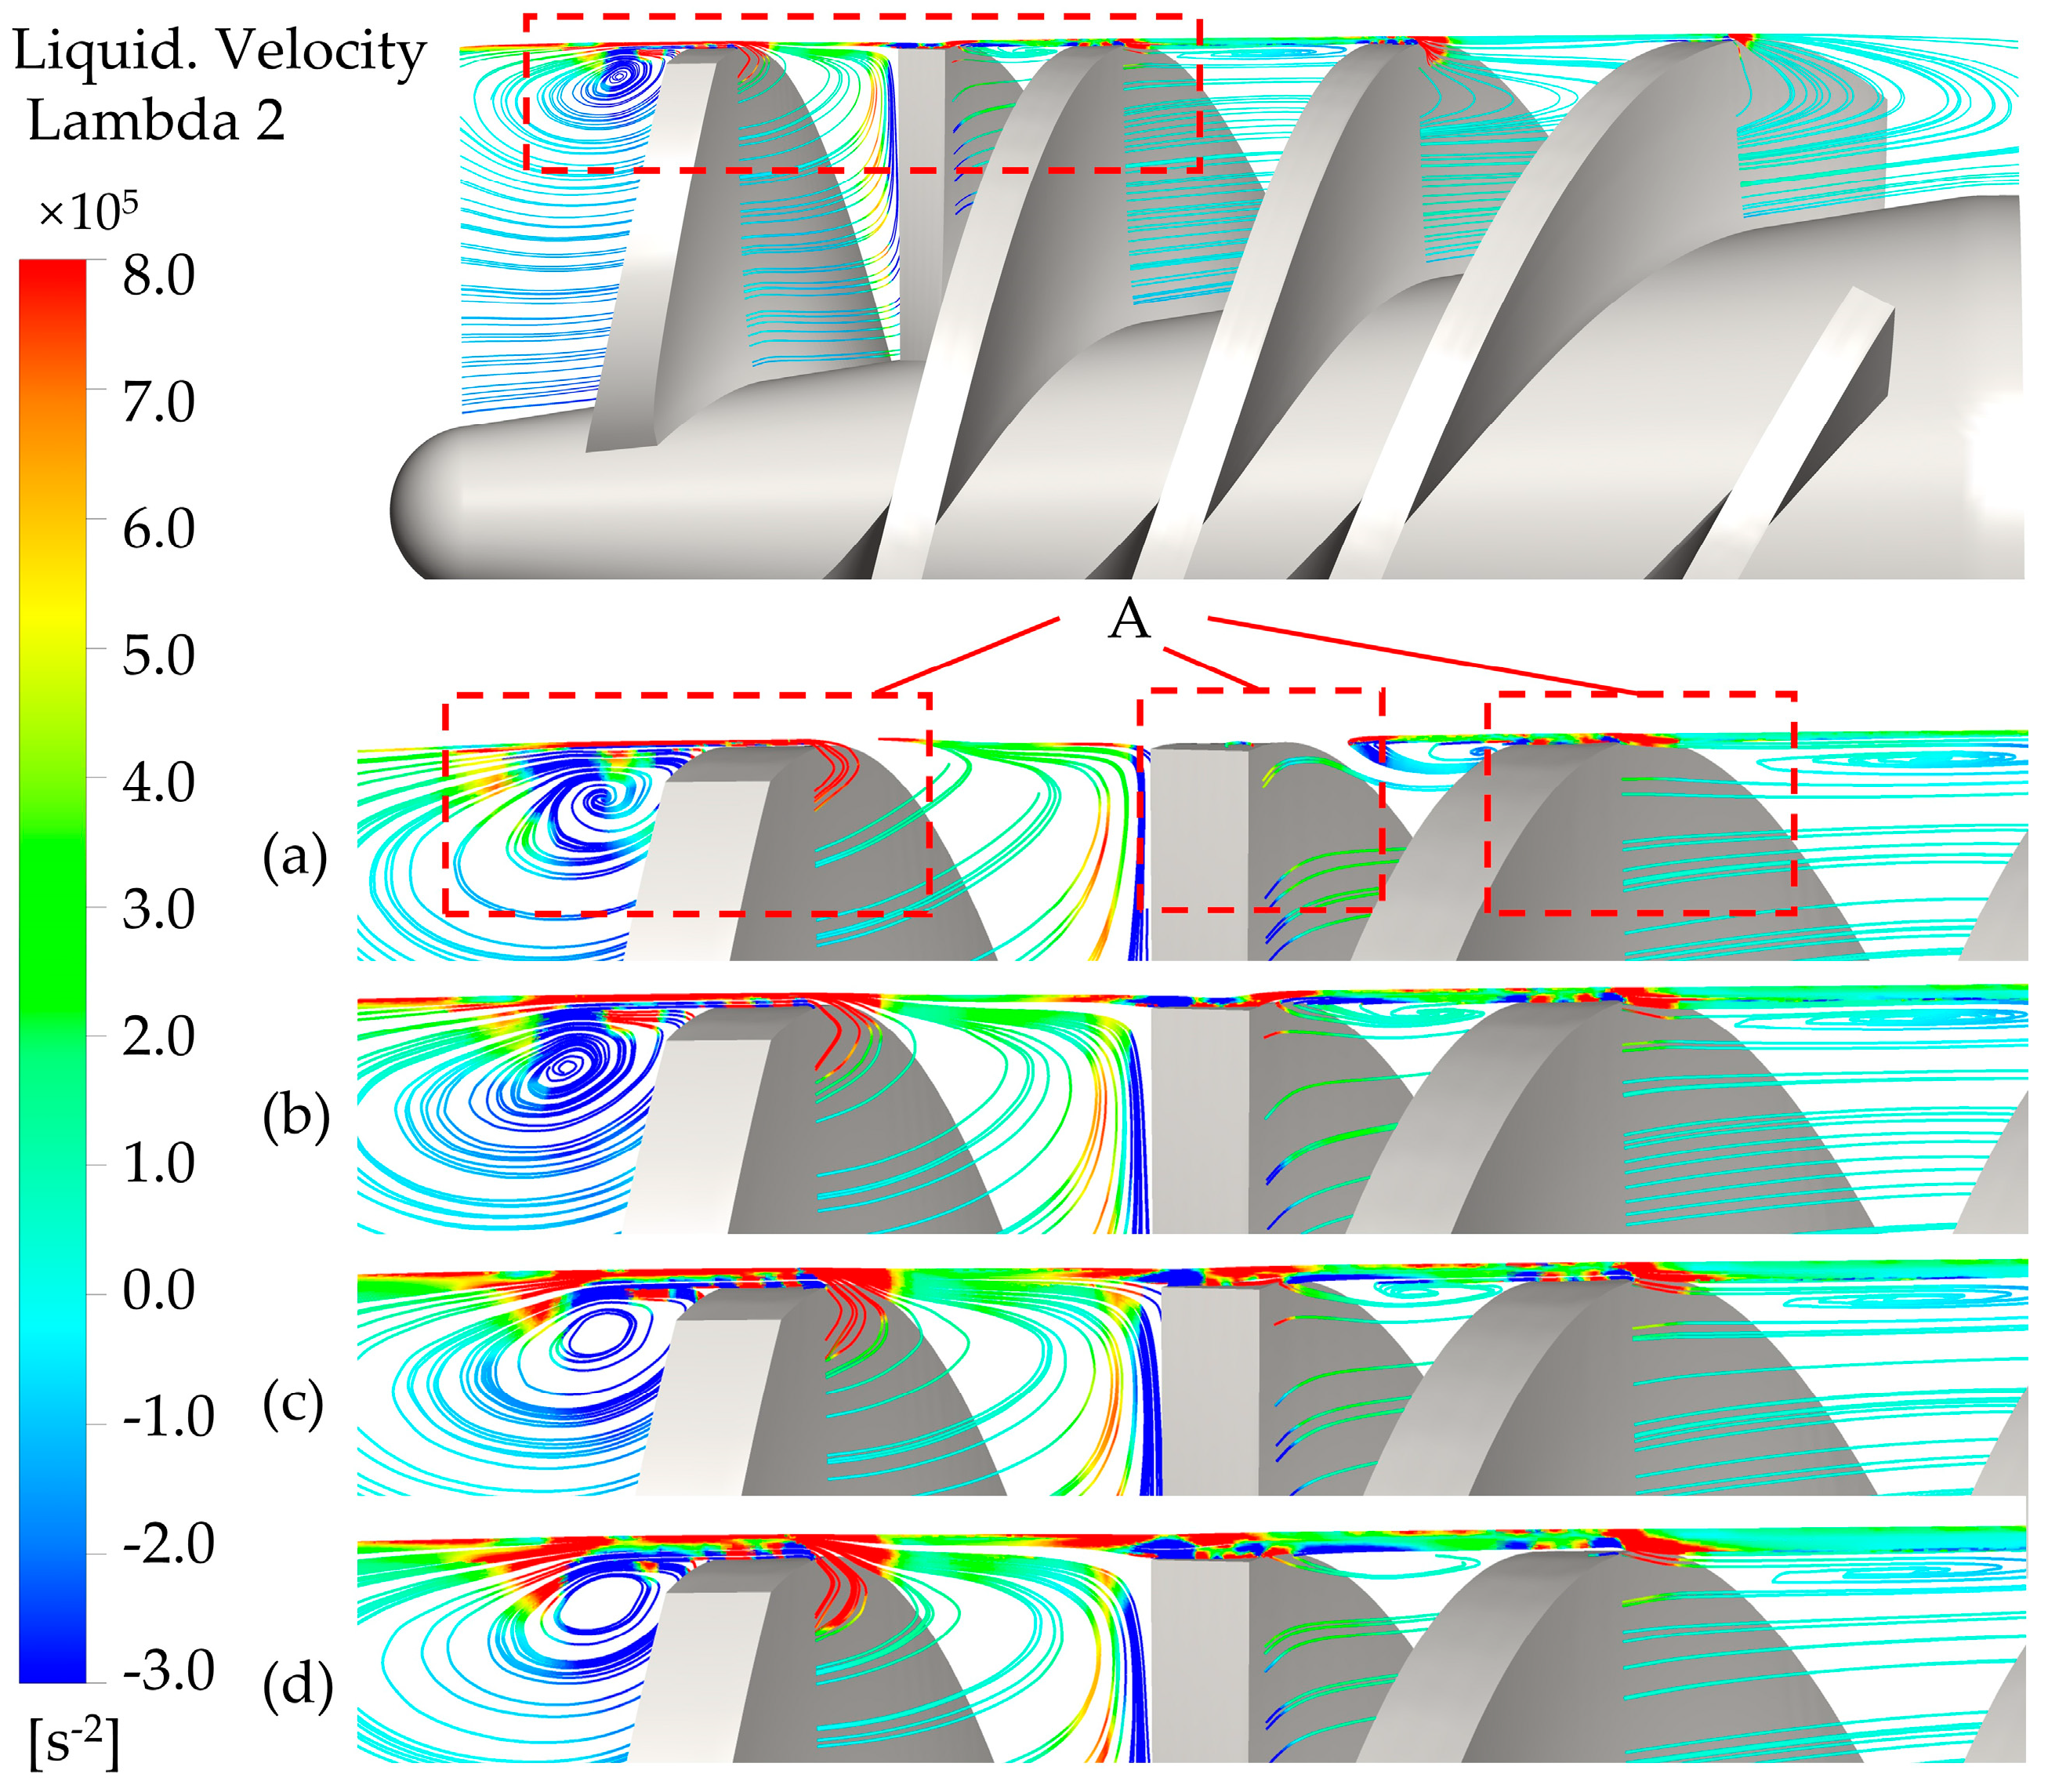
5.2. Tip Leakage Vortex in the Inducer with Different TCs under Small Flow Rate Conditions

The generation and movement mechanism of the tip leakage vortex is an important factor affecting the cavitation performance of an inducer so it is necessary to study the tip leakage vortex shape and internal fluid streamline in the inducer. In this paper, a 0.75 Qd work condition is selected for analysis. Figure 6 is the shape diagram of the tip leakage vortex on the cross-section of the inducer with different TCs under low flow rate conditions of 0.75 Qd; Figure 7 is a flow line diagram of the inducer at 0.75 Qd with TC = 0.3 mm at different phase angles.
In Figure 6a–d it can be seen that there is a high-speed leakage flow at the rim of the inducer blade near the inlet of the inducer (area A of Figure 6), and the leakage flow interacts with the mainstream in the inducer to form a significant leakage vortex on the suction surface of the blade. Leakage vortexes mainly occur at the inlet rims of long blades and short blades. The numerical calculations show that the development of the vortex cavitation at the top of the leaf leaks significantly affects the vortex volume distribution [23]. In Figure 6a–d it can be seen that with the increase in TC, the leakage volume increases, which leads to the gradual expansion of the formed leakage vortex volume. It can be seen that the existence of the TC produces a significant leakage vortex at the inlet of the inducer and the energy of the leakage vortex increases with the increase in the TC.
The research results show that the tip leakage vortex cavitation has a certain influence on the local flow pattern [24]. It can be seen in Figure 7 that the tip leakage vortex formed by the suction surface at the inlet of the long blade is significantly larger than that at the inlet of the short blade. With the rotation of the inducer, the leakage vortex will move toward the inlet of the inducer and gradually increase, showing a significant transient effect. There is also a weak leakage vortex in the middle and rear channels of the inducer but its movement is affected by the fluid flow in the inducer and gradually approaches the exit of the inducer.

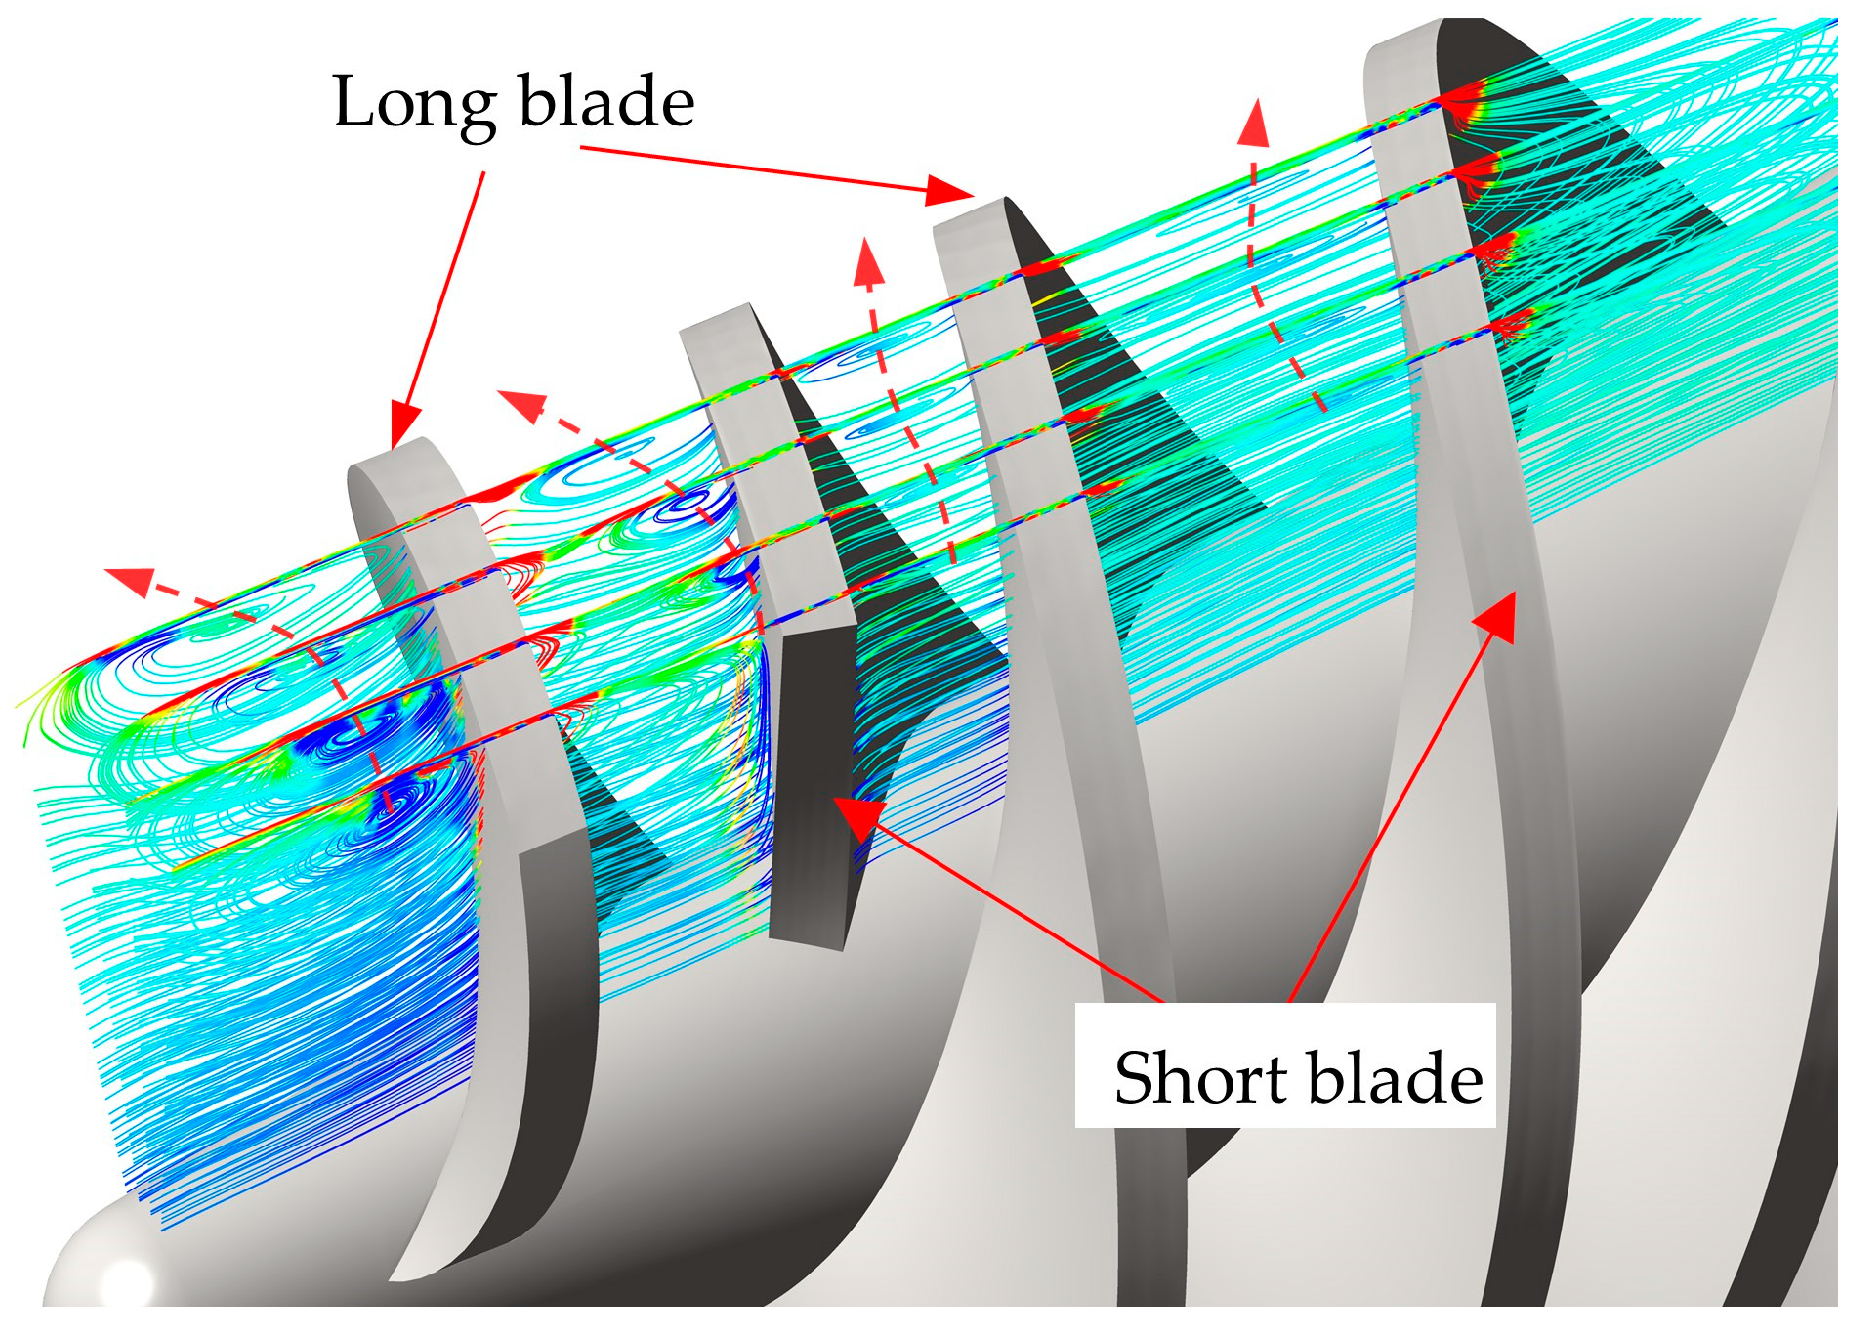
5.3. Cavitation Evolution Process Diagram of Long and Short Blades near Rim Region

In order to better analyze the cavitation evolution process in the inducer’s rotation channel, the dimensional blade height coefficient R* is defined as
R * = R R h R s R h
where R is the radius of the blade height, Rh is the hub radius at the outlet side of the inducer, and Rs is the radius of the inducer’s outlet rim.
Through the numerical calculation, the evolution process of cavitation at 0.9 R* under different cavitation coefficients is obtained, which is shown in Figure 8.
The conclusions obtained from Figure 8 are as follows: (1) Cavitation mainly occurred on the suction side of the inlet end of the long blade, which is close to the leakage vortex position of the inducer in Figure 6. (2) Under the same TC, the cavitation area increased and the cavitation degree deepened with the decrease in σ. (3) As can be seen in Figure 8a, when TC = 0. 2 mm and σ = 0.062, the head of the centrifugal pump dropped by 3%, which is the critical cavitation point. It was found that there was an obvious cavitation zone in the inducer. (4) Comparing the cavitation degrees from Figure 8a–d, it can be seen that the cavitation region was smaller when TC = 0.3 mm. The cavitation area was the largest when TC = 0.2 mm. When TC = 0.5 mm and σ = 0.048, the cavitation volume occupied nearly 1/3 of the area of the long blade, and the cavitation phenomenon also occurred at the front end of the short blade to a certain extent.

5.4. Load Distribution on the Inducer’s Blades at Different Blade Heights

Figure 9 is the pressure distribution on the inducer’s blades at different blade heights (R*) at TC = 0.3 mm.
In order to better analyze the cavitation evolution process in the rotation channel, the dimensional blade length coefficient L* is defined as
L * = l L ,   ( 0 L * 1 )
where L is the leaf expansion length and l is the length of the blade expansion at a point.
It can be seen in Figure 9 that the pressure distribution on the blade shows a similar distribution law under different R*. With the decrease in R*, the pressure value on the blade decreases continuously, which shows that the inducer mainly relies on the rim to do the work. At the same time, the lower the R*, the smaller the pressure difference between the two blades due to the influence of the impeller phase angle.

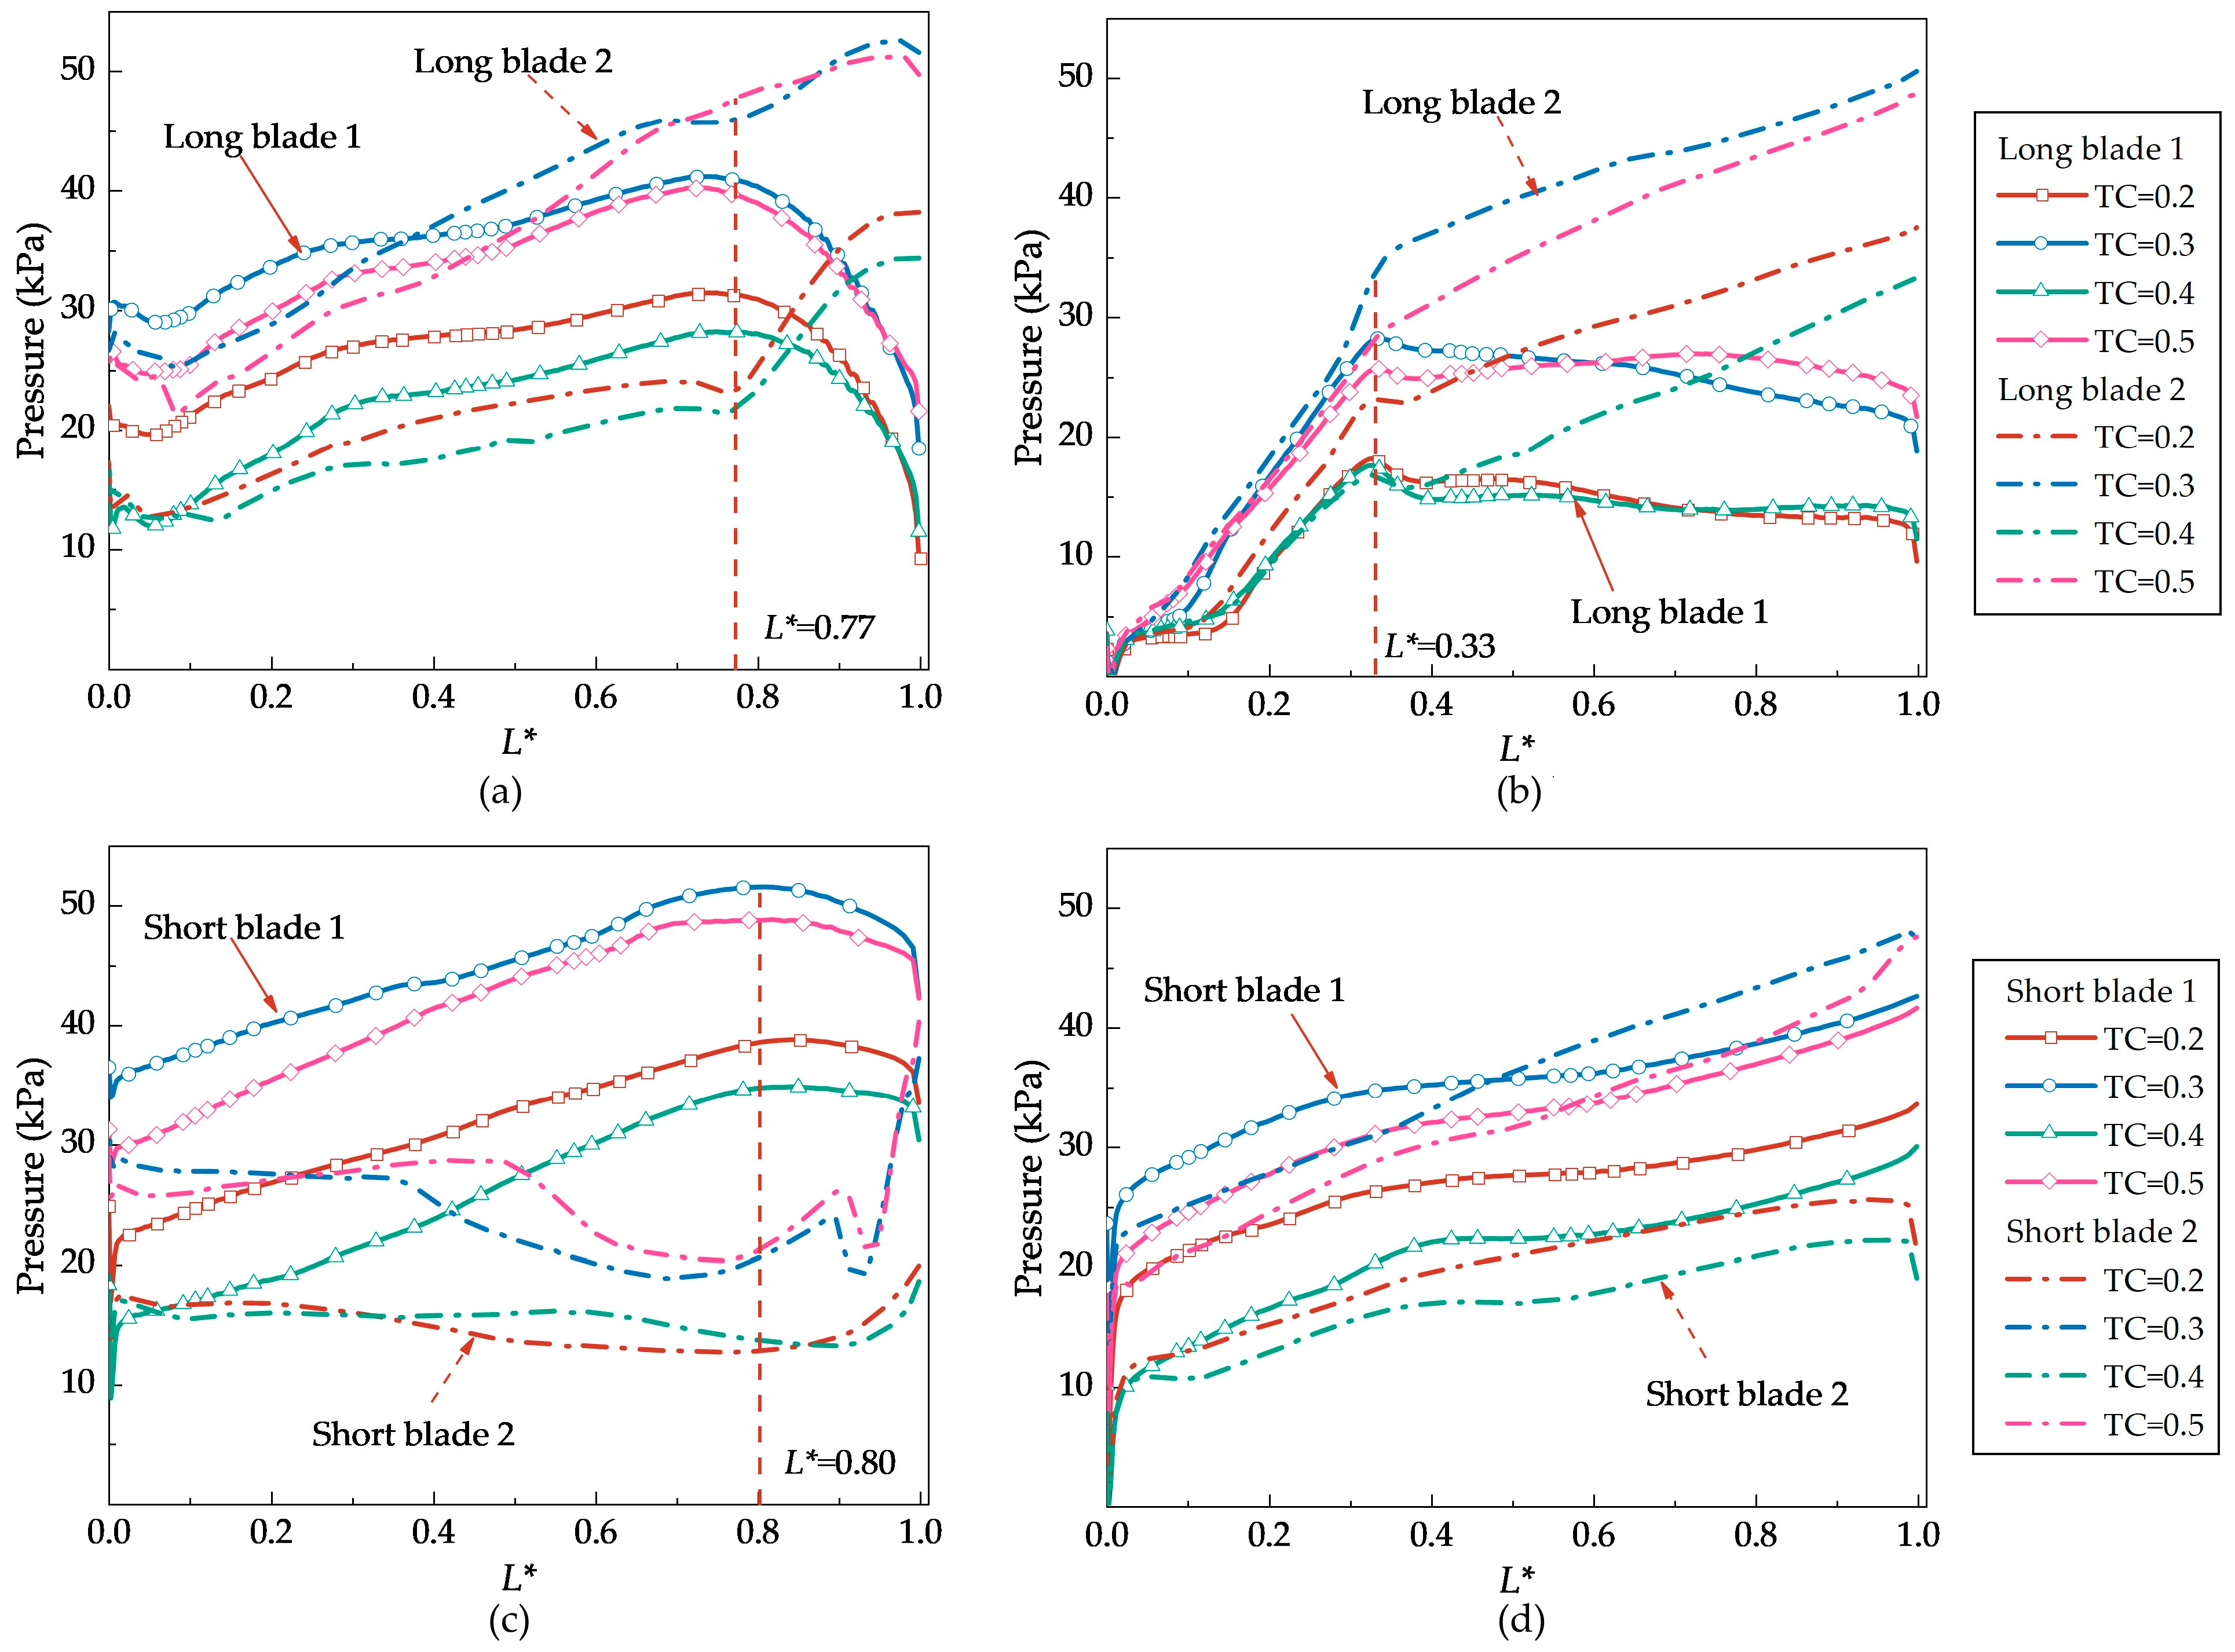
5.5. Effect of TC on Load Distribution of the Long and Short Blades

For further deep analysis, the blade load of the inducer is calculated at R* = 0.9 when σ = 0.062. Figure 10 shows the pressure distribution of the long and short blades’ surfaces along L* under different TCs.
The conclusions obtained from Figure 10 are as follows: (1) The pressure on the blade increased with the increase in L* and the blade surface pressure was the largest when TC = 0.3mm, which shows good cavitation performance. (2) When L* < 0.77, the pressure on the pressure surfaces of the two long blades kept rising synchronously. After L* > 0.77, the pressure on the pressure surface of the two long blades differentiated. Under the influence of cavitation at the root of the impeller, the pressure value of blade1 decreased rapidly, whereas the pressure value at blade 2 increased rapidly. (3) On the suction surface of the long blades, due to the existence of cavitation, the initial pressure value was 0, then gradually increased and kept rising synchronously when L* < 0.33. When L* > 0.33, the suction surface pressure differentiated, the blade1 pressure decreased, and the blade 2 pressure increased, which was mainly affected by the entry of the cavitating gas phase at the root of the impeller into the inducer. (4) The pressure on the pressure surface of the short blades was significantly affected by the phase angle. When L* = 0.8, the pressure difference between the two blades reached an extreme value. The pressure on the suction surface of the short blades rose steadily with the axial position of the blades and its pressure was less affected by the phase angle. In conclusion, TC has a great influence on the pressure distribution on the blades of an inducer.

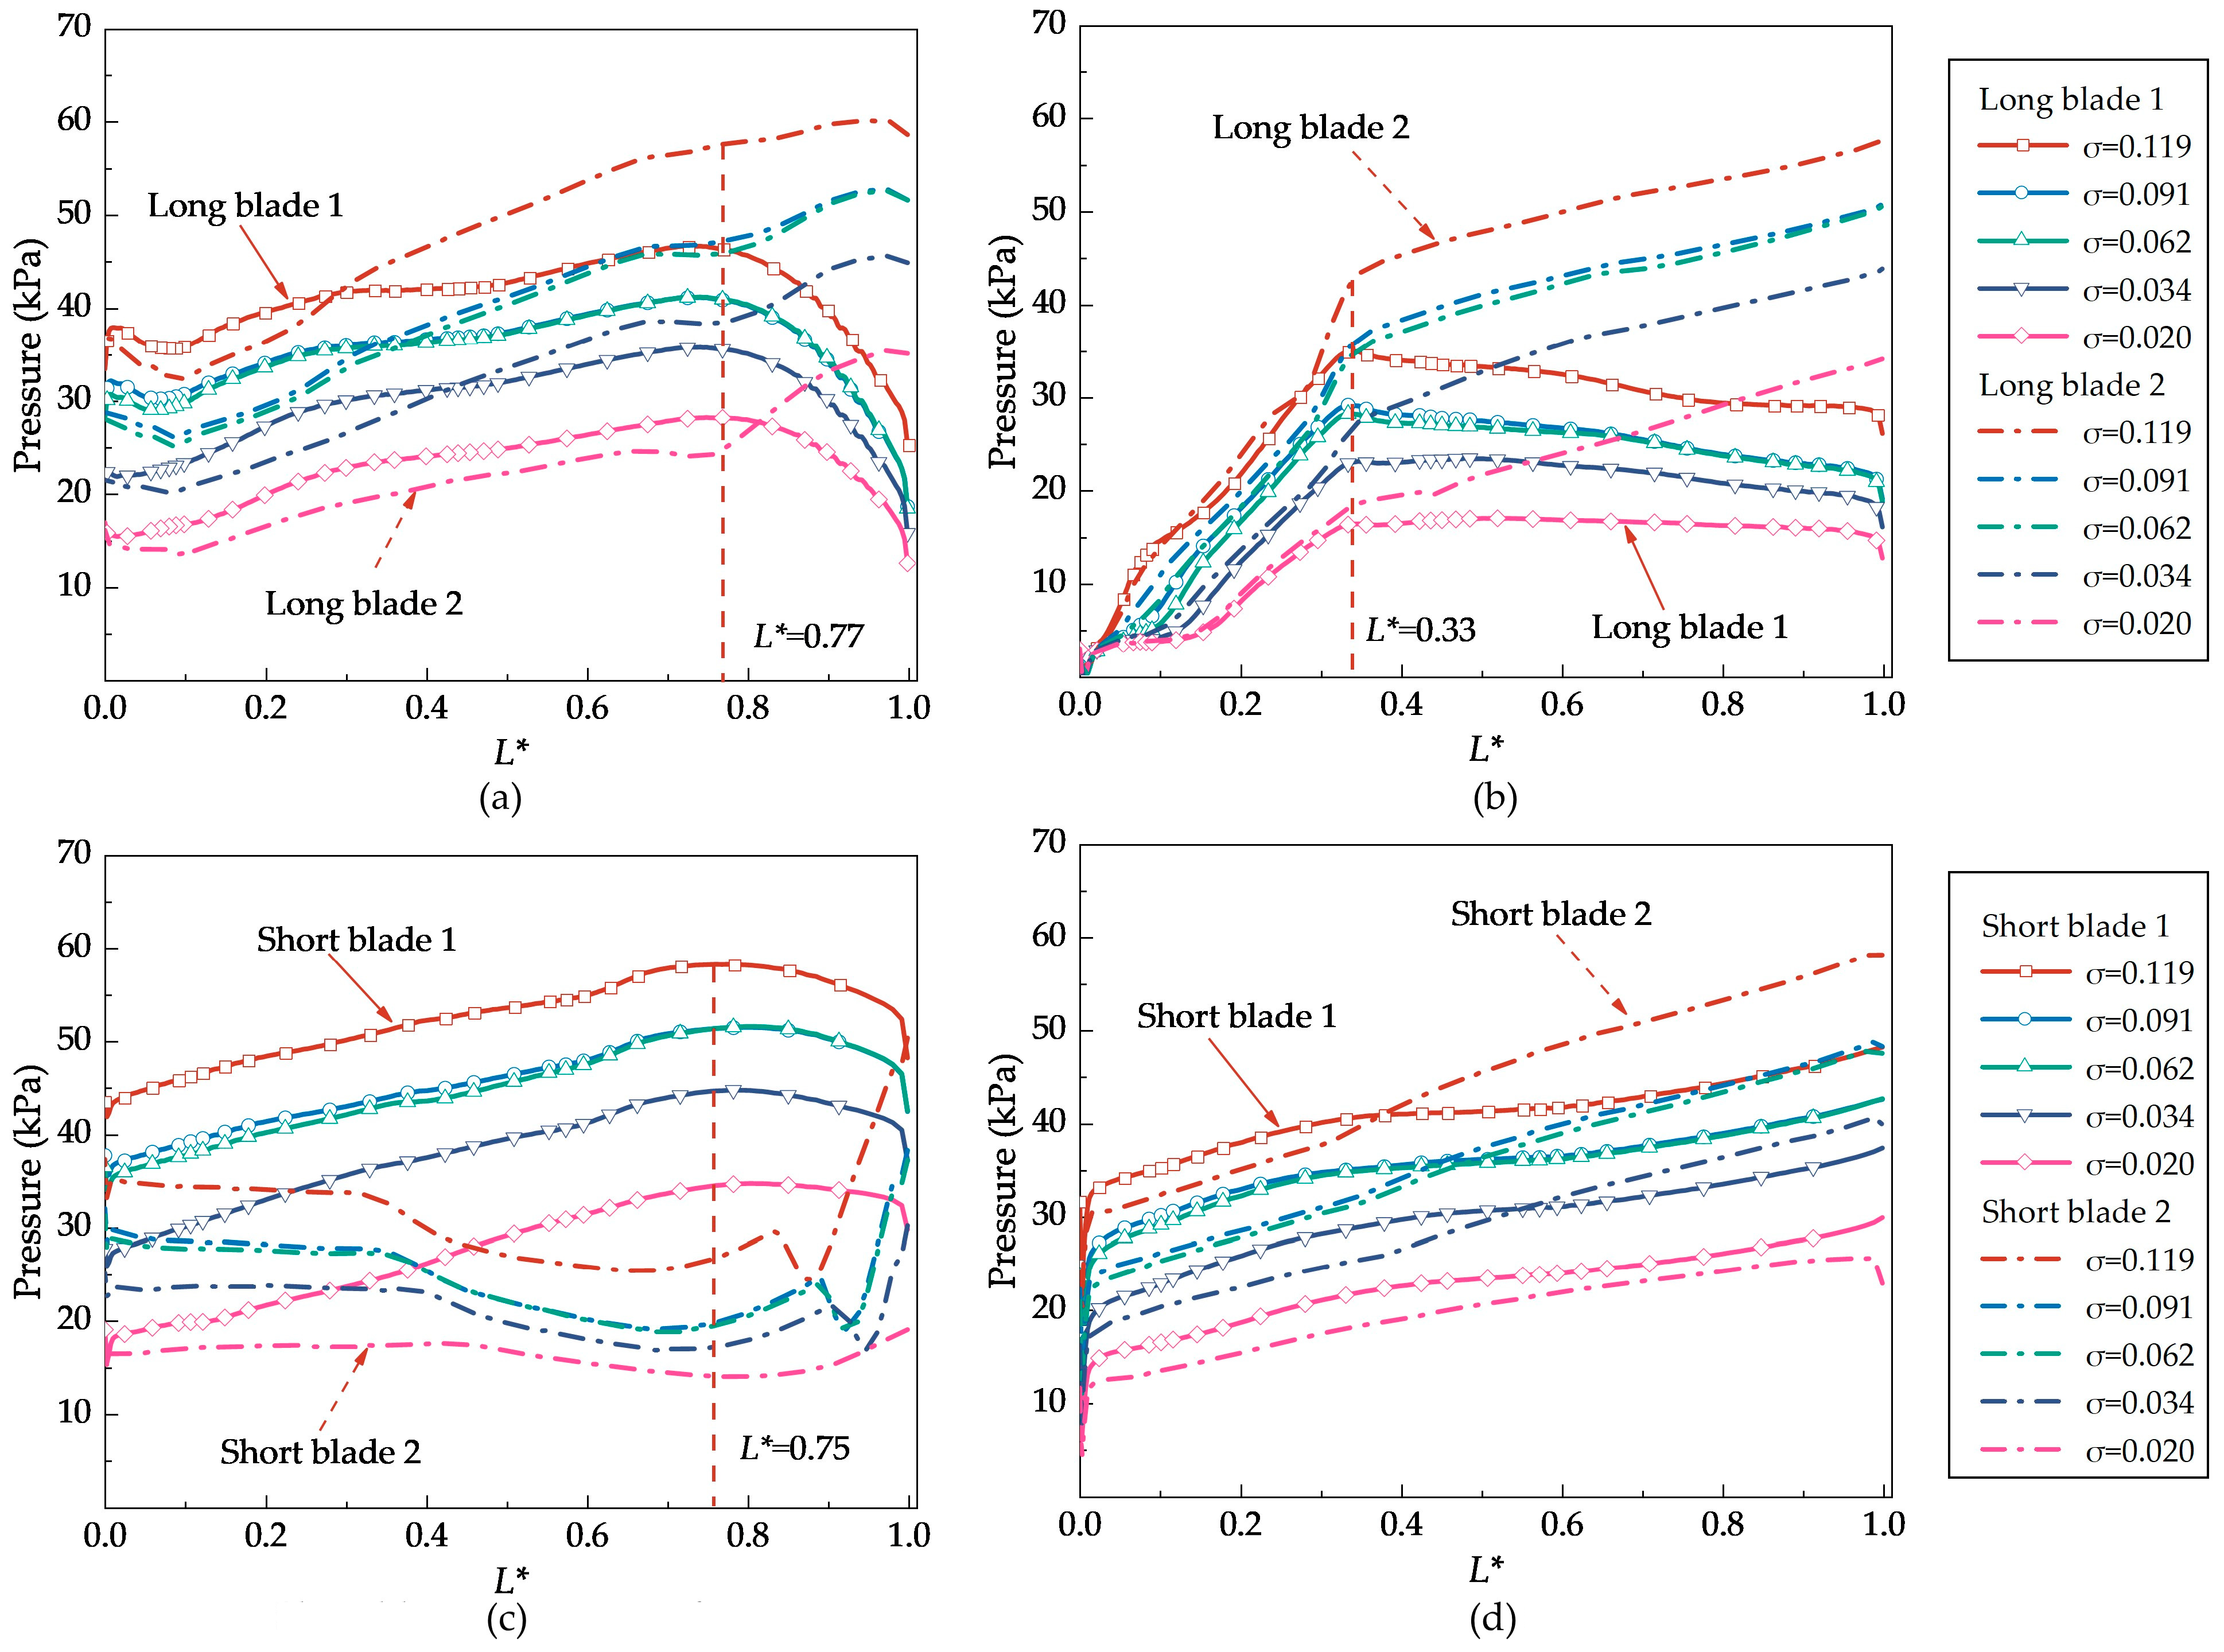
5.6. Influence of Different Cavitation Numbers on Blade Load Distribution

Figure 11 shows the blade surface pressure under different cavitation coefficients when TC = 0.3 mm.
The conclusions obtained from Figure 11 are as follows: (1) With the decrease in the cavitation coefficient, the blade surface pressure gradually decreased. This shows that the reduction in the cavitation coefficient caused the cavitation performance of the inducer to gradually become more serious. (2) The pressure on the pressure surface of the long blade rose steadily before L* < 0.77. A significant turning point occurred when L* = 0.77 and the pressure value dropped rapidly. When L* = 1.0, the pressure was close to half of that when L* = 0. When L* = 0, the pressure on the suction surface of the long blade was close to zero and cavitation was the most serious. With the increase in L*, the pressure on the suction surface of the long blade gradually increased and the cavitation improved. Differentiation occurred when L* = 0.33, and the blade’s pressure at different phase angles shows the opposite change law. To sum up, the pressure on the pressure surface of the short blade under different cavitation coefficients is significantly affected by the phase angle of an inducer’s blade and the maximum pressure difference is reached when L* = 0.75. The suction surface pressure of the short blades decreases synchronously with the decrease in the cavitation coefficient but generally increases with the increase in L*.

6. Conclusions

In this paper, the effect of TC on the performance of a shunt blade inducer under small flow rate conditions is studied by experiments and numerical calculations. The influence of the cavitation coefficients on the performance of the centrifugal pump is analyzed. The generation and movement of the TC leakage vortex in the inducer, the cavitation mechanism on the surface of the inducer’s blades, and the variation of the pressure distribution are revealed. The main conclusions are as follows:
(1)
TC has a certain effect on the critical cavitation coefficient. Under low flow rate conditions, when TC = 0.3 mm, the cavitation performance of a shunt blade inducer is the best, and the critical cavitation coefficient is 0.02.
(2)
The existence of the TC produces a significant leakage vortex at the inlet of the inducer, showing a strong transient effect. The tip leakage vortex in the inducer is mainly generated at the blades’ suction surfaces near the inlet. It gradually increases with the increase in TC. At the same time, the position of the leakage vortex at different phase angles of the inducer shifts, which indicates that the leakage vortex at the tip of the blade moves due to the rotation of the inducer, and the leakage vortex at the inlet of the blade tends to move toward the inlet of the inducer.
(3)
The position and degree of the blade tip leakage cavitation are explained. Cavitation mainly generates at the inlet of the long blade and at the suction side, which is close to the leakage vortex in the inducer. Under the same cavitation coefficient, when TC = 0.3 mm, the cavitation area is the smallest.

Author Contributions

Conceptualization, X.G., Z.Z. and H.Q.; methodology, X.G. and C.J.; validation, X.G., C.Z. and Z.Z.; investigation, X.G. and C.J.; resources, X.G., C.J. and H.Q.; data curation, X.G. and Z.Z.; writing—original draft preparation, X.G.; writing—review and editing, X.G. and C.J.; supervision, Z.Z.; project administration, Z.Z.; funding acquisition, X.G. and Z.Z. All authors have read and agreed to the published version of the manuscript.

Funding

The work was sponsored by the National Natural Science Foundation of China (NO. 51976202), the Natural Science Foundation of Zhejiang Province (NO. L2JWY22E060001), the Key Research and Development Program of Zhejiang Province (2022C01067, 2022C03036), and the Scientific research foundation of Zhejiang University of Water Resources and Electric Power (xky2022035).

Data Availability Statement

Not applicable.

Conflicts of Interest

The authors declare no conflict of interest.

References

  1. Guo, X.; Zhu, Z.; Cui, B.; Shi, G. Effects of the number of inducer blades on the anti-cavitation characteristics and external performance of a centrifugal pump. J. Mech. Sci. Technol. 2016, 30, 3173–3181. [Google Scholar] [CrossRef]
  2. Guo, X.; Zhu, Z.; Cui, B.; Li, Y. Effects of the short blade locations on the anti-cavitation performance of the splitter-bladed inducer and the pump. Chin. J. Chem. Eng. 2015, 23, 1095–1101. [Google Scholar] [CrossRef]
  3. Guo, X.; Zhu, Z.; Cui, B.; Li, Y. The Rotating Cavitation Performance of a Centrifugal Pump with a Splitter-Bladed Inducer under Different Rotational Speed. Int. J. Turbo Jet-Engines 2015, 32, 275–283. [Google Scholar] [CrossRef]
  4. Guo, X.; Zhu, Z.; Cui, B.; Huang, Y. Anti-cavitation performance of a splitter-bladed inducer under different flow rates and different inlet pressures. Sci. China Technol. Sci. 2015, 58, 2131–2138. [Google Scholar] [CrossRef]
  5. Guo, X.; Yang, S.; Li, X.; Shi, L.; Hua, E.; Zhu, Z. The Tip Clearance Cavitation Mechanism of a High-Speed Centrifugal Pump with a Splitter-Bladed Inducer. Processes 2021, 9, 1576. [Google Scholar] [CrossRef]
  6. Shen, J.T.; Xu, F.Y.; Cheng, L.; Pan, W.F.; Ge, Y.; Li, J.X.; Zhang, J.L. Simulation of Internal Flow Characteristics of an Axial Flow Pump with Variable Tip Clearance. Water 2022, 14, 1652. [Google Scholar] [CrossRef]
  7. Wei, X.X.; Zhang, R.H. The axial tip clearance leakage analysis of the winglet and composite blade tip for the liquid-ring vacuum pump. Vacuum 2022, 200, 111027. [Google Scholar] [CrossRef]
  8. Yang, Y.; Zhou, L.; Bai, L.; Xu, H.; Lv, W.N.; Shi, W.D.; Wang, H.L. Numerical Investigation of Tip Clearance Effects on the Performance and Flow Pattern Within a Sewage Pump. J. Fluids Eng. 2022, 144, 081202. [Google Scholar] [CrossRef]
  9. Zheng, Y.H.; Li, Y.J.; Zhu, X.Y.; Sun, D.H.; Meng, F. Influence of asymmetric inflow on the transient pressure fluctuation characteristics of a vertical mixed-flow pump. Proc. Inst. Mech. Eng. Part A J. Power Energy 2022. [Google Scholar] [CrossRef]
  10. Qian, B.; Cai, Y.H.; Ding, Q.; Zhao, D.L.; Sun, W.P.; Wang, L.K. Investigation of Tip Leakage Vortex Structure and Trajectory in a Centrifugal Pump with a New Omega Vortex Identification Method. Appl. Sci. 2022, 12, 5270. [Google Scholar] [CrossRef]
  11. Shu, Z.K.; Shi, G.T.; Dan, Y.; Wang, B.X.; Tan, X. Enstrophy dissipation of the tip leakage vortex in a multiphase pump. Phys. Fluids 2022, 34, 033310. [Google Scholar] [CrossRef]
  12. Shen, X.; Zhang, D.S.; Xu, B.; Wu, H.R.; Wang, P.; Shi, W.D. Comparative study of tip leakage vortex trajectory and cavitation in an axial flow pump with various tip clearances. J. Mech. Sci. Technol. 2022, 36, 1289–1302. [Google Scholar] [CrossRef]
  13. Brennen, C.E. Cavitation and Bubble Dynamics; Cambridge University Press (CUP): New York, NY, USA, 2013; pp. 59–62. [Google Scholar] [CrossRef]
  14. Parikh, T.; Mansour, M.; Thévenin, D. Maximizing the performance of pump inducers using CFD-based multi-objective optimization. Struct. Multidiscip. Optim. 2021, 65, 9. [Google Scholar] [CrossRef]
  15. Xiang, L.; Tan, Y.; Chen, H.; Xu, K. Experimental investigation of cavitation instabilities in inducer with different tip clearances. Chin. J. Aeronaut. 2021, 34, 168–177. [Google Scholar] [CrossRef]
  16. Ke, S.U.; Wen-wu, S.; Jian-wei, S.; Yue, Z.; Qiang, D. The Effect of Tip Clearance on Flow Characteristics in Inducers. China Rural. Water Hydropower 2021, 136–140, 149. [Google Scholar]
  17. Karakas, E.S.; Watanabe, H.; Aureli, M.; Evrensel, C.A. Cavitation Performance of Constant and Variable Pitch Helical Inducers for Centrifugal Pumps: Effect of Inducer Tip Clearance. J. Fluids Eng. 2019, 142, 021211. [Google Scholar] [CrossRef]
  18. Kim, C.; Kim, S.; Choi, C.-H.; Baek, J. Effects of inducer tip clearance on the performance and flow characteristics of a pump in a turbopump. Proc. Inst. Mech. Eng. Part A J. Power Energy 2017, 231, 398–414. [Google Scholar] [CrossRef]
  19. Amezcua, R.C.; Khelladi, S.; Mazur-Czerwiec, Z.; Bakir, F.; Campos-Amezcua, A.; Rey, R. Numerical and experimental study of cavitating flow through an axial inducer considering tip clearance. Proc. Inst. Mech. Eng. Part A J. Power Energy 2013, 227, 858–868. [Google Scholar] [CrossRef]
  20. Kim, S.; Choi, C.; Kim, J.; Park, J.; Baek, J. Effects of tip clearance on performance and characteristics of backflow in a turbopump inducer. Proc. Inst. Mech. Eng. Part A J. Power Energy 2013, 227, 847–857. [Google Scholar] [CrossRef]
  21. Fu, Y.; Yuan, J.; Yuan, S.; Pace, G.; D’Agostino, L. Effect of Tip Clearance on the Internal Flow and Hydraulic Performance of a Three-Bladed Inducer. Int. J. Rotating Mach. 2017, 2017, 2329591. [Google Scholar] [CrossRef] [Green Version]
  22. Cheng, H.-Y.; Ji, B.; Long, X.-P.; Huai, W.-X.; Farhat, M. A review of cavitation in tip-leakage flow and its control. J. Hydrodyn. 2021, 33, 226–242. [Google Scholar] [CrossRef]
  23. Cheng, H.Y.; Bai, X.R.; Long, X.P.; Ji, B.; Peng, X.X.; Farhat, M. Large eddy simulation of the tip-leakage cavitating flow with an insight on how cavitation influences vorticity and turbulence. Appl. Math. Model. 2020, 77, 788–809. [Google Scholar] [CrossRef]
  24. Cheng, H.Y.; Long, X.P.; Ji, B.; Peng, X.X.; Farhat, M. Suppressing tip-leakage vortex cavitation by overhanging grooves. Exp. Fluids 2020, 61, 159. [Google Scholar] [CrossRef]
  25. ANSYS. ANSYS CFX-Solver Theory Guide, Release 18.0; ANSYS: Canonsburg, PA, USA, 2018. [Google Scholar]
  26. Cheng, X.; Zhang, A. Effect of axial matching between inducer and centrifugal pump suction chamber on cavitation performance. Proc. Inst. Mech. Eng. Part A J. Power Energy 2019, 234, 947–956. [Google Scholar] [CrossRef]
Figure 1. The pump and the inducer: (a) the centrifugal pump; (b) the shunt blade inducer.
Energies 15 06330 g001
Figure 2. The closed test-bed and test systems: (a) Closed test-bed system; (b) Test bed.
Energies 15 06330 g002
Figure 3. External characteristic curve.
Energies 15 06330 g003
Figure 4. (a) Calculation flow area; (b) Grids on the shunt blade inducer and the impeller.
Energies 15 06330 g004
Figure 5. Cavitation performance curves of the centrifugal pump under different TCs.
Energies 15 06330 g005
Figure 6. Tip leakage vortex (0.75 Qd) of the shunt blade inducer with different TCs: (a) TC = 0.2 mm; (b) TC = 0.3 mm; (c) TC = 0.4 mm; (d) TC = 0.5 mm.
Energies 15 06330 g006
Figure 7. Motion of TC vortex (0.75 Qd, TC = 0.3 mm).
Energies 15 06330 g007
Figure 8. Vapor phase volume fraction distribution of the shunt blade inducer under different TCs and different σ: (a) TC = 0.2 mm; (b) TC = 0.3 mm; (c) TC = 0.4 mm; (d) TC = 0.5 mm.
Energies 15 06330 g008
Figure 9. Blade load at different R*: (a) Long blade pressure surface; (b) Long blade suction surface; (c) Short blade pressure surface; (d) Short blade suction surface.
Energies 15 06330 g009
Figure 10. Long and short blades’ loads under different TCs (σ = 0.062, R* = 0.9): (a) Long blade pressure surface; (b) Long blade suction surface; (c) Short blade pressure surface; (d) Short blade suction surface.
Energies 15 06330 g010
Figure 11. Effect of cavitation coefficient on blade load distribution under TC = 0.3 mm: (a) Long blade pressure surface; (b) Long blade suction surface; (c) Short blade pressure surface; (d) Short blade suction surface.
Energies 15 06330 g011
Table 1. Parameters of the pump.
ParametersValue
Flow rate (Q, m3/h)4
Head (H, m)100
Rotation speed (n, r/min)6000
Pipe diameter D1 (used to control TC, mm)38.4~39
The biggest diameter of the inducer(mm)38
Table 2. Critical cavitation coefficient values under different TCs.
Tip Clearance TC (mm)Critical Cavitation Coefficient σ
0.20.062
0.30.020
0.40.062
0.50.048
Publisher’s Note: MDPI stays neutral with regard to jurisdictional claims in published maps and institutional affiliations.

