
Hotel Adapted to the Requirements of an nZEB Building—Thermal Energy Performance and Assessment of Energy Retrofit Plan


Abstract
:1. Introduction
1.1. Energy Consumption in Hotels
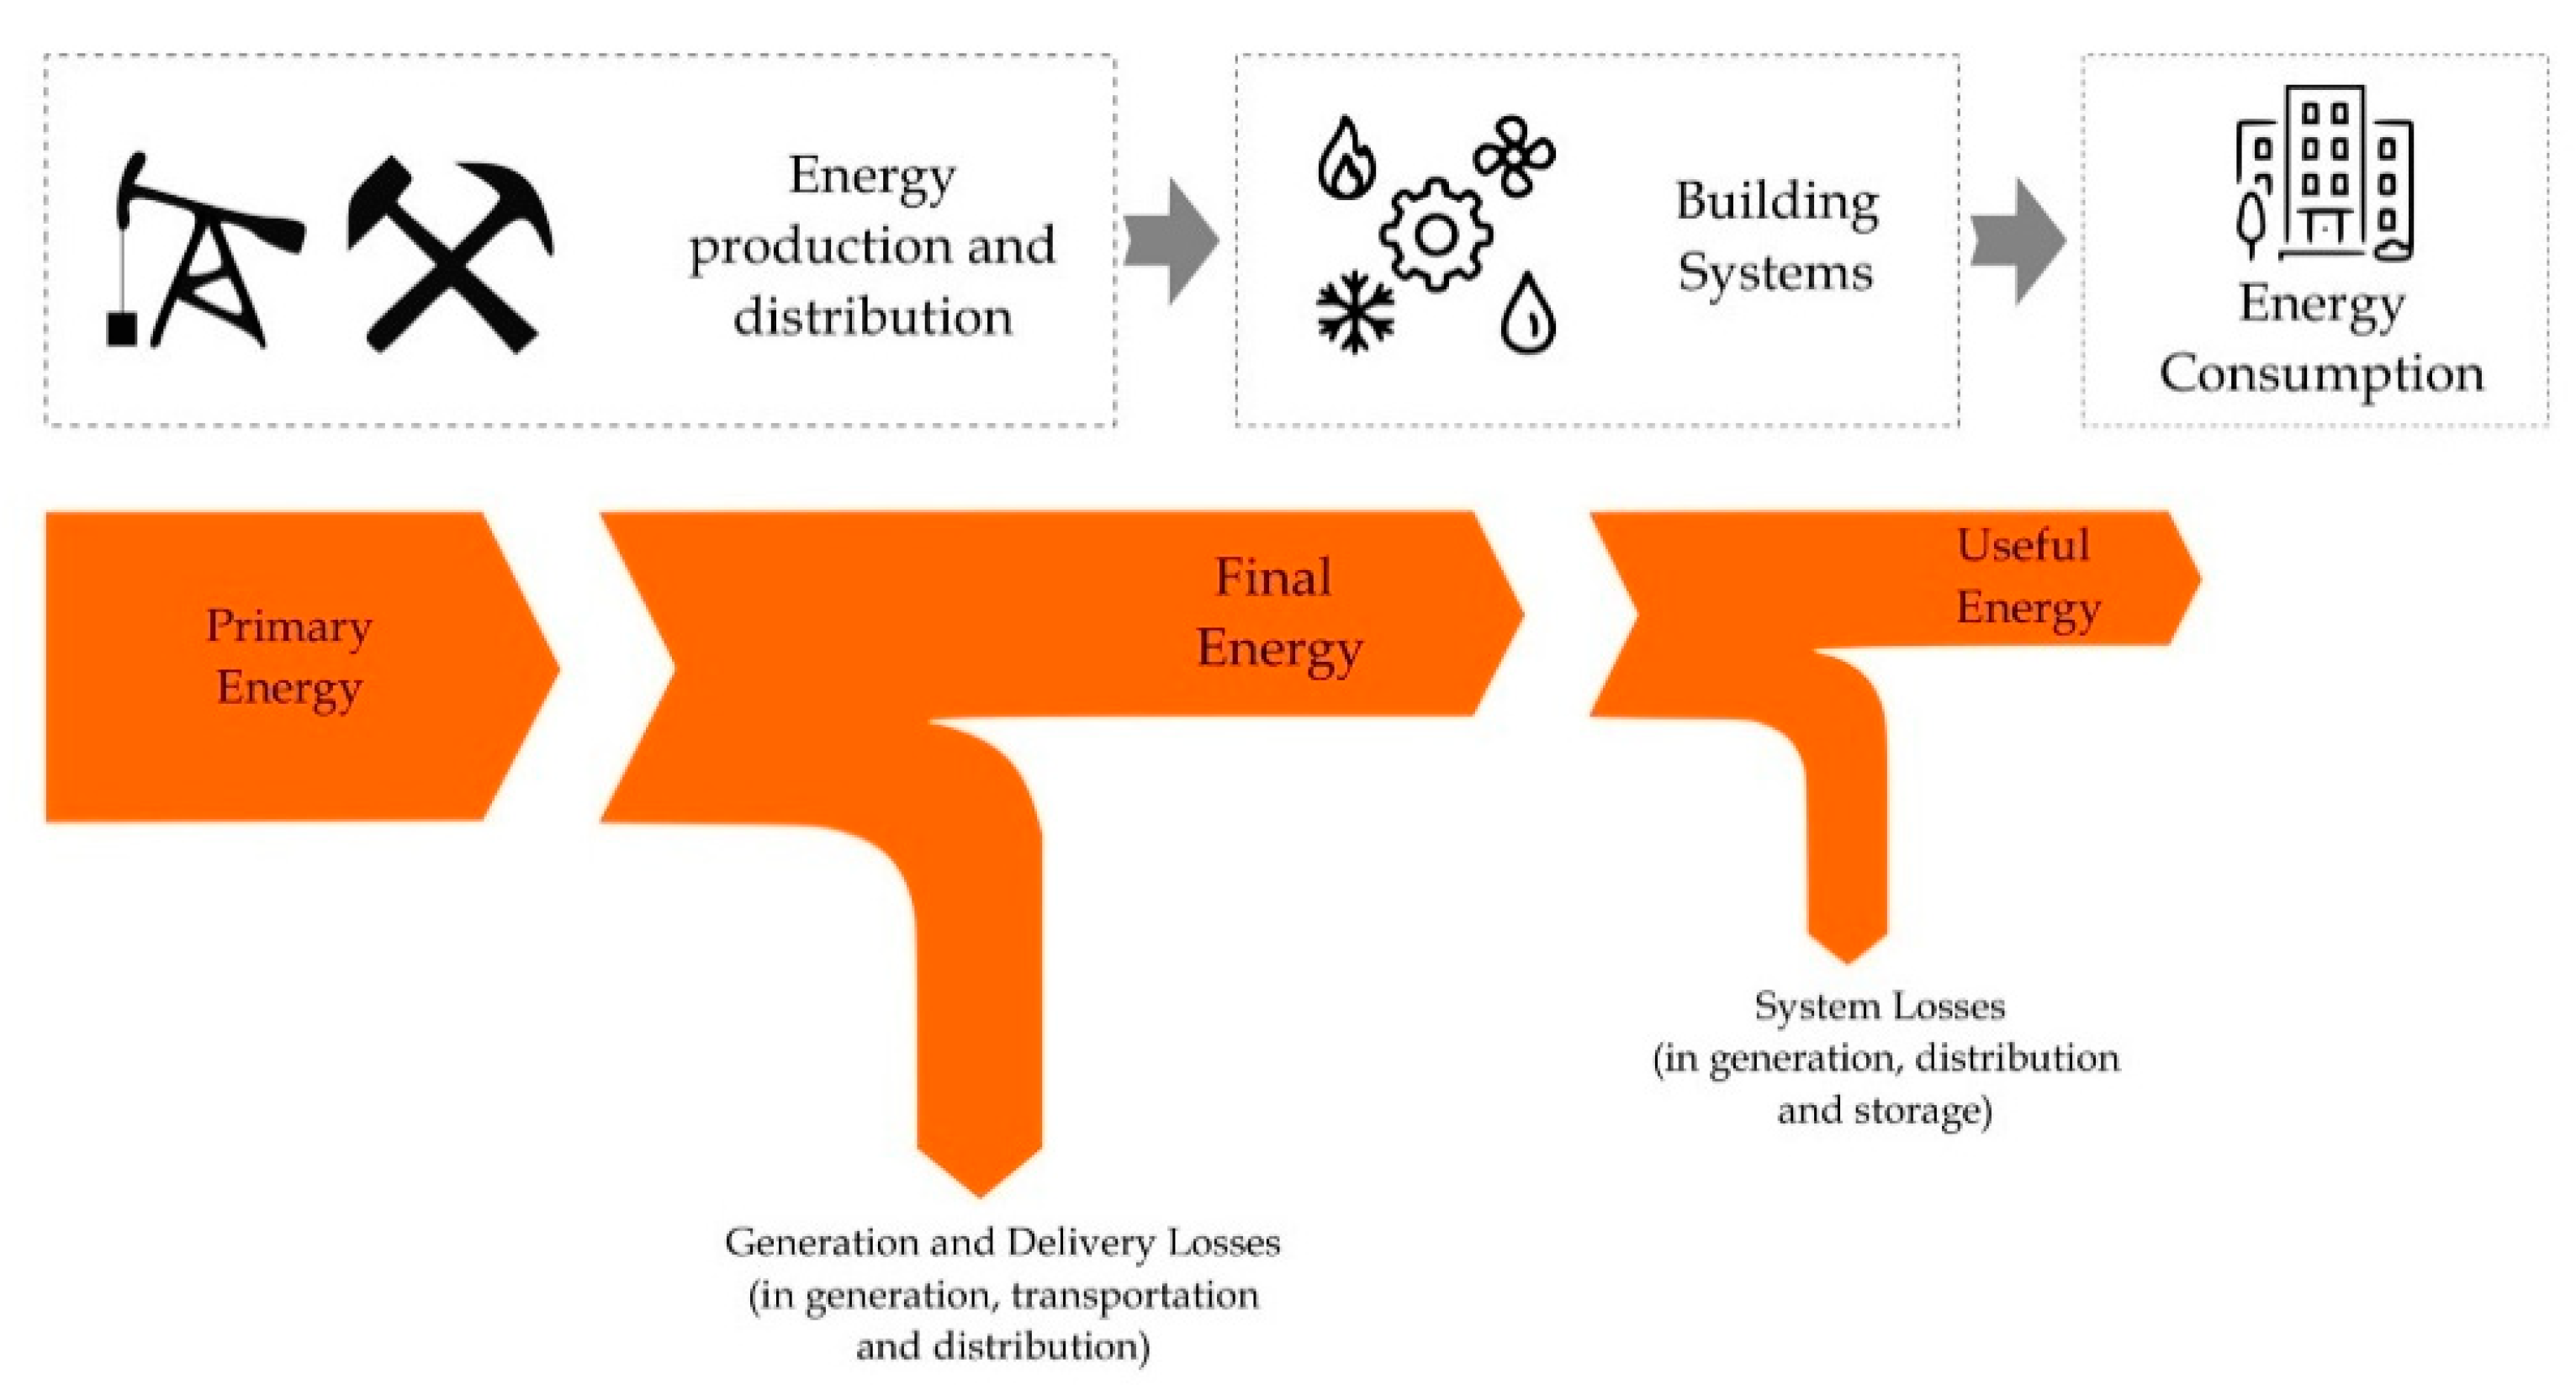
1.2. Energy Sources
1.3. Energy Performance Evaluation—Energy Indicators
1.4. Energy Simulation
2. Materials and Methods
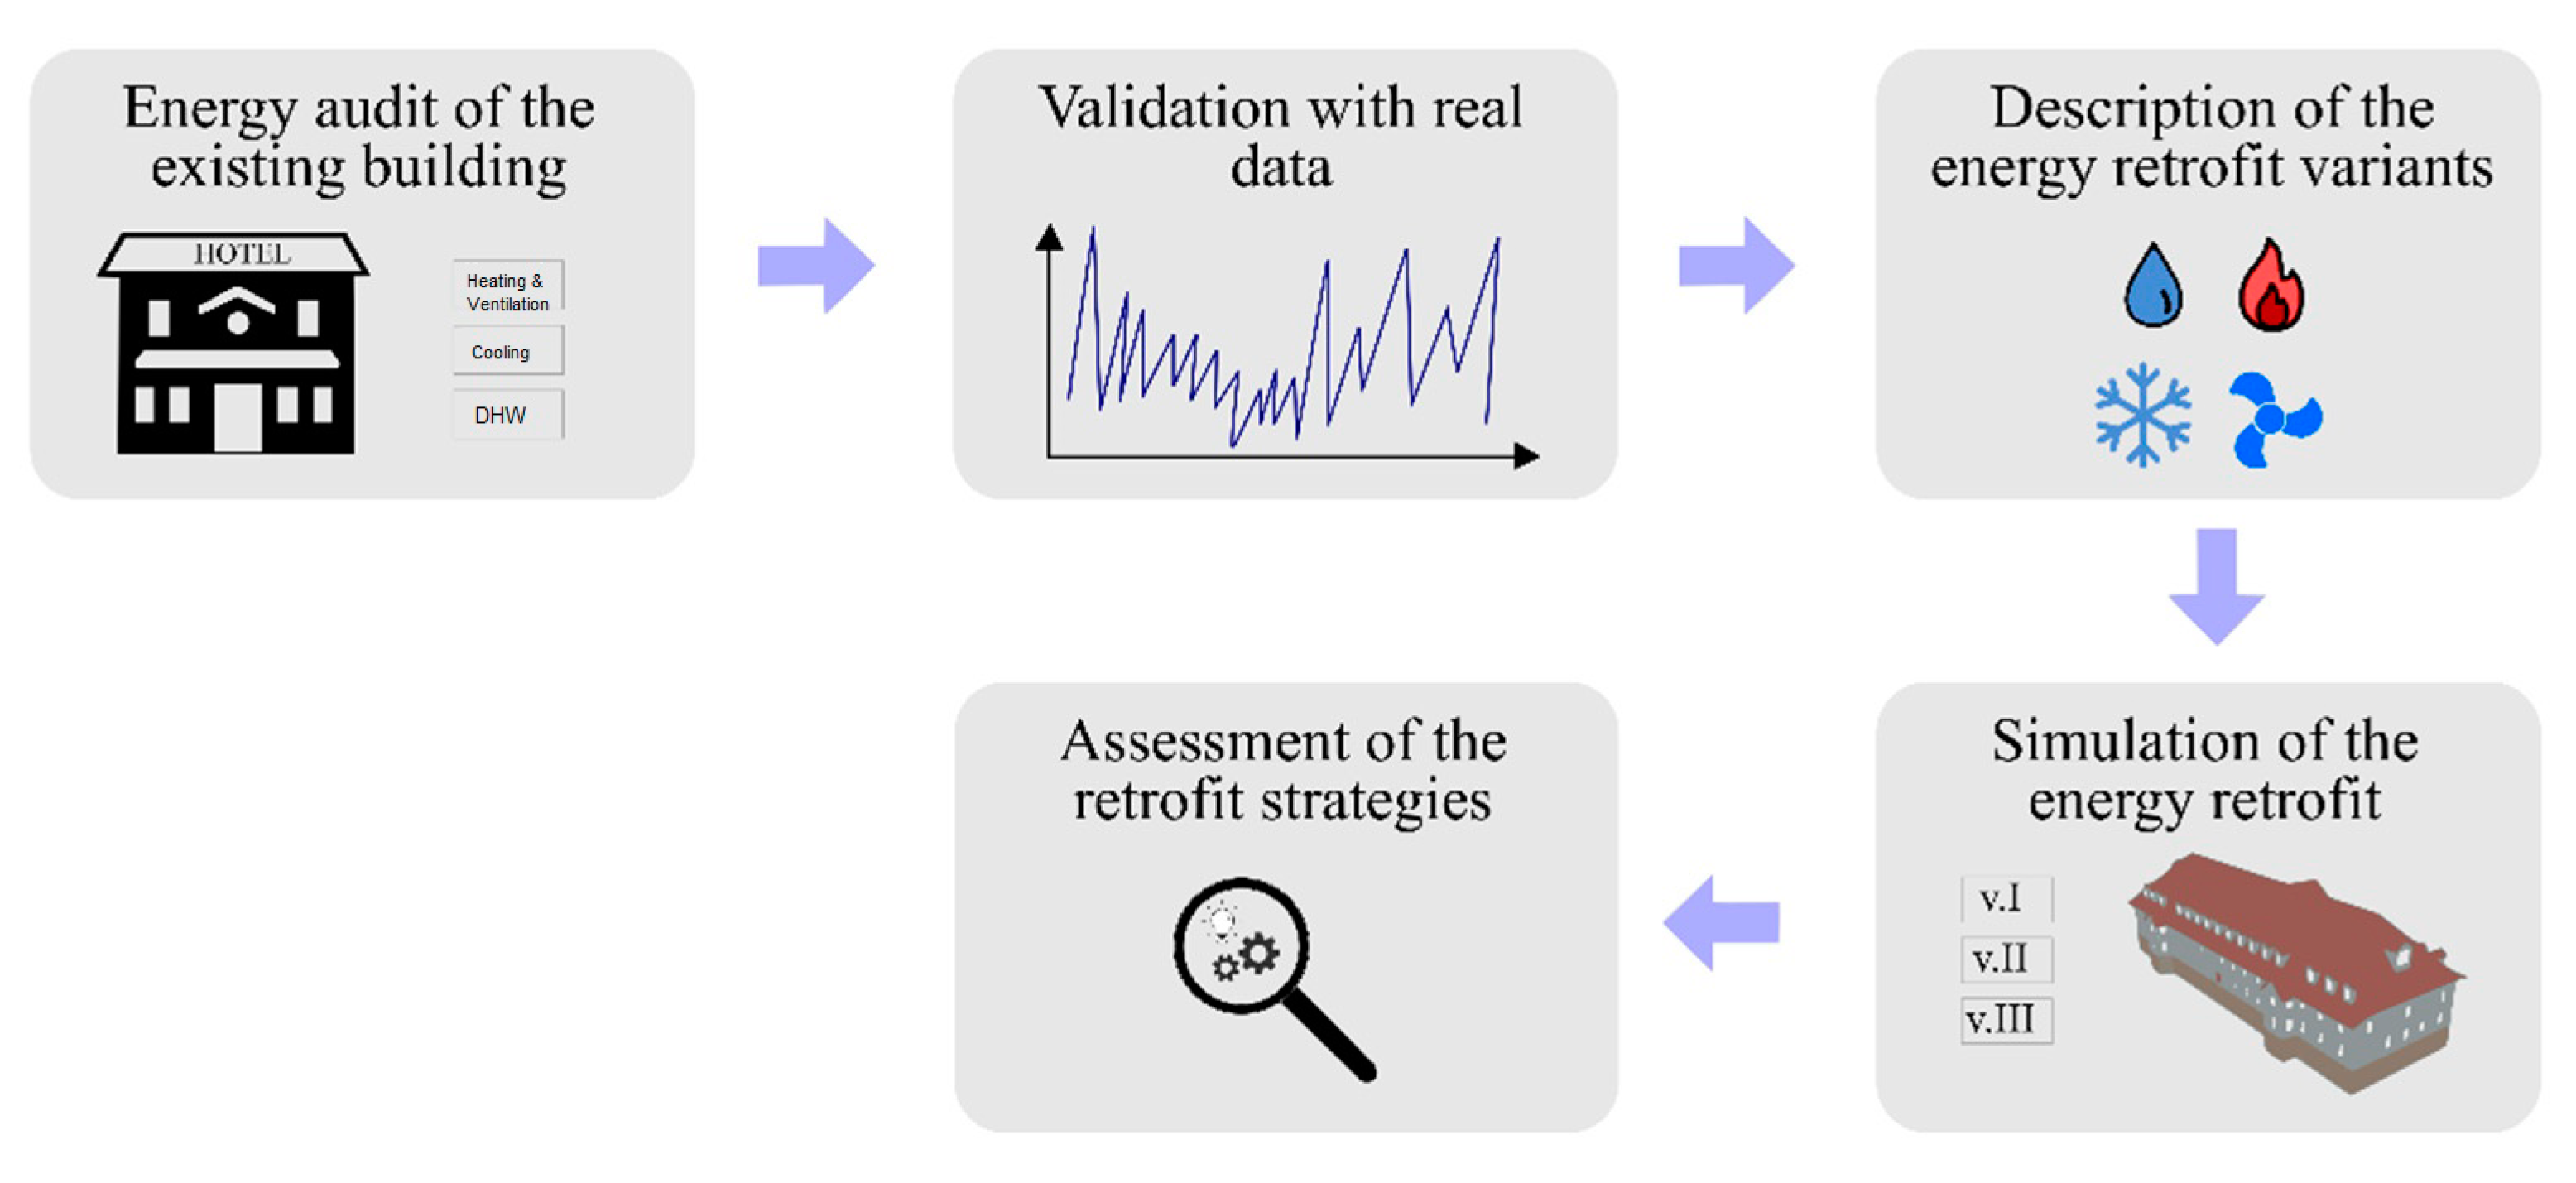
2.1. Research Methodology
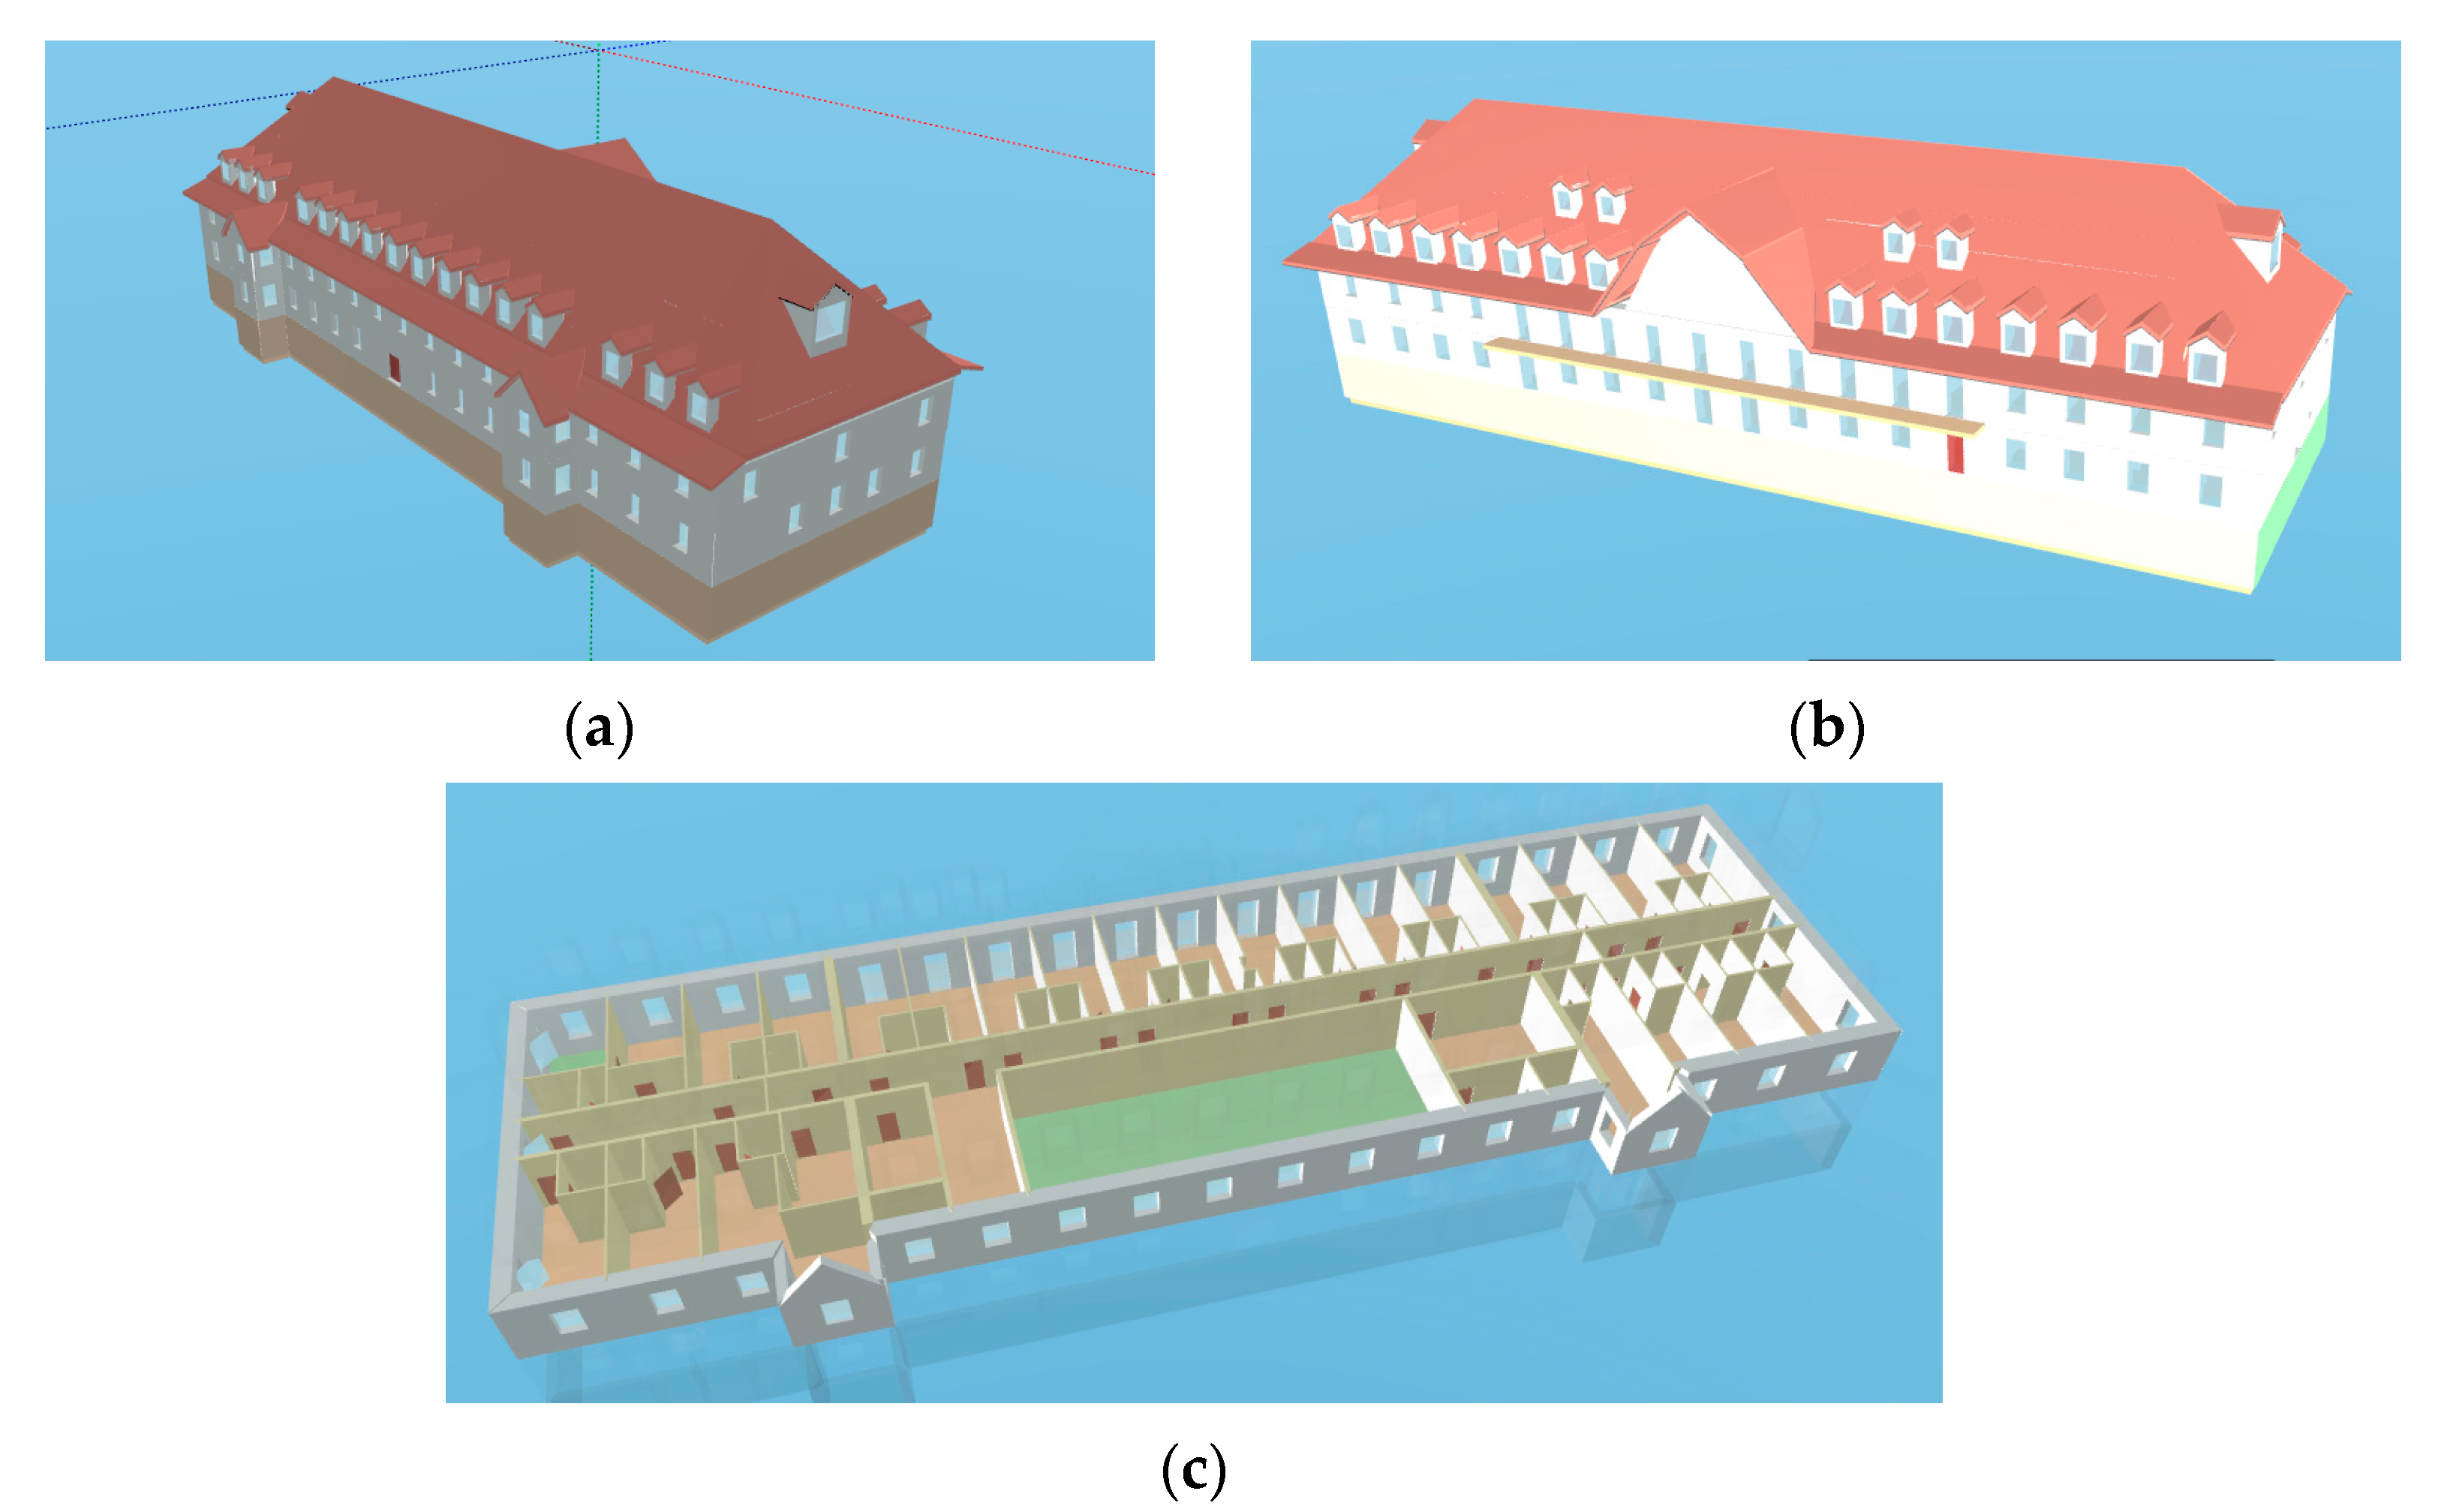
2.2. Case of Study
2.3. Planned Modernization Activities
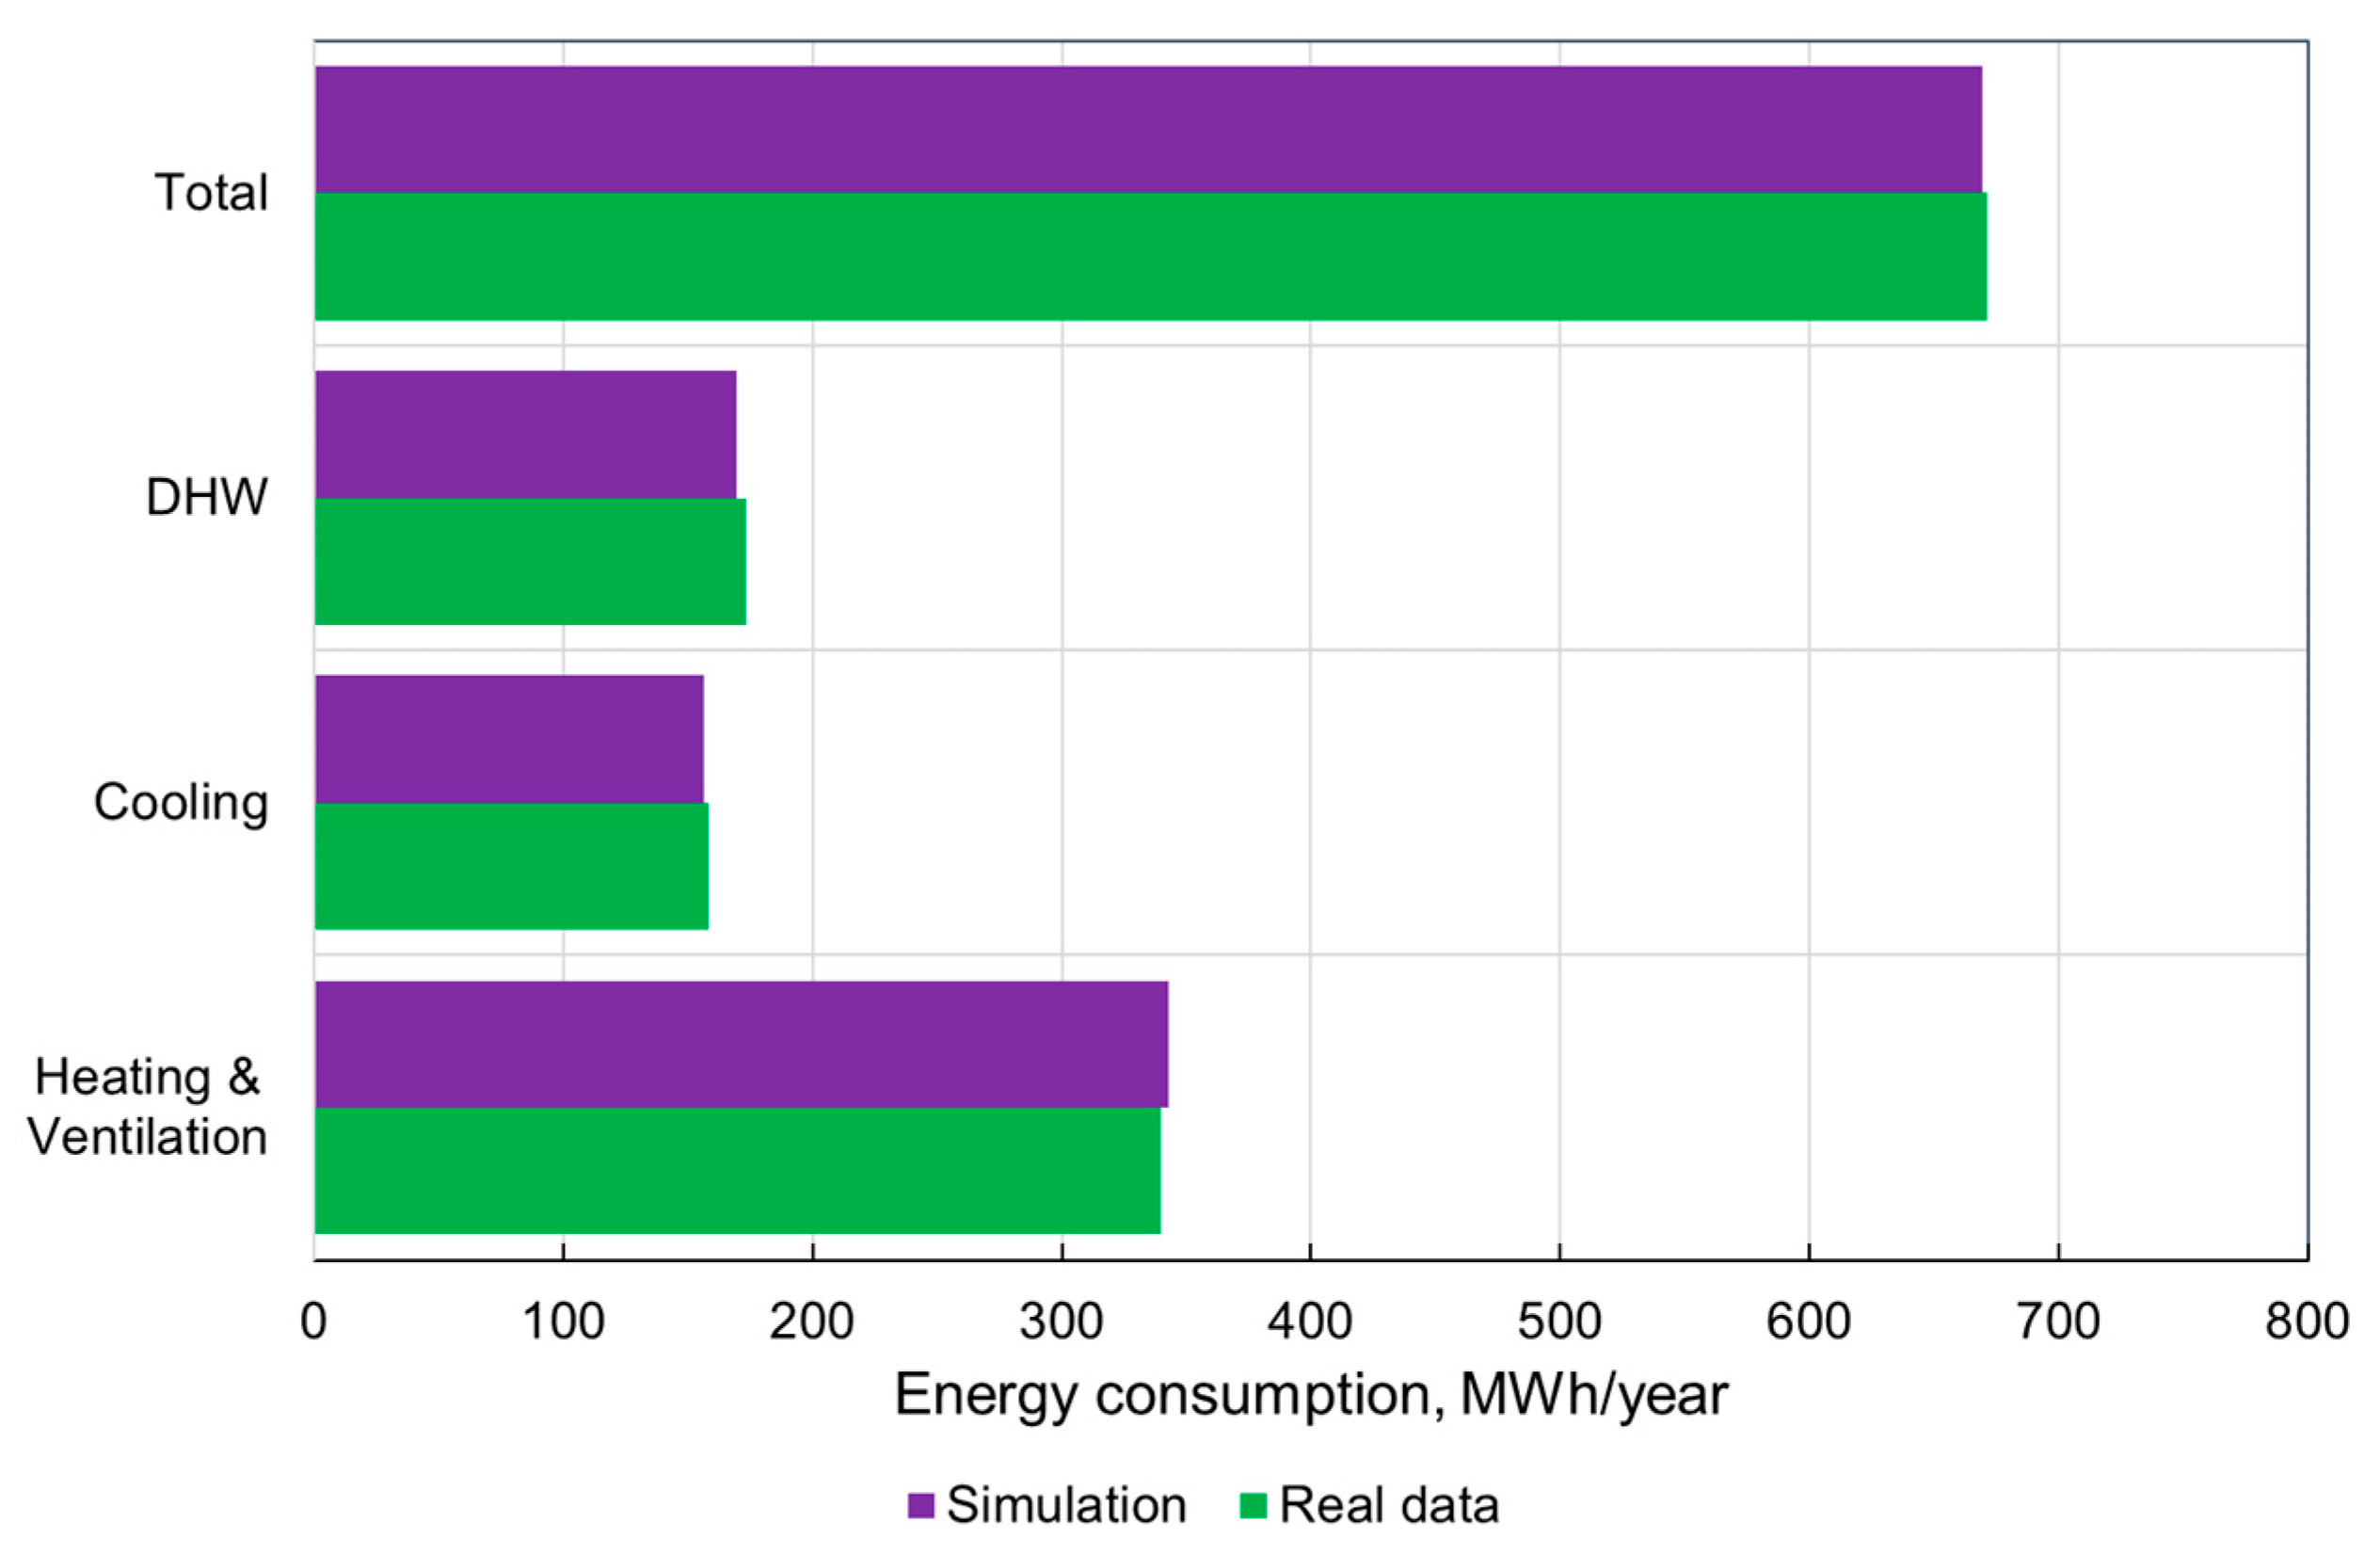
2.4. Building Simulation and Validation
3. Results
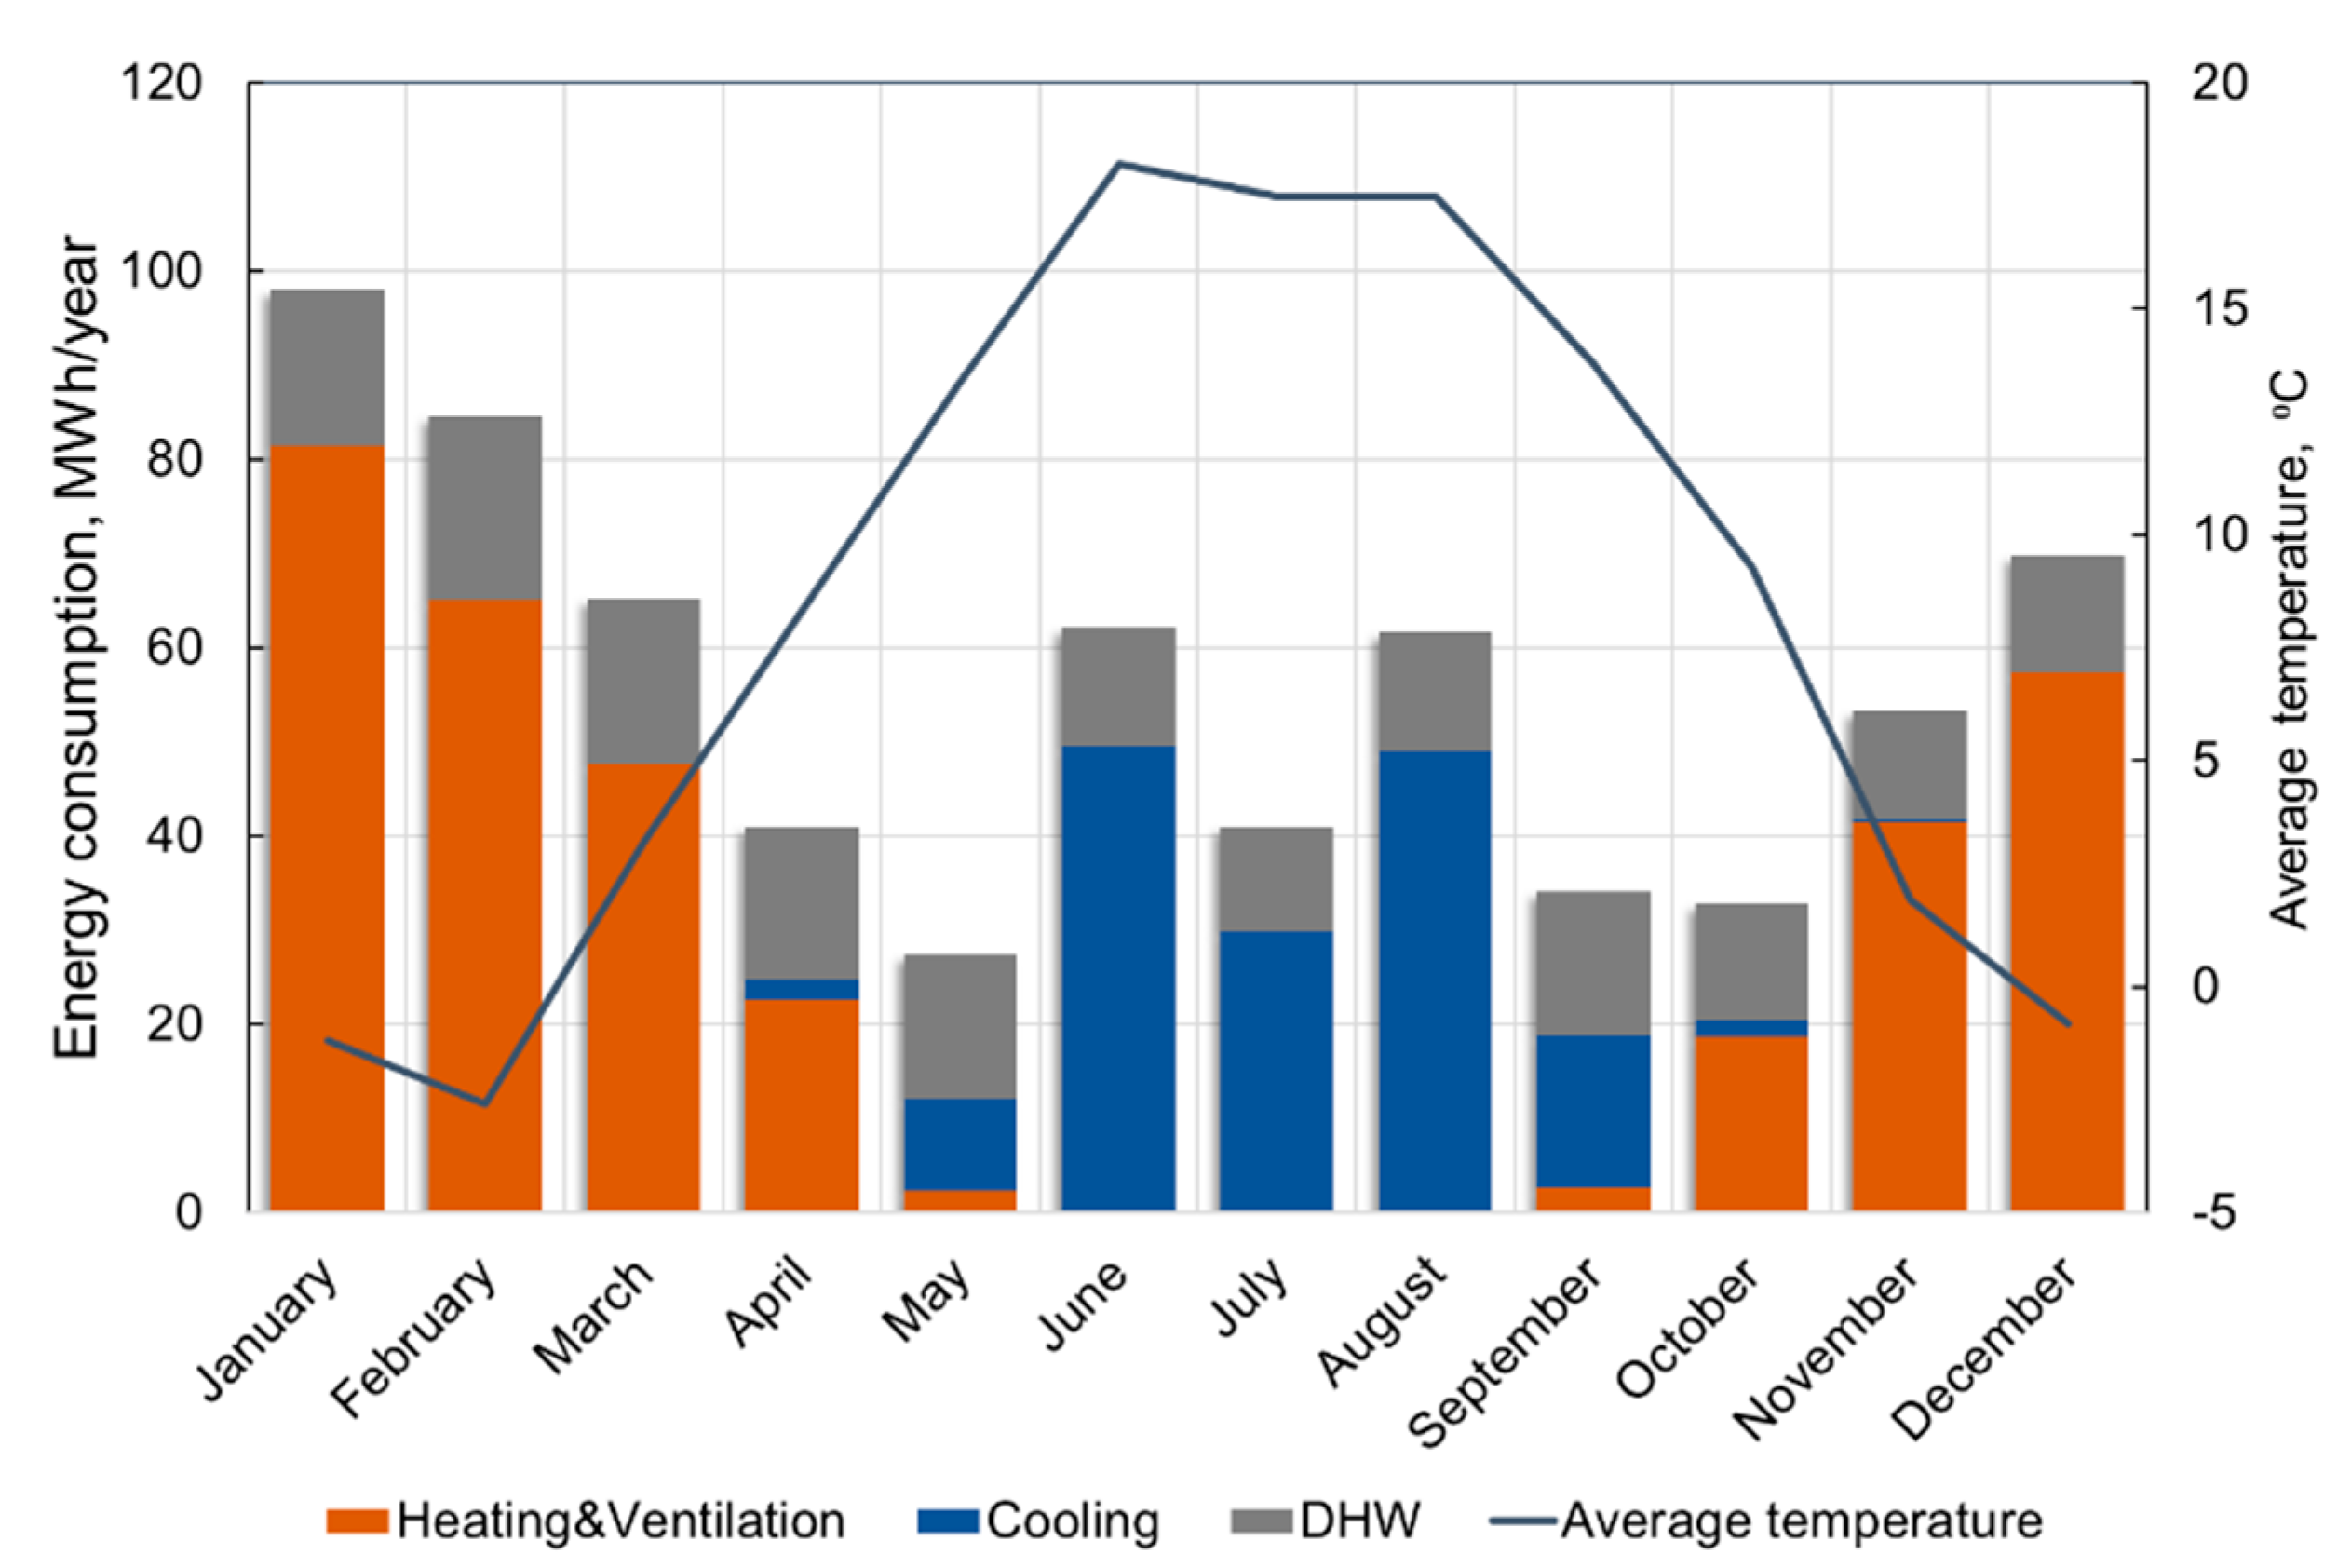
3.1. Energy Performance of Pre-Retrofit Building
3.2. Energy Retrofit—Variant 1
3.3. Energy Retrofit—Variant 2
3.4. Energy Retrofit—Variant 3
3.5. Assessment of the Energy Retrofit
4. Discussion
5. Conclusions
Funding
Institutional Review Board Statement
Informed Consent Statement
Data Availability Statement
Conflicts of Interest
Abbreviations
| PE | Primary energy factor, kWh/(m2∙year) |
| UE | Useful energy factor, kWh/(m2∙year) |
| FE | Final energy factor, kWh/(m2∙year) |
| BEMS | Building energy management systems |
| CCHP | Combined cooling heating and power |
| CH | Central heating |
| CHP | Combined heat and power |
| DHW | Domestic hot water |
| GAT | Trigeneration gas power generator |
| HVAC | Heating, ventilation, and air conditioning |
| MRR | Multifunctional reverse regenerator |
| nZEB | Near-zero-energy buildings |
| PV | Photovoltaics |
| SEER | Seasonal energy efficiency ratio |
References
- Directive 2010/31/EU of the European Parliament and of the Council of 19 May 2010 on the Energy Performance of Buildings. Available online: https://eur-lex.europa.eu/legal-content/EN/TXT/?uri=celex%3A32010L0031 (accessed on 2 August 2022).
- HOTREC. Guidance and Solutions to Raise Energy Efficiency in the European Hospitality Industry. 2018. Available online: https://www.hotrec.eu/hotrec-guidance-and-solutions-to-raise-energy-efficiency/ (accessed on 2 August 2022).
- Santamouris, M.; Balaras, C.A.; Dascalaki, E.; Argiriou, A.; Gaglia, A. Energy conservation and retrofitting potential in Hellenic hotels. Energy Build. 1996, 24, 65–75. [Google Scholar]
- Bohdanowicz, P.; Martinac, I. Determinants and benchmarking of resource consumption in hotels–case study of Hilton international and Scandic in Europe. Energy Build. 2007, 39, 82–95. [Google Scholar]
- Priyadarsini, R.; Xuchao, W.; Siew Eang, L. A study on energy performance of hotel buildings in Singapore. Energy Build. 2009, 41, 1319–1324. [Google Scholar] [CrossRef]
- Yao, Z.; Zhuang, Z.; Gu, W. Study on Energy Use Characteristics of Hotel Buildings in Shanghai. Procedia Eng. 2015, 121, 1977–1982. [Google Scholar] [CrossRef]
- Tsoutsos, T.; Tournaki, S.; Frangou, M.; Tsitoura, M. Creating paradigms for nearly zero energy hotels in South Europe. AIMS Energy 2017, 6, 1–18. [Google Scholar]
- Tsoutsos, T.; Tournaki, S.; Avellaner de Santos, C.; Vercellotti, R. Nearly Zero Energy Buildings Application in Mediterranean hotels. Energy Procedia 2013, 42, 230–238. [Google Scholar] [CrossRef]
- Borowski, M.; Zwolińska, K. Prediction of Cooling Energy Consumption in Hotel Building Using Machine Learning Techniques. Energies 2020, 13, 6226. [Google Scholar] [CrossRef]
- Hussain, A.; Bui, V.-H.; Kim, H.-M.; Im, Y.-H.; Lee, J.-Y. Optimal Energy Management of Combined Cooling, Heat and Power in Different Demand Type Buildings Considering Seasonal Demand Variations. Energies 2017, 10, 789. [Google Scholar] [CrossRef]
- Amber, K.P.; Day, A.R.; Ratyal, N.I.; Ahmad, R.; Amar, M. The Significance of a Building’s Energy Consumption Profiles for the Optimum Sizing of a Combined Heat and Power (CHP) System—A Case Study for a Student Residence Hall. Sustainability 2018, 10, 2069. [Google Scholar] [CrossRef]
- Rotimi, A.; Bahadori-Jahromi, A.; Mylona, A.; Godfrey, P.; Cook, D. Optimum Size Selection of CHP Retrofitting in Existing UK Hotel Building. Sustainability 2018, 10, 2044. [Google Scholar] [CrossRef]
- Li, M.; Mu, H.; Li, N.; Ma, B. Optimal design and operation strategy for integrated evaluation of CCHP (combined cooling heating and power) system. Energy 2016, 99, 202–220. [Google Scholar]
- Hanafizadeh, P.; Eshraghi, J.; Ahmadi, P.; Sattari, A. Evaluation and sizing of a CCHP system for a commercial and office buildings. J. Build. Eng. 2016, 5, 67–78. [Google Scholar]
- Asadi, E.; Gameiro da Silva, M.; Antunes, C.H.; Dias, L. A multi-objective optimization model for building retrofit strategies using TRNSYS simulations, GenOpt and MATLAB. Build. Environ. 2012, 56, 370–378. [Google Scholar]
- Jradi, M.; Lecuelle, P.; Madsen, K.M.H.; Veje, C.; Jørgensen, B.N. Dynamic Model-Driven Energy Retrofit of Bøgevangen and Runevej Daycare Centers in Aarhus. Energy Procedia 2017, 132, 975–981. [Google Scholar]
- Salem, R.; Bahadori-Jahromi, A.; Mylona, A.; Godfrey, P.; Cook, D. Energy performance and cost analysis for the nZEB retrofit of a typical UK hotel. J. Build. Eng. 2020, 31, 101403. [Google Scholar]
- Ulu, M.; Arsan, Z.D. Retrofit Strategies for Energy Efficiency of Historic Urban Fabric in Mediterranean Climate. Atmosphere 2020, 11, 742. [Google Scholar]
- Torregrosa-Jaime, B.; Martínez, P.J.; González, B.; Payá-Ballester, G. Modelling of a Variable Refrigerant Flow System in EnergyPlus for Building Energy Simulation in an Open Building Information Modelling Environment. Energies 2019, 12, 22. [Google Scholar]
- González-Gil, A.; López-González, J.L.; Fernández, M.; Eguía, P.; Erkoreka, A.; Granada, E. Thermal energy demand and potential energy savings in a Spanish surgical suite through calibrated simulations. Energy Build. 2018, 174, 513–526. [Google Scholar]
- Díaz-Torres, Y.; Valdivia-Nodal, Y.; Monteagudo-Yanes, J.P.; Miranda-Torres, Y. Application of building energy simulation in the validating of operational strategies of HVAC systems on a tropical hotel. Ing. Mecánica 2017, 20, 31–38. [Google Scholar]
- Biserni, C.; Valdiserri, P.; D’Orazio, D.; Garai, M. Energy Retrofitting Strategies and Economic Assessments: The Case Study of a Residential Complex Using Utility Bills. Energies 2018, 11, 2055. [Google Scholar]
- Silenzi, F.; Priarone, A.; Fossa, M. Hourly simulations of an hospital building for assessing the thermal demand and the best retrofit strategies for consumption reduction. Therm. Sci. Eng. Prog. 2018, 6, 388–397. [Google Scholar]
- Ascione, F.; Bianco, N.; De Masi, R.F.; Mauro, G.M.; Vanoli, G.P. Energy retrofit of educational buildings: Transient energy simulations, model calibration and multi-objective optimization towards nearly zero-energy performance. Energy Build. 2017, 144, 303–319. [Google Scholar]
- Cho, H.M.; Yun, B.Y.; Yang, S.; Wi, S.; Chang, S.J.; Kim, S. Optimal energy retrofit plan for conservation and sustainable use of historic campus building: Case of cultural property building. Appl. Energy 2020, 275, 115313. [Google Scholar]
- Firląg, S. Cost-Optimal Plus Energy Building in a Cold Climate. Energies 2019, 12, 3841. [Google Scholar] [CrossRef]
- Markiewicz-Zahorski, P.; Rucińska, J.; Fedorczak-Cisak, M.; Zielina, M. Building Energy Performance Analysis after Changing Its Form of Use from an Office to a Residential Building. Energies 2021, 14, 564. [Google Scholar] [CrossRef]
- Michalak, P.; Szczotka, K.; Szymiczek, J. Energy Effectiveness or Economic Profitability? A Case Study of Thermal Modernization of a School Building. Energies 2021, 14, 1973. [Google Scholar] [CrossRef]
- EN 12831-1: 2017; Energy Performance of Buildings. Method for Calculation of the Design Heat Load. Space Heating Load, Module M3-3. CEN: Brussels, Belgium, 2017.
- ISO 13790:2008; Energy Performance of Buildings—Calculation of Energy Use for Space Heating and Cooling. International Organization for Standardization: Geneva, Switzerland, 2008.
- Regulation of the Minister of Infrastructure and Development of February 27, 2015 on the Methodology for Determining the Energy Performance of a Building or Part of a Building and Energy Performance Certificates; Journal of Laws 2015, Item 376; Ministry of Infrastructure and Development Poland: Warsaw, Poland, 2015.
- Borowski, M.; Mazur, P.; Kleszcz, S.; Zwolińska, K. Energy Monitoring in a Heating and Cooling System in a Building Based on the Example of the Turówka Hotel. Energies 2020, 13, 1968. [Google Scholar]
- ISO 6946:2017; Building Components and Building Elements. Thermal Resistance and Thermal Transmittance. Calculation Methods. ISO: Geneva, Switzerland, 2017.
- European Standard EN-1434:2015; Thermal Energy Meters. BSI: London, UK, 2015.


| Parameter | Value/Description |
|---|---|
| Location | Kraków |
| Type | Hotel |
| Construction year | 1812 |
| Reconstruction year | 2007 |
| Number of floors | 5 (basement and four ground levels |
| Useful floor area | 5525.00 m2 |
| Capacity | 19,300.00 m3 |
| Ventilation system | Mechanical ventilation with recuperation |
| Heating system | Gas boiler, radiators in rooms |
| Cooling system | Fan coils (individual) + ventilation (central) |
| Additional information | 50 double rooms, a conference room, a restaurant, drink bar |
| Parameter | Value/Description |
|---|---|
| Climate zone | III |
| Meteorological station | Poland, Kraków, Balice |
| Design outdoor temperature, °C | −20.0 |
| Average yearly outdoor air temperature, °C | 7.6 |
| Building Envelope | Overall Transmittance, W/(m2K) |
|---|---|
| External walls 1 | 0.281/0.314/0.349 |
| Roof | 0.190 |
| Ground floor | 0.365 |
| Windows | 1.800 |
| Doors | 2.000 |
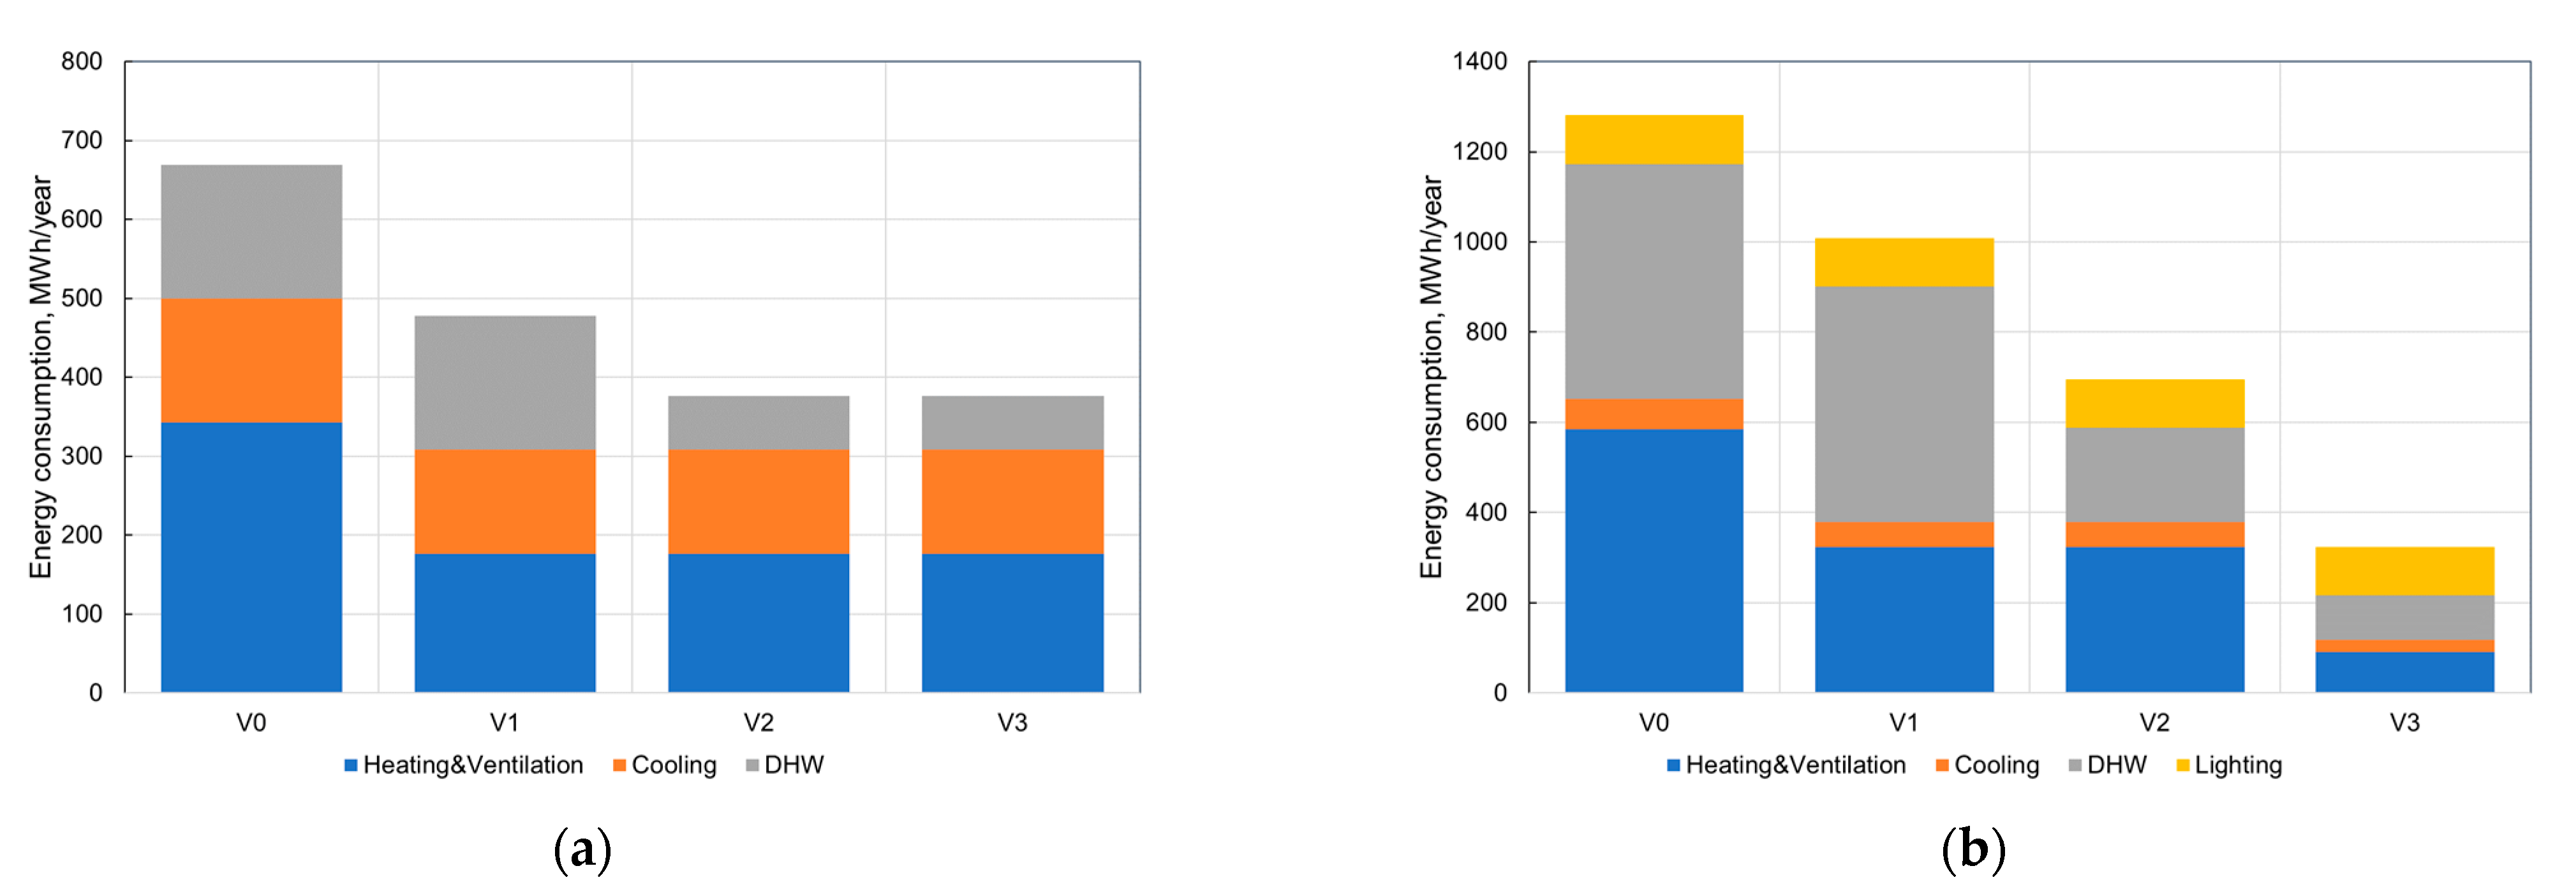
| Parameter | Heating and Ventilation | Cooling | DHW | Lighting | Total |
|---|---|---|---|---|---|
| Useful energy, MWh/year % | 343.16 | 156.35 | 169.55 | - | 669.05 |
| 51.3% | 23.4% | 25.3% | - | 100.0% | |
| Final energy, MWh/year % | 585.47 | 65.97 | 521.69 | 107.50 | 1280.64 |
| 45.7% | 5.2% | 40.7% | 8.4% | 100.0% | |
| Primary energy, MWh/year % | 730.49 | 197.91 | 573.86 | 322.51 | 1824.77 |
| 40.1% | 10.8% | 31.4% | 17.7% | 100.0% |
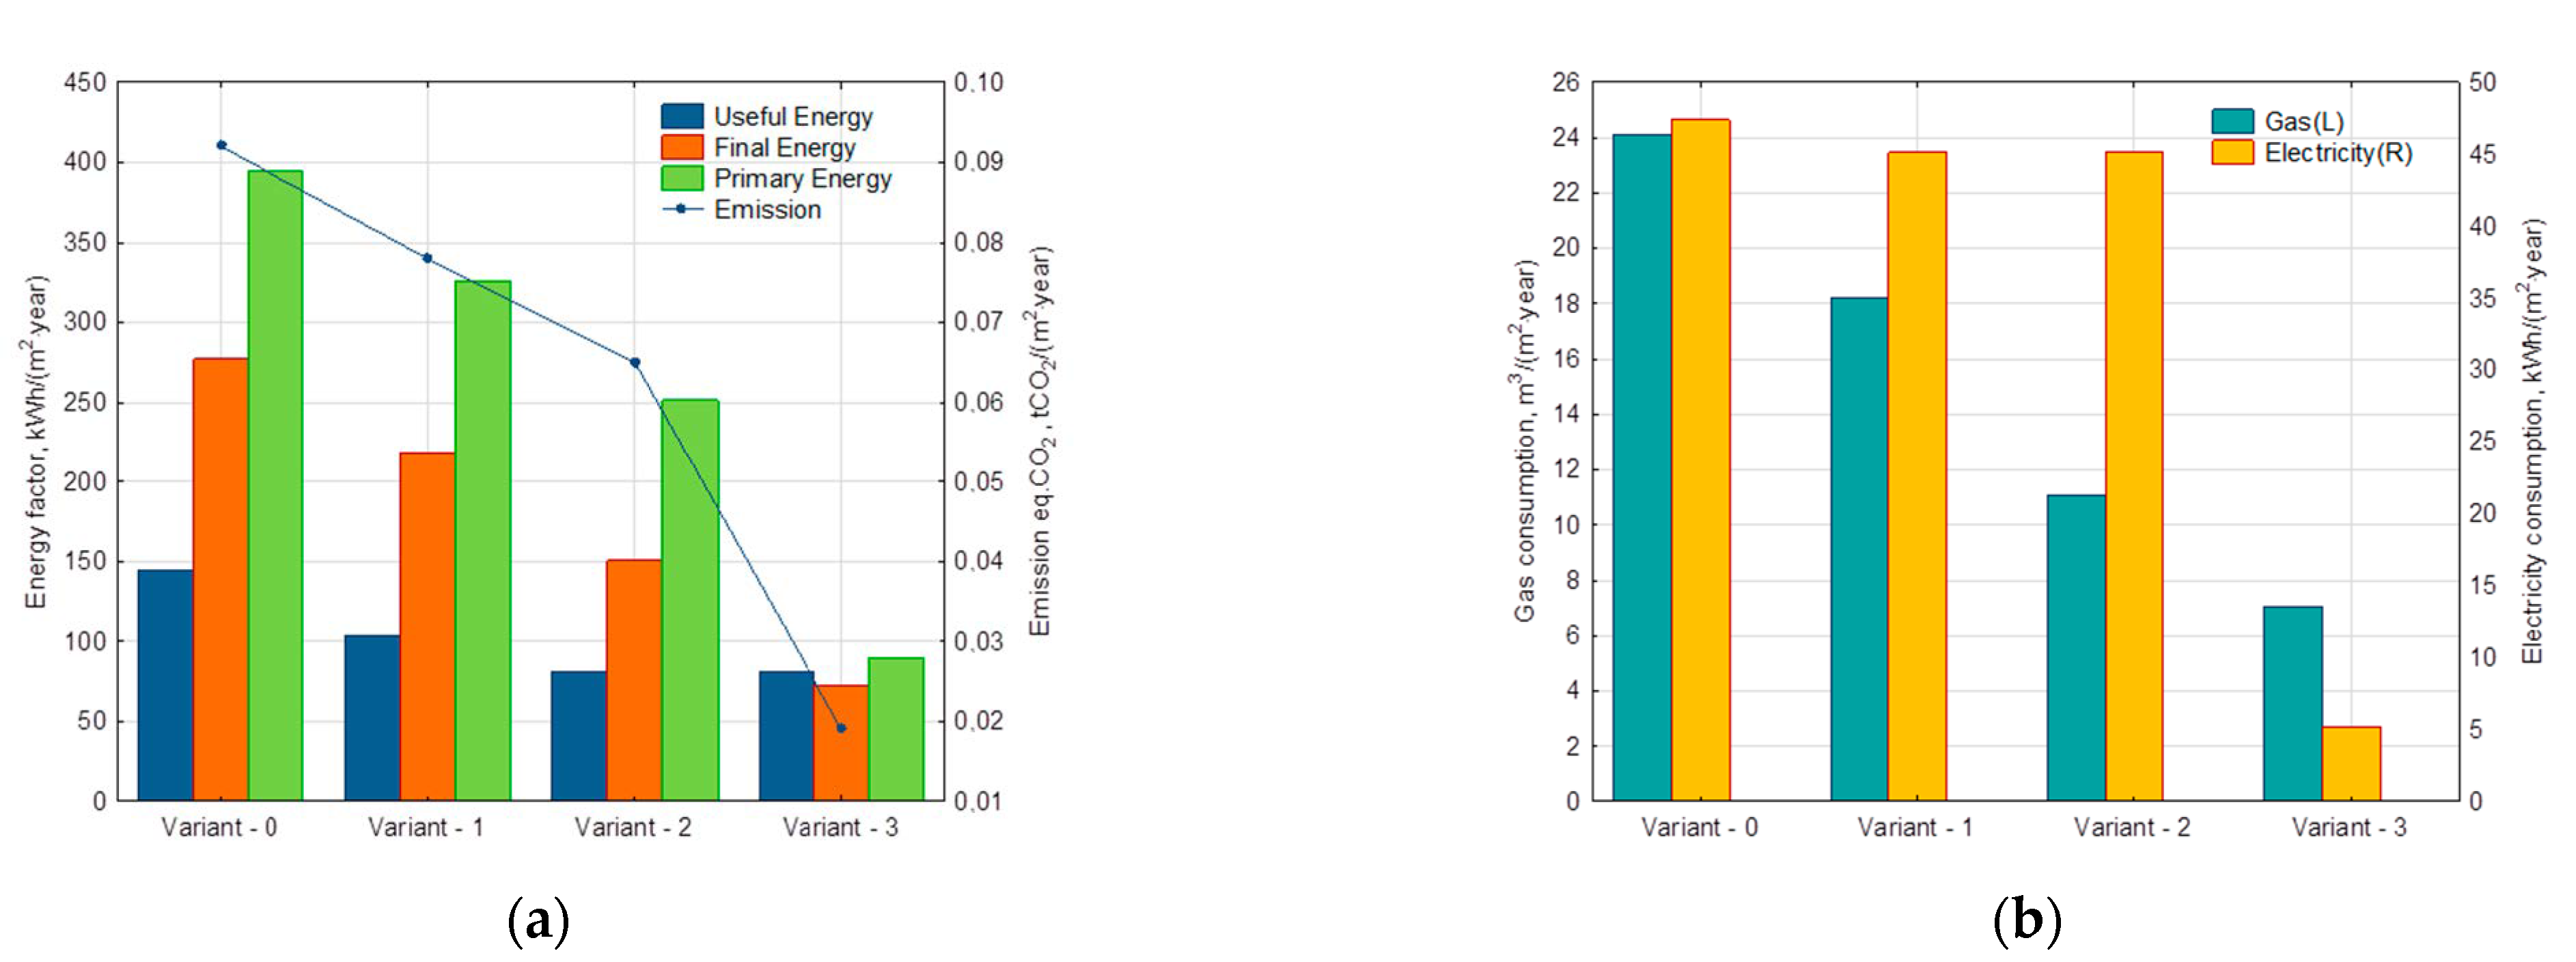
| Indicator | Value |
|---|---|
| Useful energy, kWh/(m2·year) | 144.8 |
| Final energy, kWh/(m2·year) | 277.2 |
| Primary energy, kWh/(m2·year) | 395.0 |
| Emission CO2, Mg CO2/(m2·year) | 0.092 |
| Parameter | Heating and Ventilation | Cooling | DHW | Lighting | Total |
|---|---|---|---|---|---|
| Useful energy, MWh/year % | 176.69 | 131.46 | 169.55 | - | 477.70 |
| 37.0% | 27.5% | 35.5% | - | 100.0% | |
| Final energy, MWh/year % | 323.51 | 55.47 | 521.69 | 107.50 | 1008.18 |
| 32.1% | 5.5% | 51.7% | 10.7% | 100.0% | |
| Primary energy, MWh/year % | 442.45 | 166.41 | 573.86 | 322.51 | 1505.23 |
| 29.4% | 11.1% | 38.1% | 21.4% | 100.0% |
| Indicator | Value | Percentage Reduction Compared to Variant 0 |
|---|---|---|
| Useful energy, kWh/(m2·year) | 103.4 | 28.59% |
| Final energy, kWh/(m2·year) | 218.2 | 21.28% |
| Primary energy, kWh/(m2·year) | 325.8 | 17.52% |
| Emission CO2, Mg CO2/(m2·year) | 0.078 | 15.22% |
| Parameter | Heating and Ventilation | Cooling | DHW | Lighting | Total |
|---|---|---|---|---|---|
| Useful energy, MWh/year % | 176.69 | 131.46 | 67.82 | - | 375.97 |
| 47.0% | 35.0% | 18.0% | - | 100.0% | |
| Final energy, MWh/year % | 323.51 | 55.47 | 208.68 | 107.51 | 695.17 |
| 46.5% | 8.0% | 30.0% | 15.5% | 100.0% | |
| Primary energy, MWh/year % | 442.45 | 166.41 | 229.55 | 322.51 | 1160.91 |
| 38.1% | 14.3% | 19.8% | 27.8% | 100.0% |
| Indicator | Value | Percentage Reduction Compared to Variant 0 |
|---|---|---|
| Useful energy, kWh/(m2·year) | 81.4 | 43.78% |
| Final energy, kWh/(m2·year) | 150.5 | 45.71% |
| Primary energy, kWh/(m2·year) | 251.3 | 36.38% |
| Emission CO2, Mg CO2/(m2·year) | 0.065 | 29.35% |
| System | Modernization |
|---|---|
| Ventilation | The seasonal average temperature efficiency of the new air handling units will exceed 86%. |
| Heating | The facility will use radiators (10%) and fan coil units (90%). |
| Cooling | Chilled water from an air-to-water pump of a three-generation unit will supply the cooling system. |
| DHW | Timed, touchless automation will be installed with dynamic discharge limiters on the draw-off points. It is assumed water consumption is reduced by 60%. |
| Electricity | The use of three tri-generators with mechanical power of 60 kW with a system of smooth power distribution between the reversible heat pump. It will allow the generation of 120 MWh of electricity. |
| Parameter | Heating and Ventilation | Cooling | DHW | Lighting | Total |
|---|---|---|---|---|---|
| Useful energy, MWh/year % | 176.69 | 131.46 | 67.82 | - | 375.97 |
| 47.0% | 35.0% | 18.0% | 0.0% | 100.0% | |
| Final energy, MWh/year % | 91.77 | 25.88 | 99.18 | 107.51 | 324.34 |
| 28.3% | 8.0% | 30.6% | 33.1% | 100.0% | |
| Primary energy, MWh/year % | 100.95 | 28.46 | 109.10 | 174.05 | 412.57 |
| 24.5% | 6.9% | 26.4% | 42.2% | 100.0% |
| Indicator | Value | Percentage Reduction Compared to Variant 0 |
|---|---|---|
| Useful energy, kWh/(m2·year) | 81.4 | 43.78% |
| Final energy, kWh/(m2·year) | 72.2 | 73.95% |
| Primary energy, kWh/(m2·year) | 89.3 | 77.39% |
| Emission CO2, Mg CO2/(m2·year) | 0.019 | 79.35% |
Publisher’s Note: MDPI stays neutral with regard to jurisdictional claims in published maps and institutional affiliations. |
© 2022 by the author. Licensee MDPI, Basel, Switzerland. This article is an open access article distributed under the terms and conditions of the Creative Commons Attribution (CC BY) license (https://creativecommons.org/licenses/by/4.0/).
Share and Cite
Borowski, M. Hotel Adapted to the Requirements of an nZEB Building—Thermal Energy Performance and Assessment of Energy Retrofit Plan. Energies 2022, 15, 6332. https://doi.org/10.3390/en15176332
Borowski M. Hotel Adapted to the Requirements of an nZEB Building—Thermal Energy Performance and Assessment of Energy Retrofit Plan. Energies. 2022; 15(17):6332. https://doi.org/10.3390/en15176332
Chicago/Turabian StyleBorowski, Marek. 2022. "Hotel Adapted to the Requirements of an nZEB Building—Thermal Energy Performance and Assessment of Energy Retrofit Plan" Energies 15, no. 17: 6332. https://doi.org/10.3390/en15176332