

Simulation and Study of DC Corona Discharge Characteristics of Bar-Plate Gap

Abstract
:1. Introduction
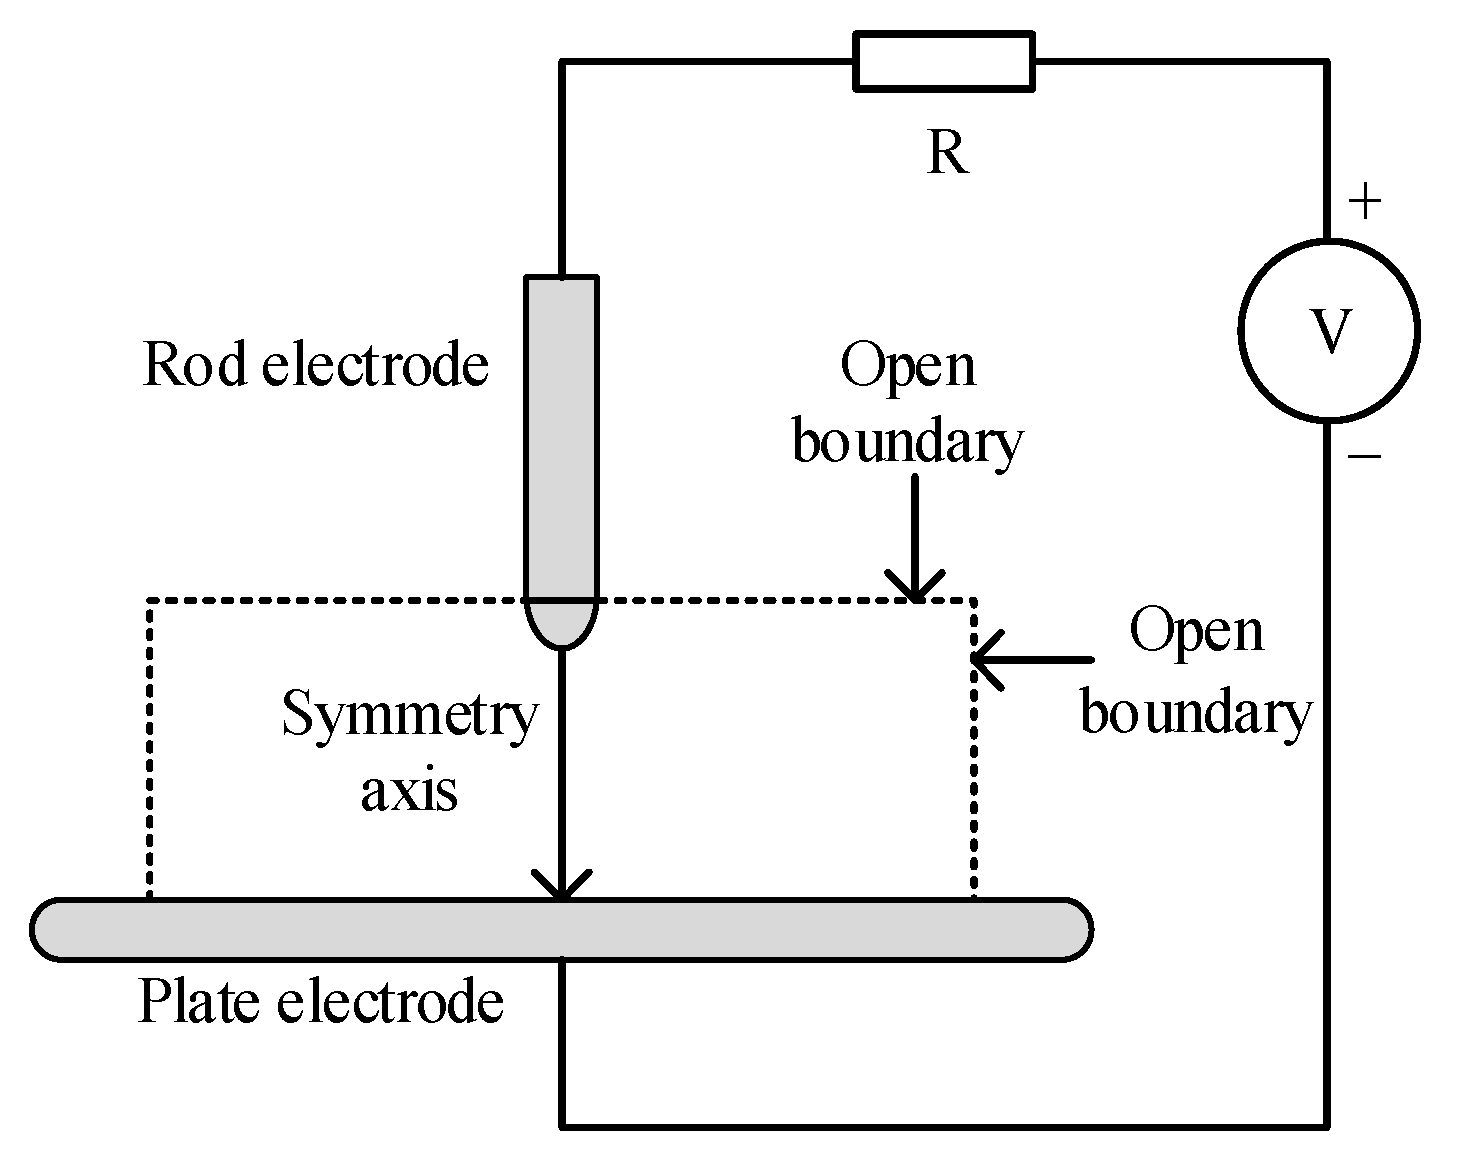
2. Corona Discharge Model of Bar-Plate Gap
2.1. Hydrodynamic Governing Equation
2.2. Air Electrochemical Reaction Process
2.3. Boundary Conditions and Algorithm Model
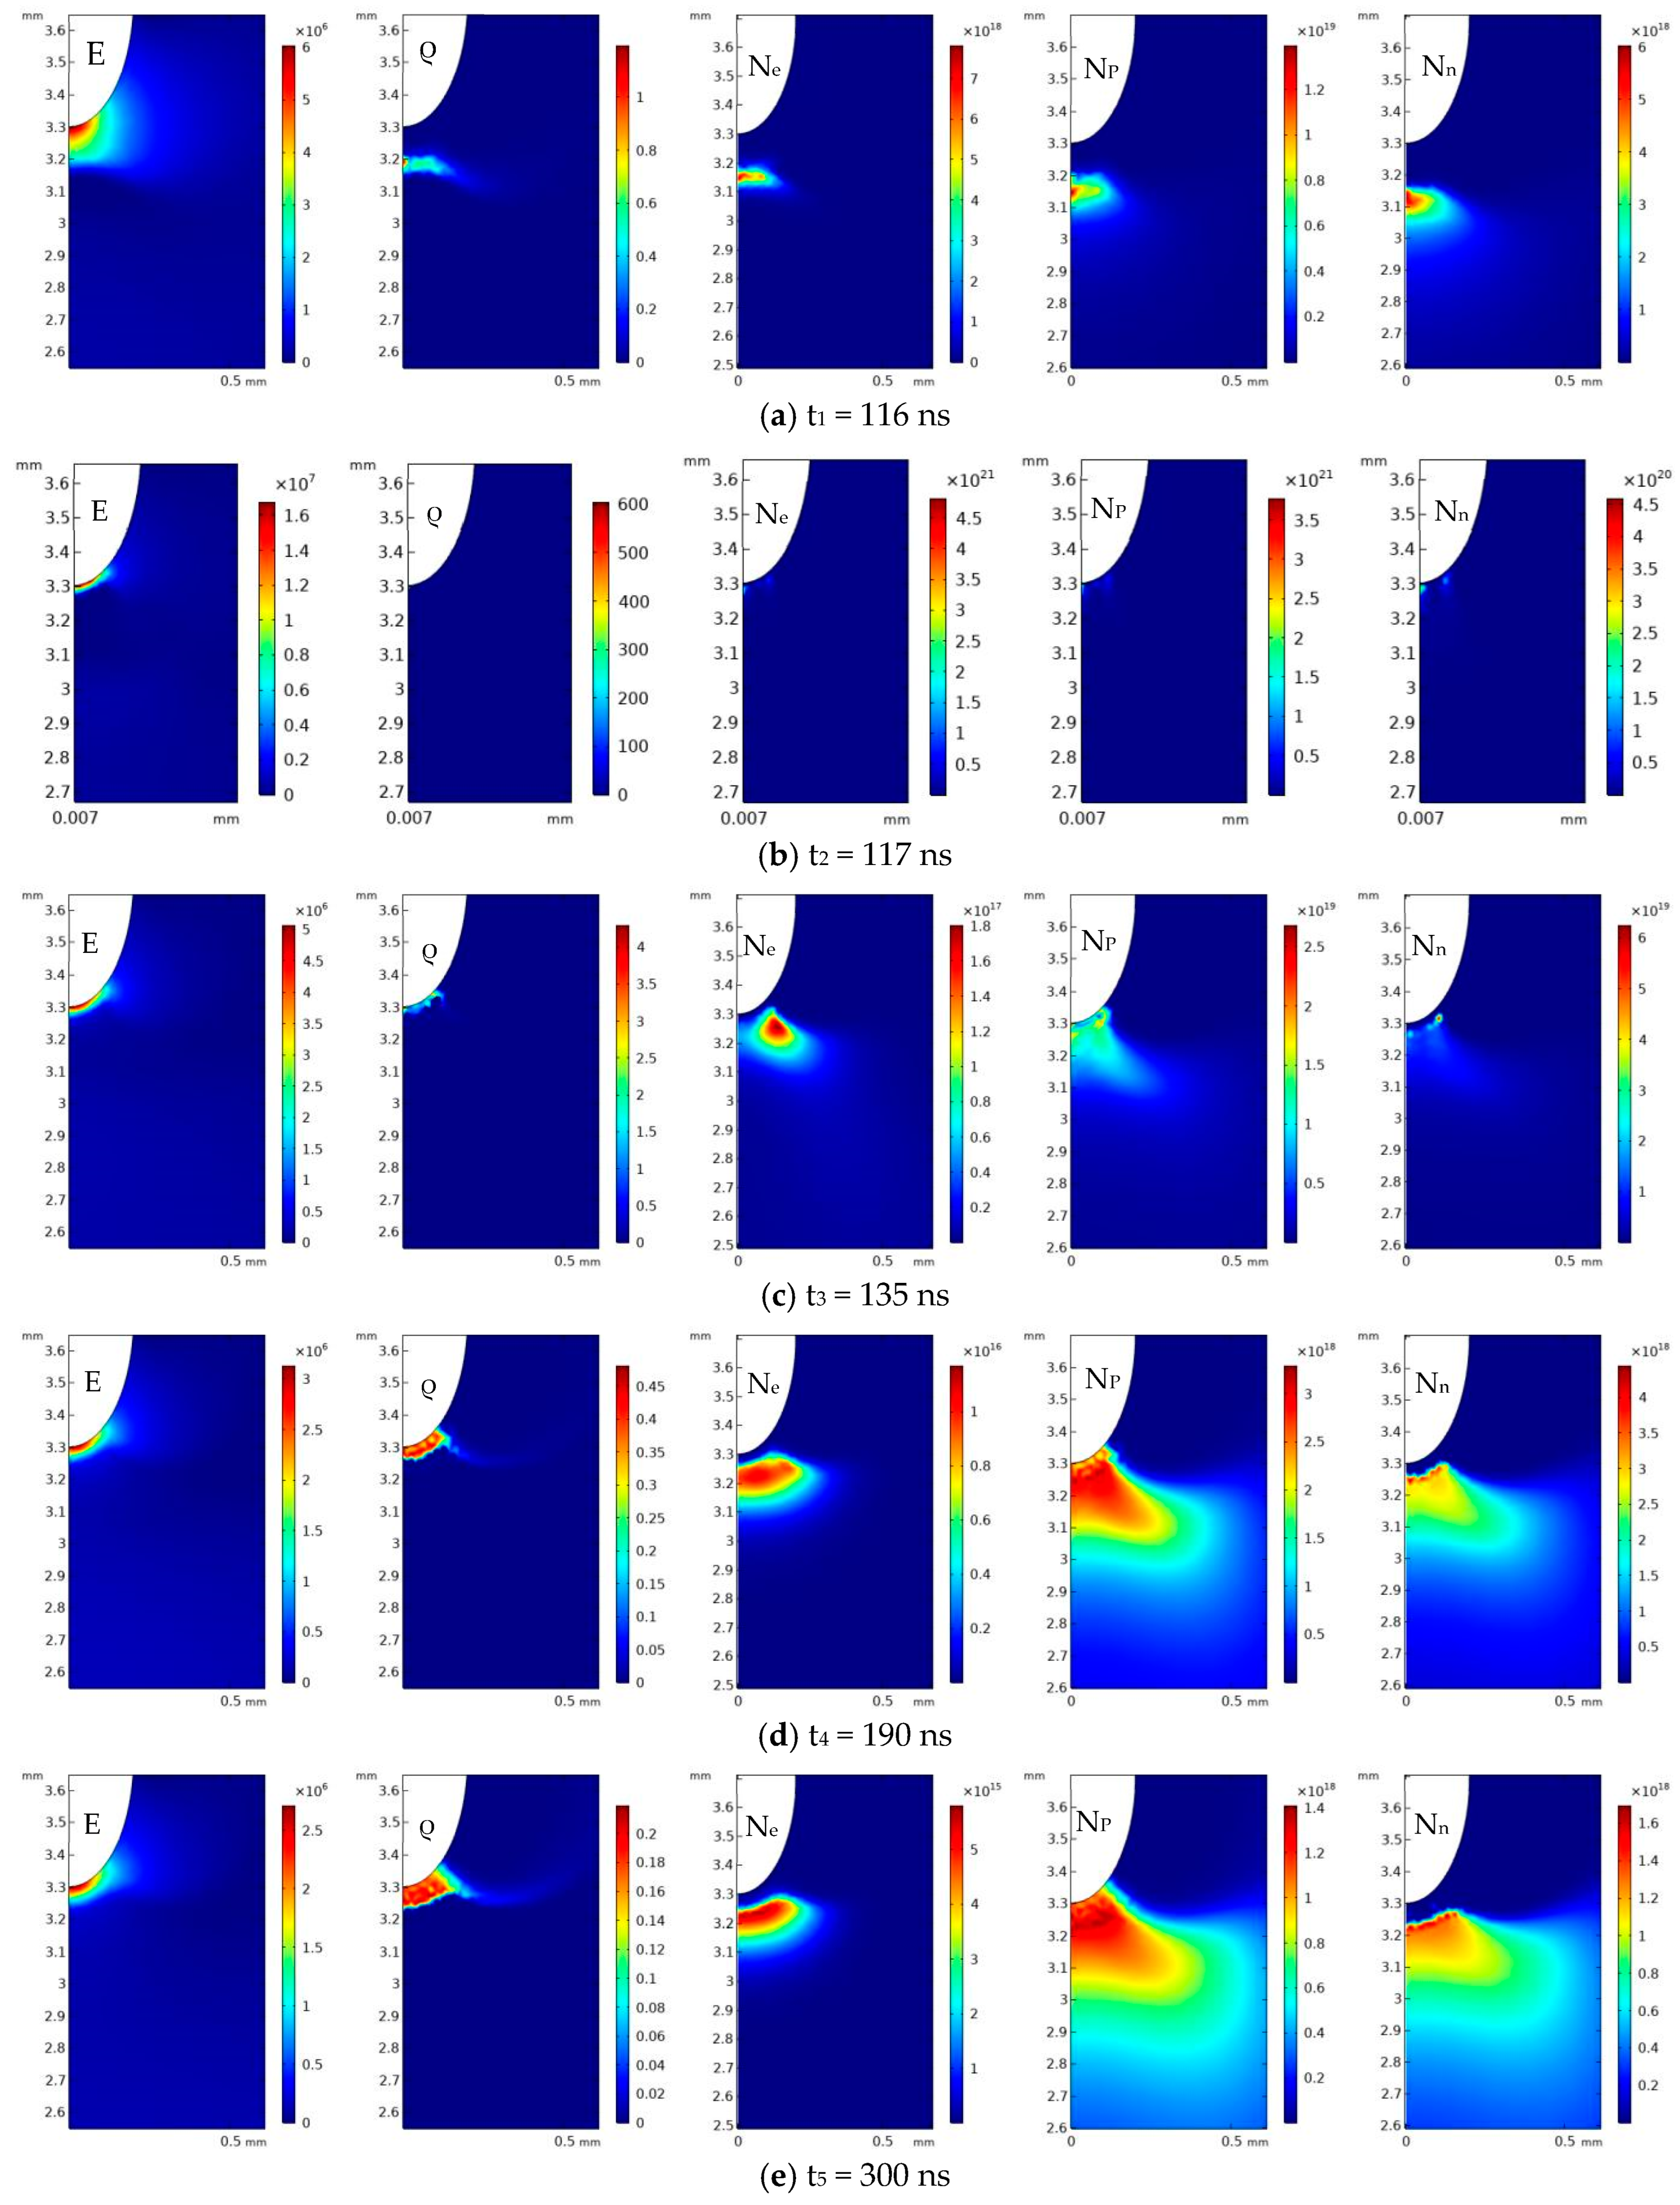
3. Air Negative Corona Discharge Morphology Analysis
4. Research on Plasma Chemical Reaction
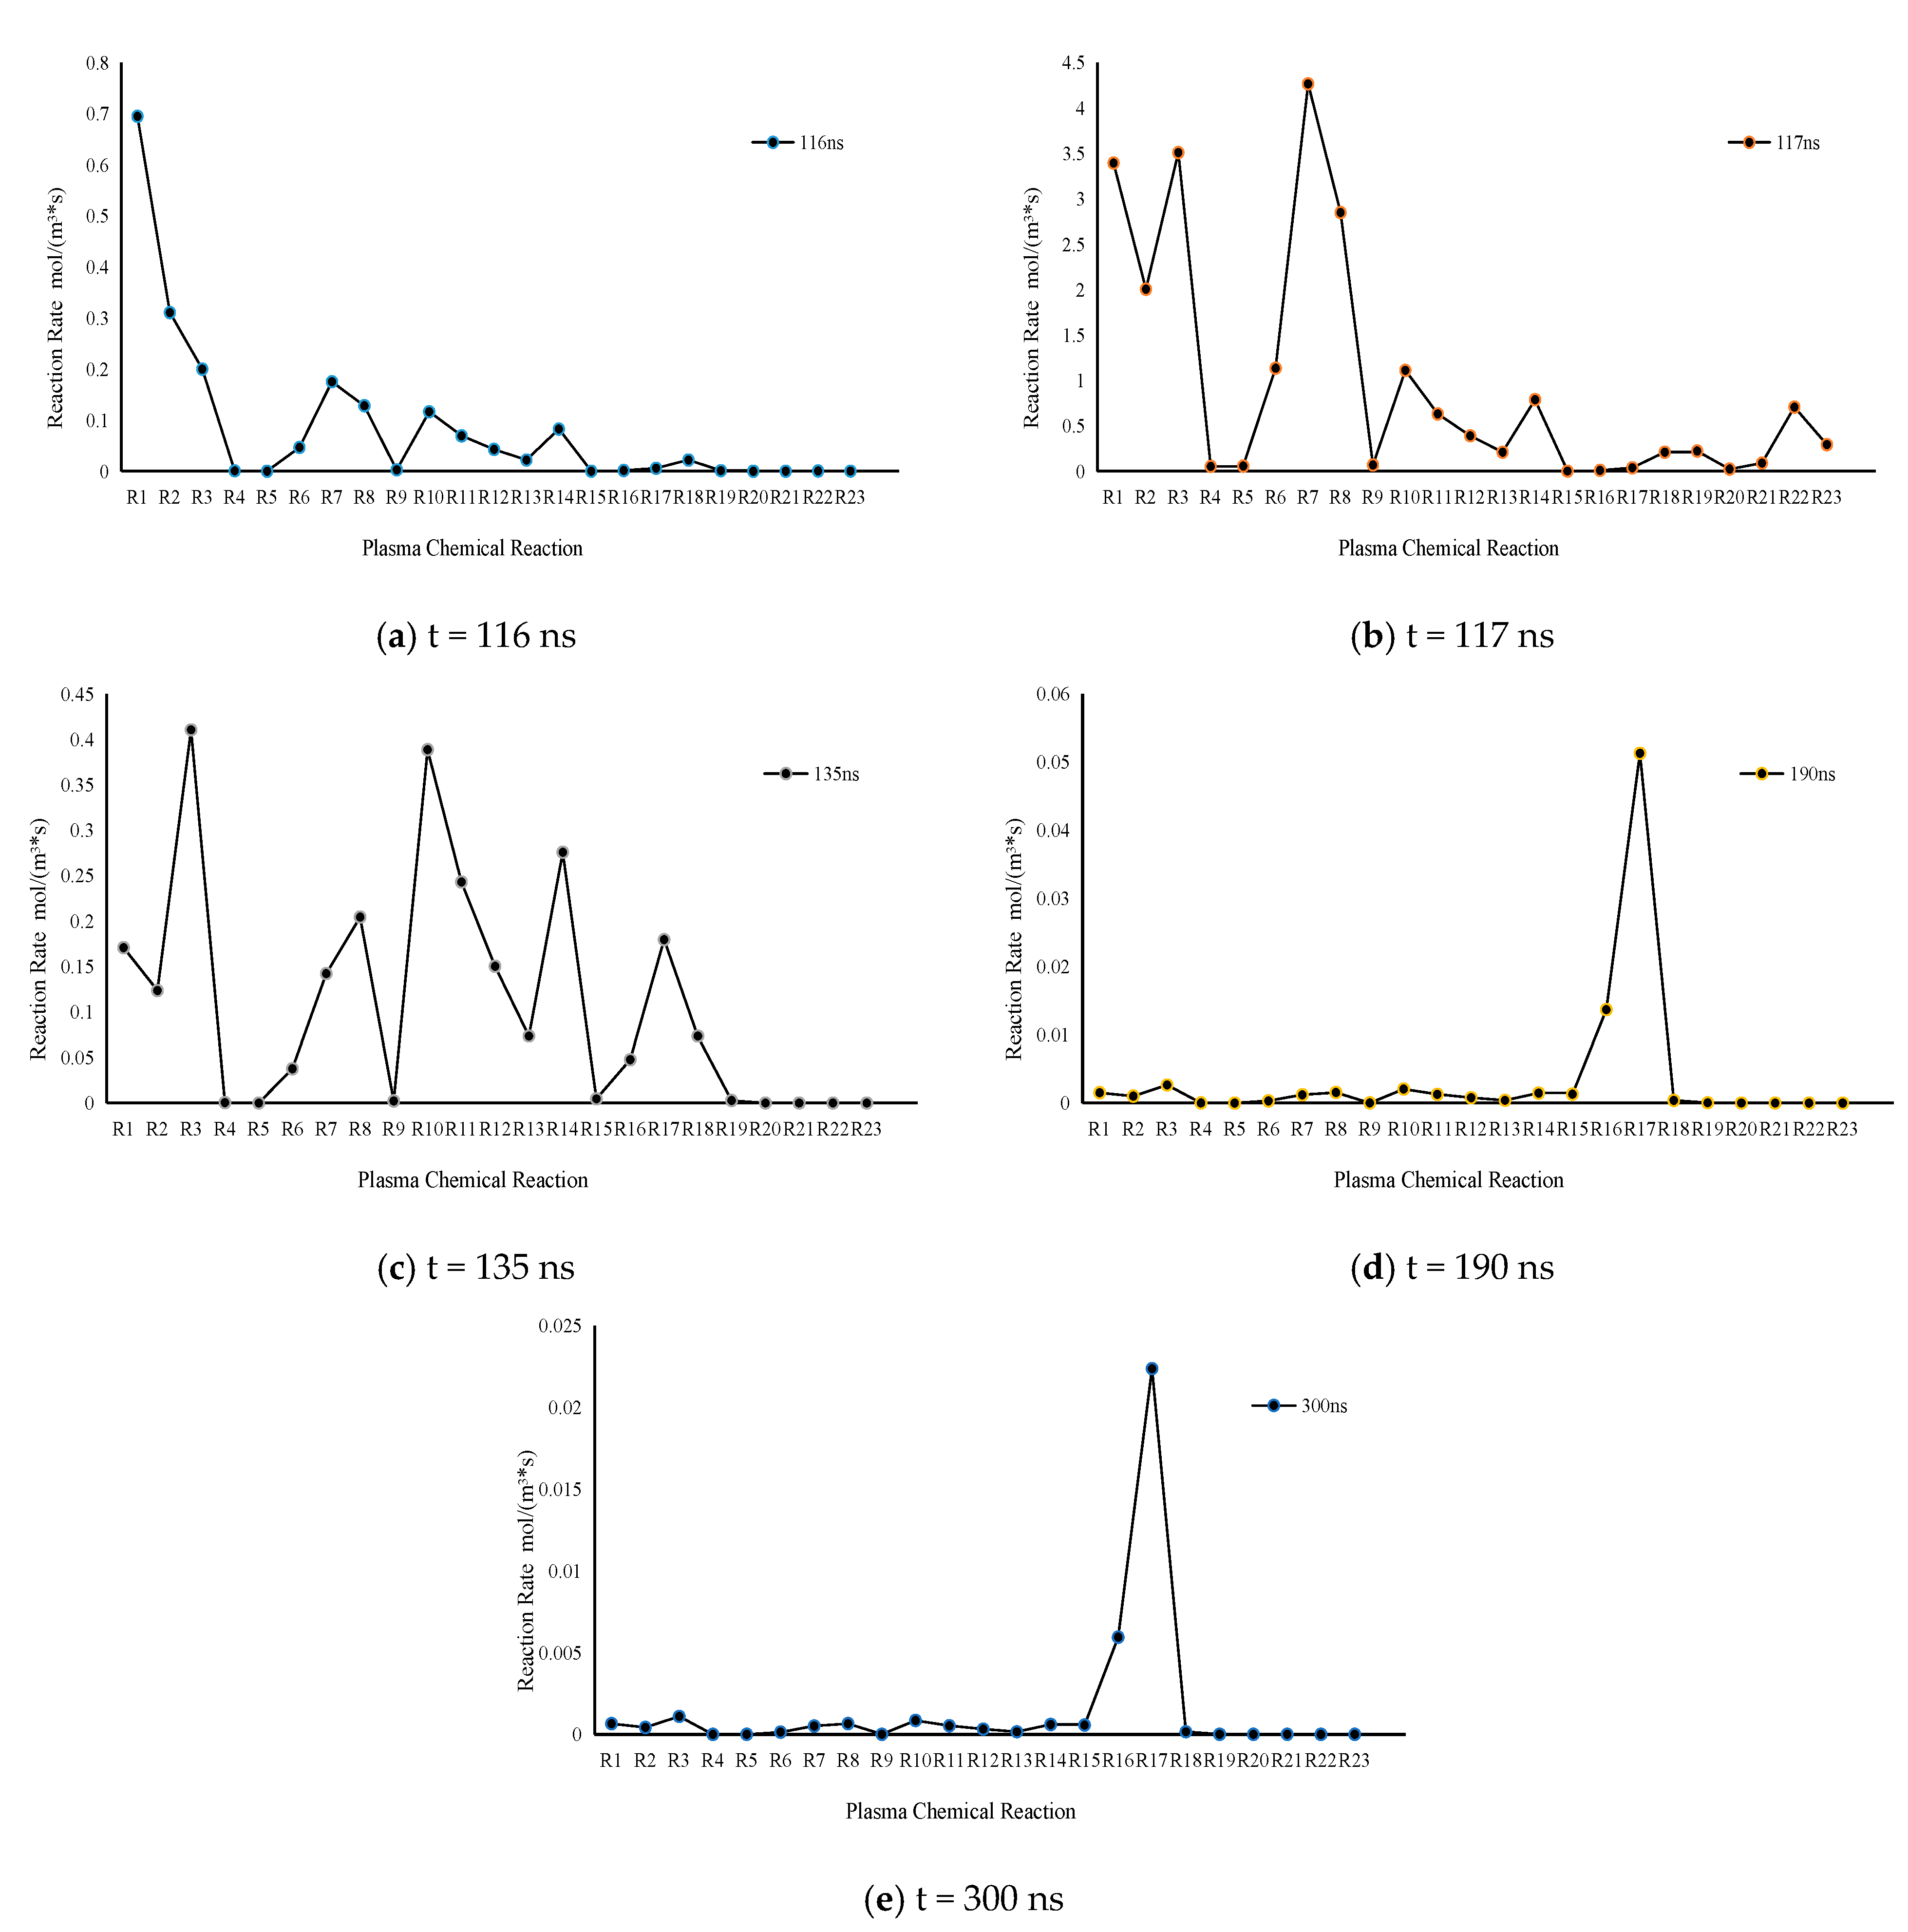
4.1. Importance Analysis of Chemical Reactions
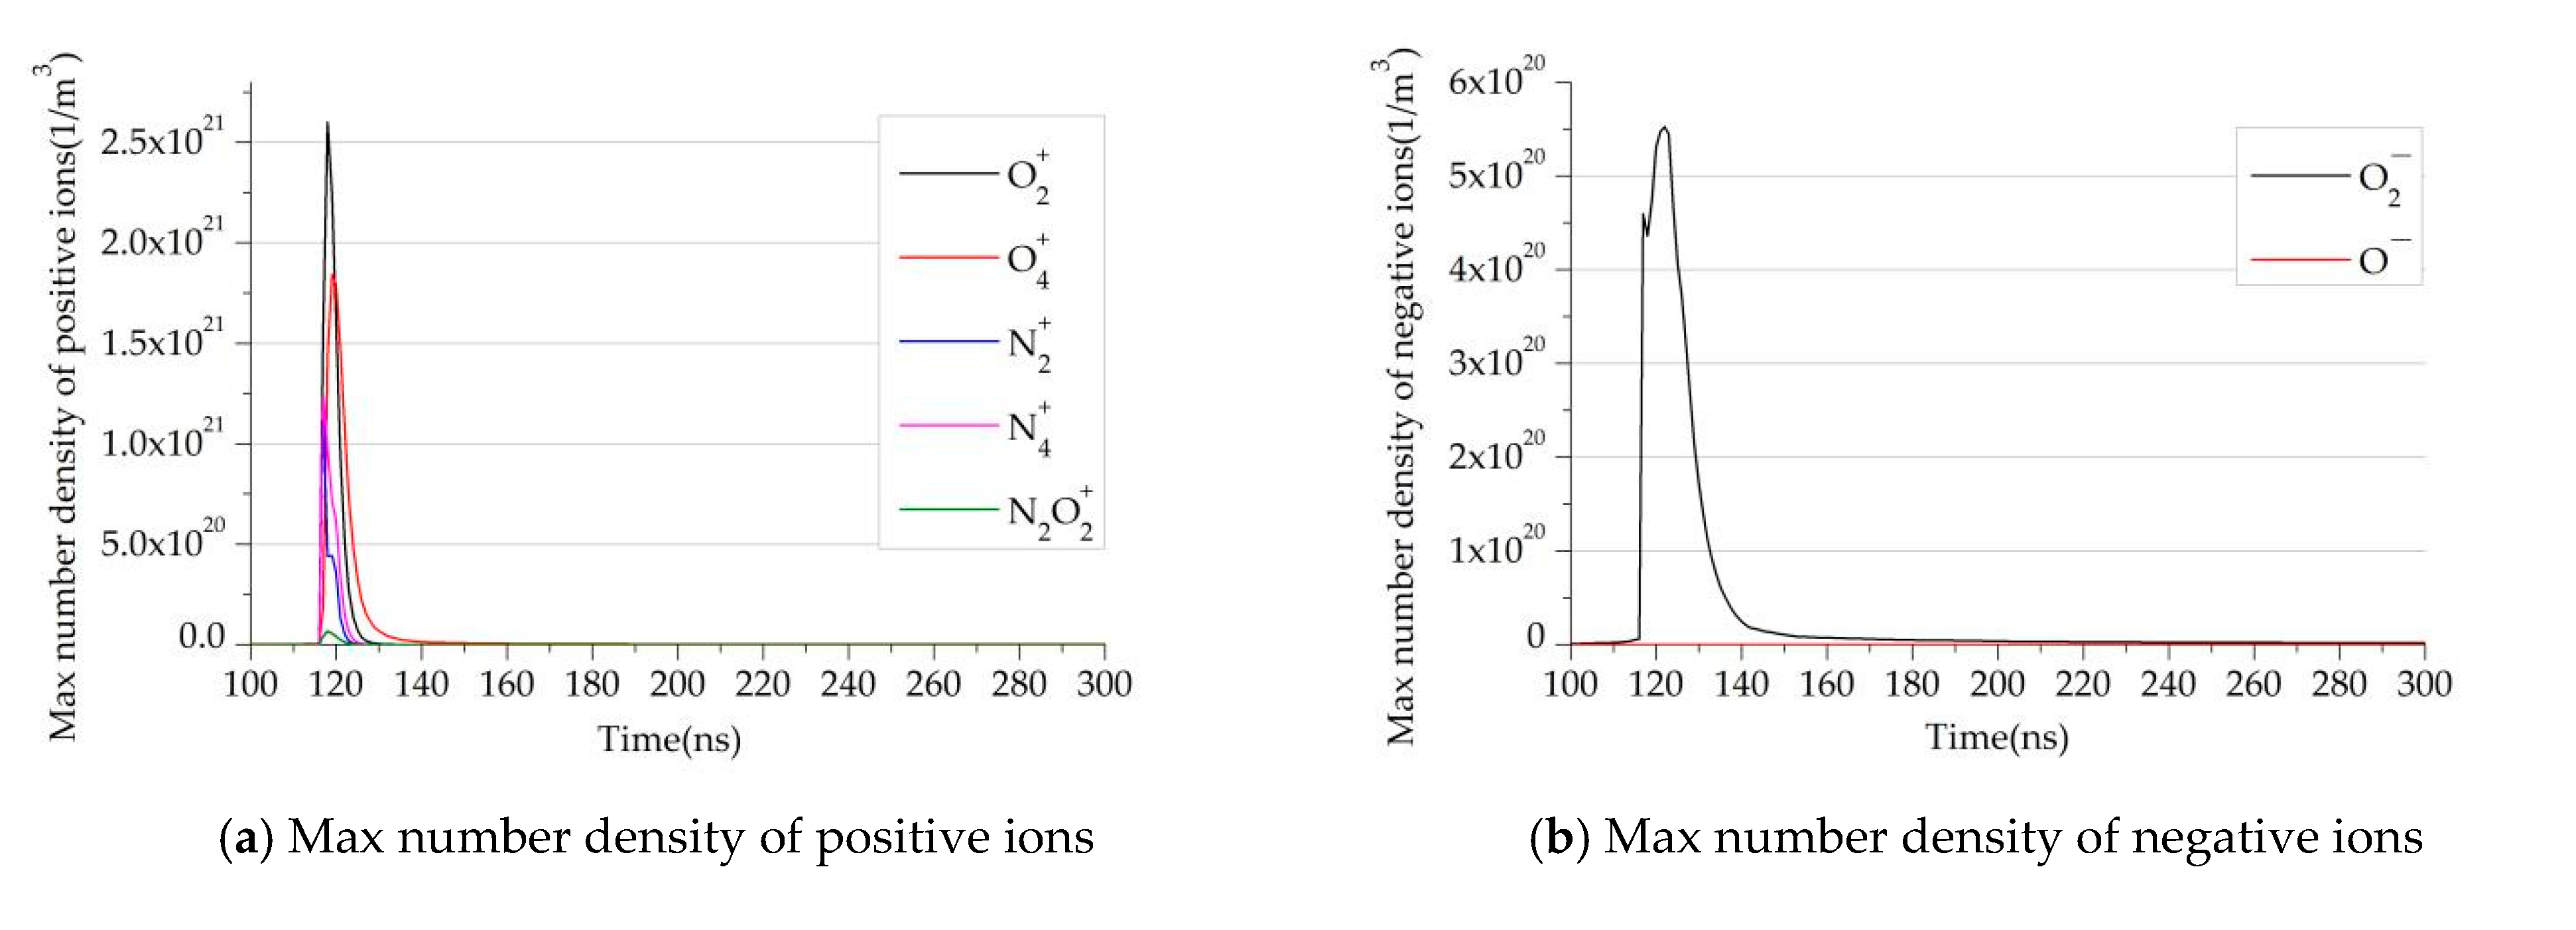
4.2. Distribution of Heavy Particles
5. Conclusions
- (1)
- A negative corona discharge model based on the plasma discharge model, in which collision ionization reaction, charge transfer reaction, recombination reaction, electron adsorption reaction, and surface reaction are considered, is proposed.
- (2)
- When the rod applied voltage is −1 kV, the discharge current curve shows a pulse change trend. Within a discharge pulse cycle, the curve can be divided into the current rising stage, the current falling stage, the current tending to stable stage, and the current stable stage. At the same time, the distribution morphology of particles at different stages of corona discharge is obtained, which is highly consistent with the literature results.
- (3)
- In the process of negative corona discharge, the maximum reaction rate indicates the importance of plasma reaction at each stage. The collision ionization reactions (e.g., R1 and R2) and electron adsorption reaction (e.g., R3) play a primary role in the current rising period, resulting in an increase in charged particles and the formation of an electron avalanche. In the current drop phase, all reaction rates decreased. Except for collision ionization and electron attachment, partial charge transfer reactions (e.g., R8, R10, R11, and R14) and composite reactions (e.g., R16, R17, and R18) begin to play their role, making the number of charged ions in the gap gradually decrease. Composite reactions (e.g., R16 and R17) are mainly present in the current stabilization stage, and the other reaction rates are almost zero. The corona discharge is over.
- (4)
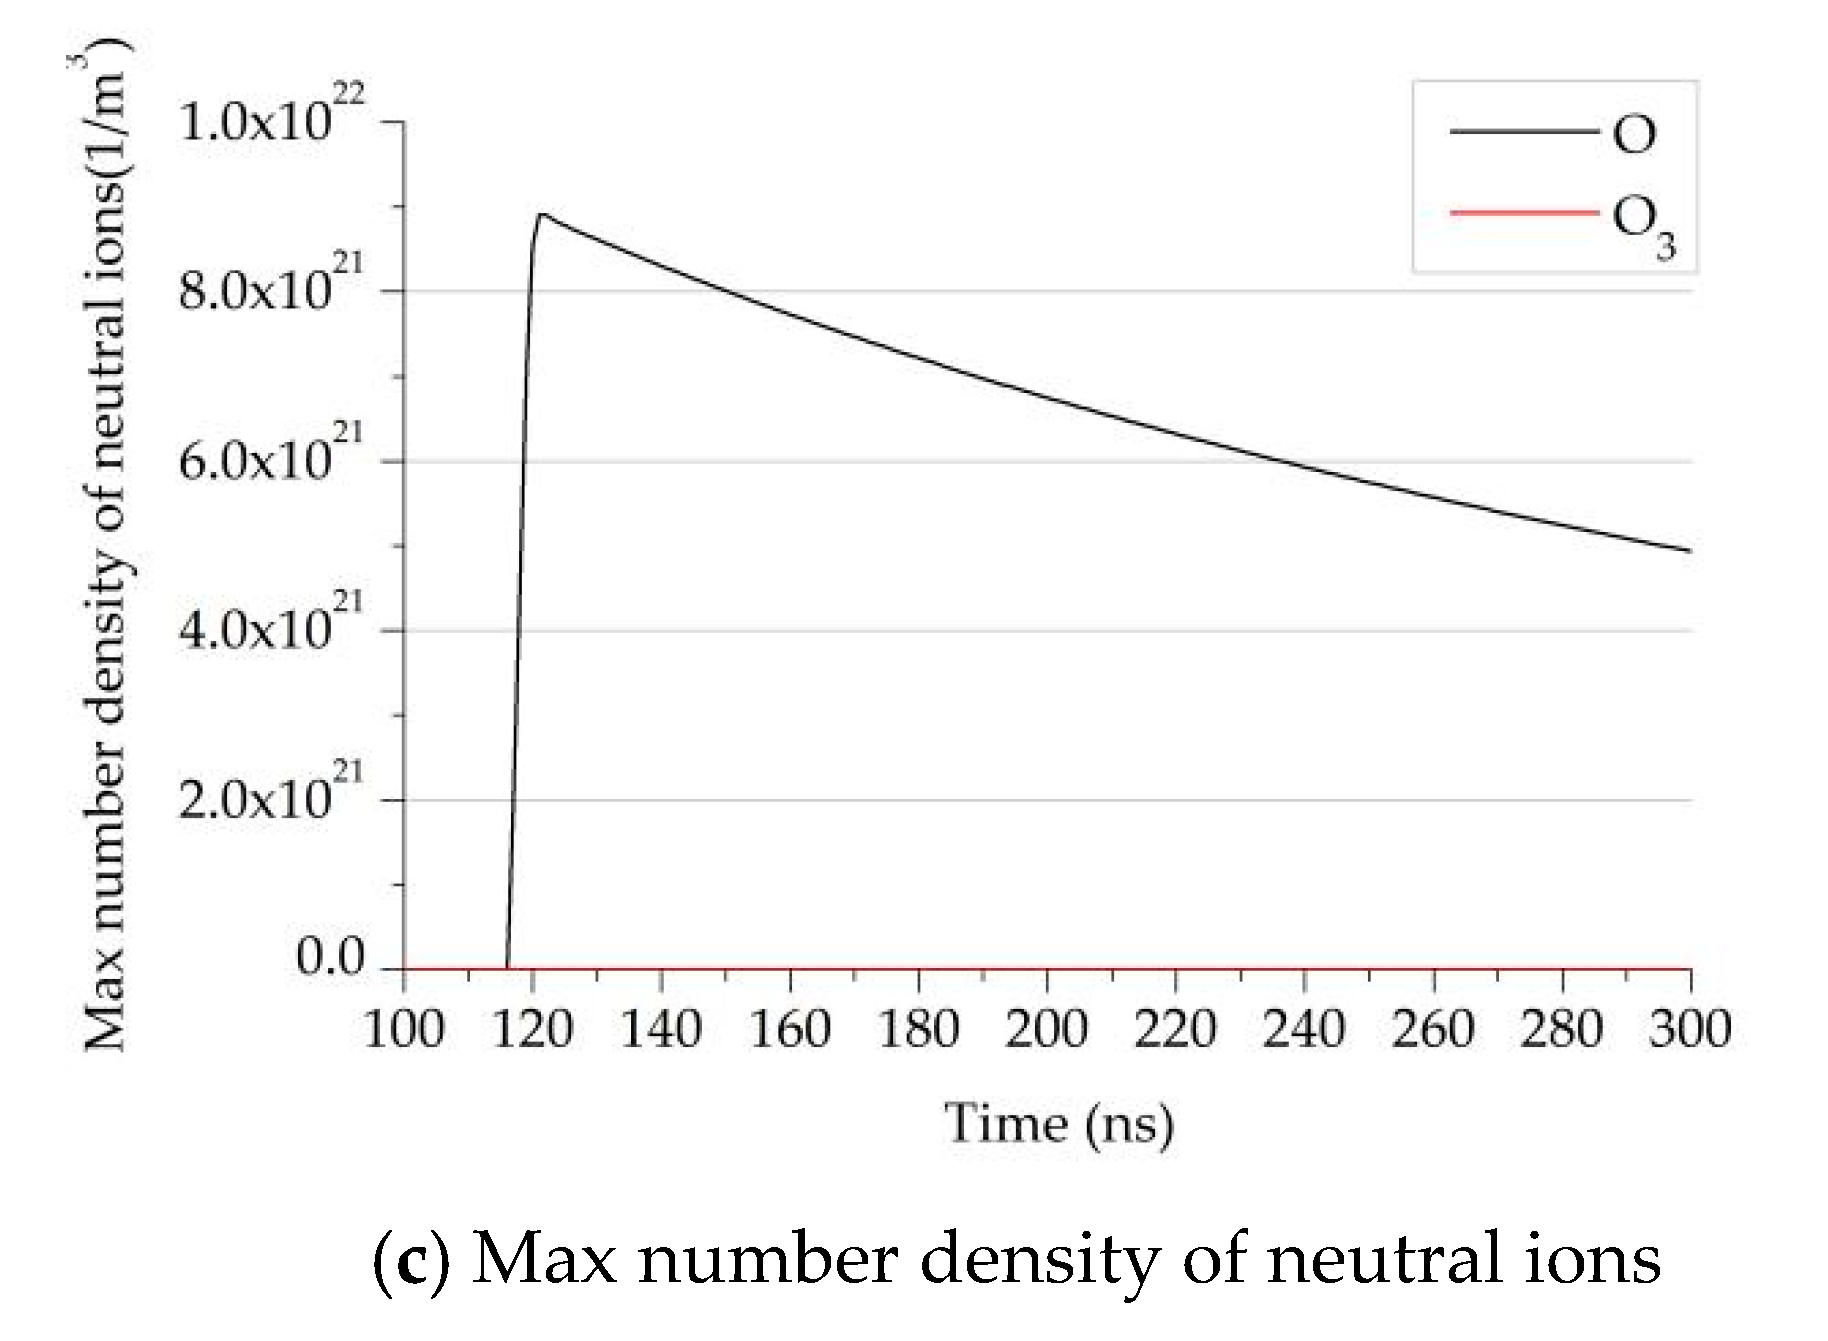
- Among all the particles involved in the plasma reactions, the positive ion number density of O2+ and O4+ accounts for the most significant proportion of all positive ions, and the negative ion O2− is the most abundant particle. The neutral particle is mainly O except for N2 and O2. The neutral particles have little influence on the ionization reaction and corona discharge.
Author Contributions
Funding
Institutional Review Board Statement
Informed Consent Statement
Data Availability Statement
Conflicts of Interest
References
- Sun, J.; Sun, L.; Chen, W.; Li, Z.; Yan, X.; Xu, Y. Metal particle movement and distribution characteristics under AC voltage and ball-plane electrodes. High Volt. 2019, 4, 138–143. [Google Scholar] [CrossRef]
- Xu, P.; Zhang, B.; He, J.; Chen, S. Influence of humidity on the characteristics of negative corona discharge in air. Phys. Plasmas 2015, 22, 093514. [Google Scholar] [CrossRef]
- Xu, P.; Zhang, B.; Chen, S.; He, J. Influence of humidity on the characteristics of positive corona discharge in air. Phys. Plasmas 2016, 23, 063511. [Google Scholar] [CrossRef]
- Kokovin, A.O.; Kozyrev, A.V.; Kozhevnikov, V.Y. Simulation of negative corona discharge in atmospheric air: From mode of Trichel pulses to stationary discharge. J. Phys. Conf. Ser. 2021, 2064, 12024. [Google Scholar] [CrossRef]
- Fofana, I.; Beroual, A. A model for long air gap discharge using an equivalent electrical network. IEEE Trans. Dielectr. Electr. Insul. 1996, 3, 273–282. [Google Scholar] [CrossRef]
- Liang, H.; Du, B.; Li, J.; Du, Q. Numerical simulation on the surface charge accumulation process of epoxy insulator under needle-plane corona discharge in air. IET Sci. Meas. Technol. 2017, 12, 9–16. [Google Scholar] [CrossRef]
- Liu, K.; Liao, R.; Zhao, X. Numerical simulation of the characteristics of electrons in bar-plate dc negative corona discharge based on a plasma chemical model. J. Electr. Eng. Technol. 2015, 10, 1804–1814. [Google Scholar] [CrossRef]
- Ayubi, B.I.; Zhang, L.; Sun, Y.; Qi, Y.Y. Fluid-Kinetic Model for Numerical Simulation of Gas-Solid Insulation Surface Discharge. In Proceedings of the SCEMS 2020-3rd Student Conference on Electric Machines and Systems (SCEMS 2020), Jinan, China, 4–6 December 2020. [Google Scholar] [CrossRef]
- Chen, S.; Nobelen, J.C.P.Y.; Nijdam, S. A self-consistent model of ionic wind generation by negative corona discharges in air with experimental validation. Plasma Sour. Sci. Technol. 2017, 26, 095005. [Google Scholar] [CrossRef]
- Gao, Q.; Niu, C.; Adamiak, K.; Rong, M.; Wang, X. Numerical simulation of negative point-plane corona discharge mechanism in SF6 gas. Plasma Sour. Sci. Technol. 2018, 27, 115001. [Google Scholar] [CrossRef]
- Wu, F.; Liao, R.; Wang, K.; Yang, L.; Grzybowski, S. Numerical Simulation of the Characteristics of Heavy Particles in Bar-Plate DC Positive Corona Discharge Based on a Hybrid Model. IEEE Trans. Plasma Sci. 2014, 42, 868–878. [Google Scholar] [CrossRef]
- Peng, Y.; Chen, X.; Deng, Y.; Lei, L.; Haoyu, Z.; Pei, X.; Chen, J.; Yuan, Y.; Wen, X. Kinetic study of key species and reactions of atmospheric pressure pulsed corona discharge in humid air. Plasma Sci. Technol. 2022, 24, 055404. [Google Scholar] [CrossRef]
- Liao, R.J.; Wu, F.F.; Yang, L.J.; Wang, K.; Zhou, Z.; Liu, K.L. Investigation on microcosmic characteristics of Trichel pulse in bar-plate DC negative corona discharge based on a novel simulation model. Int. Rev. Electr. Eng. 2013, 8, 504–512. [Google Scholar]
- He, Y.; Sun, A.; Xue, J.; Shen, Z.; Zhang, X.; Zhang, G. Experimental study on pulse characteristics of negative corona discharge in SF6/N2 gas mixtures under DC voltages. AIP Adv. 2020, 10, 055027. [Google Scholar] [CrossRef]
- Sima, W.; Peng, Q.; Yang, Q.; Yuan, T.; Shi, J. Study of the characteristics of a streamer discharge in air based on a plasma chemical model. IEEE Trans. Dielectr. Electr. Insul. 2021, 19, 2. [Google Scholar] [CrossRef]
- Gazeli, O.; Lazarou, C.; Niu, G.; Anastassiou, C.; Georghiou, G.; Franzke, J. Propagation dynamics of a helium micro-tube plasma: Experiments and numerical modeling. Spectrochim. Acta Part B At. Spectrosc. 2021, 7, 106248. [Google Scholar] [CrossRef]
- Wang, J.; Guo, R.; Ping, A.; Liu, T.; Han, S.; Li, Q. Research on numerical simulation for partial discharge of epoxy interface excited by high-frequency sinusoidal voltage. High Volt. 2021, 7, 439–451. [Google Scholar] [CrossRef]
- Nikonov, V.; Bartnikas, R.; Wertheimer, M.R. Surface charge and photoionization effects in short air gaps undergoing discharges at atmospheric pressure. J. Phys. D Appl. Phys. 2001, 34, 2979. [Google Scholar] [CrossRef]
- Mahadevan, S.; Raja, L. Simulations of direct- current air glow discharge at pressures 1Torr: Discharge model validation. J. Appl. Phys. 2010, 107, 093304. [Google Scholar] [CrossRef]
- Plasma Data Exchange Project. Available online: https://fr.lxcat.net (accessed on 10 November 2021).
- Farouk, T.; Farouk, B.; Staack, D.; Gutsol, A.; Fridman, A. Simulation of dc atmospheric pressure argon micro glow-discharge. Plasma Sour. Sci. Technol. 2006, 15, 676–688. [Google Scholar] [CrossRef]
- Tran, T.N.; Golosnoy, I.O.; Lewin, P.L.; Georghiou, G. Numerical modelling of negative discharges in air with experimental validation. J. Phys. D Appl. Phys. 2010, 44, 15203. [Google Scholar] [CrossRef] [Green Version]
- Morrow, R.; Sato, N. Discharge current induced by the motion of charged particles in time-dependent electric fields; Sato’s equation extended. J. Phys. D Appl. Phys. 1999, 32, L20. [Google Scholar] [CrossRef]


| No. | Reaction Process | Rate Coefficient 1 | ΔE 2 |
|---|---|---|---|
| R1 | N2 + e=>2e + N2+ | f(ε) | 15.6 |
| R2 | O2 + e=>2e + O2+ | F(ε) | 12.1 |
| R3 | 2O2 + e=>O2 + O2− | 6.0 × 10−39Te−1 | |
| R4 | O4+ + e=>2O2 | 2.42 × 10⁻¹¹Te−0.5 | |
| R5 | O2+ + e=>2O | 6.0 × 10⁻¹¹Te−1 | |
| R6 | N2 + +N2 + O2=>N4+ + O2 | 5.0 × 10−41 | |
| R7 | N2+ + N2 + N2=>N4+ + N2 | 5.0 × 10−41 | |
| R8 | N4+ + O2=>O2+ + 2N2 | 2.5 × 10⁻¹⁶ | |
| R9 | N2+ + O2=>O2+ + N2 | 1.04 × 10⁻¹⁵T−0.5 | |
| R10 | 2N2 + O2+=>N2O2+ + N2 | 8.1 × 10−38T−2 | |
| R11 | N2O2+ + N2=>O2+ + 2N2 | 14.8T−5.3exp(−2357/T) | |
| R12 | N2O2+ + O2=>O4+ + N2 | 1.0 × 10⁻¹⁵ | |
| R13 | O2+ + O2 + O2=>O4+ + O2 | 2.04 × 10⁻³⁴T−3.2 | |
| R14 | O2+ + O2 + N2=>O4+ + N2 | 2.04 × 10⁻³⁴T−3.2 | |
| R15 | O4+ + O2−=>3O2 | 1.0 × 10⁻¹³ | |
| R16 | O4+ + O2− + O2=>3O2 + O2 | 2.0 × 10−37 | |
| R17 | O4+ + O2− + N2=>3O2 + N2 | 2.0 × 10−37 | |
| R18 | O2+ + O2−+O2=>2O2 + O2 | 2.0 × 10−37 | |
| R19 | O2+ + O2− + N2=>2O2 + N2 | 2.0 × 10−37 | |
| R20 | O + O2 + O2=>O3 + O2 | 2.5 × 10−46 | |
| R21 | O + O2 + N2=>O3 + N2 | 2.5 × 10−46 | |
| R22 | e + N2+ + N2=>2N2 | 6.07 × 10⁻³⁴Te−2.5 | |
| R23 | N2+ + 2e=>N2 + e | 5.651 × 10⁻²⁷Te−0.8 |
| No. | Surface Reaction Process | Adhesion Coefficient |
|---|---|---|
| S1 | O2+=>O2 | 1 |
| S2 | N2+=>N2 | 1 |
| S3 | N4+=>2N2 | 1 |
| S4 | N2O2+=>2N2+O2 | 1 |
| S5 | O4+=>2O2 | 1 |
| S6 | O2−=>O2 | 1 |
| S7 | O−=>0.5O2 | 1 |
| S8 | O=>0.5O2 | 1 |
| Particle | Maximum Number Density of Heavy Particles/m−3 | ||||
|---|---|---|---|---|---|
| 116 ns | 117 ns | 135 ns | 190 ns | 300 ns | |
| O2+ | 5.7 × 10¹⁸ | 1.5 × 10²¹ | 8.8 × 10¹⁷ | 4.0 × 10¹⁶ | 1.5 × 10¹⁶ |
| O4+ | 5.9 × 10¹⁸ | 1.8 × 10²⁰ | 2.6 × 10¹⁹ | 3.3 × 10¹⁸ | 1.4 × 10¹⁸ |
| N2+ | 3.3 × 10¹⁸ | 1.1 × 10²¹ | 8.3 × 10¹⁶ | 5.1 × 10¹⁵ | 1.9 × 10¹⁵ |
| N4+ | 2.0 × 10¹⁸ | 1.2 × 10²¹ | 1.8 × 10¹⁷ | 9.5 × 10¹⁵ | 3.5 × 10¹⁵ |
| N2O2+ | 1.5 × 10¹⁷ | 4.2 × 10¹⁹ | 2.3 × 10¹⁶ | 1.0 × 10¹⁵ | 3.9 × 10¹⁴ |
| O− | 6.1 × 10⁸ | 6.2 × 10⁸ | 4.7 × 10¹⁰ | 1.5 × 10¹⁰ | 5.3 × 10⁹ |
| O2− | 6.0 × 10¹⁸ | 4.6 × 10²⁰ | 6.2 × 10¹⁹ | 4.4 × 10¹⁸ | 1.7 × 10¹⁸ |
| O | 6.8 × 10¹¹ | 1.1 × 10¹⁷ | 8.9 × 10⁸ | 4.2 × 10⁶ | 1.6 × 10⁶ |
| O3 | 5.3 × 10¹⁷ | 2.0 × 10²¹ | 8.4 × 10²¹ | 7.0 × 10²¹ | 4.9 × 10²¹ |
Publisher’s Note: MDPI stays neutral with regard to jurisdictional claims in published maps and institutional affiliations. |
© 2022 by the authors. Licensee MDPI, Basel, Switzerland. This article is an open access article distributed under the terms and conditions of the Creative Commons Attribution (CC BY) license (https://creativecommons.org/licenses/by/4.0/).
Share and Cite
Feng, N.; Ma, T.; Chen, C.; Yao, B.; Gao, W. Simulation and Study of DC Corona Discharge Characteristics of Bar-Plate Gap. Energies 2022, 15, 6431. https://doi.org/10.3390/en15176431
Feng N, Ma T, Chen C, Yao B, Gao W. Simulation and Study of DC Corona Discharge Characteristics of Bar-Plate Gap. Energies. 2022; 15(17):6431. https://doi.org/10.3390/en15176431
Chicago/Turabian StyleFeng, Na, Tiehua Ma, Changxin Chen, Boren Yao, and Weitao Gao. 2022. "Simulation and Study of DC Corona Discharge Characteristics of Bar-Plate Gap" Energies 15, no. 17: 6431. https://doi.org/10.3390/en15176431
APA StyleFeng, N., Ma, T., Chen, C., Yao, B., & Gao, W. (2022). Simulation and Study of DC Corona Discharge Characteristics of Bar-Plate Gap. Energies, 15(17), 6431. https://doi.org/10.3390/en15176431