Abstract
The present paper demonstrates a proof-of-concept by introducing a variable guide vane system in the draft tube of a high-head Francis model turbine. The aim is to examine the hydraulic performance of the turbine while mitigating the pressure pulsations in the draft tube. The guide vanes can rotate about an axis up to ±45°. The pressure pulsations mitigation studies were performed at lower- and upper-part loads. The hydraulic performance was examined at all operating ranges within the turbine head. There were six guide vane configurations considered between ±45°. The findings demonstrate that the highest efficiency loss with a guide vane configuration that mitigates the pressure pulsations is marginal, with modest improvements at the best efficiency point. The pressure pulsations are 100% mitigated at the lower part load, and there is a maximum decrement in the pressure pulsations up to 80% at the upper part load. The study demonstrates that such a system can improve the operational flexibility of the hydro-turbine by mitigating the pressure pulsations and marginally affecting its hydraulic performance.
1. Introduction
Hydropower research has primarily focused on supporting intermittent energy requirements in recent years [1]. The goal is to achieve the flexible operation of the turbine that could cater to such varying energy demands [1,2]. The flexible operation of the turbine refers to the increase in the start-stop function of the turbine per day and longer runtime at off-design conditions without significantly compromising the turbine’s efficiency and lifespan [2]. Today, the hydro-turbines can operate efficiently near a single operating condition called the best efficiency point (BEP). At BEP, the hydraulic efficiency of the turbine is at the maximum.
The efficiency tends to decrease away from the BEP [3,4]. The risk of hydraulic efficiency compromise is higher in a single regulated turbine for operating conditions away from BEP [5]. Only the distributor guide vanes (GVs) are variable in a single regulated turbine. Hence, there are limited operational ranges at a single turbine head. Contrarily, a double-regulated turbine has flexible distributor GVs and runner blades [5]. There is a more comprehensive operating range; hence, the efficiency loss due to off-design operation is limited.
When the turbine operates at part load (PL) when Q/QBEP < 1, the formation of the rotating vortex rope (RVR) in the draft tube leading to the pressure pulsations reduces the hydraulic efficiency of the turbine [3,4,5]. The RVR pressure amplitudes dominate the pressure signals at a low frequency in the draft tube. The Fast-Fourier Transform (FFT) of a pressure signal in the draft tube can help determine the dominant RVR pressure amplitude and frequency. Moreover, the RVR can be identified by decomposing the pressure signals in the draft tube into its plunging and rotating modes. This is further explained in Section 2.4. The RVR frequency ranges between 0.2 to 0.4·f0, where f0 is the runner frequency. At high load (HL), when Q/QBEP > 1, the formation of a torch-like vortex leads to pressure pulsation sometimes and reduces the turbine efficiency slightly.
In a detailed review on the vortex breakdown in the hydro-turbines, Kumar et al. [5] explained that the vortex breakdown at PL and HL arises because the flow leaving the runner has an excess swirl. At PL, the extra swirling flow leads to flow separation in the draft tube, creating a stagnation region in the center. The flow recirculates within the stagnation region, and a high velocity wraps the stagnation zone leading to the formation of RVR. The RVR rotates in the same direction as the runner. At HL, the excess swirl direction is opposite to the runner. The vortex breakdown pressure amplitude at HL is usually less than at PL but can be large. Due to this reason, most researchers focus on further investigating the vortex phenomena at PL.
The occurrence of vortex breakdown at off-design conditions leads to pressure pulsations, pulsative pressure recovery, noise, vibration, and power swings in the turbine [5]. It contributes to an efficiency loss in the turbine. To summarize, the decreased efficiency at off-design conditions is due to (a) vortex breakdown in the draft tube and its extension up to the draft tube elbow, (b) poor pressure recovery in the draft tube cone, and (c) the effects of the vortex breakdown upstream. The vortex breakdowns can induce large instabilities in the draft tube, especially in the elbow region. Hence, prolonged operation under these conditions can lead to machine failure. Therefore, avoiding continuous operation at some operating conditions is best to preserve the turbine integrity.
The experimental studies performed by Nishi et al. [3,4], Trivedi et al. [6,7], and Goyal et al. [8,9,10,11] confirm the formation of a very low-frequency signal that had a dominating effect on the pressure signals in the draft tube and the upstream domains at PL. The low-frequency signal inside the draft tube is associated with RVR formation. According to studies by Susan-Resiga et al. [12,13], Bosioc et al. [14], Ciocan et al. [15], and Favrel et al. [16,17], the decelerated swirling flow in the draft tube at PL causes the RVR to form. The decelerated swirling flow is the product of the narrow wicket gates angle in the distributor domain of the hydro-turbine. Due to this, the draft tube experiences high-pressure fluctuations and instabilities at PL.
Several mitigation techniques exist or are underway to counteract the effects of vortex breakdown in the draft tube. Improving the turbine runner design to reduce the pressure pulsation by controlling the swirling flows exiting the runner is challenging. The design methodology of such a new runner could be very demanding and require much research and analysis, which could be an expensive process. Since < the vortex breakdown is the most dominating in the draft tube cone, researchers focus on applying cost-effective and straightforward techniques in the draft tube to mitigate pressure pulsations. The air admission technique has suppressed the RVR pressure amplitude but increased the residual plunging component, with lower amplitude and frequency [18,19,20,21,22,23,24]. An increase in the plunging mode corresponds to higher axial pressure oscillations in the draft tube. The air admission in the draft tube to mitigate the RVR decreases efficiency in the Francis turbine [18,19,20,21,22,23,24]. The maximum decrement observed was when the air injection was from the central region of the runner. The minimum decrease in the turbine efficiency was when the infusion was from the periphery of the draft tube. This maximum efficiency drop of this technique was 10% at Q/QBEP = 0.8, which could be considered significant. Predicting the required air discharge rate in the draft tube without adversely affecting the turbine performance remains challenging. Moreover, the increased air injection can lead to large air bubbles in the draft tube and cavitation problems affecting the turbine structures.
The axial water jet injection technique, where water is introduced from the tip of the crown cone into the draft tube, can mitigate RVR significantly [25,26,27,28,29]. The rate of control jet discharge influences the reduction in RVR amplitude. This technique mitigates the rotating component of the RVR, but the plunging mode becomes dominant with small amplitudes. By over 30%, this method raises the pressure recovery coefficient in the draft tube [29]. The axial water injection approach also resulted in a decrease in turbine efficiency [25,26,27,28,29]. The efficiency decreased by 3.4% at Q/QBEP = 0.3 and between 0.4 to 0.9% when Q/QBEP = 0.4, which is considered reasonable. This technique is good but needs more study for the draft tube with an elbow to understand its effect on the upstream flow. For the fluid mitigation technique discussed above, the method is usually inactive at BEP. Hence, the efficiency at BEP is not affected. However, this technique also has no universal design criteria. Each turbine RVR mitigation strategy is unique and often designed through trial and error.
Modifying the geometry of the draft tube by mounting fins to the draft tube walls proved beneficial in reducing the RVR amplitude, and the flexible operation at PL increased [30,31]. The fins design was a trial-and-error methodology, which was one of the reasons for the reduction in efficiency [30,31]. There was some efficiency loss with this technique on the low and medium head turbines. The mitigation of RVR using j-grooves depends on the shape and size of the groove in the draft tube. Kurokawa et al. [32] claimed that using the j-grooves of specific dimensions mitigated the rotating stall in vaneless and vaned diffusers for almost all flow ranges studied. Their technique reduces the swirl strength by 60% in a mixed-flow pump. Though this study looks promising, the details of the efficiency of the pump with this technique were unclear. Moreover, the dimensioning approach for the grooves was unspecified. The study by Wei et al. [33,34] claimed that the j-grooves did not completely mitigate the RVR. However, some decrement in the RVR pressure amplitude was reported. Chen et al. [35] studied the effect of j grooves on the swirling flows in the Francis turbine draft tube. They say that a large radial pressure gradient due to the intense whirl of the main flow induces a radial inward jet in the groove, creating angular momentum loss when the flow enters and leaves the grooving. This study also did not mitigate the RVR completely but suppressed the RVR pressure amplitudes to some extent. Though this technique has a negligible impact on turbine efficiency, finding the groove’s shape is challenging. Therefore, this technique needs further investigation and optimization for better mitigation effects.
Adding an external object in the draft tube or modifying the turbine geometry to mitigate the RVR is a permanent change. Though it may suppress the RVR pressure amplitudes, it introduces additional hydraulic losses. Furthermore, no specified universal design criteria for such passive mitigation techniques are available. The RVR mitigation studies using exit stay apparatus, fins and j-groove techniques focussed on PL operating conditions [30,31,32,33,34,35,36]. However, their effects on other operating ranges were not investigated in detail. Therefore, there is a scope for developing new or advanced versions of existing techniques.
One such technique to achieve RVR mitigation is implementing guide vanes (GVs) in the draft tube of a hydro-turbine. Such GVs are effective and observed in jet propulsion systems [37,38]. These GVs can be either fixed or variable. In jet engines, they are placed at the machine inlet or exit to allow a swirl-free flow to enter or exit the engine. Such GVs can also be used in the hydro-turbines after the runner exit to control the swirling flow and, thus, reduce the pressure pulsations in the draft tube. In our previous work, Joy et al. [39] reported the possibility of mitigating the RVR by using a set of GV systems in the draft tube of the Francis model turbine using numerical tools. The preliminary studies claim that at least three GV systems can completely mitigate pressure pulsations in the draft tube of a Francis model turbine.
The current study’s objective is to compare the performance characteristics of a high-head Francis model turbine without and with a variable GV system in the draft tube. The primary goal is (a) to investigate the hydraulic efficiency of the turbine in the presence of GVs at all operating conditions and (b) pressure pulsations mitigations at part load conditions. The work reported by Joy et al. [39] inspired the dimensions of the GVs in the present study. However, the current research further modified the GVs to ensure their rotation. Section 2 presents the test rig, instrumentation, measurement program, and data analysis. Lastly, Section 3 extensively presents the results and main findings.
2. Materials and Methods
2.1. Model Turbine and Guide Vane System
The turbine considered for the present experimental study is the Francis-99 model turbine. The test rig location is at the waterpower laboratory at the Norwegian University of Science and Technology (NTNU), Trondheim, Norway. Figure 1a shows the test-rig experimental setup. The model turbine is a 1:5.1 scaled-down version of the prototype at Tokke power plant, Norway. The model turbine consists of a spiral casing, a distributor with 14 stay vanes and 28 guide vanes, a runner with 15 primary and 15 splitter blades, and an elbow draft tube, as shown in Figure 1b. The runner diameter is 349 mm. The draft tube cone length is 500 mm, and the draft tube cone expansion angle is 3°. The draft tube cone used in the present study has additional grooves for GVs attachment and movement, as shown in Figure 2.
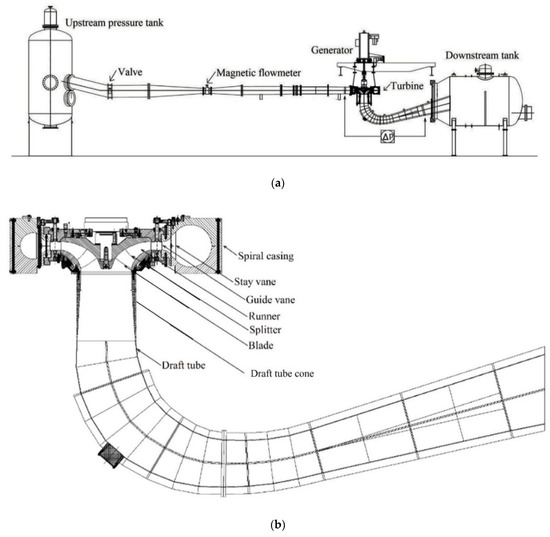
Figure 1.
(a) Schematic of the experimental setup and (b) Schematic of Francis model turbine.
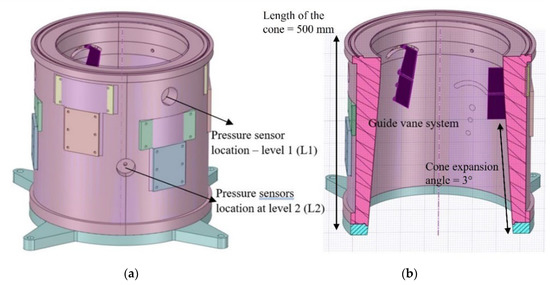
Figure 2.
The draft tube cone and pressure taps location in the Francis model turbine: (a) outer section of the cone showing the pressure taps locations; (b) inner section of the draft tube cone showing the GVs.
Three sets of GVs are distributed evenly circumferentially in the draft tube of the present study; see Figure 2. The dimensions of the GVs are normalized using the runner radius, R, see Figure 3. The GVs have a varying span, with the leading-edge span equivalent to 0.30·R. The thickness of the GVs varies between 2 mm and 4 mm to achieve a hydrodynamic profile. The distance between the draft tube inlet and the GVs leading-edge is 0.36·R. The chord length of the GVs is 0.86·R, divided into two equal hydrofoils; see Figure 3. It means that the chord length of both hydrofoils is 0.43·R. The upper hydrofoil is variable up to ±45°. The lower hydrofoil is stationary at −10° to deviate the flow to the BEP flow angle [39]; refer to Appendix D for the manufactured GV system in the draft tube. There is some clearance between the upper hydrofoil and the draft tube wall to allow movement of the GVs in the circular draft tube; see Figure 3.
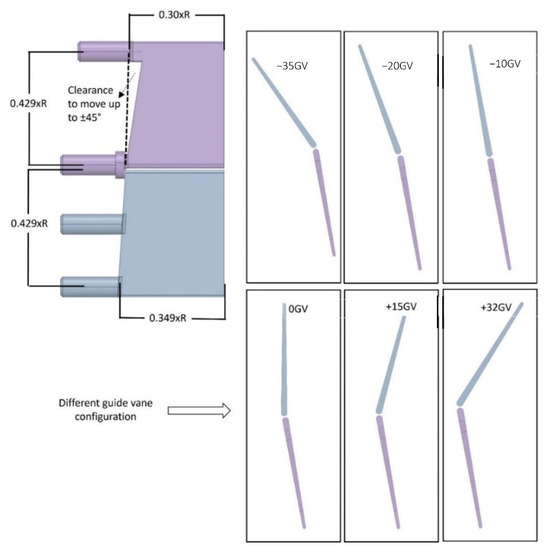
Figure 3.
Computer-aided design (CAD) model of the GV system and different configurations investigated in the present study.
2.2. Instrumentation and Calibration
The current measurement campaign and the test rig followed the IEC standards [40,41,42]. The measured parameters are discharge, rotational speed, distributor GV opening angle, hydraulic head, generator torque, casing inlet pressure, and the draft tube outlet pressure; see Table 1. The hydraulic efficiency is estimated using the variables mentioned in Equation (3). There are six pressure sensors placed at two locations in the draft tube. The first three sensors (DT1-DT3) are at 0.36·R (=L1), and DT4 to DT6 is at a 1.44·R distance below the draft tube inlet. All sensors were calibrated before the experiments using an in-house NTNU LabVIEW program. A 24-bit National Instruments (NI) cRIO model 9074 with ±60 V ADC and an in-built antialiasing filter recorded the measurement data during the experiments. The systematic uncertainty is determined using the calibration data. The random uncertainty is the standard deviation of the measured data. The combination of both systematic and random uncertainties constitutes the overall uncertainty.

Table 1.
Details of the instrumentation used in the experiments.
2.3. Measurement Program
The measurement campaign considered only steady-state operating conditions at a constant turbine head of approximately 12 m. The test rig was in a semi-closed loop setup, which means that the overhead tank was closed, and the downstream tank was open to the atmosphere. The data sampling frequency is 2 kHz, and the total data recording time is 120 s. The current study considered four operating conditions for turbine performance investigation. The four operating conditions represent the entire range of operations at a single turbine head considered in the present study. The three operating conditions of PL2, BEP, and HL are like the NVKS Francis-99 s workshop [43]. An additional operating condition at part load, PL1, is included in the performance analysis in the current study. The details of the measured operating conditions parameters are in Table 2.
Table 2.
Mean operational parameters of the Francis turbine model without the GV system.
Table 3 presents the measurements performed with the GV system. Instead of selecting many GV configurations that would have increased the time of experimentation and data, only six GV configurations were selected. The configurations were set by changing the upper hydrofoil angles. The six upper hydrofoil angles considered for the turbine performance analysis are −35 GV, −20 GV, −10 GV, 0 GV, +15 GV, and +32 GV; see Figure 3. The selected six GV configurations were at a reasonable interval from each other and are within the ±45° range. As mentioned earlier, the lower hydrofoil remains fixed at −10° to deviate the flow to BEP [39]. The negative angles of the upper hydrofoil orientation (−35°, −20°, and −10°) are against the incoming flow, and the positive angles (+15° and +32°) are in-line with the incoming flow direction. At 0 GV, the upper hydrofoil orientation is vertical. The GVs were adjusted manually in the draft tube during the measurement campaign.
Table 3.
Measurements performed.
2.4. Data Analysis
The decomposition of the RVR pressure signals gives two modes. These are (a) plunging mode and (b) rotating mode. The decomposed RVR pressure signals are crucial for the efficiency comparison at PL operational regimes. The plunging mode is the oscillatory nature of the RVR in the axial direction. The rotating mode refers to the rotational behaviour of the RVR. The decomposition of the RVR into its plunging and rotating modes is as follows
If j is the number of sensors evenly distributed cross-sectionally in the draft tube, then the plunging mode is given by:
Here, i is the sensors DT1 to DT3 at L1 or DT4 to DT6 at L2. The rotating mode for each sensor is given by:
The hydraulic efficiency is given by:
Here, T is the generator torque, is the angular frequency of the runner, is the density of the working fluid, g is the gravity, Q is the flow rate, and H is the turbine head.
3. Results and Discussion
3.1. Repeatability
The repetition analysis primarily aimed to investigate the turbine performance repeatability. The repeatability analysis on the current test rig is conducted without the GV system in the draft tube. All parameters mentioned in Section 2 were measured and compared. The RVR pressure amplitudes were also compared at PL1 and PL2. Each operating condition is investigated six times, except for the BEP, see Table 3, because of its stable operation over time. The waiting time for each test performed is presented in Table 4. The waiting time determines to allow the flow to stabilize and reach a steady state. It also influences the waiting time required for hydraulic performance investigations in the presence of the GV system.
Table 4.
Hydraulic efficiency (in %) details for different operating conditions.
Moreover, finding the appropriate waiting time limits the number of experiments performed with the GV system in the draft tube. The 0-min waiting time means recording the data immediately when the turbine load reaches the desired operating condition. For BEP, the waiting time for the repeatability analysis is 0, 2, and 4 min. The hydraulic efficiency results in Table 4 show a stable efficiency from zero-minute for all operating conditions. The hydraulic efficiency of the turbine is determined using Equation (3). The other measured parameters also show stable characteristics and are not presented in this article. The conclusion was that the hydraulic efficiency of the turbine with the modified draft tube cone is highly repeatable for all operating conditions considered and does not vary significantly with time.
Table 5 presents the RVR pressure amplitude repeatability for the DT1 sensor at PL1 and PL2 operating conditions. The RVR pressure amplitude is normalized using the pressure fluctuations coefficient, (see Equation (4)). All flow parameters at all operating conditions are stable except for the RVR pressure amplitudes at PL1 and PL2. One reason for the varying RVR pressure amplitudes at various repetitions is the grooving on the draft tube wall, see Figure 2. In the present study, the grooving is the narrow cuts needed to fix the guide vanes to the draft tube and ensure the upper hydrofoil rotation around its axis. Wei et al. [33,34] discussed the effect of such grooves at the draft tube wall on the RVR suppression. Though there is no 100% mitigation with the draft tube grooves, the study shows some decrement in the RVR pressure amplitude. Therefore, grooving influences the RVR amplitude in the current turbine.
Table 5.
Normalized pressure amplitudes of RVR at DT1 sensor for PL1 and PL2.
Though the hydraulic efficiency shown in Table 4 is stable over time, the RVR pressure amplitudes fluctuate significantly. The mean RVR pressure amplitude at PL1 is closest to repetition one (=0-min waiting time), but the mean RVR pressure amplitude at PL2 is more comparable to repetition four (=6 min waiting time). Therefore, the repeatability test reveals that a six-minute wait is adequate to study the effects of the GVs on the turbine performance at various operating conditions for this test rig. The waiting time is sufficient to restrict the number of repetitions for the turbine with the GV system in the draft tube; refer to Table 3.
3.2. Performance Comparison with the Prior Model Turbine
The present section compares the performance characteristics of the current Francis model turbine with grooves for GVs attachment (without the GV system) against the considered turbine found in the NVKS Francis-99 second workshop [43]. The objectives of this section are (a) to compare the RVR frequency and amplitudes and (b) to investigate the difference in the efficiencies of both turbines at various operating conditions. Comparing the RVR characteristics is only possible at PL2 operating conditions, as no data is available for PL1 for the old model turbine. Two sensors in the prior model turbine named NVKS 1 and NVKS 2 were placed 180° apart at 0.692·R from the draft tube inlet between the L1 and L2 locations in the current test rig; refer to Section 2.2 for more details.
Figure 4 presents the FFT comparison of the pressure signals for DT1 to DT6 sensors of the existing test case and NVKS 1 and 2 sensors. The pressure signals are normalized using the pressure fluctuations coefficient, It is obtained according to Equation (4), as presented below.
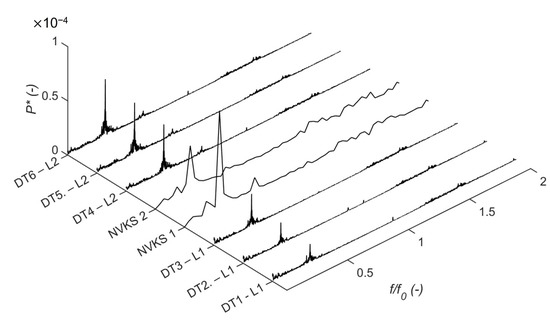
Figure 4.
FFT compares the current test rig pressure signals at the PL2 operating condition with the old NVKS model [43].
The pressure FFT shows a 50% difference in the RVR amplitudes between the NVKS 1 and 2 sensors. This difference is due to the uneven flow distribution upstream and the elbow region of the draft tube [5,6,7,8,9,10]. The RVR amplitudes evaluated in the current test rig at L1 (DT1-DT3) are lower than those reported for the old NVKS test rig. The RVR amplitudes measured by the sensors at L2 (DT4-DT6) are lower than NVKS 1 but higher than NVKS 2. Some reason contributing to varying amplitudes of RVR is (a) difference in sensor locations and (b) the modified regions of the draft tube cone for the current turbine due to draft tube wall grooving.
The results demonstrate that the RVR frequency for the old model turbine is at 0.288·f0, and for the current turbine with a modified draft tube cone, the RVR frequency is 0.307·f0 at PL2 operating conditions. If the claims by Chen et al. [35] are considered, the draft tube grooves do not influence or shift the RVR frequency. Then, the reason for different RVR frequencies at PL2 in the present study is the difference in the inlet flow conditions; see Table 2 and Appendix A. According to Lucca et al. [44], the inlet boundary conditions influence the vortex topology by influencing the vortex core sizes. In the current study comparison, we speculate that the RVR topology may differ in both turbines at PL2.
Comparing the mean turbine hydraulic efficiency of the current and the old test rigs reveals that the efficiency of the existing turbine is 0.34% higher at PL2, 0.35% lower at BEP, and 0.37% lower at HL when compared to the old model turbine; see Figure 5. Previous studies reported that the turbine efficiency remains the same with the grooving of different shapes in the conical diffuser [33,34]. Therefore, the efficiency differences, as speculated, between both turbines are due to deviations in the mechanical properties of the upstream domains, especially for the generator that produces torque. Nevertheless, the operating conditions remain unchanged for both model turbines at a 12 m operational head.
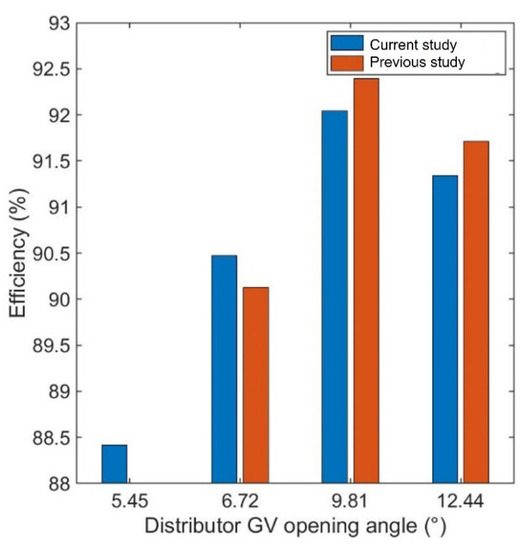
Figure 5.
Efficiency comparison between the current and the old test rig at different operating conditions.
3.3. Guide Vane System Impact on RVR Mitigation
By comparing the FFT of the normalized pressure signals, it was possible to study the RVR mitigation with the GV system in the draft tube at PL1 and PL2. The pressure FFTs are from DT1 and DT4 sensors. These sensors monitor pressures at two levels of the draft tube cone. The pressure signals are normalized using the pressure fluctuations’ coefficient, and is calculated using Equation (4).
There is a significant reduction in the RVR pressure amplitudes in the presence of GVs at PL1; see Figure 6. The decrement is observed at both DT1 and DT4 sensors. The decrease in the RVR pressure amplitudes ranges from 30% to 90% for most GV configurations, except for the +32 GV that performs the least among all GVs, at PL1. There is a 100% mitigation of the RVR amplitude for 0 GV configuration. All other sensors show similar trends. Hence, their FFTs are not presented here. The FFTs presented in Figure 6 reveal that the RVR becomes weak or is mitigated completely throughout the draft tube in the presence of GVs. The RVR frequency with no GV in the draft tube is 0.297·f0. With draft tube GVs, the RVR frequency shifts to 0.39⋅f0 at PL1, except for +32 GV, where the frequency increases to 0.34·f0; see Table 6.
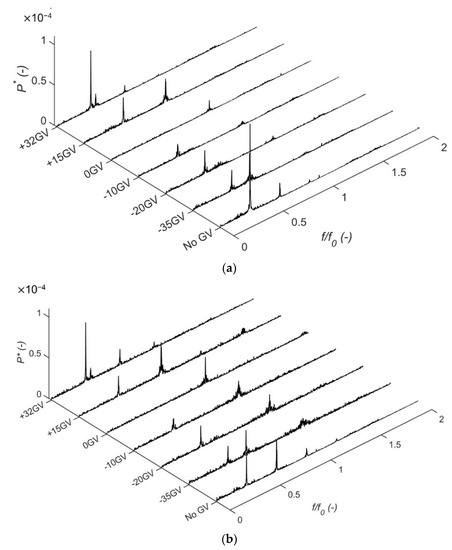
Figure 6.
Normalized pressure signal FFTs for PL1 operating conditions without and with the GV system at (a) DT1 sensor at L1 and (b) DT4 sensor at L2.
Table 6.
RVR frequency shift in the presence of GV system at PL1 and PL2.
The comparison of the pressure-time signals at DT1 and DT4 sensors with no GV and 0 GV setup is presented in Figure 7 for PL1. The pressure signals are presented for only 5 s, as they are periodic. As discussed earlier, the RVR mitigation at PL1 could also be observed in the pressure signals of the DT1 and DT4 sensors; see Figure 7. However, an increased frequency closed to the runner frequency is observed for the 0 GV configuration. This increased frequency has a higher amplitude downstream in the draft tube; see Figure 6b and Figure 7b. As the distance of L2 is farther from the runner, the increased frequency observed is not the runner frequency. Though it is unclear, the speculation is that there is some interaction of the flow leaving the GVs with the elbow region of the draft tube, leading to an increased frequency formation. It requires further investigation.
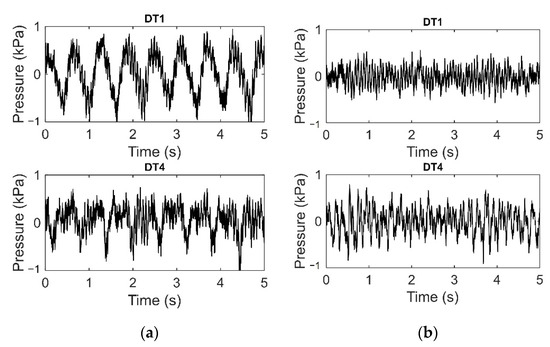
Figure 7.
Pressure signals at PL1 operating condition for (a) draft tube with no GV and (b) with 0 GV.
The RVR pressure amplitude at PL2 (with no GVs) is comparatively lesser than at PL1. It means that the strength of the pressure pulsations at PL2 is lower than at PL1. With GVs, there is some reduction in the RVR pressure amplitudes at PL2. However, there is no complete mitigation. The decrement in the RVR amplitudes in the presence of GVs ranged from 40 to 80%. Interestingly, this operating condition observed a higher decrement at the downstream section of the draft tube cone; see Figure 8. The vortex rope tends to become weaker with the GVs in the draft tube at this operating condition. The RVR frequency at PL2 with no GVs in the draft tube is 0.307·f0. In the presence of the draft tube GVs, the RVR frequency shift ranges between 0.43·f0 and 0.62·f0 at PL2; see Table 6. However, for +32 GV, some additional frequencies are observed. At this operating condition, 0 GV is considered the best-performing configuration, with the maximum shift in the RVR frequency (0.62·f0) and the reduction in pressure pulsations ranging from 50 and 80% in the draft tube cone. The pressure-time signals in Figure 9 show a higher decrement in the RVR pressure amplitude downstream of the draft tube for the 0 GV configuration. The pressure signals also capture the increased RVR frequency with the 0 GV.
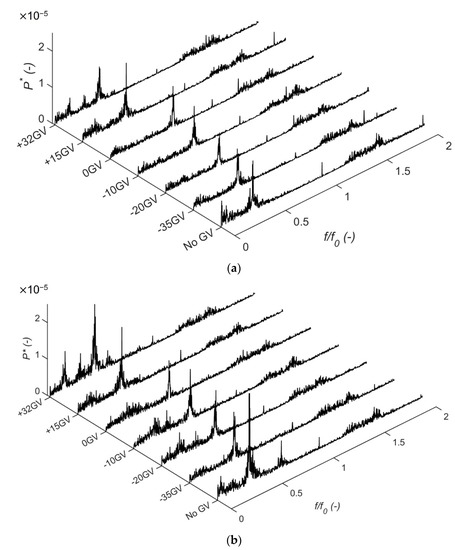
Figure 8.
Normalized pressure signal FFTs for PL2 operating conditions without and with the GV system at (a) DT1 sensor at L1 and (b) DT4 sensor at L2.
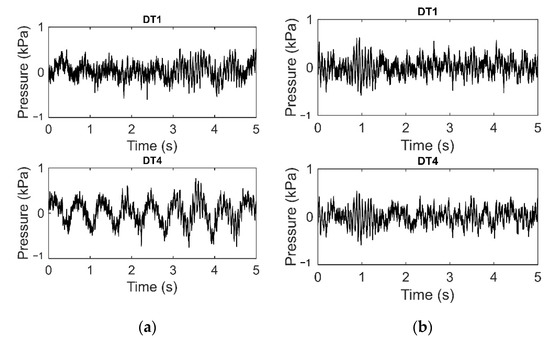
Figure 9.
Pressure signals at PL2 operating condition for (a) draft tube with no GV and (b) with 0 GV.
3.4. Guide Vane System Impact on Turbine Performance
At PL1 and PL2, the efficiencies are compared against the decomposed RVR pressure signals obtained using Equations (1) and (2). Though the overall RVR pressure amplitudes decrease in the presence of GVs, the decomposition indicates the percent increment or decrement in the plunging and the rotating mode amplitudes of the RVR. The increment/decrement in the RVR modes pressure amplitudes in the presence of GVs is presented in the percent of the ones with no GVs to compare against the efficiencies. As the overall findings and other results reach the same conclusion, only limited results are presented here.
Figure 10 compares the hydraulic efficiency against the RVR mitigation at PL1 without and with the GV system in the draft tube. The selected parameters for comparison are the plunging mode at L1 and the rotating modes of DT1 and DT4 sensors against the hydraulic efficiency of the turbine. There is a significant increase in the plunging mode with −35 GV, −20 GV, and +15 GV. The increase in plunging mode indicates an increase in the RVR axial oscillations in the draft tube that could travel upstream and affect the turbine performance. At PL1, the maximum efficiency compromised is for −35 GV. There is a significant increase in the plunging mode, and the rotating modes suppressed are between 40–80% for −35 GV. The efficiency drop is approximately 1.37%.
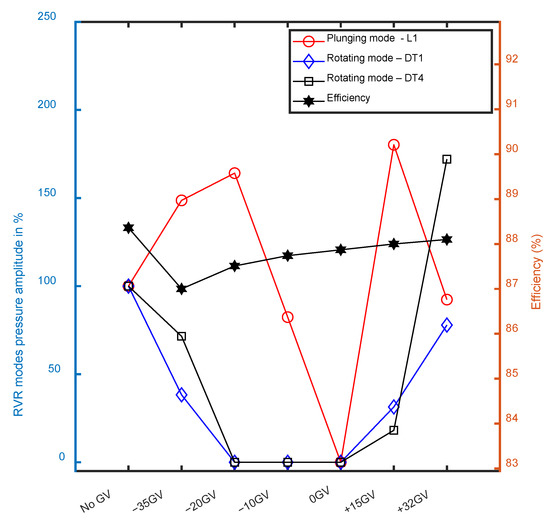
Figure 10.
Hydraulic efficiency compared against decomposed RVR pressure amplitudes at PL1 without and with the GV systems at different upper hydrofoil angles.
For −20 GV and +15 GV, there is either complete mitigation or significant reduction in the RVR rotating modes. However, the increase in their plunging modes makes them a poor configuration in this operating condition. It is regardless of the recovery in efficiency when the GV moves from −35° to +32°. The +32 GV is the worst performing configuration concerning the RVR mitigation; see Figure 10. Due to this reason, the efficiency is affected the least at +32 GV
For configurations that completely mitigate the rotating modes at PL1 (−10 GV and −20 GV), the efficiency drop is 0.62% and 0.85%, respectively. When the GV system is in the flow direction, +15 GV and +32 GV, the efficiency drops 0.36% and 0.26%, respectively. The efficiency compromise for the best case (0 GV), where there is 100% mitigation of the plunging, and the rotating mode is 0.49%. In most configurations, except the 0 GV, the efficiency drop is due to increased plunging modes. For other cases such as the +32 GV, the design is unsuitable for RVR mitigation.
Figure 11 compares the hydraulic efficiency against the RVR mitigation at PL2 without and with the GV system in the draft tube. At PL2, the plunging mode is mitigated completely with the GV system. The efficiency pattern at PL2 is such as that at PL1. There is a 1.06%, 0.68%, and 0.47% compromise of hydraulic efficiency for −35 GV, −20 GV and −10 GV, respectively. For +15 GV and +32 GV, the efficiency compromise is 0.37% and 0.15%. At 0 GV, the efficiency drop is 0.47%. For all configurations, the mitigation of the rotating mode ranges from 30% to 80%. Though 0 GV is the best configuration at PL1, it mitigates the RVR rotating mode by 32.2% at L1 and 75% at L2 and mitigates the plunging mode by 100%.
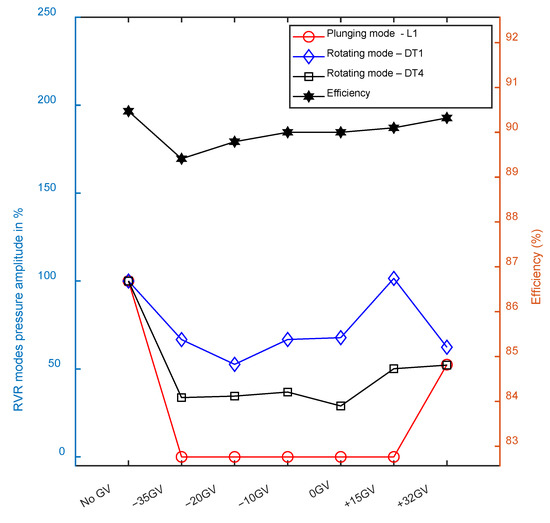
Figure 11.
Hydraulic efficiency compared against decomposed RVR pressure amplitudes at PL2 without and with the GV systems at different upper hydrofoil angles.
The hydraulic efficiency at all operating conditions with and without the draft tube GVs is presented in Figure 12 with the respective random uncertainties. The hydraulic efficiency is calculated using Equation (3). The random uncertainty of the hydraulic efficiency ranged from 0.045–0.07%. In the presence of GVs, the efficiency increases at BEP, except for −35 GV. There is no change in the hydraulic efficiency at BEP for −35 GV. For 0 GV, there is a 0.12% increment in hydraulic efficiency at BEP. The efficiency increment ranges from 0.04% to 0.09% for all other configurations at BEP. For HL operating conditions, the hydraulic efficiency decreases in the presence of GVs except for +32 GV. There is a 0.6% increment in the hydraulic efficiency for the +32 GV configuration at HL. For 0 GV, the efficiency compromise is 0.3%. Despite the efficiency compromise with the GVs in the draft tube, the overall efficiency drop is less for the current mitigation technique than for the other methods reported [18,19,20,21,22,23,24,25,26,27,28,29,30,31,32,33,34,35]. The possible explanation for a lower efficiency loss compared to the other techniques is the re-directing mechanism of a GV system. Considering the GV’s span and chord length, The GVs re-direct the flow from the draft tube wall region and do not directly interact with the flow at the center of the draft tube, which helps in some efficiency conservation [39].
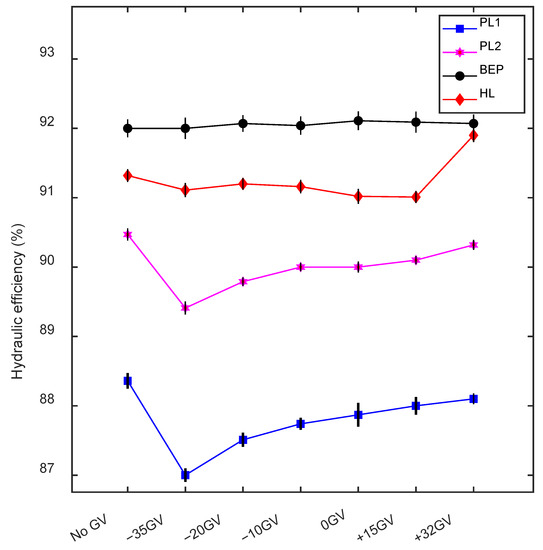
Figure 12.
Hydraulic efficiency at all operating conditions without and with the GV systems at different upper hydrofoil angles.
One reason for the efficiency increment/decrement in the presence of the GV system at all operating conditions could be related to the variation in the parameters that constitute the hydraulic efficiency. Though the experiments were performed at a constant turbine operational head of 12 m (see Table 2 and Appendix C), the flow rate is affected by the GVs in the draft tube. The flow rate reduces significantly, especially at part load flow regimes; see Appendix B. The flow rate is the function of the distributor GV opening angles in the Francis turbine. For constant distributor GV opening angle, the variation in the flow rate is due to the cross-sectional area occupied by the GV system in the draft tube. The GVs reduce the draft tube area, affecting the turbine’s inlet flow rate. The flow rate variation could also be due to the mitigation effects in the draft tube in the presence of the GVs. Any modification downstream of the runner could influence the turbine’s operational and flow parameters upstream. In this case, the flow rate is affected.
Another reason for the hydraulic efficiency compromise is the generator torque; see Appendix B. The losses in torque could be related to some mechanical losses induced in the turbine to mitigate the RVR. For part load flow regimes, the torque loss could be due to the orientation of the GVs, the high plunging mode, and the reduction in the rotating modes. The interaction of the flow with the GV structures could also lead to some mechanical losses in the turbine. Other mechanical losses that could lead to the efficiency compromise could be the shaft loss or the bearing loss. With the efficiency and the extensive RVR mitigation investigated in the current measurement campaign, the working concept of a variable GV system in the draft tube of a hydro-turbine is successfully demonstrated.
4. Conclusions
The current research successfully demonstrates the proof of concept for adding a GV system to the draft tube of a Francis model turbine to mitigate pressure pulsations and examine their effects on the turbine’s hydraulic performance. Our prior study on GV system design methodology using numerical methods influenced the GVs dimensions in the current study. The GVs were modified in the present study to ensure their rotation. Moreover, the draft tube cone has additional grooving to fix the GV system and ensure its rotation. The upper hydrofoil in the GV system can rotate up to ±45°, and the lower hydrofoil is fixed at −10°. There were six GV configurations investigated between ±45°.
Despite using the modified draft tube with additional grooving in the present study, the performance of the current turbine is like the NVKS Francis-99 model turbine at a 12 m operational head. The 0 GV configuration has the best mitigation effects. The efficiency loss for the 0 GV is less than 0.6% under all other operating conditions. In the presence of the GVs in the draft tube, the turbine efficiency improves slightly at BEP. It implies some flexibility improvement at lower operating conditions in the turbine. It could also be emphasized that there is some improvement in the runner’s lifespan. Suppose the movement of the GVs is restricted to 0 GV. In that case, this technique gives the best RVR mitigation with lesser efficiency loss over the entire operational range than the previous studies reported.
The advantage of this technique is that the GV systems are extremely thin but effective. They are easy to implement in any turbine with some modifications in the draft tube. Though the entire measurement campaign was smooth, there was a major hindrance, as the adjustment of the GV system was the study’s primary drawback. The future scope of the present study could focus on developing a flow feedback system for the GV system self-adjustability, which could be helpful for transient studies. Moreover, the possibility of implementing this technique on other turbines, for example, axial turbines, could be beneficial.
Author Contributions
Conceptualization, M.J.C.; methodology, J.J. and M.J.C.; software, J.J.; validation, J.J. and M.J.C.; formal analysis, J.J., M.R. and M.J.C.; investigation, J.J., M.R. and M.J.C.; writing—original draft preparation, J.J.; writing—review and editing, J.J., M.R. and M.J.C.; supervision, M.R. and M.J.C.; project administration, M.J.C.; funding acquisition, M.J.C. All authors have read and agreed to the published version of the manuscript.
Funding
The authors gratefully acknowledged the financing received for the current study from the Horizon 2020 research and innovation program of the European Union, grant agreement number 764011. The authors appreciate the support from the NTNU waterpower laboratory team for mounting the new draft tube cone, instructing on how to use the test rig, calibrating a variety of sensors, and providing a safety briefing for the lab. There were time restrictions on doing the entire study because of the COVID-19 pandemic regulations in Norway. Therefore, the sensors were calibrated in collaboration with master’s student Halvor West, with the help of NTNU research assistant Jan-Karl Lasse Escher and Johannes Opedal Kverno, a Ph. D student at NTNU.
Institutional Review Board Statement
Not applicable.
Informed Consent Statement
Informed consent was obtained from all the subjects.
Data Availability Statement
Not applicable.
Conflicts of Interest
The funders had no role in the design of the study, in the collection, analysis, or interpretation of data, in the writing of the manuscript, or in the decision to publish the result.
Nomenclature
| Symbol | Parameter | Unit |
| D | Runner diameter | m |
| H | Turbine net head | m |
| P | Pressure | kPa |
| Q | Flow discharge | m3/s |
| QBEP | Discharge at best efficiency point | m3/s |
| QED | Discharge factor | - |
| R | Runner radius | m |
| TGEN | Generator torque | N⋅m |
| η | Hydraulic efficiency | % |
| f | Frequency | Hz |
| f0 | Runner frequency | Hz |
| n | Runner rotational speed | rpm |
| nED | Speed factor | - |
| ω | Angular frequency | rad/s |
| BEP | Best efficiency point | |
| CAD | Computer-aided design | |
| DT | Draft tube | |
| GV | Guide vanes | |
| OP | Operating condition | |
| PL | Part load | |
| HL | High load |
Appendix A
Table A1.
Mean operational parameters of the NVKS Francis model turbine [43].
Table A1.
Mean operational parameters of the NVKS Francis model turbine [43].
| Parameters | PL2 | BEP | HL |
|---|---|---|---|
| Distributor GV angle (°) | 6.72 | 9.81 | 12.44 |
| H (m) | 11.87 | 11.94 | 11.88 |
| Q (m3/s) | 0.1396 | 0.1996 | 0.2425 |
| TGEN (N⋅m) | 416.39 | 616.13 | 740.54 |
| RPM | 332.84 | 332.59 | 332.59 |
| η (%) | 90.13 | 92.39 | 91.71 |
| Pin (kPa) | 218.08 | 215.57 | 212.38 |
| Pout (kPa) | 113.17 | 111.13 | 109.59 |
Appendix B
Table A2.
Flow rate (Q) and difference (ΔQ) without and with the GV system.
Table A2.
Flow rate (Q) and difference (ΔQ) without and with the GV system.
| PL1 | PL2 | BEP | HL | |||||
|---|---|---|---|---|---|---|---|---|
| Q (m3/s) | ΔQ (%) | Q (m3/s) | ΔQ (%) | Q (m3/s) | ΔQ (%) | Q (m3/s) | ΔQ (%) | |
| No GV | 0.1184 | - | 0.1436 | - | 0.202 | - | 0.245 | - |
| −35 GV | 0.1162 | −1.86 | 0.1426 | −0.70 | 0.201 | −0.5 | 0.245 | - |
| −20 GV | 0.1169 | −1.27 | 0.1424 | −0.84 | 0.201 | −0.5 | 0.244 | 0.4 |
| −10 GV | 0.1160 | −2 | 0.1430 | −0.42 | 0.201 | −0.5 | 0.245 | - |
| 0 GV | 0.1168 | −1.35 | 0.1422 | −0.97 | 0.200 | −0.99 | 0.245 | - |
| +15 GV | 0.1169 | −1.27 | 0.1430 | −0.42 | 0.201 | −0.5 | 0.245 | - |
| +32 GV | 0.1179 | −0.42 | 0.1432 | −0.28 | 0.200 | −0.99 | 0.245 | - |
Table A3.
Generator torque (T) and difference (ΔT) without and with the GV system.
Table A3.
Generator torque (T) and difference (ΔT) without and with the GV system.
| PL1 | PL2 | BEP | HL | |||||
|---|---|---|---|---|---|---|---|---|
| T (N⋅m) | ΔT (%) | T (N⋅m) | ΔT (%) | T (N⋅m) | ΔT (%) | T (N⋅m) | ΔT (%) | |
| No GV | 351.76 | - | 439.40 | - | 621.23 | - | 751.18 | - |
| −35 GV | 332.63 | −5.44 | 422.30 | −3.92 | 615.85 | −0.86 | 743.62 | −1 |
| −20 GV | 340.37 | −3.24 | 426.72 | −2.89 | 617.53 | −0.6 | 745.11 | −0.81 |
| −10 GV | 337.77 | −3.98 | 428.57 | −2.46 | 620.44 | −0.13 | 741.69 | −1.28 |
| 0 GV | 340.44 | −3.22 | 422.83 | −3.77 | 615.93 | −0.87 | 742.82 | −0.81 |
| +15 GV | 342.59 | −2.61 | 427.65 | −2.67 | 612.91 | −1.23 | 739.66 | −1.55 |
| +32 GV | 342.99 | 2.49 | 436.06 | −0.76 | 620.74 | −0.12 | 743.17 | −1.07 |
Appendix C
Table A4.
Mean operational parameters of the current test rig with different GV configurations at PL1.
Table A4.
Mean operational parameters of the current test rig with different GV configurations at PL1.
| Parameters | −35 GV | −20 GV | −10 GV | 0 GV | +15 GV | +32 GV |
|---|---|---|---|---|---|---|
| Distributor GV angle (°) | 5.45 | 5.45 | 5.41 | 5.411 | 5.41 | 5.45 |
| H (m) | 11.97 | 11.97 | 11.98 | 11.96 | 11.96 | 11.95 |
| Q (m3/s) | 0.1162 | 0.1169 | 0.1160 | 0.1168 | 0.1169 | 0.1170 |
| TGEN (N⋅m) | 332.63 | 340.37 | 337.77 | 340.44 | 342.60 | 342.99 |
| RPM | 333.32 | 333.24 | 332.25 | 332.85 | 333.47 | 332.93 |
| η (%) | 86.92 | 87.51 | 87.74 | 87.87 | 88 | 88.08 |
| Pin (kPa) | 240.64 | 239.54 | 240.60 | 239.21 | 239.01 | 240.05 |
| Pout (kPa) | 124.04 | 122.73 | 123.75 | 122.59 | 122.42 | 123.56 |
Appendix D

Figure A1.
(a) Guide vanes inside the draft tube, showing the adjustability of the upper hydrofoil and fixed lower hydrofoil. (b) Complete Francis-99 draft tube.
Figure A1.
(a) Guide vanes inside the draft tube, showing the adjustability of the upper hydrofoil and fixed lower hydrofoil. (b) Complete Francis-99 draft tube.

References
- Hydro Power Status Report; International Hydropower Association: Paris, France, 2019.
- HydroFlex: European Union Horizon 2020 Research and Innovation Program; Norwegian University of Science and Technology: Trondheim, Norway, 2018–2022; Available online: https://www.h2020hydroflex.eu/ (accessed on 1 July 2022).
- Nishi, M.; Matsunaga, S.; Kubota, T.; Senoo, Y. Study on swirl flow and surge in an elbow type draft tube. In Proceedings of the 10th IAHR Symposium, Tokyo, Japan, October 1980; Volume 1, pp. 557–568. [Google Scholar]
- Nishi, M.; Liu, S.-H. An Outlook on the Draft-Tube-Surge Study. Int. J. Fluid Mach. Syst. 2013, 6, 33–48. [Google Scholar] [CrossRef]
- Kumar, S.; Cervantes, M.J.; Gandhi, B.K. Rotating vortex rope formation and mitigation in draft tube of hydro turbines—A review from experimental perspective. Renew. Sustain. Energy Rev. 2021, 136, 110354. [Google Scholar] [CrossRef]
- Trivedi, C.; Cervantes, M.J.; Dahlhang, O.G. Experimental and numerical studies of a high-head Francis turbine: A review of the Francis-99 test case. Energies 2016, 9, 74. [Google Scholar] [CrossRef]
- Trivedi, C.; Cervantes, M.J.; Gandhi, B.K.; Dahlhaung, O.G. Pressure measurements on a high head Francis turbine during load acceptance and rejection. J. Hydraul. Res. 2014, 52, 283–297. [Google Scholar]
- Goyal, R.; Gandhi, B.K. Review of hydrodynamics instabilities in Francis turbine during off—Design and transient operations. Renew. Energy 2018, 116, 697–709. [Google Scholar]
- Goyal, R.; Trivedi, C.; Gandhi, B.K.; Cervantes, M.J.; Dahlhaug, O.G. Transient pressure measurements at part load operating condition of a high head model Francis turbine. Sadhana 2016, 41, 1311–1320. [Google Scholar] [CrossRef]
- Goyal, R.; Bergan, C.; Cervantes, M.J.; Gandhi, B.K.; Dahlhaug, O.G. Experimental investigation on a high head model Francis turbine during load rejection. IOP Conf. Ser. Earth Environ. Sci. 2016, 49, 082004. [Google Scholar] [CrossRef]
- Goyal, R.; Cervantes, M.J.; Gandhi, B.K. Vortex rope formation in a high head model Francis turbine. ASME J. Fluids Eng. 2017, 139, 041102. [Google Scholar] [CrossRef]
- Susan-Resiga, R.; Ciocan, G.D.; Anton, I.; Avellan, F. Analysis of the swirling flow downstream a Francis turbine runner. J. Fluids Eng. 2006, 128, 177–189. [Google Scholar] [CrossRef]
- Susan-Resiga, R.F.; Muntean, S.; Stein, P.; Avellan, F. Axisymmetric swirling flow simulation of the draft tube vortex in Francis turbines at partial discharge. Int. J. Fluid Mach. Syst. 2009, 2, 295–302. [Google Scholar] [CrossRef]
- Bosioc, A.I.; Tanasa, C.; Susan-Resiga, R.; Muntean, S. Experimental analysis of unsteady velocity in decelerated swirling flows. In Proceedings of the 4th International Meeting on Cavitation and Dynamic Problems in Hydraulic Machinery and Systems, Belgrade, Serbia, 26–28 October 2011. [Google Scholar]
- Ciocan, G.D.; Iliescu, M.S.; Vu, T.C.; Nennemann, B.; Avellan, F. Experimental Study and Numerical Simulation of the FLINDT Draft Tube Rotating Vortex. J. Fluids Eng. 2007, 129, 146–158. [Google Scholar] [CrossRef]
- Favrel, A.; Pereira, J.G., Jr.; Landry, C.; Müller, A.; Nicolet, C.; Avellan, F. New insight in Francis turbine cavitation vortex rope: Role of the runner outlet flow swirl number. J. Hydraul. Res. 2018, 56, 367–379. [Google Scholar] [CrossRef]
- Favrel, A.; Pereira, J.G., Jr.; Müller, A.; Landry, C.; Yamamoto, K.; Avellan, F. Swirl number based transposition of flow-induced mechanical stresses from reduced scale to full-size Francis turbine runners. J. Fluids Struct. 2020, 94, 102956. [Google Scholar] [CrossRef]
- March, P. Hydraulic and environmental performance of aerating turbine technologies. In EPRI Conference on Environmentally Enhanced Hydropower Turbines; Electric Power Research Institute: Palo Alto, CA, USA, 2011; pp. 19–21. [Google Scholar]
- Muntean, S.; Resiga, R.S.; Campian, V.C.; Dumbrav, C.; Cuzmos, A. In situ unsteady pressure measurements on the draft tube cone of the Francis turbine with air injection over an extended operating range. UPB Sci. Bull. Ser. D Mech. Eng. 2013, 76, 173–180. [Google Scholar]
- Nakanishi, K.; Ueda, T. Air Supply into Draft Tube of Francis Turbine. Fuji Electr. Rev. 1964, 10, 81–91. [Google Scholar]
- Zolotov, L.A.; Klabukov, V.M.; Vladimirskii, V.M. Reduction of pressure fluctuations in penstocks at pumped-storage plants by injecting air under the runner. Hydrotech. Constr. 1976, 10, 763–766. [Google Scholar] [CrossRef]
- Tănasă, S.M.C.; Bosioc, A.I.; Susan-Resiga, R.; Ciocan, T. Influence of the air admission on the unsteady pressure field in a decelerated swirling flow. UPB Sci. Bull. Ser. D Mech. Eng. 2016, 78, 161–170. [Google Scholar]
- Papillon, M.S.B.; Couston, M.; Deschenes, C. Methods for air admission in hydro turbines. In Proceedings of the 21st IAHR Symposium on Hydraulic Machinery and Systems, Lausanne, Switzerland, 9–12 September 2002. [Google Scholar]
- Bucur, D.M.; Dunca, G.; Bunea, F.; Ciocan, G.D. Experimental analysis of the operation of a small Francis turbine equipped with an innovative aeration device. IOP Conf. Ser. Earth Environ. Sci. 2019, 240, 042010. [Google Scholar] [CrossRef]
- Francke, H.H. Increasing Hydro Turbine Operation Range and Efficiencies Using Water Injection in Draft Tubes. Ph.D. Thesis, Norwegian University of Science and Technology, Trondheim, Norway, 2010. [Google Scholar]
- Susan-Resiga, R.; Vu, T.C.; Muntean, S.; Ciocan, G.D.; Nennemann, B. Jet control of the draft tube vortex rope in Francis turbines at partial discharge. In Proceedings of the 23rd IAHR Symposium Conference, Ann Arbor, MI, USA, 31 May–3 June 2006; pp. 17–21. [Google Scholar]
- Rudolf, P.; Litera, J.; Bolanos, J.A.I.; Stefan, D. Manipulation of the swirling flow instability in hydraulic turbine diffuser by different methods of water injection. Exp. Fluid Mech. 2018, 180, 02090. [Google Scholar] [CrossRef][Green Version]
- Kjeldsen, M.O.K.M.; Nielsen, T.; Dahlhaug, O.G. Water injection for the mitigation of draft-tube pressure pulsations. In Proceedings of the IAHR International Meeting of Working Group on Cavitation and Dynamic Problems in Hydraulic Machinery and Systems; 2006. [Google Scholar]
- Bosioc, A.I.; Susan-Resiga, R.; Muntean, S.; Tanasa, C. Unsteady pressure analysis of a swirling flow with vortex rope and axial water injection in a discharge cone. ASME. J. Fluids Eng. 2012, 134, 081104. [Google Scholar] [CrossRef]
- Thicke, R.H. Practical solutions for draft tube instability. Water Power Dam. Constr. 1981, 33, 31–37. [Google Scholar]
- Nishi, M.; Wang, X.M.; Yoshida, K.; Takahashi, T.; Tsukamoto, T. An experimental study on fins, their role control of the draft tube surging. In Hydraulic Machinery and Cavitation; Springer: Berlin/Heidelberg, Germany, 1996; pp. 905–914. [Google Scholar]
- Kurokawa, S.L.S.J.; Matsui, J.; Kitahora, T. A New Passive Device to Suppress Several Instabilities in Turbomachines by Use of J-Grooves; Osaka, Japan, 1998. [Google Scholar]
- Wei, Q.S.; Choi, Y.D. The optimization of j-groove shape in the draft tube of a Francis turbine to suppress the draft surge. IOP Conf. Ser. Mater. Sci. Eng. 2013, 52, 052030. [Google Scholar] [CrossRef]
- Wei, Q.S.; Choi, Y.D.; Zhu, B.S. Application of J-Groove to the suppression of swirl flow in the draft tube of a Francis hydro turbine. IOP Conf. Ser. Earth Environ. Sci. 2012, 15, 022017. [Google Scholar] [CrossRef]
- Chen, Z.; Singh, P.M.; Choi, Y.D. Suppression of unsteady swirl flow in the draft tube of a Francis hydro turbine model using J-Groove. J. Mech. Sci. Technol. 2017, 31, 5813–5820. [Google Scholar] [CrossRef]
- Fraser, R.; Deschênes, C.; Gokhman, A.; Huang, J. Development of an exit stay apparatus for Francis turbine. In Hydrovision 2008; HCI Publication: Sacramento, CA, USA, 2008. [Google Scholar]
- Lancaster, O.E. Jet Propulsion Engines; Princeton University Press: Princeton, NJ, USA, 2015. [Google Scholar]
- Wilson, D.G.; Korakianitis, T. The Design of High Efficiency Turbomachinery and Gas Turbines; The MIT Press: Cambridge, MA, USA, 2014. [Google Scholar]
- Joy, J.; Raisee, M.; Cervantes, M.J. A Novel Guide Vane system Design to Mitigate Rotating Vortex Rope in High Head Francis Model Turbine. Int. J. Fluid Mach. Syst. 2022, 15, 188–209. [Google Scholar] [CrossRef]
- IEC 60041; Field Acceptance Tests to Determine the Hydraulic Performance of Hydraulic Turbines, Storage Pumps and Pump-Turbines. 3rd ed. SAI Global: Geneva, Switzerland, 1991; p. 11.
- IEC 60193; Hydraulic Turbines, Storage Pumps and Pump-Turbines—Model Acceptance Tests. IEC: Geneva, Switzerland, 1999; p. 11.
- ASME PTC 18-2011; Hydraulic Turbines and Pump Turbines: Performance Test Codes. ASME: New York, NY, USA, 2001.
- NVKS Francis-99 Second Workshop; Norwegian University of Science and Technology: Trondheim, Norway, 2016.
- Lucca-Negro, O.; O’Doherty, T. Vortex breakdown: A review. Prog. Energy Combust. Sci. 2000, 27, 431–481. [Google Scholar] [CrossRef]


Publisher’s Note: MDPI stays neutral with regard to jurisdictional claims in published maps and institutional affiliations. |
© 2022 by the authors. Licensee MDPI, Basel, Switzerland. This article is an open access article distributed under the terms and conditions of the Creative Commons Attribution (CC BY) license (https://creativecommons.org/licenses/by/4.0/).