
Do High Fuel Prices Pose an Obstacle to Economic Growth? A Study for Poland
Faculty of Economic Science, Koszalin University of Technology, Kwiatkowskiego 6e, 75-343 Koszalin, Poland
Energies 2022, 15(18), 6606; https://doi.org/10.3390/en15186606
Submission received: 3 August 2022
/
Revised: 19 August 2022
/
Accepted: 6 September 2022
/
Published: 9 September 2022
Abstract
:Great attention has been paid in recent months to high energy prices, including fuel prices. Numerous studies present the threat this poses to economic growth, but history already knows such situations. Therefore, the elementary question was posed: How do fuel prices affect trade and economic growth? The research was based on the Polish economy between 2000 and 2020. Poland is an importer of energy commodities, so it should exhibit strong sensitivity to fuel price changes. A VAR model was created for the Polish economy, including fuel prices, seaborne trade, gross domestic product, and inflation. The results demonstrate that the Polish economy is quite resilient to fuel market turbulence. Obviously enough, it is easier to function in the conditions of lower fuel prices, but high prices are not a reason to panic. Moreover, ongoing technological progress allows economies to weather fuel market crises more easily than was the case back in the 20th century. Therefore, one may unequivocally state that low fuel prices are not a prerequisite for a country’s development. An economy may develop under conditions of higher fuel prices, and panic over high fuel prices only further fuels the inflationary spiral.
1. Introduction
Currently, high fuel prices are often shown as a significant problem for the development of the economy. Meanwhile, the developed nations of the world are able to withstand the adverse effects of an oil price shock owing to their domestic economic conditions. Developing countries, on the other hand, are the ones that are heavily affected by the lack of oil-saving technologies combined with the lack of oil substitution techniques in the production process [1]. The link between fuel prices and economic growth is only seemingly obvious. The prevailing view in the literature is that fuel prices have a positive impact on the inflation rate but a negative impact on economic growth. In this context, great attention is also given to environmental protection, hence the suggestions for policy makers to promote programs that reduce oil consumption and steer economies towards the use of renewable energy to accelerate economic growth. It is suggested that this would protect economies from international oil price fluctuations and inflation but would also help achieve the sustainable environmental goal of reducing oil consumption [2].
Theoretically, there is a positive relationship between the price of oil and the inflation rate. This is because oil is the main raw material for any economy and if its price (input costs) increases, this will certainly have a positive impact on the price (costs) of final products. Research findings in this area suggest that this relationship is strong [3,4], but there are also reports that the impact depends on the length of the price period observed [5,6]. The situation largely depends on the degree of economic development of the country [7].
There have been a number of detailed studies on the impact of fuel prices on inflation. Their results are quite diverse, and they depend on the period of analysis and the group of countries. For China, India, Indonesia, Israel, Jordan, Korea, Malaysia, Pakistan, the Philippines, Singapore, Taiwan, and Turkey, oil prices were found to have a significant long-run impact on CPI inflation, yet no short-run impact was demonstrated [8]. In Europe, a persistent effect of oil prices on inflation was found [9]. In contrast to these results, other studies have found that inflation in less developed countries is more sensitive to variations in fuel prices [10] than in highly developed countries [11]. The United States, in particular, is indicated as a country without a very strong sensitivity of inflation to fluctuations in fuel prices. In the same study, European Union Member States were also found to be not very sensitive.
When examining the asymmetry of the response of inflation to changes in fuel prices, it was found that a rise in oil prices has a positive and significant impact on inflation; nevertheless, a fall in oil prices has no significant impact on inflation. On the other hand, when the rate of increase in energy prices is relatively slow, inflation slows down and the level of production increases significantly [12]. The conclusion concerning the asymmetric impact of fuel prices on inflation is quite common. In a study of the Chinese economy, based on the autoregressive ARDL model as well as the non-linear and asymmetric autoregressive NARDL model, it was found that the effect of global oil price fluctuations on PPI and CPI price indices is asymmetric in the long run, and the long-term effects of rising global oil prices on PPI and CPI are greater than the effects of falling global oil prices on falling PPI and CPI indices, suggesting persistent inflationary changes even with falling oil prices [13]. Based on the same methodology, analogous conclusions were reached for India [14]. The case of India is interesting, in that inflation in that country was found to be more sensitive to changes in oil prices than to changes in the money supply [15]. In Europe, attempts have been made to break up energy monopolies for many years. An early example is the English example, where the reforms of the 1980s and 1990s were intended to bring competition to the market. Privatization was intended to make the English bulk electricity market sufficiently competitive to avoid the need for regulation, but at that time after the reforms two generators set the spot price over 90% of the time, though they supply less than 60% of total electricity generated [16]. This problem remains unsolved all over the world to this day [17]. In the U.S., deregulation caused the increase in markups dominates despite modest efficiency gains, leading to higher consumer prices and lower consumer welfare. This effect is driven primarily by market power at the wholesale level. In some circumstances, regulated prices may be preferred to market-based prices when markets are not perfectly competitive [18].
- Rising oil prices influence the marginal costs of production. The prices of finished goods are rising, and the economic growth is declining.
- Changing forces in the global economy: oil exporters gain from rising oil prices, while importers lose.
- Changes in the labor market: seeking savings in industries sensitive to fuel price increases.
- General uncertainty manifesting itself in a reduction in the dynamics of new investments.
The studies carried out to date mostly confirm the theoretical determination of the impact of oil price changes on the economy. The negative effects of rising fuel prices on economic downturns were particularly evident in the industrialized economies of the 1970s. At that time, as a result of a nominal increase in oil prices, inflation rose and GDP growth slowed down, with many countries facing significant increases in unemployment [22]. This was one of the largest price shocks after the Second World War, often compared to the Great Depression of the interwar period. These results were also confirmed in later periods; in particular, shocks originating in the power market were found to be endogenous to the economy [23]. Economic shocks associated with oil price volatility are particularly observed in small oil-importing countries. It is very easy for the economies of such countries to be thrown out of general equilibrium by oil price increases, and it is difficult for them to return to this state once prices have been stabilized [24]. This causes energy carriers to become a tool for political manipulation and a weapon in economic conflicts.
Attention should be paid to secondary effects of oil prices on inflation via increased costs of production. In some sectors (housing for example), the impact of energy prices on cost of housing is much larger than CPI. For example, in the Czech Republic, where acquisition prices of residential real estate increased depending on the region in the range of 50 to 120% in 4 years, and since January 2022, there has been a sharp rise in energy prices and a tightening of conditions for the acquisition of mortgage loans. Finally, it is found that the affordability of owner-occupied housing in the Czech Republic has deteriorated, and part of the middle class will be forced to move to the rental housing sector, multifamily housing, and sharing [25]. This situation causes a risk of an increase in social tension in society and a deterioration in the availability of employment for low-income professions [26]. That being said, tax breaks are under discussion at a time of high energy prices. However, it should be noted here that this often has negative consequences for public finances.
The situation for oil-producing countries is completely different. As expected, the results showed that oil producers (i.e., Iran and the Russian Federation) benefit from oil price shocks [27].
An important issue that was demonstrated is the impact of monetary policy on oil price inflation [28,29,30]. A properly conducted monetary policy may help to overcome the oil price crisis [31,32,33]. Conversely, inappropriately pursued policies may exacerbate the crisis, with interest rate increases proving particularly dangerous. They were supposed to curb inflation but, in reality, by increasing the cost of servicing investments, they contributed to an even faster decline in production and employment [34,35].
In many studies, the money supply and the exchange rate are shown to be important factors linking oil price fluctuations to changes in inflation and fluctuations in economic growth [36,37,38]. Another methodological problem in price transmission studies is the adoption of an appropriate representative. Here, the indications are not clear-cut. On the one hand, the prices of all oil grades are closely correlated, so the adoption of a single representative would suffice; on the other hand, economies use multiple sources of supply, so the adoption of an average price is recommended [39]. However, the average price is closely correlated with each individual oil price, so according to basic principles of econometrics this is not a problem.
Today, compared to the situation in the 1970s, economies are becoming more effective when dealing with oil price shocks [40,41]. This is due to the diversification of sources and the increasing use of renewable energy which, despite a significant initial outlay, nevertheless have much lower marginal costs than energy generated from fossil fuels. The latest research also confirms a compelling insight into the country’s energy structure and inflationary pressures when a larger share of renewable electricity sources proves to be associated with lower inflation. The implication of renewable sources on inflation should be of interest to policymakers, especially in times of high, almost galloping inflation rates in some European countries, unstable fossil energy sources supply due to geopolitical instability, and climate crisis [42].
World oil prices in oil-importing countries, such as Poland, create inflationary pressures [43]. Many previously cited studies emphasize that in a situation of high fuel prices and, consequently, high inflation, economic growth is threatened. Meanwhile, it proves that, over the last dozen years or so, Poland has seen a twofold increase in GDP and an even faster increase in turnover (unloading) at seaports. The question therefore arises:
Q1:
How do fuel prices affect trade and economic growth?
Q2:
Do high oil prices really inhibit the economy?
The conducted research is particularly important in terms of modelling the fiscal policy of the state and social sentiment related to the uncertainty about high fuel prices. In addition, in the study, apart from classic variables such as GDP, inflation, and fuel prices, other variables were also used, i.e., the volume of sea transport. This is a very important variable, as sea transport is the one that handles the greatest amount of goods in world trade today.
2. Materials and Methods
On the basis of the literature review performed, it is difficult to draw firm conclusions on the significance of fuel prices for economic growth. The system of links between fuel prices and the economy may be very complex and it depends on many factors, which include, above all, the economy’s dependence on given energy sources, the availability of energy and fuel sources, the degree of technological development achieved, or the possibilities of substituting one energy source for another.
Due to the need to include key variables in the model that depict possible interactions between the fuel market and the economy, a selection of variables and choices were made:
- Wholesale fuel oil prices were accepted as an energy price variable. As the energy market is a highly correlated market, the prices of energy from individual sources tend to follow a consistent trend over a long-term period. Furthermore, the market may be considered to be a global market, as domestic prices are strongly correlated with world energy market prices. For this reason, it is sufficient to include one selected representative of the market in the model. The choice fell on fuel oil which, along with black oil, is the key fuel used in maritime transport.
- As a variable representing trade, loading and unloading in Polish seaports was accepted. Maritime transport is the elementary branch related to the international exchange of goods. It transports products of key importance to the economy: crude oil, liquefied gas, metal ores, coal, agricultural produce, vehicles, general cargo, and many others. According to the estimates by Eurostat, shipping handles 77% of European foreign trade and 35% of all trade (in value terms) between the EU Member States. In Polish conditions, the volume of cargo in Polish seaports is several hundred times greater than in Polish airports. All of this points to the key importance of maritime transport in the economy.
- As a variable reflecting the state of the economy, gross domestic product (GDP) at constant prices was selected. Gross domestic product is the most important economic variable. The strength of the economy and the standard of living of the population may be assessed on its basis, and its structure is indicative of the country’s level of technological advancement.
- The deflator was accepted as a variable representing the price level. In economic analyses, the most popular price measures include CPI, PPI, and, precisely, the deflator. The advantage of the deflator lies in the fact that it takes into account the level and variations in the prices of all the products that were traded in the economy at a given time. In general, as in the case of energy prices, inflation indices show a very strong positive correlation, so it is sufficient to include one of them in the model.
The time scope of the research was set for the years 2000–2020. Over the period of time analyzed, several milestone events occurred in the Polish and world economies. These events have permanently changed the condition of the Polish and global economies. The most important ones include Poland’s accession to the European Union in 2004, the global economic crisis in 2008–2009 and the coronavirus pandemic in 2020, i.e., the final year of the analysis.
The modelling of the relationships was based on vector-autoregressive VAR models [44]. These are multiple-equation models where response variables are explained by their own lags and the lags of the other response variables. There are several important advantages to this modelling, particularly when interchangeable variables may be interdependent. These advantages include the following:
- There is no a priori distinction between endogenous and exogenous variables.
- There are no justifiable constraints on the estimated model parameters, including, in particular, the assumption that some parameters must equal zero.
- There is no strict and primary economic theory for modelling which the model is built on.
The construction of the model is very straightforward, and it does not require the researcher to have any special knowledge of the economic structure of connections between variables. This last observation, however, sometimes forms the basis of a criticism of these models, where they are accused of lacking “theoreticality”. However, the developments of VAR models may have features in common with structural modelling, which makes the aforementioned criticism less valid [45].
The model in its output form may be written as:
where:
- —vector of the observations of the current values of the variables,
- Dt—vector of deterministic model variables (e.g., a deterministic trend, deterministic seasonality, the mean of the process),
- A0—matrix of parameters that are positioned by non-stochastic variables,
- Ai—parameter matrices with lagged vector variables Yt,
- —vector of stationary random disturbances.
The model of form (1) was applied to the system of variables:
- Heating oil prices (in PLN/l),
- Seaport cargoes (in thousand tons),
- Unloading in seaports (in thousand tons),
- Gross domestic product (PLN billion, constant 2020 prices),
- Deflator (year 2000 = 1).
These variables were logarithmical so that the model parameters may be interpreted as elasticity indices (in the paper, this model is labelled as model A). It is therefore possible to directly compare the strength of impact between different combinations of variables.
The model in form (1) is a simple structure, as it only requires selecting a group of variables that belong to vector Yt and determining the order of lag k for them. Two lags were used in this study. The results for a larger number of lags did not fundamentally change the conclusions, and the model with two lags is very simple to tabulate.
One problem of model (1) with the indicated set of variables is the trend that occurs in the data. This trend causes the variables to be non-stationary variables. The literature emphasizes that the statistical properties of regression models obtained for non-stationary time series are generally questionable [46], because for non-stationary time series, it is possible to obtain a model with good diagnostic test results even when the regression does not make any sense. A simple solution to this problem is to use a VAR model for incremental variables.
Therefore, a second model was also performed where the relative increments of the aforementioned set of variables were evaluated (in the study, this model is denoted as model B):
- d(Heating oil),
- d(Load),
- d(Unload),
- GDP R/R,
- Inflation R/R.
The VAR model of form (1) can be used to test the causality of variables and it may be useful in forecasting. However, in practice, what may be more important than an interpretation of the model parameters is an interpretation of the results provided by certain tools associated with the VAR model, a particularly interesting tool being the response function. This requires a transformation of the basic model into a structural model [47]. Structural models, which are an alternative to basic models, are considered to be more valuable in an analysis of economic systems [48].
The structural VAR model may be written as follows:
where:
- —vector of observations of the current values of variables,
- Dt—vector of deterministic model variables,
- Γ0—parameter matrix with vector variables Dt,
- B—parameter matrix with unlagged vector variables Yt,
- Γi—parameter matrices with lagged variables Yt,
- ξt—random disturbance vector of the structural model.
The following relationships exist between the basic form and the structural form:
The impulse response function allows an evaluation of the response of a single variable to a unitary variation in other variables included in a multidimensional system. It is necessary here to represent the process in terms of a representation of a moving average:
where , and ξt is white noise with a variance and covariance matrix. The elements of matrix θi contain the responses of the system to unit disturbances. Element θjk,i describes the response of the j-th variable to a unit disturbance of variable k occurring i periods earlier. Owing to an update by o periods, θjk,i describes the response of the j-th variable in the i-th period in advance to the current unit disturbance of variable k.
The formula presented above allows future states of the system to be forecast. The forecast of variables for n periods ahead is:
and the forecast error is:
3. Results
3.1. Formation of the Variables Analyzed
A characteristic feature of most economic variables that depict the state of the economy is a long-term upward trend. In Poland, this trend is primarily the result of continuous technological progress and freedom of international trade; in other countries, it may be additionally stimulated by population growth. This is also the case in this study (Figure 1).
Heating oil prices in Poland are very strongly linked to crude oil prices in world markets (Figure 1a). However, they are more stable in the short term (Figure 1b), while the volatility of crude oil prices ranges from −40% to 40%; the volatility of heating oil prices is significantly lower. From the perspective of the economy, this is a most favorable phenomenon, as the greater stability of heating oil prices means that there is less risk of unfavorable changes in transport costs.
It is worth noting that four of the five variables analyzed are on an upward trend during the period under study, i.e., heating oil prices, seaport unloading, the GDP value, and the overall price level. The volume of unloading in this period is covered by the study (up to the pandemic, it had seen a fivefold increase; the pandemic slowed the exchange down, but it is still very high compared to the first and second decades). Heating oil prices saw their peak in 2012, where they were two times higher than at the beginning of the period under study, and they began to decline after that year. Poland has seen a roughly twofold increase in the real GDP since 2000, and the price level at the end of the period under review was almost 60% higher than in 2000. These figures show that the volume of unloading was the fastest growing variable.
Considering the purpose of the present study, the behavior of economic growth during the period of rapid fuel price increases (2000–2012) and during the period of a greater price stabilization (2012–2019) is particularly interesting. The year 2020 can be removed from the assessment as a pandemic year. It is evident that in the period 2000–2012, the average annual economic growth was 3.74%, and in the period 2012–2019, this was slightly better because the average annual growth was 3.80%. The difference between these values is not significant enough to conclude that the stabilization or even a partial reduction of fuel prices in 2012–2019 contributed to making economic growth more dynamic. On the other hand, what is in favor of lower fuel prices is the situation with regard to the dynamics of unloading in Polish seaports, as it becomes evident that in the period of rapidly rising fuel prices (2000–2012), the average annual increase in the amounts of cargo unloaded in seaports was 7.03%, while in the period of stabilizing fuel prices (2012–2019), this was an annual average of 11.04%. Other events may have influenced such results, but fuel prices can be considered to be a potentially important factor.
The four variables highlighted, i.e., heating oil prices, seaport unloading, the GDP value, and the general price level, are strongly and very strongly correlated with each other in the long term. The values of the correlation coefficients of all the variables in this group range from ca. 0.70 for heating oil and unloading to 0.98 for GDP and the deflator.
A completely different situation applies to loading in Polish seaports. This variable is the only one among those analyzed to be in a sideways trend. At the beginning of the period analyzed, more goods were loaded onto ships in Polish seaports than unloaded (twice as many); in 2007, these values levelled off and, from 2011, unloading started to clearly dominate over loading. Currently, it is the volume of unloading that is two times greater than that of unloading. There is no long-term correlation between loading in Polish seaports and the other variables.
Another fairly important characteristic of the quantities studied is their variability. This may be read from the graphs in the right-hand column. The loading and unloading volumes are the most variable. In the case of loading, the changes recorded ranged from ca. −20% to 40% per year, and in the case of unloading, this was from ca. −30% to 30%. Heating oil prices were more stable, for which the annual variation ranged from −12% to 12%. The gross domestic product saw a decline of 2.5% once only: in 2020. Throughout the period up to 2020, GDP had been gaining in value year on year, with the best year in terms of the growth rate being 2007, when an economic growth of 7% was recorded. Prices were on an upward trajectory from year to year, with the lowest inflation between 2013 and 2018 and the highest in 2004 and 2020.
As regards correlations between the incremental variables, there was one particularly strong one. This concerned the growth in unloading operations and an economic growth. The strength of this relationship, measured by the correlation coefficient, reached 0.84. By combining the result of the correlation of the levels and increments, it can be noted that unloading and GDP are strongly correlated both in the long and short terms. In contrast, the short-term volatility of fuel prices correlates weakly but positively with the short-term volatility of the other economic variables; for unloading, this is 0.53, for the economic growth it is 0.42 and, for inflation, this is 0.25. A positive result of the correlation of a short-run volatility of fuel prices and inflation is expected, while a positive result of the short-run volatility of fuel prices and the economic growth is further evidence that fuel price increases do not pose an obstacle to achieving good economic growth.
3.2. Model Approach to the Interaction between Fuel Prices, Maritime Transport, Economic Growth and Inflation
A model of the interaction between the levels of the highlighted economic variables in the form of an impulse response function is shown in Figure 2 (model A for the levels of the variables) and in Figure 3 (model B for the increments of the variables). The information contained in these models complements the observations made in Section 3.1. Here, this a slightly different perspective on these situations, as Section 3.1 discussed similarities and differences in terms of dynamics and correlational linkages, while here this is forecasting possibilities, i.e., it is information on how the values of the selected variables could potentially develop in the future in response to a current change in the level or a change in the increment of the variable considered as independent. It is also worth noting that impulse response functions, unlike a simple correlation study, assume a constant level of the other exogenous variables in the model.
Considering the aim of the study, the most important information can be read from the impulse response functions highlighted in red:
- Fuel prices do not affect the volume of loading at Polish seaports (response of Load to Oil, response of d(Load) to d(Oil)). Thus, what Poland dispatches by sea depends on other factors. The current loading balance is very unfavorable for Poland, which may suggest domestic production being unattractive to foreign buyers.
- Fuel prices have a negative yet weak impact (on the verge of statistical significance) on unloading in Polish seaports (response of Unload to Oil, response of d(Unload) to d(Oil)). Over the period covered by the study, unloading in Polish seaports was growing very dynamically, but it was noted that unloading dynamics were highest in the period of fuel price stabilization (2012–2019). A combination of the results from Section 3.1 and the impulse response function suggests that for a good result in terms of dynamizing unloading, it is sufficient for prices not to increase, so stabilizing them on a high level is not an obstacle.
- Fuel prices clearly have a negative impact on the future economic growth (response of GDP to Oil, response of d(GDP) to d(Oil)). This result does not contradict the one obtained in Section 3.1, where it was noted that an average economic growth dynamic during a period of rapid fuel price increases and fuel price stabilization is equally high. Lower fuel prices may affect dynamic economic growth, although these are not an absolute cause of it.
- Changes in fuel prices affect inflation fairly quickly and, as expected, their impact is positive (response of Deflator to Oil, response of Inflation to d(Oil)).
The modelling carried out allows for a broad view of the problem of interactions between the group of variables under study. However, the interpreted relationships should be consistent with the economic theory. The advantage of VAR modelling is precisely such a broad view of the economy, but the disadvantage is the so-called atheoretical nature. In the models presented, such controversial elements do appear, e.g., a negative response of fuel prices to changes in loading and unloading in Polish seaports (response of Oil to Load and Unload, response of d(Oil) to d(Load) and d(Unload)). It is difficult to interpret such a relationship in a reliable manner as the fuel market needs to be perceived as a global market, which is prominently highlighted by the data in Figure 1a,b, while loading and unloading in Polish seaports is important for the domestic economy, yet this is a small part of trade globally.
There are also elements in the models presented that confirm the previous research and that are consistent with the economic theory. These include, for example:
- a positive effect of economic growth on fuel price increases (response of d(Oil) to d(GDP)),
- a positive impact of economic growth on unloading in Polish seaports (response of Unload to GDP, response of d(Unload) to d(GDP)),
- a negative impact of inflation on unloading in Polish seaports (response of Unload to Deflator, response of d(Unload) to Inflation),
- a negative impact of inflation on the economic growth (response of GDP to Deflator, response of d(GDP) to Inflation),
- a positive effect of the economic growth on inflation (response of Deflator to GDP, response of Inflation to d(GDP)).
Therefore, the vast majority of reactions are in line with the economic theory. Furthermore, these reactions can be observed in parallel.
4. Discussion
Since the mid-19th century, when the industrial use of crude oil began, it has gradually become the world’s key energy product. Its demand, supply, and prices are considered to be among the main indicators of the global economic activity. Even today, when a lot of attention is paid to alternative energy sources, crude oil and its derivatives remain to be the most important fuel for transport, and in many countries oil is the primary raw material for electricity production. Therefore, the view among economists is that there is a strong correlation between a country’s economic growth rate and variations in oil prices. Virtually all studies suggest that fluctuations in oil prices have a significant impact on economic activity, but the effects will be different for oil imports and different for oil exports.
The literature mainly discusses two transmission mechanisms through which oil prices affect real economic activity; these are supply and demand channels. The negative supply side effects of oil price increases are related to the fact that oil is the primary raw material for production and, as a consequence, an increase in oil prices leads to an increase in production costs, prompting companies either to reduce production or to increase prices. Variations in oil prices also have implications on the consumer and investment demand side. An increase in oil prices reduces the value of disposable income and, consequently, the value of the purchases of other commodities. The strength of this effect is greater the more the shock is perceived to be long-lasting. In addition, oil prices have a negative impact on investment by increasing costs for companies.
Since the time when the world became heavily dependent on oil products, the relationship between oil prices and economic growth has attracted considerable interest among economists over the years, and extensive technical literature is available on various aspects of the subject. However, it is not so clear whether the oil price can be seen as an economic indicator of GDP growth.
Early empirical studies indicated that there was a negative linear relationship between oil prices and real activity in oil-importing countries [49,50,51,52]. One of the more important studies conducted in the 1990s pointed to a strong link between rising oil prices and subsequent economic declines in most of the post-Second World War recessions in the US economy [53].
Macroeconomic shocks associated with the rise in oil prices were explained by indirect transmission mechanisms, in particular negative consequences for the labor market [54,55,56], investment uncertainty [57,58], reduced consumption and investment in durable goods [59,60,61], and through inflationary channels [62,63,64].
A breakthrough study on the impact of oil prices on economic activity was that by Mork [65]. He demonstrated that the relationship between oil prices and economic activity is not linear but asymmetric. According to this research, increases in oil prices have a negative effect on economic growth, while decreases in oil prices have no significant effect on economic growth. The conclusions of this study were developed further in subsequent years [66,67].
The closer one moves to modern times, the more often studies appear in the literature suggesting that the impact of oil prices on the economy is not as obvious as the economic theory states. First of all, it was observed that there is no impediment to these two variables remaining in upward trends at the same time, and that a possible negative impact may only be for highly energy-intensive manufacturing industries [68]. The results of the research carried out for the Polish economy in this paper are part of this trend. It is evident that the relationship between fuel prices and economic activity is not a simple one. First of all, a simultaneous upward trend in fuel prices and gross domestic production is possible. One may therefore unequivocally say that low fuel prices are not a prerequisite for national development. A country, even an oil importer, may develop under conditions of higher fuel prices. On the other hand, lower fuel prices may be an element that promotes economic growth. Fuel prices are an important cause of inflation, so the key question is not whether fuel prices are a cause of economic growth, but whether inflation is a destabilizing factor for economic growth. In general, it may be stated that the rate of technological progress is nowadays on such a level that it largely offsets any adverse impacts of oil price increases. Oil is still an important strategic commodity, but the world is now sufficiently developed to counteract adverse oil price variations much more effectively than during the crisis of the 1970s.
5. Conclusions
Today, following the coronavirus pandemic, many countries are facing elevated inflation. On the one hand, this is the result of the loosening of monetary and fiscal policy from period of the coronavirus pandemic. On the other hand, at the same time, there are serious tensions in the world’s energy policy. Some countries, including Poland, have used tax reliefs, such as a reduction of VAT on fuel. This is supposed to protect the economy from over-inflation and an economic slowdown. This is also an expression of the belief that lower fuel price growth dynamics will benefit the economy. The question arises as to the effectiveness of such a course of action. It should be noted here that, first and foremost, an excessive money supply after the pandemic must find its equilibrium with the level of domestic production, so an overall price increase is inevitable. Fiscal programs designed to curb price increases may slow down this process but also prolong it over time. Therefore, this is a certain choice between higher inflation yet a quicker arrival at stabilization, or lower inflation but a much longer period of arrival at stabilization.
Therefore, one may unequivocally state that:
- low fuel prices are not a prerequisite for a country’s development. A country, even an oil importer, may develop under conditions of higher fuel prices;
- panic over high fuel prices only further fuels the inflationary spiral;
- fiscal policy should not be a short-term search for opportunities to slow down inflationary processes but, above all, to take care of sufficiently rapid economic growth, as well as the current and future condition of public finances.
Funding
This research received no external funding.
Institutional Review Board Statement
Not applicable.
Informed Consent Statement
Not applicable.
Data Availability Statement
Publicly available data.
Conflicts of Interest
The author declare no conflict of interest.
References
- Cashin, P.; Liang, H.; McDermott, C.J. How persistent are shocks to world commodity prices? IMF Staff Pap. 2000, 47, 177–217. [Google Scholar]
- Sarmah, A.; Bal, D.P. Does Crude Oil Price Affect the Inflation Rate and Economic Growth in India? A New Insight Based on Structural VAR Framework. Indian Econ. J. 2021, 69, 123–139. [Google Scholar] [CrossRef]
- Bobai, F.D. An analysis of the relationship between petroleum prices and inflation in Nigeria. Int. J. Bus. Commer. 2012, 1, 1–7. [Google Scholar]
- Huntington, H.G. The Economic Consequences of Higher Crude Oil Prices; Energy Modeling Special Report, 9. Energy Modeling Forum workshop (February 8, 2005); Marymount University, Ballston Campus: Arlington, VA, USA, 2005. [Google Scholar]
- Peker, O.; Mercan, M. The inflationary effect of price increases in oil products in Turkey. Ege Acad. Rev. 2011, 11, 553–562. [Google Scholar]
- Sek, S.K.; Teo, X.Q.; Wong, Y.N. A comparative study on the effects of oil price changes on inflation. Procedia Econ. Financ. 2015, 26, 630–636. [Google Scholar] [CrossRef]
- Taghizadeh-Hesary, F.; Yoshino, N.; Mohammadi Hossein Abadi, M.; Farboudmanesh, R. Response of macro variables of emerging and developed oil importers to oil price movements. J. Asia Pac. Econ. 2016, 21, 91–102. [Google Scholar] [CrossRef]
- Chou, K.W.; Tseng, Y.H. Oil price pass-through into CPI inflation in Asian emerging countries: The discussion of dramatic oil price shocks and high oil price periods. Br. J. Econ. Financ. Manag. Sci. 2011, 2, 1–13. [Google Scholar]
- Cunado, J.; Gracia, F.P. Do oil price shocks matter? Evidence for some European countries. Energy Econ. 2003, 25, 137–154. [Google Scholar] [CrossRef]
- Du, L.; He, Y.; Chu, W. The relationship between oil price shocks and China’s macro-economy: An empirical analysis. Energy Policy 2010, 38, 4142–4151. [Google Scholar] [CrossRef]
- Le Blanc, M.; Chinn, M. Do High Oil Price Presage Inflation? The Evidence from G-5 Countries; Working Paper, WP1021; Santa Cruz Center for International Economics: Santa Cruz, CA, USA, 2004. [Google Scholar]
- Guney, P.O.G.E.; Hasanov, M. The effects of oil prices changes on output growth and inflation: Evidence from Turkey. J. Econ. Behav. Stud. 2013, 5, 730–739. [Google Scholar] [CrossRef]
- Long, S.; Liang, J. Asymmetric and nonlinear pass-through of global crude oil price to China’s PPI and CPI inflation. Econ. Res.-Ekon. Istraživanja 2018, 31, 240–251. [Google Scholar] [CrossRef]
- Abu-Bakar, M.; Masih, M. Is the Oil Price Pass-through to Domestic Inflation Symmetric or Asymmetric? New Evidence from India Based on NARDL. 2018. Available online: https://mpra.ub.uni-muenchen.de/87569/ (accessed on 1 May 2022).
- Pandey, A.; Shettigar, J. Relationship between crude oil price, money supply and inflation in India. Int. J. Adv. Res. Manag. Soc. Sci. 2016, 5, 20–31. [Google Scholar]
- Newbery, D.M. Power Markets and Market Power. Energy J. 1995, 16, 39–66. [Google Scholar] [CrossRef]
- Federal Energy Regulatory Commission. A Handbook of Energy Market Basics; Energy Primer Staff Report; Federal Energy Regulatory Commission: Washington, DC, USA, 2020. [Google Scholar]
- MacKay, A.; Mercadal, I. Deregulation, Market Power, and Prices: Evidence from the Electricity Sector; Working Paper 21-095; Harvard Business School: Boston, MA, USA, 2021. [Google Scholar]
- Brown, S.P.; Yücel, M.K. Energy prices and aggregate economic activity: An interpretative survey. Q. Rev. Econ. Financ. 2002, 42, 193–208. [Google Scholar] [CrossRef]
- Tang, W.; Wu, L.; Zhang, Z. Oil price shocks and their short-and long-term effects on the Chinese economy. Energy Econ. 2010, 32, S3–S14. [Google Scholar] [CrossRef] [Green Version]
- Varghese, G. Inflationary effects of oil price shocks in Indian economy. J. Public Aff. 2017, 17, e1614. [Google Scholar] [CrossRef]
- Blanchard, O.J.; Gali, J. The Macroeconomic Effects of Oil Shocks: Why Are the 2000s So Different from the 1970s? National Bureau of Economic Research Working Paper Series No. 13368; National Bureau of Economic Research: Cambridge, MA, USA, 2007. [Google Scholar]
- Kilian, L. The Economic Effects of Energy Price Shocks. J. Econ. Lit. 2008, 46, 871–909. [Google Scholar] [CrossRef]
- Levent, A.; Acar, M. Economic Impact of Oil Price Shocks on the Turkish Economy in the Coming Decades: A Dynamic CGE Analysis. Energy Policy 2011, 39, 1722–1731. [Google Scholar]
- Cermáková, K.; Hromada, E. Change in the Affordability of Owner-Occupied Housing in the Context of Rising Energy Prices. Energies 2022, 15, 1281. [Google Scholar] [CrossRef]
- Hromada, E.; Cermáková, K. Financial unavailability of housing in the Czech Republic and recommendations for its solution. Int. J. Econ. Sci. 2021, X, 47–58. [Google Scholar] [CrossRef]
- Taghizadeh-Hesary, F.; Yoshino, N.; Abdoli, G.; Farzinvash, A. An Estimation of the Impact of Oil Shocks on Crude Oil Exporting Economies and Their Trade Partners. Front. Econ. China 2013, 8, 571–591. [Google Scholar]
- Taghizadeh-Hesary, F.; Yoshino, N. Monetary Policies and Oil Price Determination: An Empirical Analysis. OPEC Energy Rev. 2014, 38, 1–20. [Google Scholar] [CrossRef]
- Taghizadeh-Hesary, F.; Yoshino, N. Impact of Expansionary Monetary Policy on Crude Oil Prices. In Monetary Policy and the Oil Market; Springer: Tokyo, Japan, 2016; pp. 7–27. [Google Scholar]
- Yoshino, N.; Taghizadeh-Hesary, F. Monetary Policy and Oil Price Fluctuations Following the Subprime Mortgage Crisis. Int. J. Monet. Econ. Financ. 2014, 7, 157–174. [Google Scholar] [CrossRef]
- Sims, C.A. Interpreting the Macroeconomic Time Series Facts: The Effects of Monetary Policy. Eur. Econ. Rev. 1992, 36, 975–1000. [Google Scholar] [CrossRef]
- Romer, C.D.; Romer, D.H. Does Monetary Policy Matter? A New Test in the Spirit of Friedman and Schwartz. NBER Macroecon. Annu. 1989, 4, 121–184. [Google Scholar] [CrossRef]
- Yoshino, N.; Taghizadeh-Hesary, F.; Hassanzadeh, A.; Prasetyo, A.D. Response of Stock Markets to Monetary Policy: The Tehran Stock Market Perspective. J. Comp. Asian Dev. 2014, 13, 517–545. [Google Scholar] [CrossRef]
- Yoshino, N.; Taghizadeh-Hesary, F. Effectiveness of the Easing of Monetary Policy in the Japanese Economy, Incorporating Energy Prices. J. Comp. Asian Dev. 2015, 14, 227–248. [Google Scholar] [CrossRef] [Green Version]
- Bernanke, B.S.; Gertler, M.; Watson, M. Systematic Monetary Policy and the Effects of Oil Price Shocks. Brook. Pap. Econ. Act. 1997, 1, 91–157. [Google Scholar] [CrossRef]
- Barsky, R.B.; Kilian, L. Do We Really Know that Oil Caused the Great Stagflation? A Monetary Alternative. In NBER Macroeconomics Annual 2001; Bernanke, B.S., Rogoff, K., Eds.; MIT Press: Cambridge, MA, USA, 2002; pp. 137–183. [Google Scholar]
- Leduc, S.; Sill, K. A Quantitative Analysis of Oil-Price Shocks, Systematic Monetary Policy, and Economic Downturns. J. Monet. Econ. 2004, 51, 781–808. [Google Scholar] [CrossRef]
- Hamilton, J.D.; Herrera, A.M. Oil Shocks and Aggregate Macroeconomic Behavior: The Role of Monetary Policy. J. Money Credit. Bank. 2004, 36, 265–286. [Google Scholar] [CrossRef]
- Korhonen, I.; Ledyaeva, S. Trade Linkages and Macroeconomic Effects of the Price of Oil. Energy Econ. 2010, 32, 848–856. [Google Scholar] [CrossRef]
- Jiménez-Rodríguez, R.; Sánchez, M. Oil Price Shocks and Real GDP Growth: Empirical Evidence for Some OECD Countries; European Central Bank Working Paper Series, No. 362; European Central Bank: Frankfurt, Germany, 2004. [Google Scholar]
- Kilian, L. A Comparison of the Effects of Exogenous Oil Supply Shocks on Output and Inflation in the G7 Countries. J. Eur. Econ. Assoc. 2008, 6, 78–121. [Google Scholar] [CrossRef]
- Bednár, O.; Cecrdlová, A.; Kaderábková, B.; Režábek, P. Energy Prices Impact on Inflationary Spiral. Energies 2022, 15, 3443. [Google Scholar] [CrossRef]
- Przekota, G.; Szczepańska-Przekota, A. Pro-Inflationary Impact of the Oil Market—A Study for Poland. Energies 2022, 15, 3045. [Google Scholar] [CrossRef]
- Sims, C.A. Macroeconomics and reality. Econometrica 1980, 48, 1–48. [Google Scholar] [CrossRef]
- Kusideł, E. Modelowanie Wektorowo-Autoregresyjne VAR. Metodologia i Zastosowanie w Badaniach Ekonomicznych; Absolwent Publisher: Łódź, Poland, 2000. [Google Scholar]
- Phillips, P.C.B. Understanding Spurious Regressions in Econometrics. J. Econom. 1986, 33, 311–340. [Google Scholar] [CrossRef]
- Enders, W. Applied Econometric Time Series; John Wiley & Sons: New York, NY, USA, 2004. [Google Scholar]
- Osińska, M. Ekonometria Współczesna; Dom Organizatora: Toruń, Poland, 2007. [Google Scholar]
- Darby, M.R. The price of oil and world inflation and recession. Am. Econ. Rev. 1982, 72, 738–751. [Google Scholar]
- Tatom, J.A. Energy Prices and Short-Run Economic Performance. Fed. Reserve Bank St. Louis Rev. 1981, 63, 3–17. [Google Scholar] [CrossRef] [Green Version]
- Burbidge, J.; Harrison, A. Testing for the effect of oil price rises using vector autoregressions. Int. Econ. Rev. 1984, 25, 459–484. [Google Scholar] [CrossRef]
- Gisser, M.; Goodwin, T.H. Crude oil and the macroeconomy: Tests of some popular notions. J. Money Credit. Bank. 1986, 18, 95–103. [Google Scholar] [CrossRef]
- Hamilton, J.D. Oil and the macroeconomy since World War II. J. Political Econ. 1983, 91, 228–248. [Google Scholar] [CrossRef]
- Loungani, P. Oil price shocks and the dispersion hypothesis. Rev. Econ. Stat. 1986, 68, 536–539. [Google Scholar] [CrossRef]
- Finn, M.G. Perfect Competition and the Effects of Energy Price Increases on Economic Activity. J. Money Credit. Bank. 2000, 32, 400–416. [Google Scholar] [CrossRef]
- Davis, S.J.; Haltiwanger, J. Sectoral job creation and destruction responses to oil price changes. J. Monet. Econ. 2001, 48, 465–512. [Google Scholar] [CrossRef]
- Bernanke, B. Irreversibility, Uncertainty, and Cyclical Investment. Q. J. Econ. 1983, 98, 85–106. [Google Scholar] [CrossRef]
- Dixit, A.K.; Pindyck, R.S. Investment under Uncertainty; Princeton University Press: Princeton, NJ, USA, 1984. [Google Scholar]
- Hamilton, J.D. A neoclassical model of unemployment and the business cycle. J. Political Econ. 1988, 96, 593–617. [Google Scholar] [CrossRef]
- Hamilton, J.D. What is an oil shock? J. Econom. 2003, 113, 363–398. [Google Scholar] [CrossRef]
- Lee, K.; Ni, S. On the Dynamic Effects of Oil Price Shocks: A Study Using Industry Level Data. J. Monet. Econ. 2002, 49, 823–852. [Google Scholar] [CrossRef] [Green Version]
- Pierce, J.L.; Enzler, J.J. The effects of external inflationary shocks. Brook. Pap. Econ. Act. 1974, 1974, 13–61. [Google Scholar] [CrossRef]
- Mork, K.A. Energy prices, inflation, and economic activity: Editor’s overview. In Energy Prices, Inflation, and Economic Activity; Mork, K.A., Ed.; Ballinger Publishing: Cambridge, MA, USA, 1981. [Google Scholar]
- Buno, M.; Sachs, J. Input Price Shocks and the Slowdown in Economic Growth: The Case of U.K. Manufacturing. Rev. Econ. Stud. 1982, 49, 679–705. [Google Scholar]
- Mork, K.A. Oil and the macroeconomy when prices go up and down: An extension of Hamilton’s results. J. Political Econ. 1989, 97, 740–744. [Google Scholar] [CrossRef]
- Lee, K.; Ni, S.; Ratti, R.A. Oil shocks and the macroeconomy: The role of price variability. Energy J. 1995, 16, 39–56. [Google Scholar] [CrossRef]
- Hamilton, J.D. This is what happened to the oil price macroeconomy relationship. J. Monet. Econ. 1996, 38, 215–220. [Google Scholar] [CrossRef]
- Adelman, A. The real Oil problem. Regulation 2004, 27, 16–21. [Google Scholar]
Figure 1.
Formation of variables analyzed. (a) Heating oil and crude oil prices. (b) Fuel price dynamics. (c) Transhipments in seaports. (d) Dynamics of transhipments in seaports. (e) GDP value and deflator. (f) GDP dynamics and Y/Y inflation.
Figure 1.
Formation of variables analyzed. (a) Heating oil and crude oil prices. (b) Fuel price dynamics. (c) Transhipments in seaports. (d) Dynamics of transhipments in seaports. (e) GDP value and deflator. (f) GDP dynamics and Y/Y inflation.
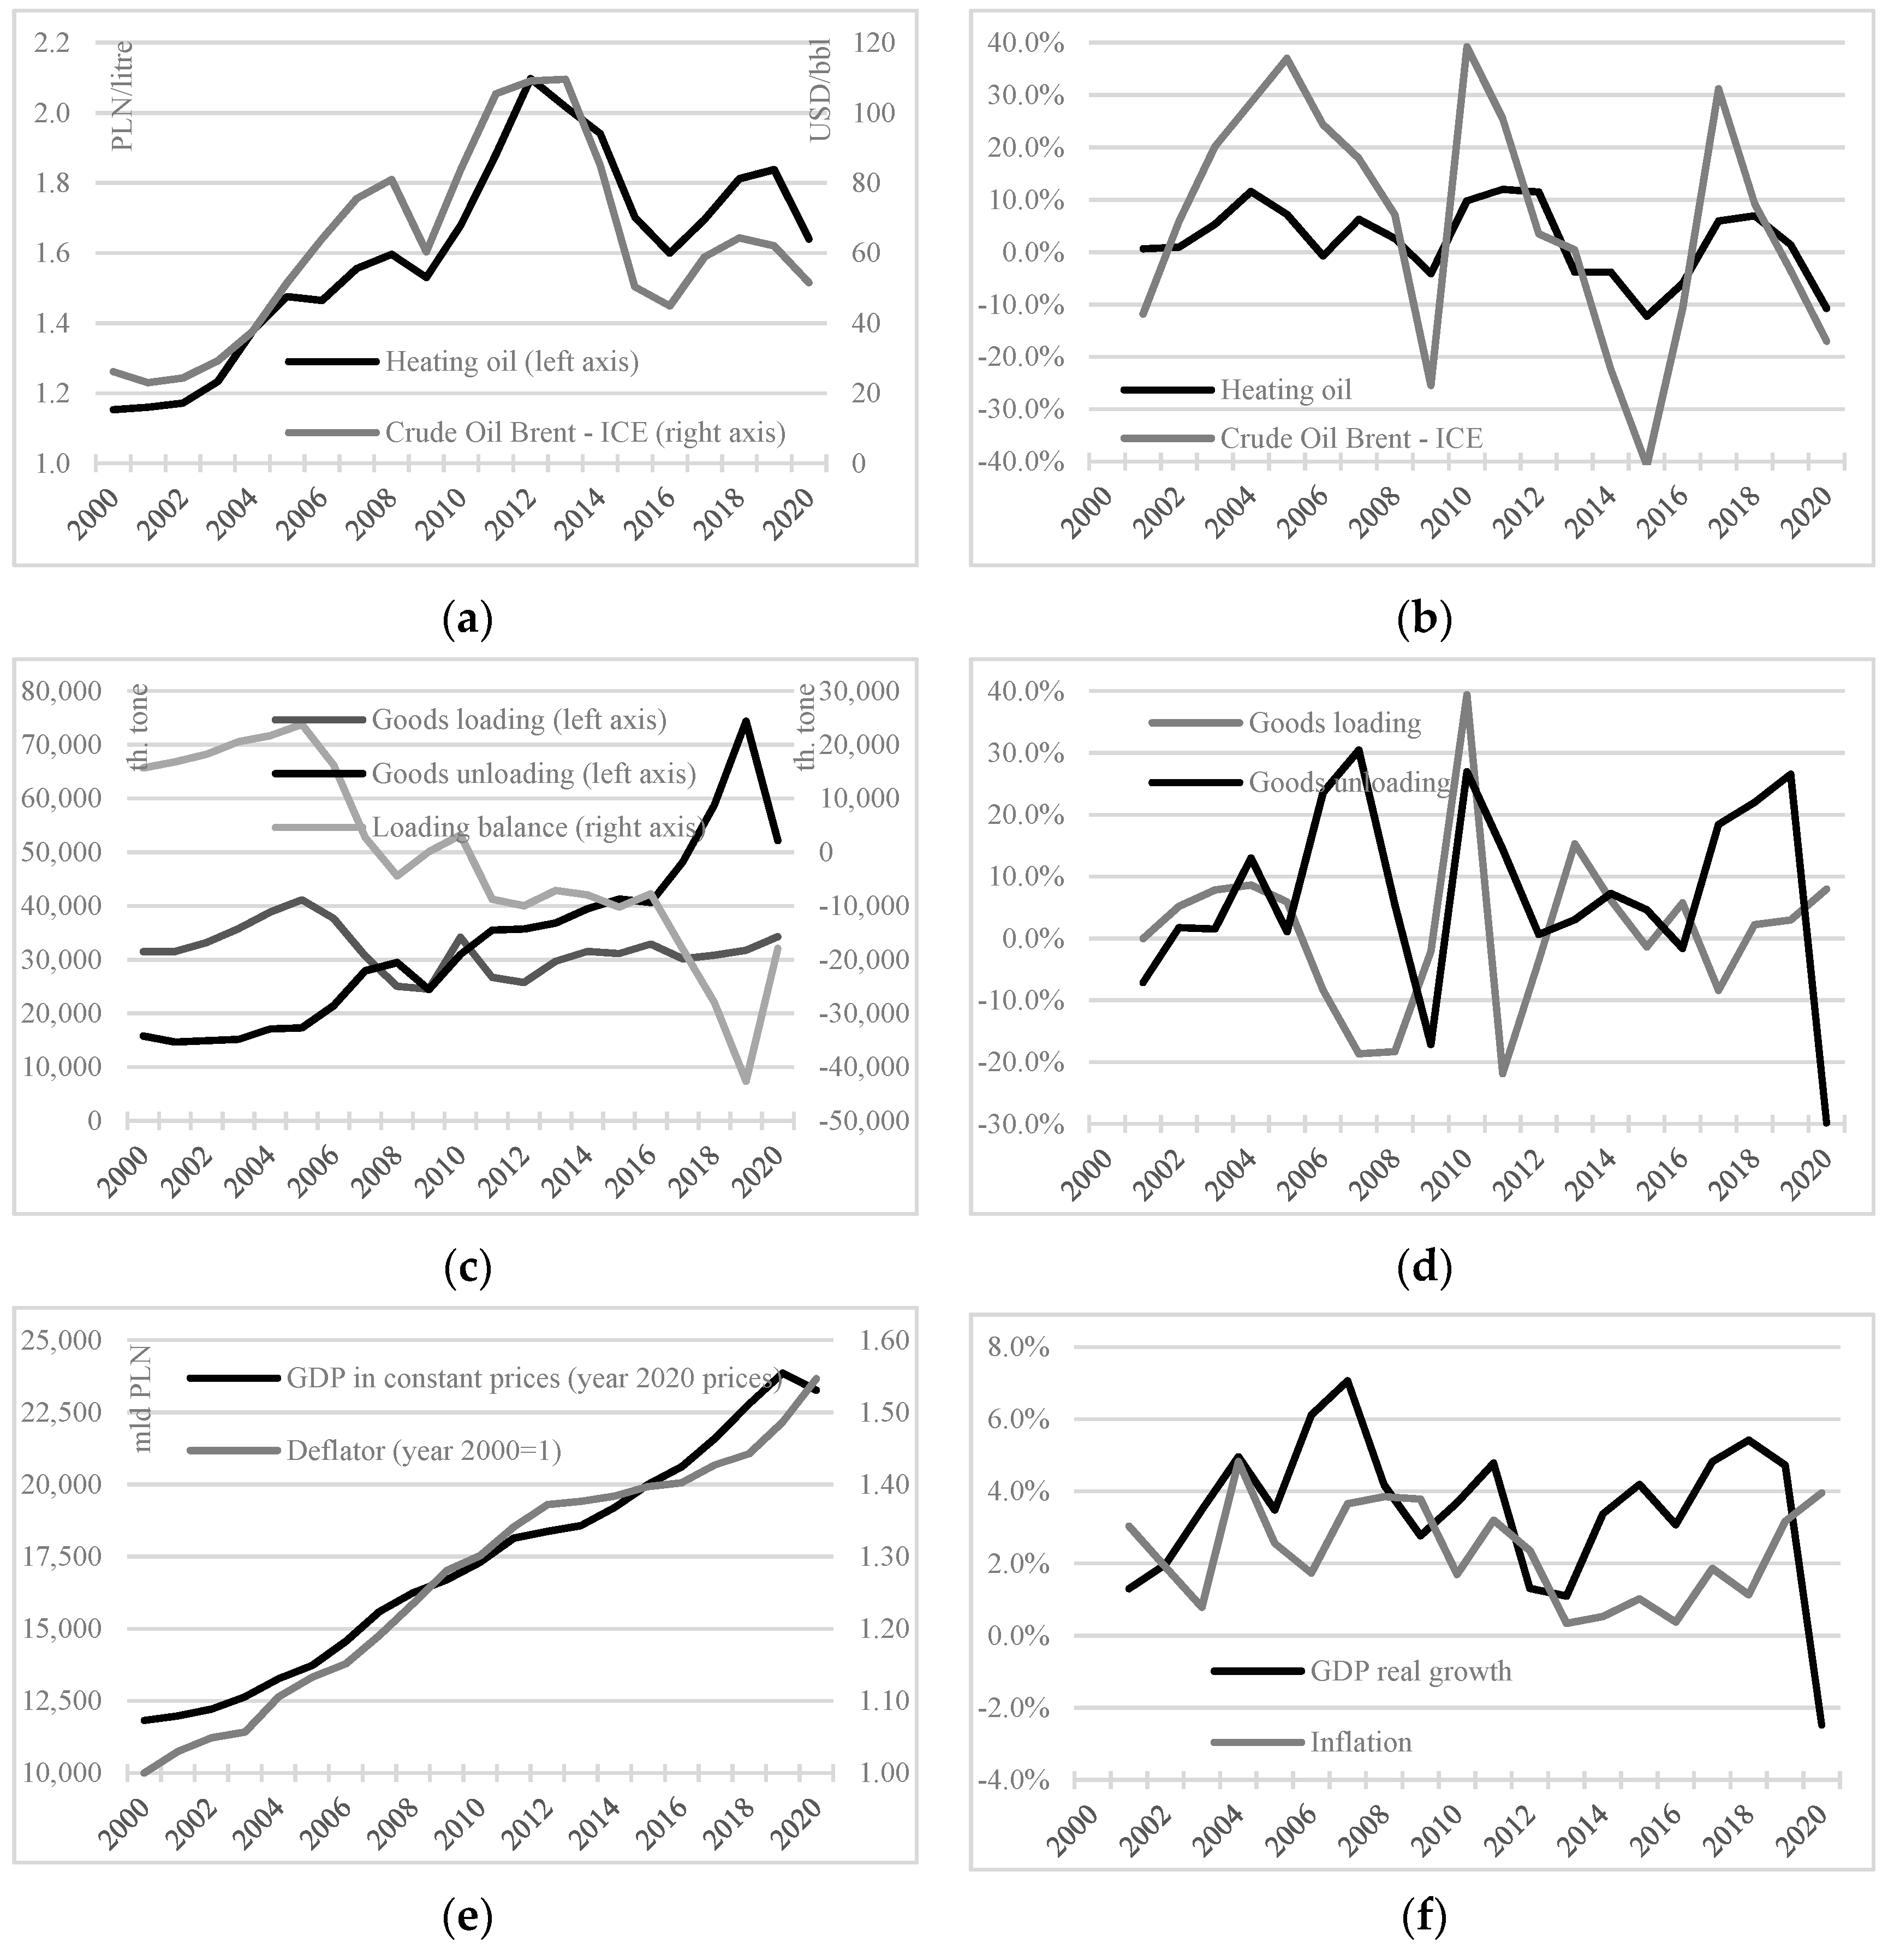
Figure 2.
Impulse response functions: levels of variables (model A). Red line—95% confidence interval.
Figure 2.
Impulse response functions: levels of variables (model A). Red line—95% confidence interval.

Figure 3.
Impulse response functions: variable increments (model B). Red line—95% confidence interval.
Figure 3.
Impulse response functions: variable increments (model B). Red line—95% confidence interval.

Publisher’s Note: MDPI stays neutral with regard to jurisdictional claims in published maps and institutional affiliations. |
© 2022 by the author. Licensee MDPI, Basel, Switzerland. This article is an open access article distributed under the terms and conditions of the Creative Commons Attribution (CC BY) license (https://creativecommons.org/licenses/by/4.0/).
Share and Cite
MDPI and ACS Style
Przekota, G. Do High Fuel Prices Pose an Obstacle to Economic Growth? A Study for Poland. Energies 2022, 15, 6606. https://doi.org/10.3390/en15186606
AMA Style
Przekota G. Do High Fuel Prices Pose an Obstacle to Economic Growth? A Study for Poland. Energies. 2022; 15(18):6606. https://doi.org/10.3390/en15186606
Chicago/Turabian StylePrzekota, Grzegorz. 2022. "Do High Fuel Prices Pose an Obstacle to Economic Growth? A Study for Poland" Energies 15, no. 18: 6606. https://doi.org/10.3390/en15186606
Note that from the first issue of 2016, this journal uses article numbers instead of page numbers. See further details here.