Article

Identification of Lightning Overvoltage in Unmanned Aerial Vehicles

Department of Electrical and Computer Engineering Fundamentals, Rzeszow University of Technology, ul. W. Pola, 35-959 Rzeszów, Poland
*
Author to whom correspondence should be addressed.
Energies 2022, 15(18), 6609; https://doi.org/10.3390/en15186609
Submission received: 20 July 2022 / Revised: 5 September 2022 / Accepted: 8 September 2022 / Published: 9 September 2022

Abstract

:
This paper presents research on the model developed in the Matlab environment for simulating effects of overvoltage in an unmanned aerial vehicle (UAV) upon lightning discharge. They are based on transmittance obtained from voltage surge impulse measured in drone circuits. Overvoltage waveforms were measured at the input and output of different parts of the machine. It was then possible to calculate the transmittance of those (chosen) circuits. The motors, supply system, communication lines, and sensors were primarily tested. Both positive and negative polarization of the surge pulse were used and compared. The shape of pulse, is standardized by international norms for avionics tests (RTCA DO-160). The special surge generators were used to prepare the same repetition of each pulse (for all measurements). The simplified model of surge pulses propagation in drone circuits was prepared in Matlab. The differential between direct and step-by-step paths of pulse propagation in some connected circuits were also compared.

1. Introduction

The use of drones (unmanned aerial vehicles—UAV) is gaining more and more importance. Not only for military purposes, but also in civil applications. For example, geodesy, cinematography, security, monitoring, and entertainment [1]. Popular drones (intended for entertainment) with low purchase costs were selected for the research due to the destructive nature of the research. This allowed us to avoid costly mistakes and prepare preliminary results for further studies of more advanced and more expensive designs.
The purpose for which drones will be used determines the conditions under which they will operate [2]. In many cases, these machines will often work in bad weather conditions [3]. The real threat to the drone is lightning [4]. Lightning discharge is characterized by current (from several to a hundred kiloamps) that generates LEMP (Lightning ElectroMagnetic imPulse) [5]. The most common threat to UAV is LEMP from cloud-to-ground (CG) lightning (90% with negative polarity) [6,7]. Cloud-to-cloud (CC) discharges are too high for UAVs, so the focus was only on cloud-to-ground (CG) discharges [8,9]. That potential (different for positive or negative polarity) can generate overvoltage in the drone’s circuits (in connections, coils, antennas etc.) [5,10]. The value of overvoltage is determined, for example, by the distance between lightning and the object. Measurement of overvoltage in UAV in real lightning conditions (storms) is impossible for a number of reasons, including the possibility of damage to the measurement equipment and drone. In order to ensure stable measuring conditions, research has been carried out in laboratories with specialized generators for aircraft testing. Testing drones in the air is not possible due to the weight of the measuring equipment. We can measure overvoltage on vehicles, buildings, telecommunication masts, and other objects during a storm, but not UAVs (strong wind, rainfall).
The research presented in this article is a continuation of the previous one [11] related to the initial analysis of overvoltage in UAV circuits. Further measurements and results allowed development of a mathematical model of the drone in Matlab software, which is the most important part of the issues described here. The focus was on developing a block model based on transmittance, which allows the object to be freely configured for simulation. Thanks to many other studies, it was possible to compare these results with the actual overvoltage measured in the drone’s circuits. In addition, research is carried out on the influence of the electric field on overvoltage in UAV circuits. The results of our research related to the analysis of the influence of the magnetic field have already been published [12]. All research was made using the voltage waveform (WF4) described in the international standard for lightning resistance for avionics, RTCA DO-160 [13,14,15]. The MIG0618SS generator was set to produce a single-stroke voltage impulse with a waveshape of 6.4/69 µs for open circuit conditions (pin injection method). The generator has a wide range of applications. It allows generation of different pulse shapes (e.g., 6.4/69 µs, 40/120 µs) with positive and negative polarity. It enables the generation of surges by injection and induction in cable bundles up to 3.4 kV (minimum 125 V). It was then possible to carry out repeated measurements for different circuits in the same measurement conditions. Based on the results, it was possible to develop transmittance of all main blocks of the machine. This enabled performance of a simulation model in Matlab, which made it possible to demonstrate the propagation of disturbances inside the drone [16,17,18,19]. Results of simulations were compared to real measures for the same circuits.

2. Electromagnetic Field of Lightning Discharge

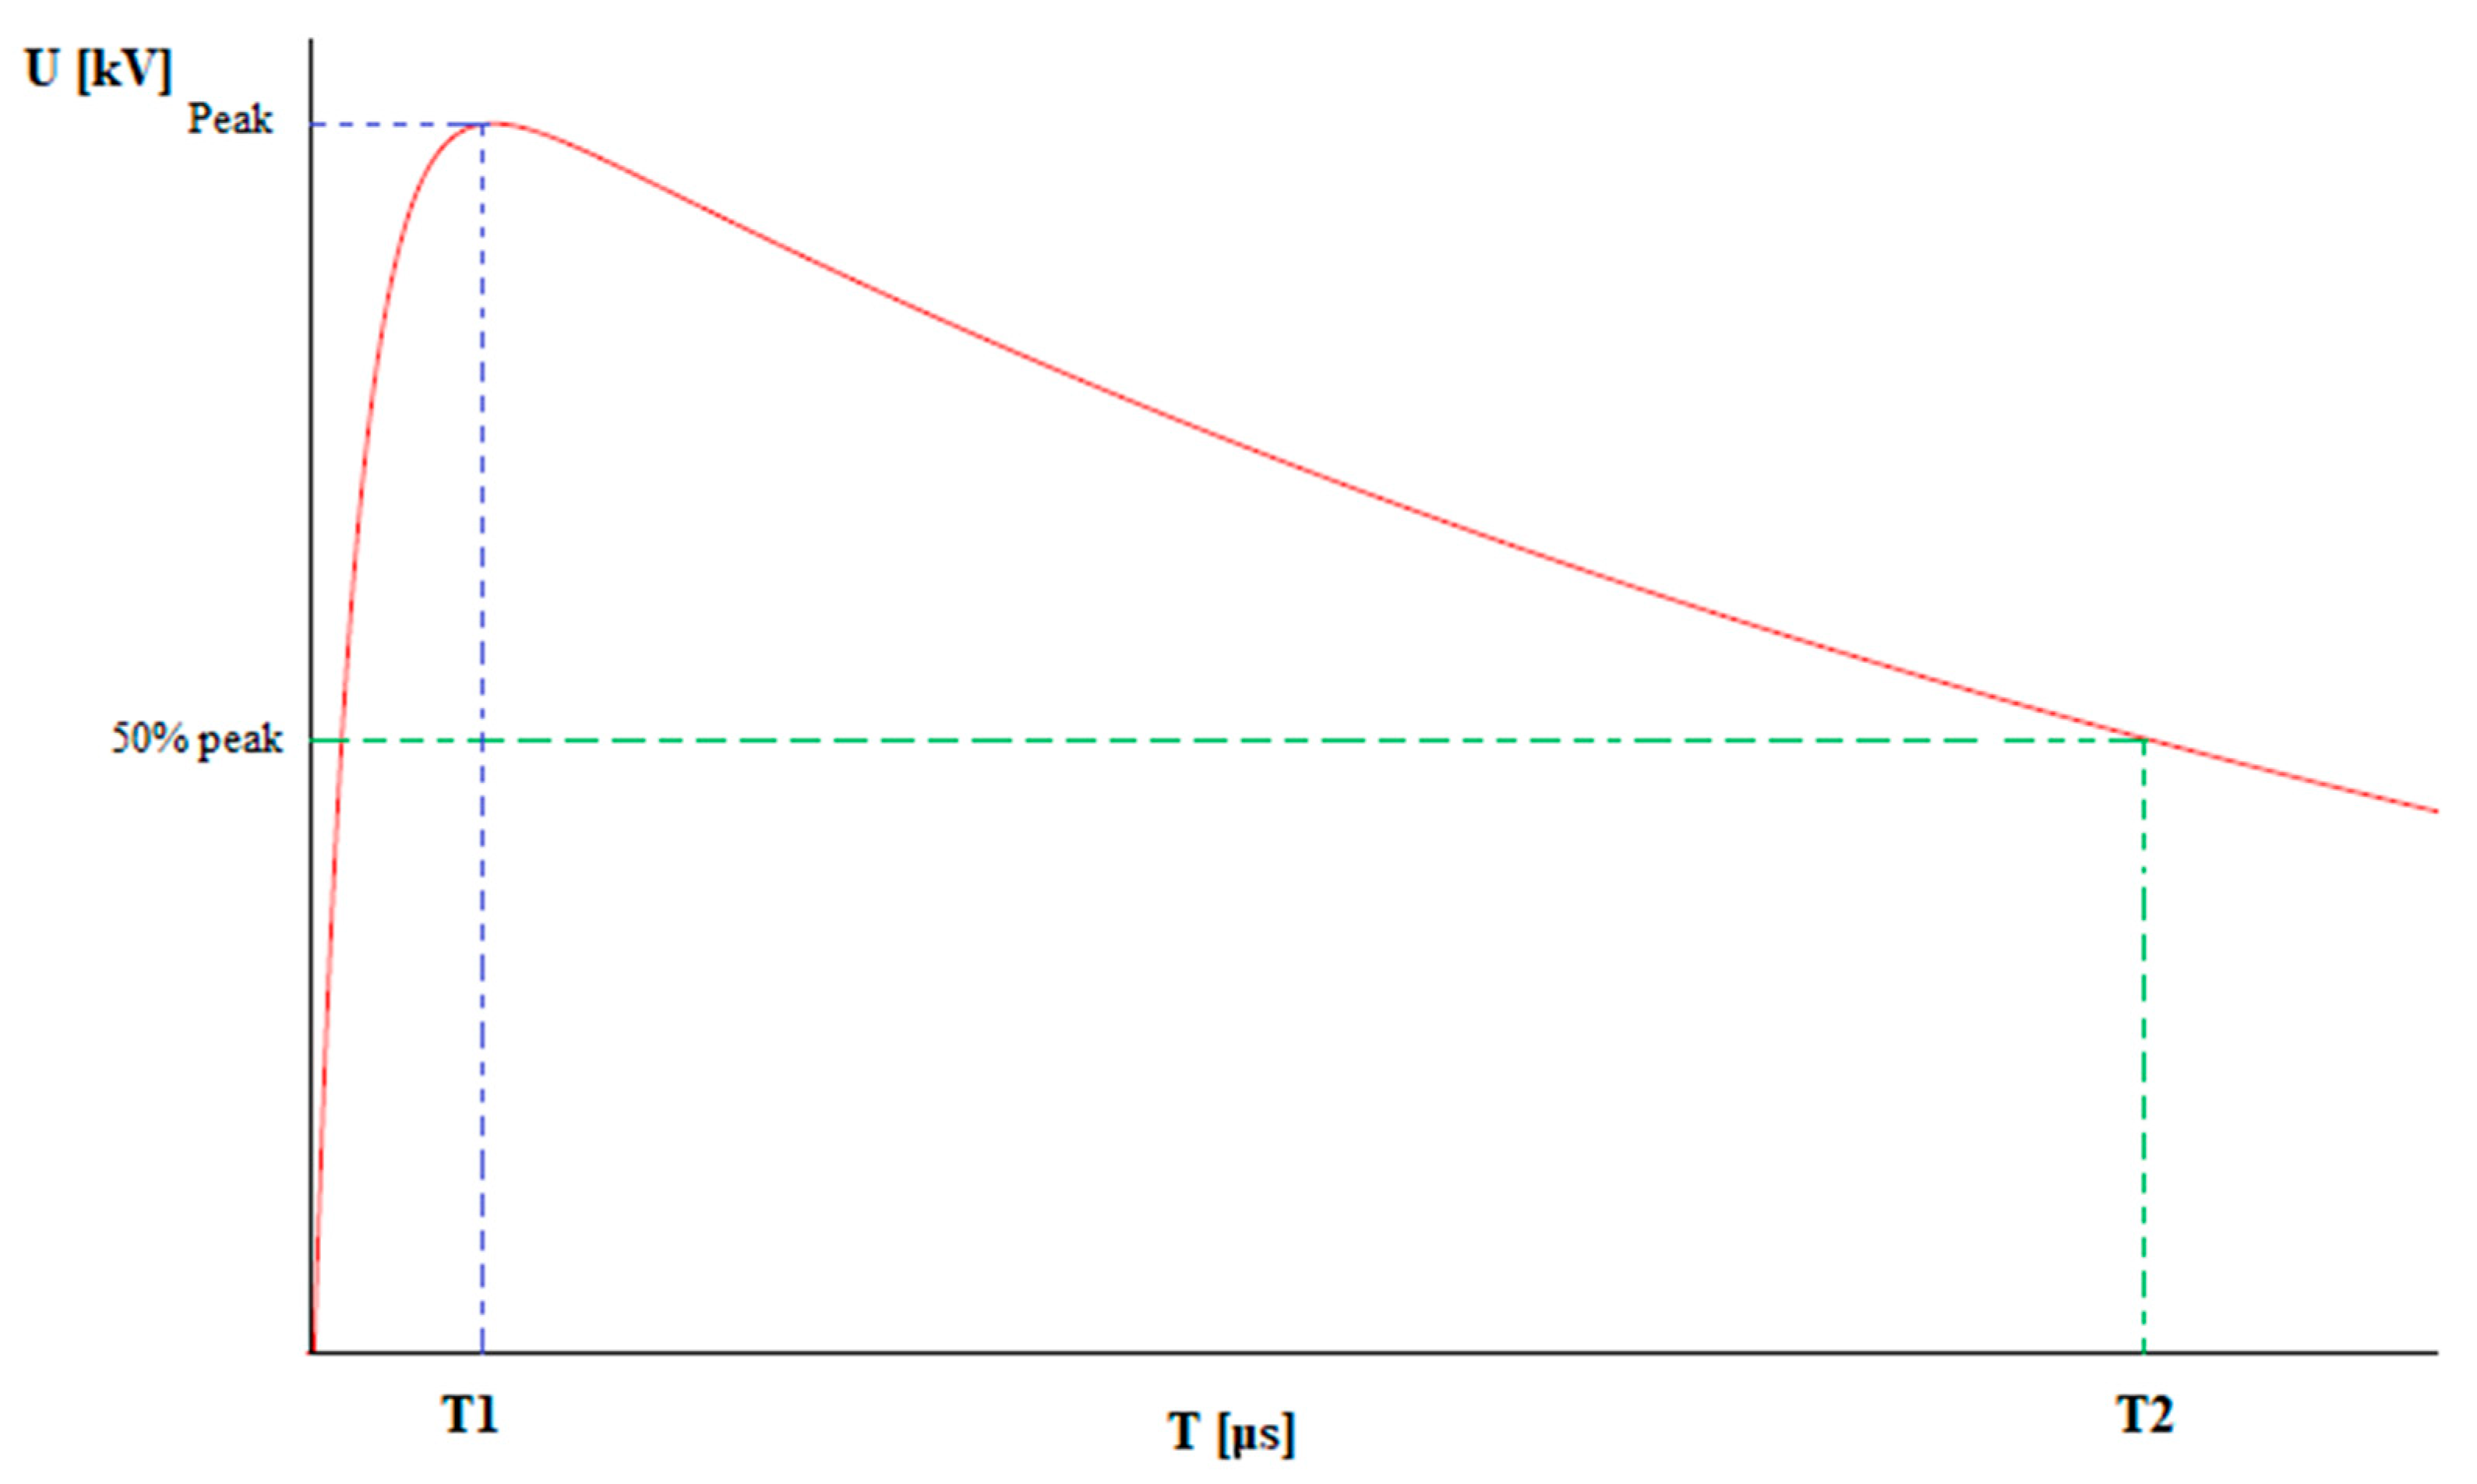
Lightning discharge can be compared to the current flow in a long conductor. That current creates a time-varying magnetic field which creates a time-varying electric field and consequently, electromagnetic waves [5]. Their amplitude (and influence on electronic devices) decrease proportional to the distance. However, the most dangerous are nearby discharges (not including direct impact—this can damage the drone immediately [20,21,22]). In international standards for avionics test for protection from lightning discharges (RTCA DO-160) WF4 voltage waveform is used (Figure 1). The shape of this impulse has a time of rising edge equal to 6.4 µs and falling edge (to half amplitude) 69 µs. Civil aviation standards such as RTCA DO-160 and EUROCAE [13,23,24] contain recommendations for testing the resistance of avionics to lightning electromagnetic disturbances. These standards define the current and voltage pulse shapes which are applicable in aircraft electric and electronic parts tests [25].
The most common threat to devices such as drones is the electromagnetic field from cloud-to-ground (CG) lightning. There are generally four types of these atmospheric discharges, downward negative, upward negative, downward positive, and upward positive lightning. In most cases, the lightning current consists of several return strokes, that is, the first return stroke and the subsequent return strokes. According to published statistics, negative lightning constitute up to 90% of all CG lightnings [6,26].

3. Measurements

In laboratory experiments, an unmanned aircraft (UAV) with
  • 4 brushless motors with 3 coils,
  • GPS navigation using USART communication to determine position,
  • Accelerometer using I2C communication to identify orientation with respect to the ground,
  • Radio Frequency (RF) communication at 2.4 GHz band using a unipol antenna to control UAV functions,
  • 7.4 V lithium-polymer battery—for 10 min of work,
  • Camera with its own communication at 2.4 GHz band to operator display,
  • Electronic Speed Controllers (one for each motor) to control the direction of flight was used.
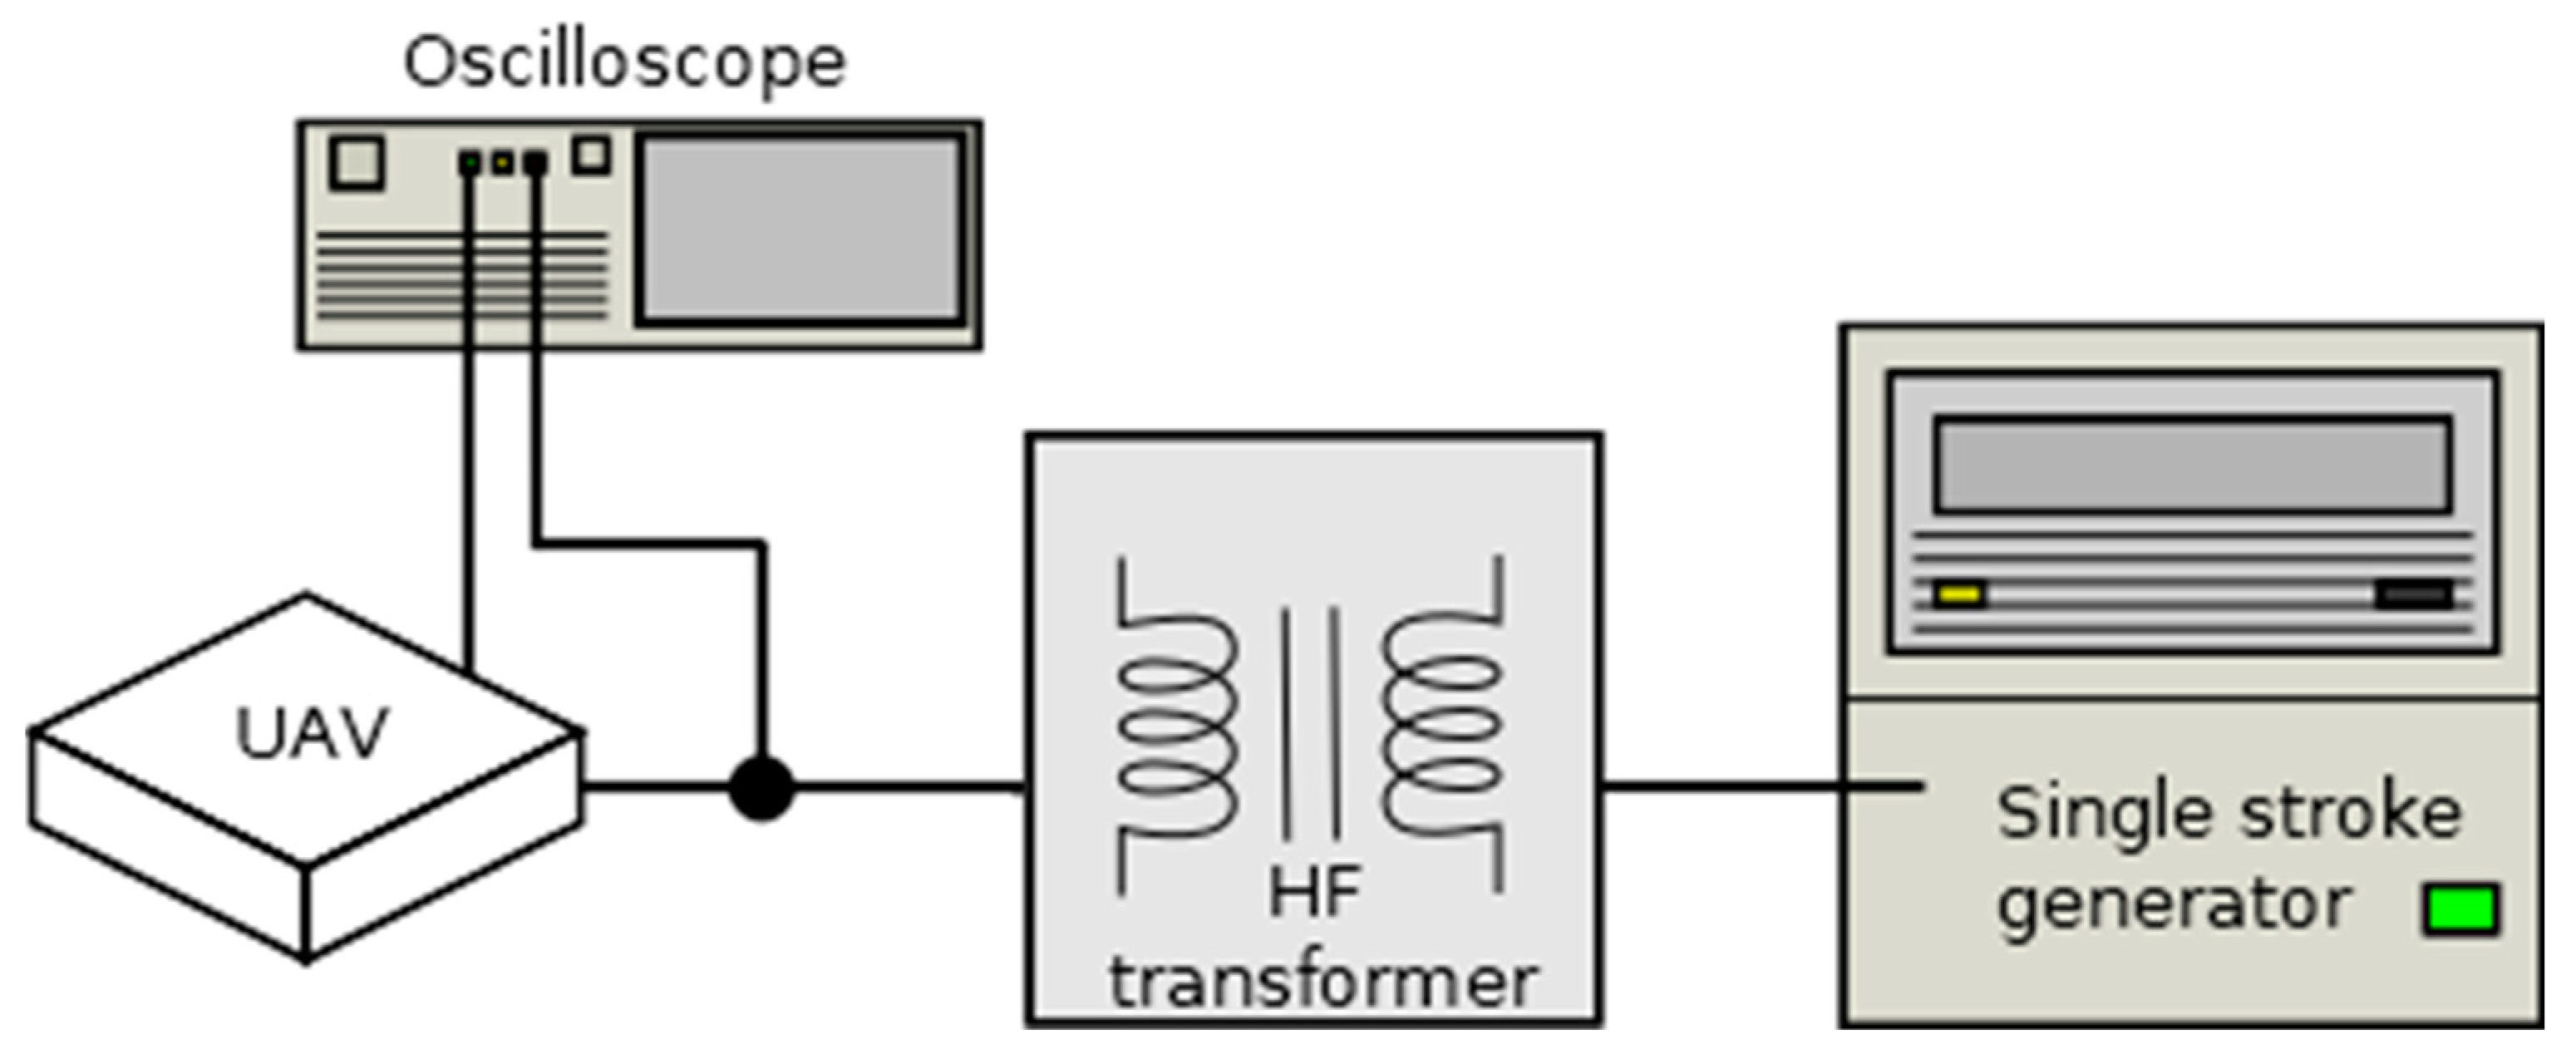
The scheme of the drone functional blocks was shown on Figure 2. In this picture number of measurement points were shown (described in the next parts—all results will appeal to this scheme). Presented points are both measuring and surge input points. Lightning discharges were generated using the MIG0618SS generator (single-stroke voltage impulse with the waveshape of 6.4/69 µs—pin injection method) [7,27,28]. Its level of peak value was 125 V divided by Voltage Coupling Transformer (HF Transformer) to a voltage peak value of 25 V (as shown in Figure 3). The final peak value of the voltage pulse depended on the total impedance of the analyzed circuit. The current for all of the series remained almost constant at about 110 A (primary side of the transformer). This is the reason that sometimes the voltage maximum amplitude is not equal to the value of the surge impulse from the generator’s set. Combination of capacitance, inductance, and resistance can change impulse shape inside measured circuits (but the impulse injected is the same at any time—WF4). As per the standard, the pulse is calibrated on an open circuit and the changes described are appropriate. This impulse was directly fed to the digital oscilloscope using coaxial cable (referred to in figures as “input”) [29,30]. The scheme of connections for the whole system is shown in Figure 3. The point called (in the next figures) “output” or “measuring point” was directly connected to a digital oscilloscope (Rigol 1054Z) with coaxial cable (attenuation 0.1 dB/m @ 50 MHz) as well.
Oscilloscope parameters
  • 1 MΩ input resistance,
  • 50 MHz bandwidth,
  • 1 GSa/s sampling,
  • 8-bit resolution.
TA044 High-Voltage Probe
  • High impedance input,
  • 70 MHz bandwidth,
  • 7 kV range.
That was the point where the overvoltage was observed (list of points below).
The measurements consisted of several parts,
(1)
Motor coils tests—to check the difference between them,
(2)
Influence of surge polarization (positive and negative),
(3)
Propagation of overvoltage in all functional blocks of a drone,
(4)
Measurement impulses going through a single block and a group of blocks—to compare the difference between simulations and real results of the measurement.
Points and devices used in all tests (Figure 2)
(a)
Motor coils—points no 1, 2 and 3,
(b)
ESC—points no: 4 (supply) and 5 (control),
(c)
Supply bus—point no 8,
(d)
GPS module—point no 10,
(e)
RF module—point no 6,
(f)
Antenna—point no 7,
(g)
Communication bus—points no 9 and 11,
(h)
Voltage stabilizer—point no 12.
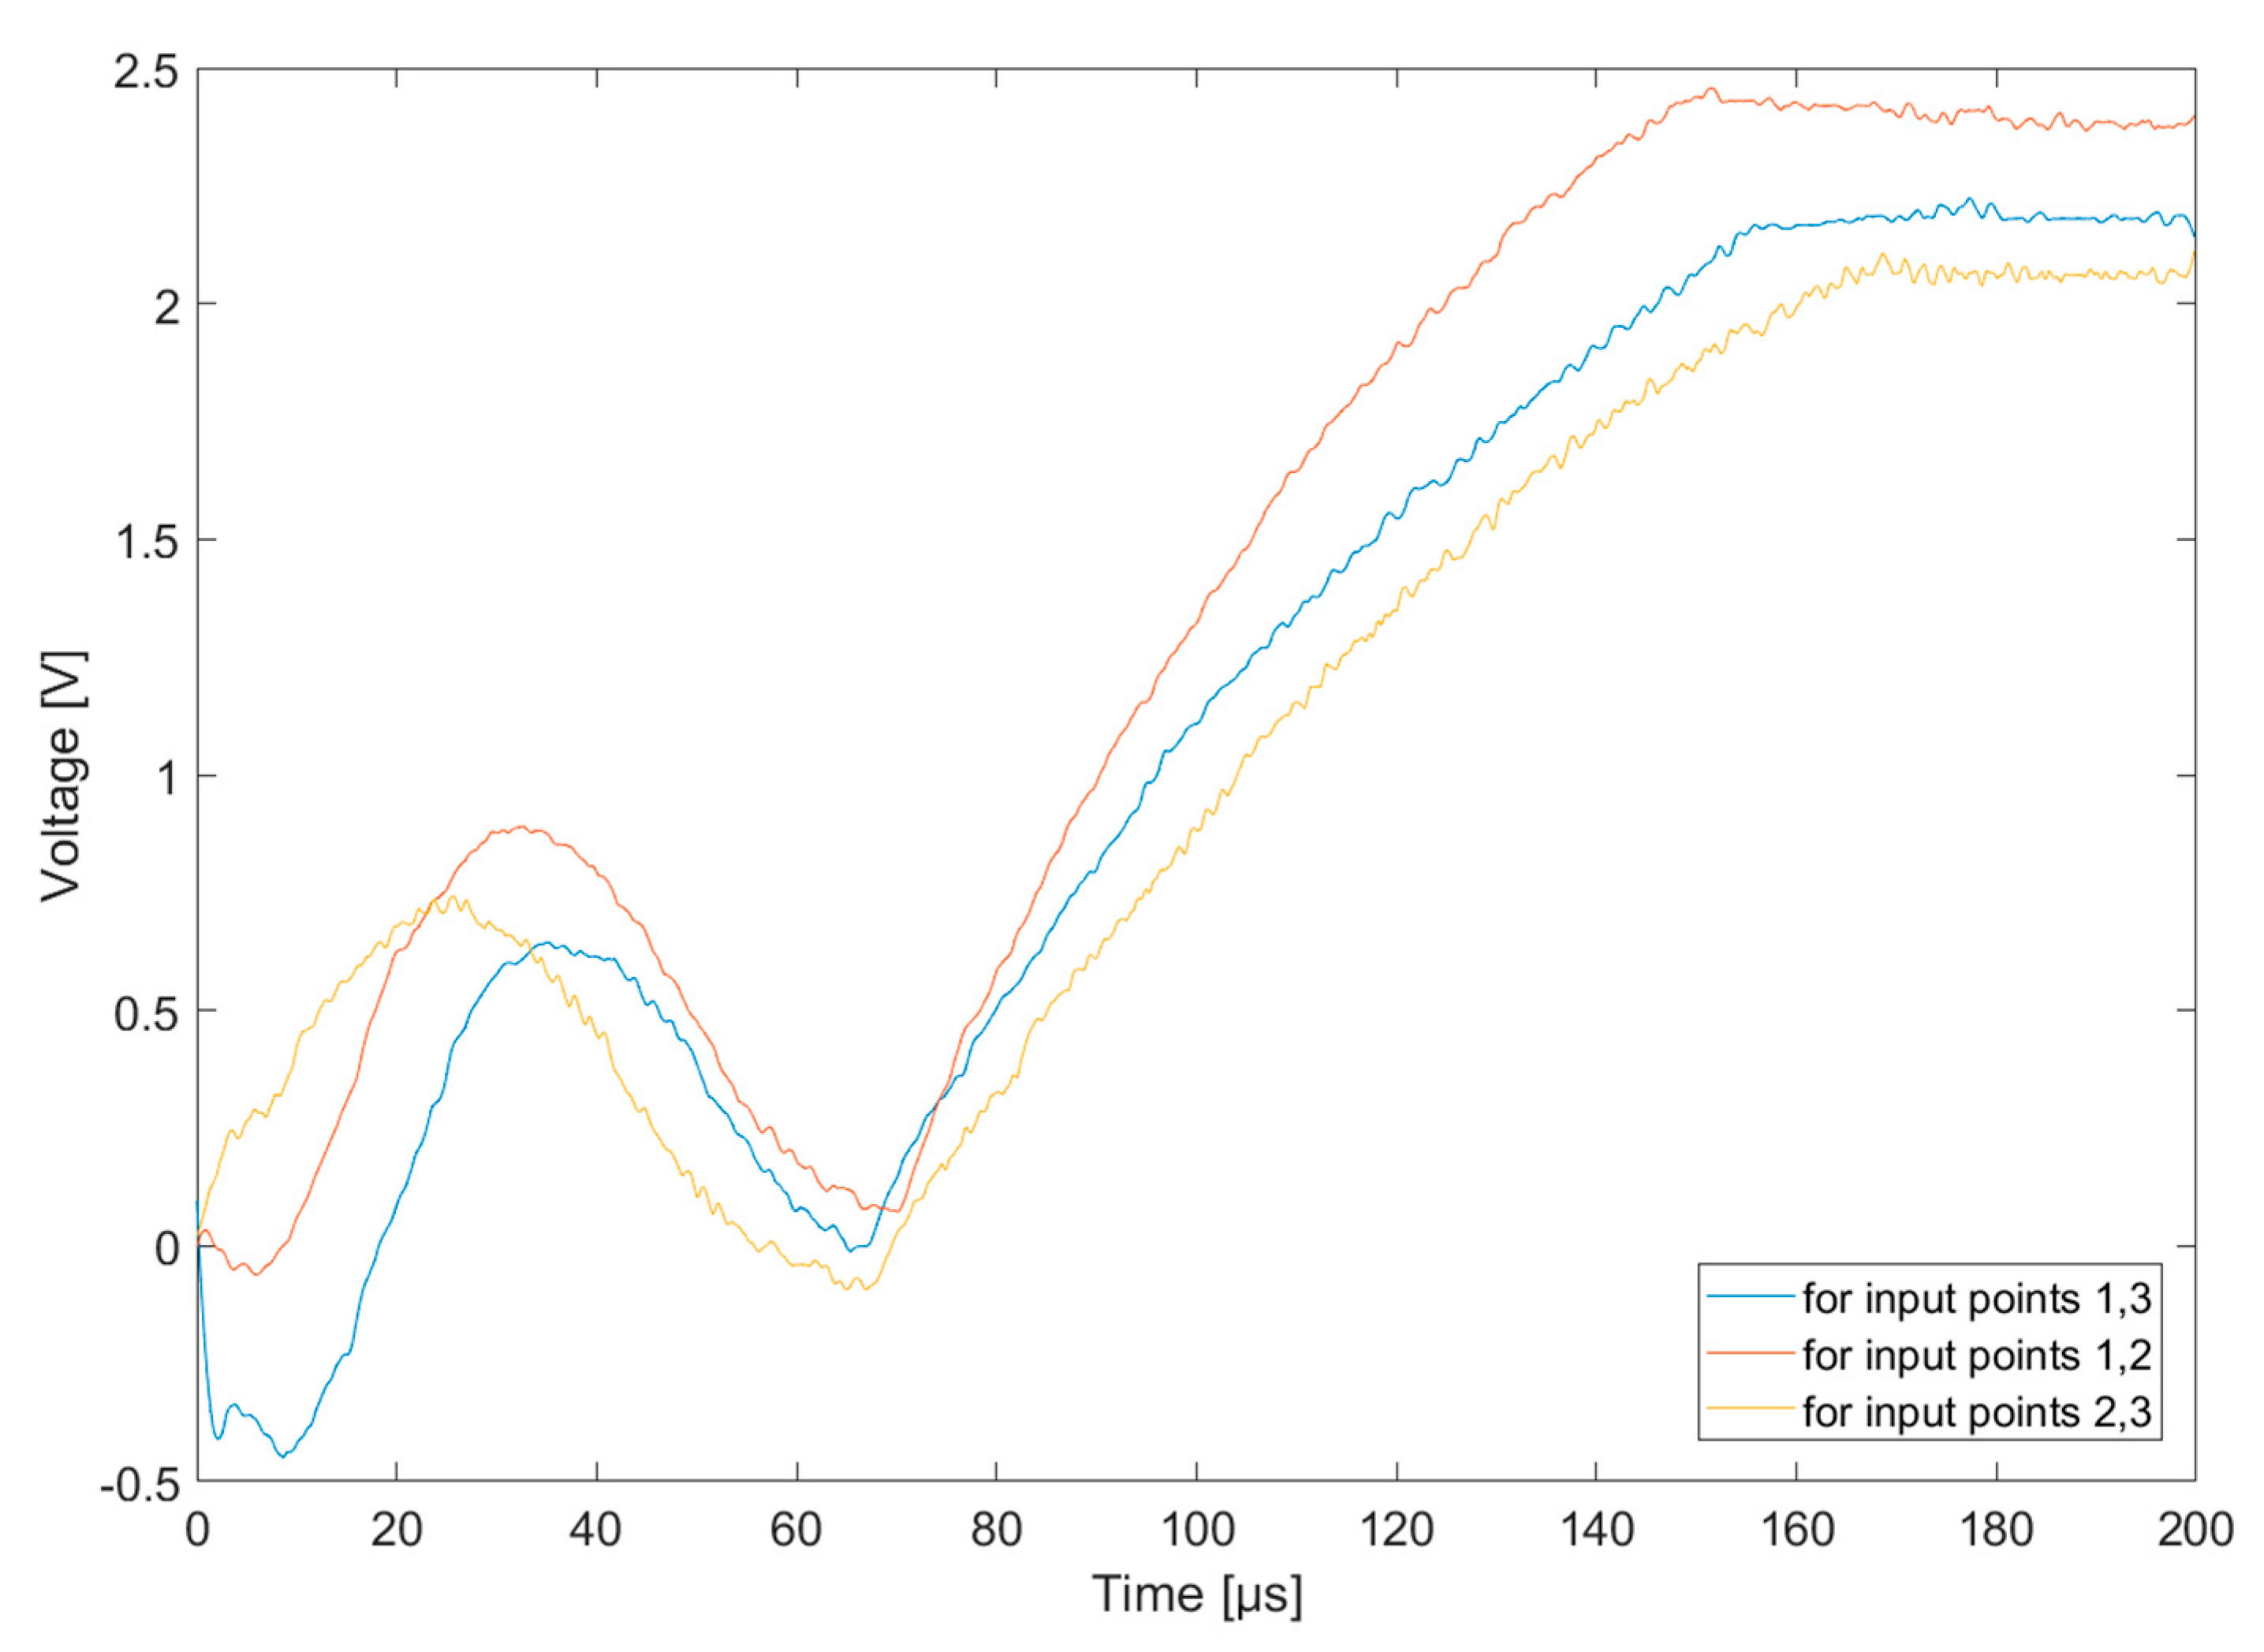
At first, the longest wire inside the drone was verified—the motor coils. Figure 4 shows measured voltage on three pairs of pins of coils for impulse of 25 V (measured at the same point—the surge input pin) with negative polarity. Both surge and measurement points were presented in Figure 2. Results presented in Figure 4 used input point nos. 1, 2, and 3 and measuring point nos. 1, 2, and 3, respectively. This study was designed to show the system’s response to the surge pulse (the shape presented in Figure 1 is only for open circuit).
It can easily be seen that the difference was small. That means that all coils are practically the same and overvoltage is inducting similarly. For further measurements it will not be important which coil will be used (but it will be noted). In Figure 5 was presented the results of propagation overvoltage from motor coils to the supply of an ESC (Electronic Speed Controller) module. As previously, the results are similar (especially shape and maximum amplitude of surge). Both surge and measurement points were presented in Figure 2. For results presented in Figure 5 used input point nos. 1, 2, and 3 (coil pairs 1 and 2, 2 and 3, 1 and 3). The results were observed in point no. 5.
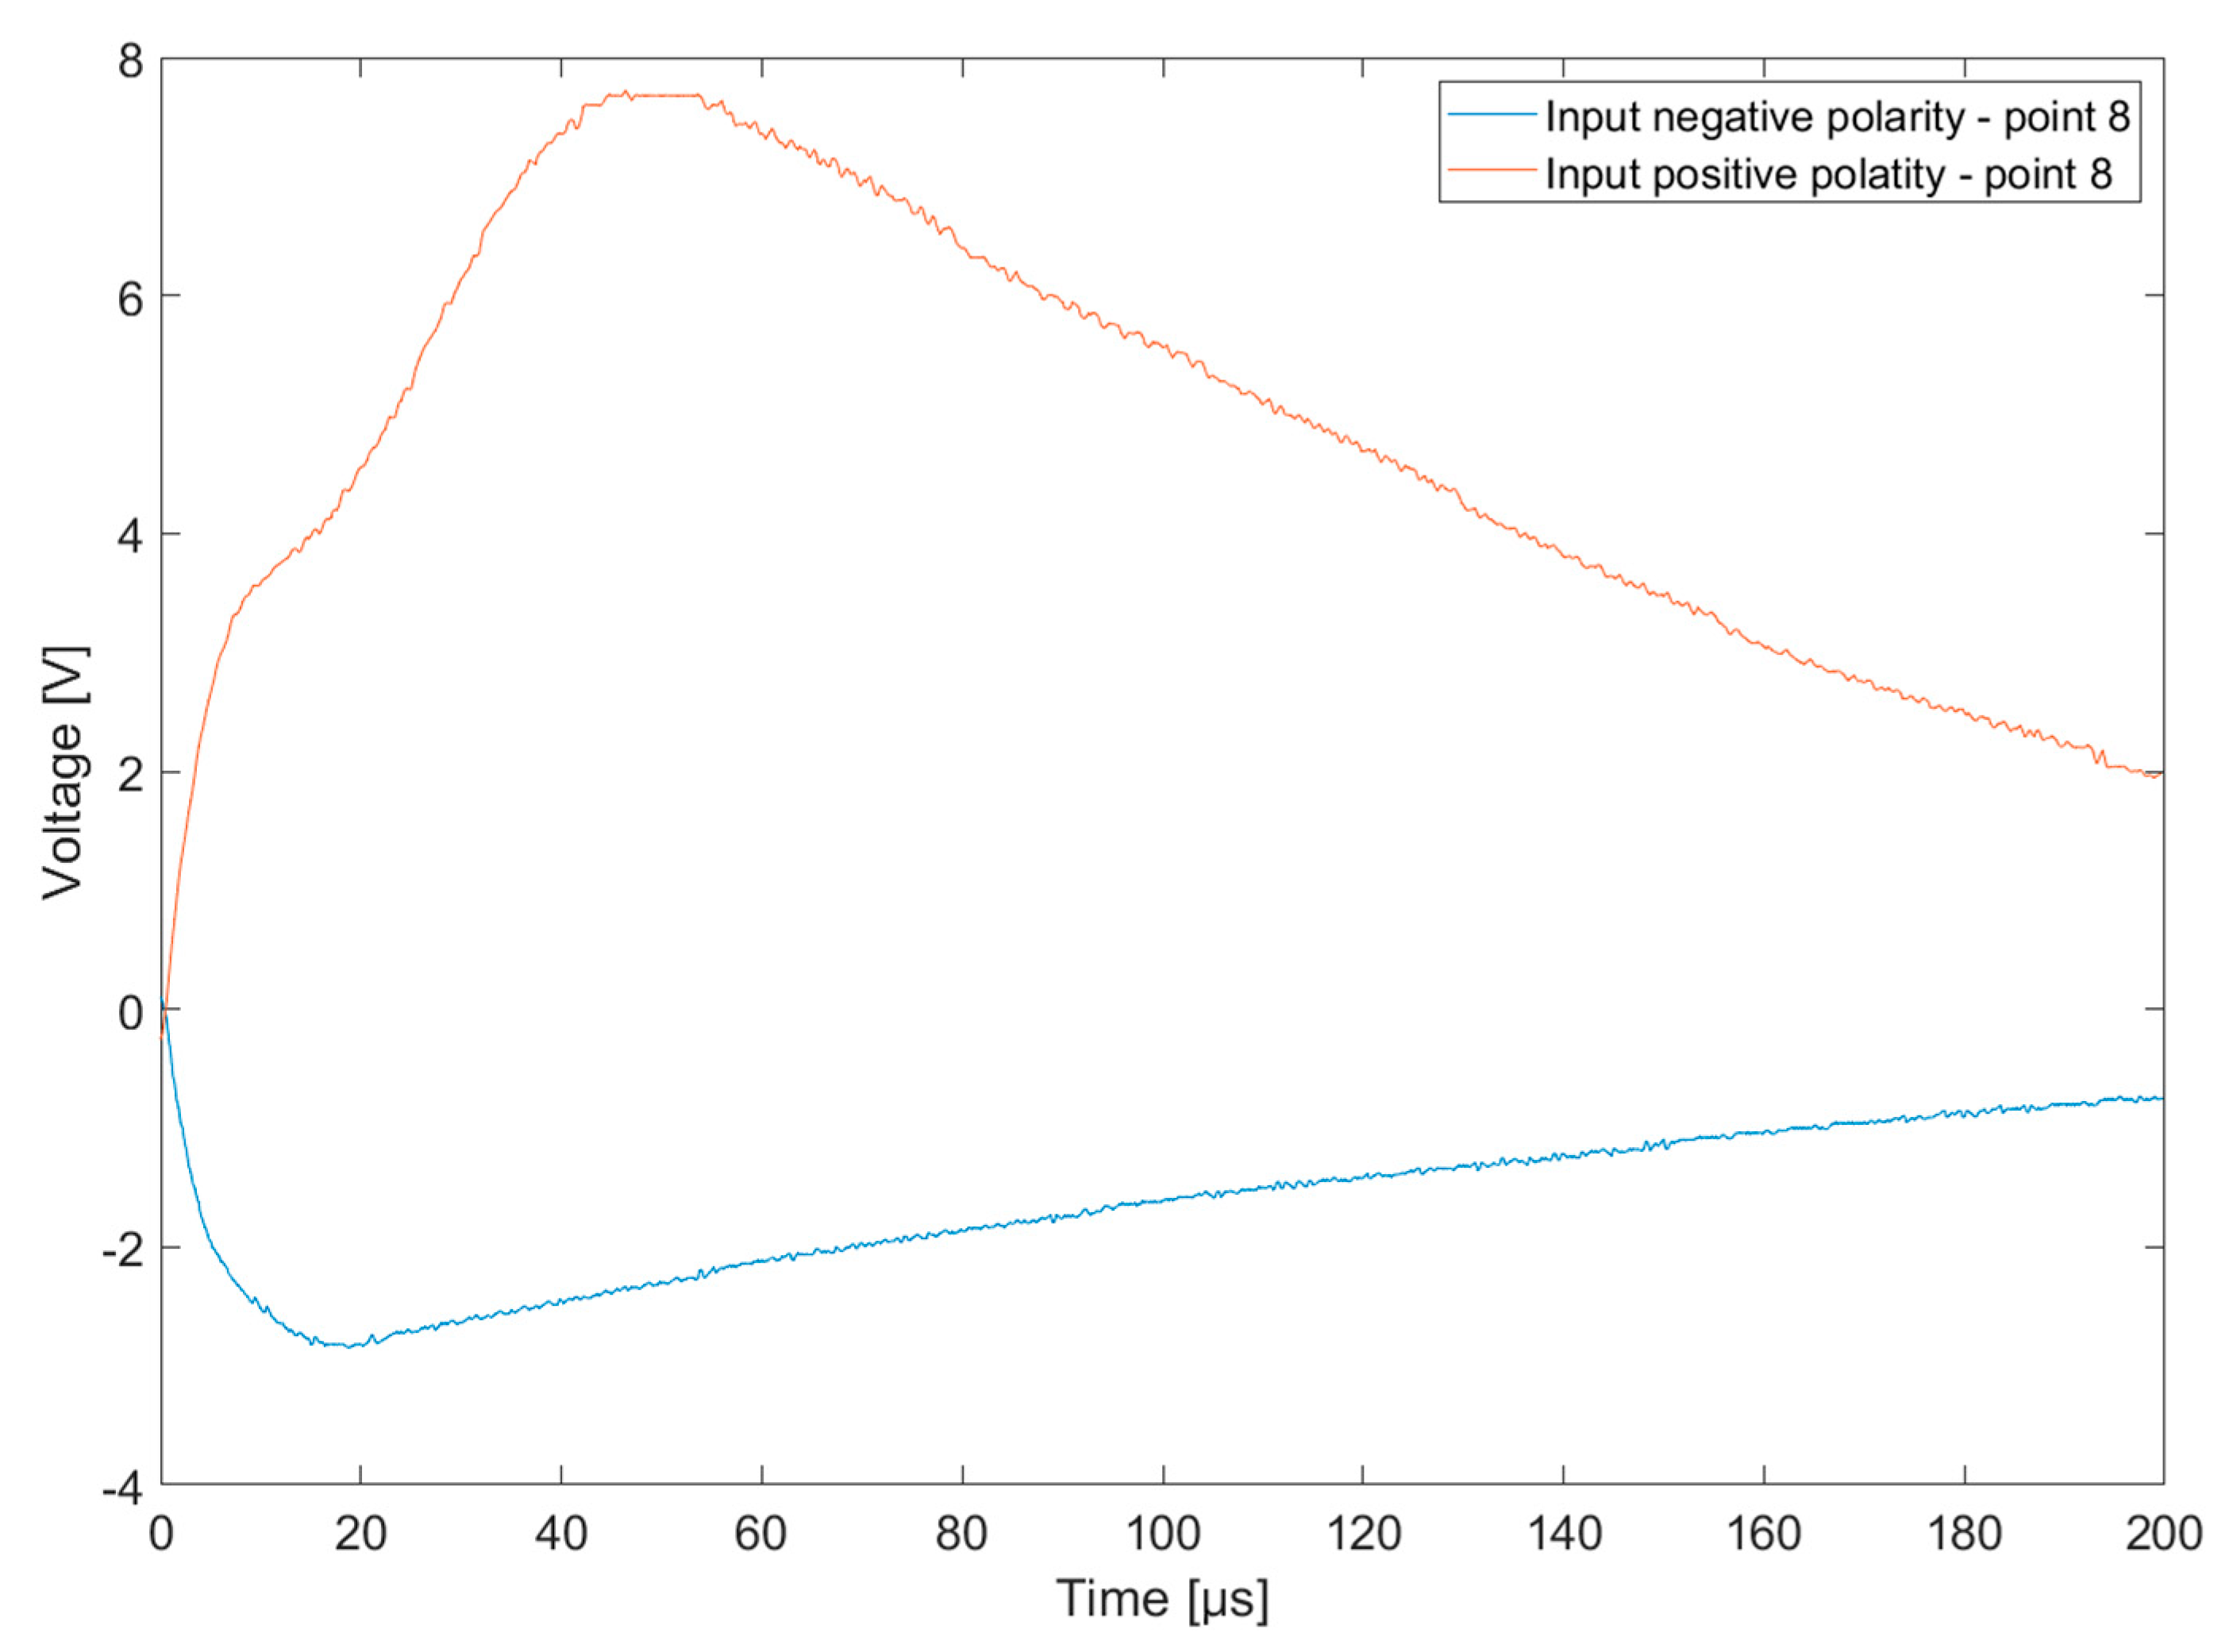
The next step was to compare the influence of positive and negative polarity of the surge on tested electronic circuits. In drone circuits there are many bipolar elements (e.g., diodes, capacitors, integrated circuits, transistors) sensitive to polarity. Thus, overvoltage in both cases can be different and it is important to include this in the final model. However, negative lightning constitutes up to 90% of all CG lightnings [6,7]. Output overvoltage was shown in Figure 6, Figure 7 and Figure 8. The first chart (Figure 6) shows the response of the supply bus to surge (the measuring point and injecting point were the same) for both polarities. Both surge and measurement points were presented in Figure 2. For results presented in Figure 6, input and measuring point no. 8 was used. As we can see, both the shape and amplitude of the overvoltage are different. Positive polarity is in accordance with battery polarity, so the probability of propagation of a surge is greater (conduction of semiconductor junctions). The anti-interference filters in the drone’s power circuits can have a significant impact. A jump can be observed on the rising slope for the stroke with a positive polarity. It may result from charging the capacitor in the discussed filter system. Each circuit significantly influences the shape of the pulse. Different impedances of the system caused a different response to the same pulse from the generator.
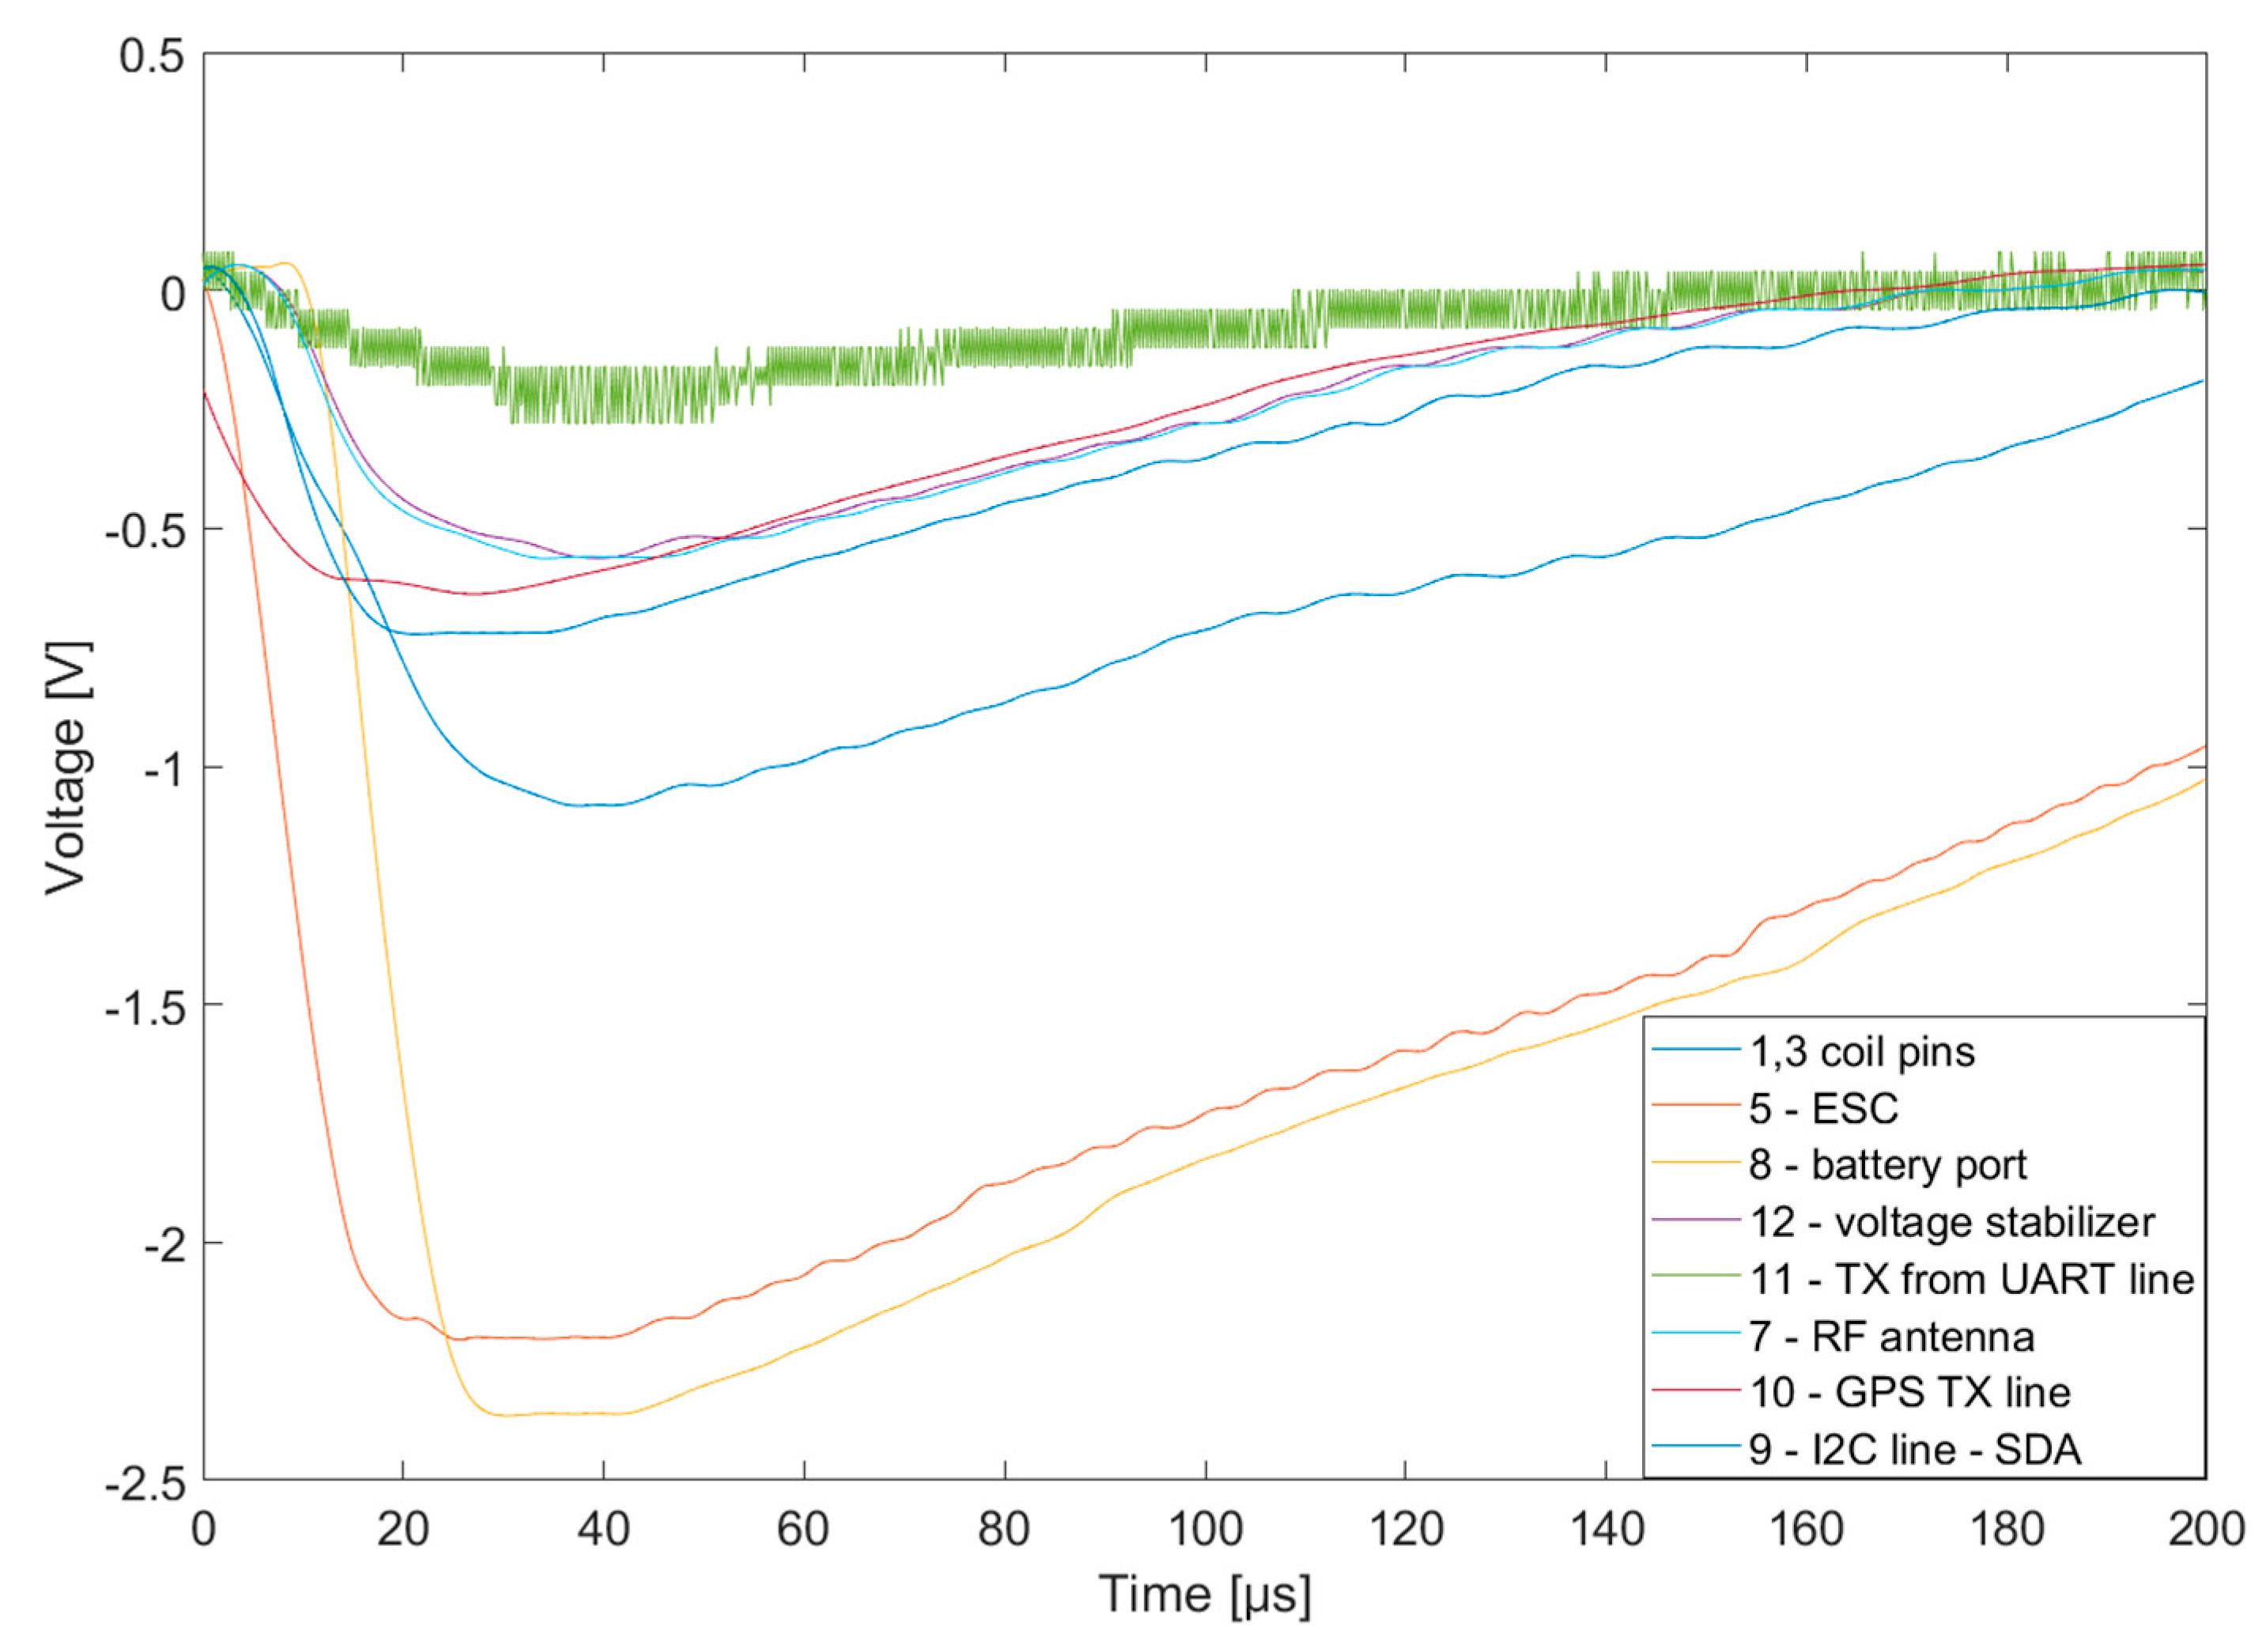
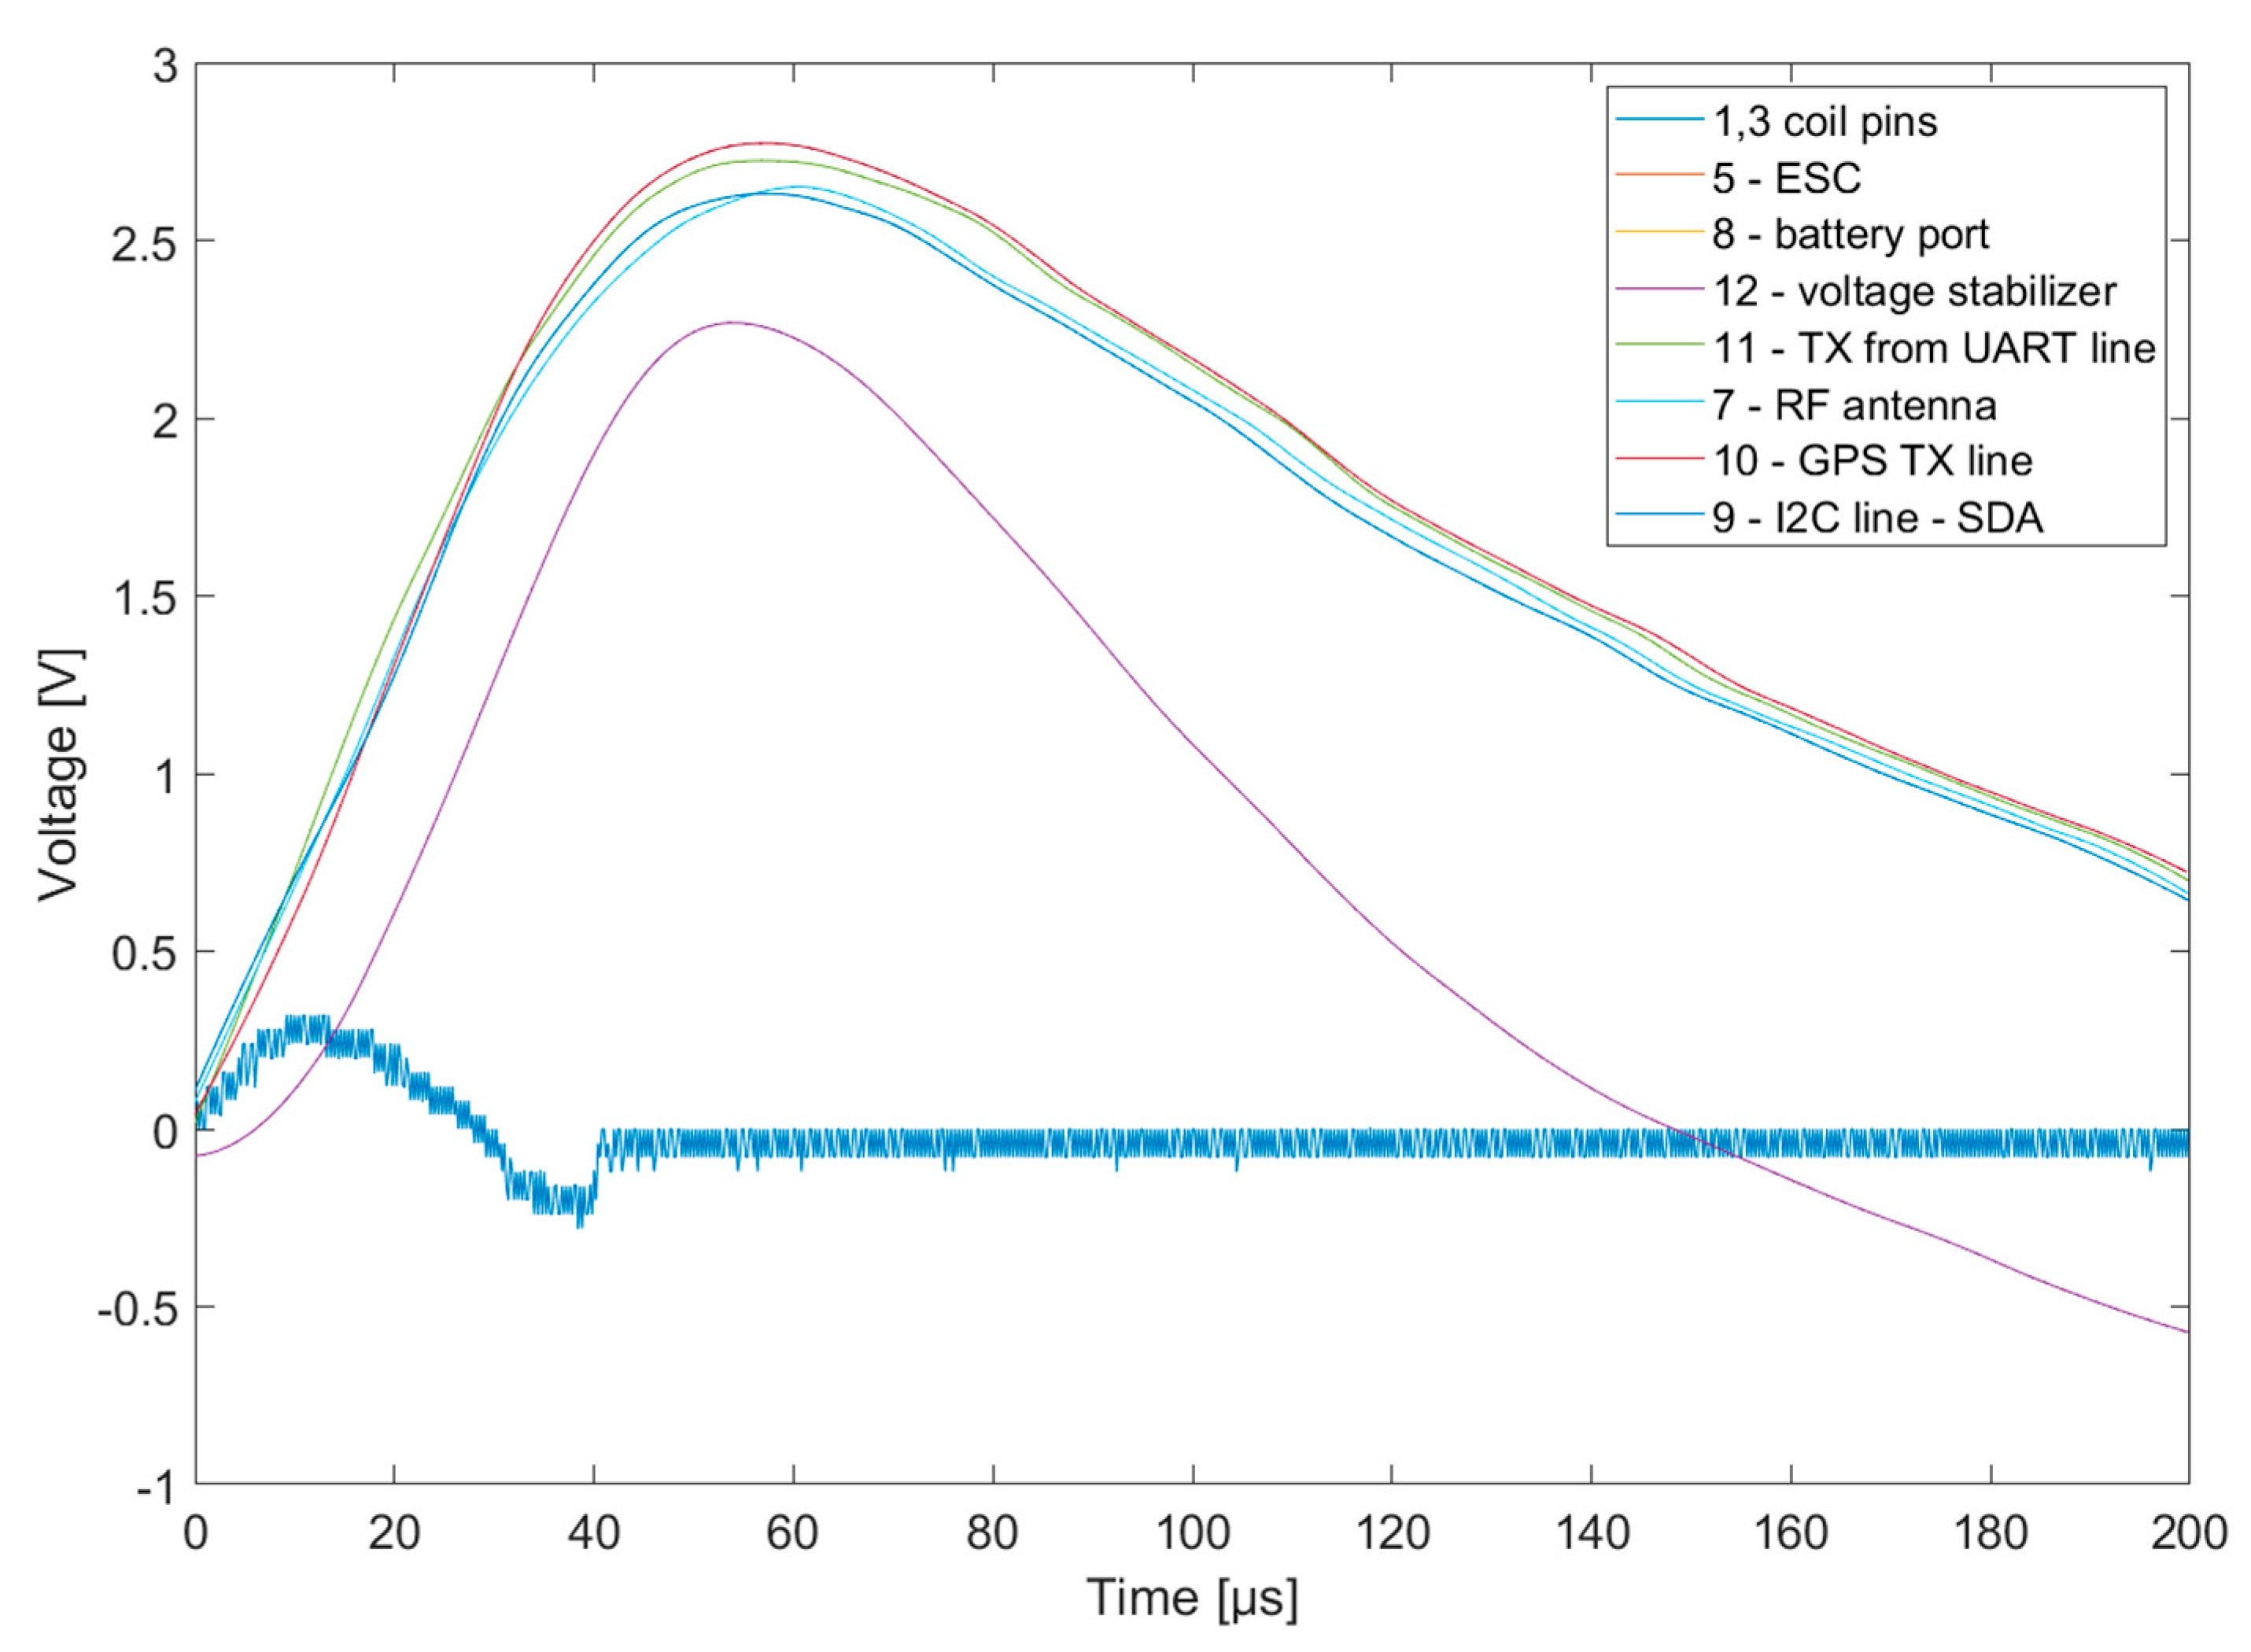
Next, part was chosen by measuring points for each important part of the drone, including navigation (GPS module), accelerometer (position), communication buses (I2C and UART), communication with operator (RF at 2.4 GHz), motor coils, ESC, and power supply for motherboard. All measurements were made in the same conditions (it was possible only by using this type of generator) for both negative and positive polarity. Both surge and measurement points were presented in Figure 2. For results presented in Figure 7 and Figure 8, input point no. 8 and measure point no. 9, 10, and 11 were used.
The voltage waveform at point 11 (TX on UART) in Figure 7 and the waveform at point 9 (SDA on I2C) in Figure 8 have a small amplitude, burdened with high noise. A possible cause is the noise generated by the semiconductor components in response to the surge pulse. The actually measured value was presented (re-measurements gave similar results).
The influence of polarity (as expected) is the most significant for IC’s and communication lines (between IC’s) where there are semiconductors. Overvoltage for negative polarity are lower than for positive (like power supply). However, it is noticeable, that for all points, the maximum amplitude of the surge wasn’t higher than 3 V. The important thing is, that the surge impulse was only 25 V. In conclusion, this level of voltage is not critical for circuits and will not damage it by overvoltage. However, it may cause system malfunctions.
On motor coils and ESC’s, there can be observed a similar level of the measuring surge regardless of polarity. In this case, the difference between both the polarity of the surge is insignificant (for both, maximum amplitude and shape of the impulse). Such a conclusion was expected; motors have the best “resistance” for surge (it’s not a surprise that wire is more resistant than a sensitive IC).
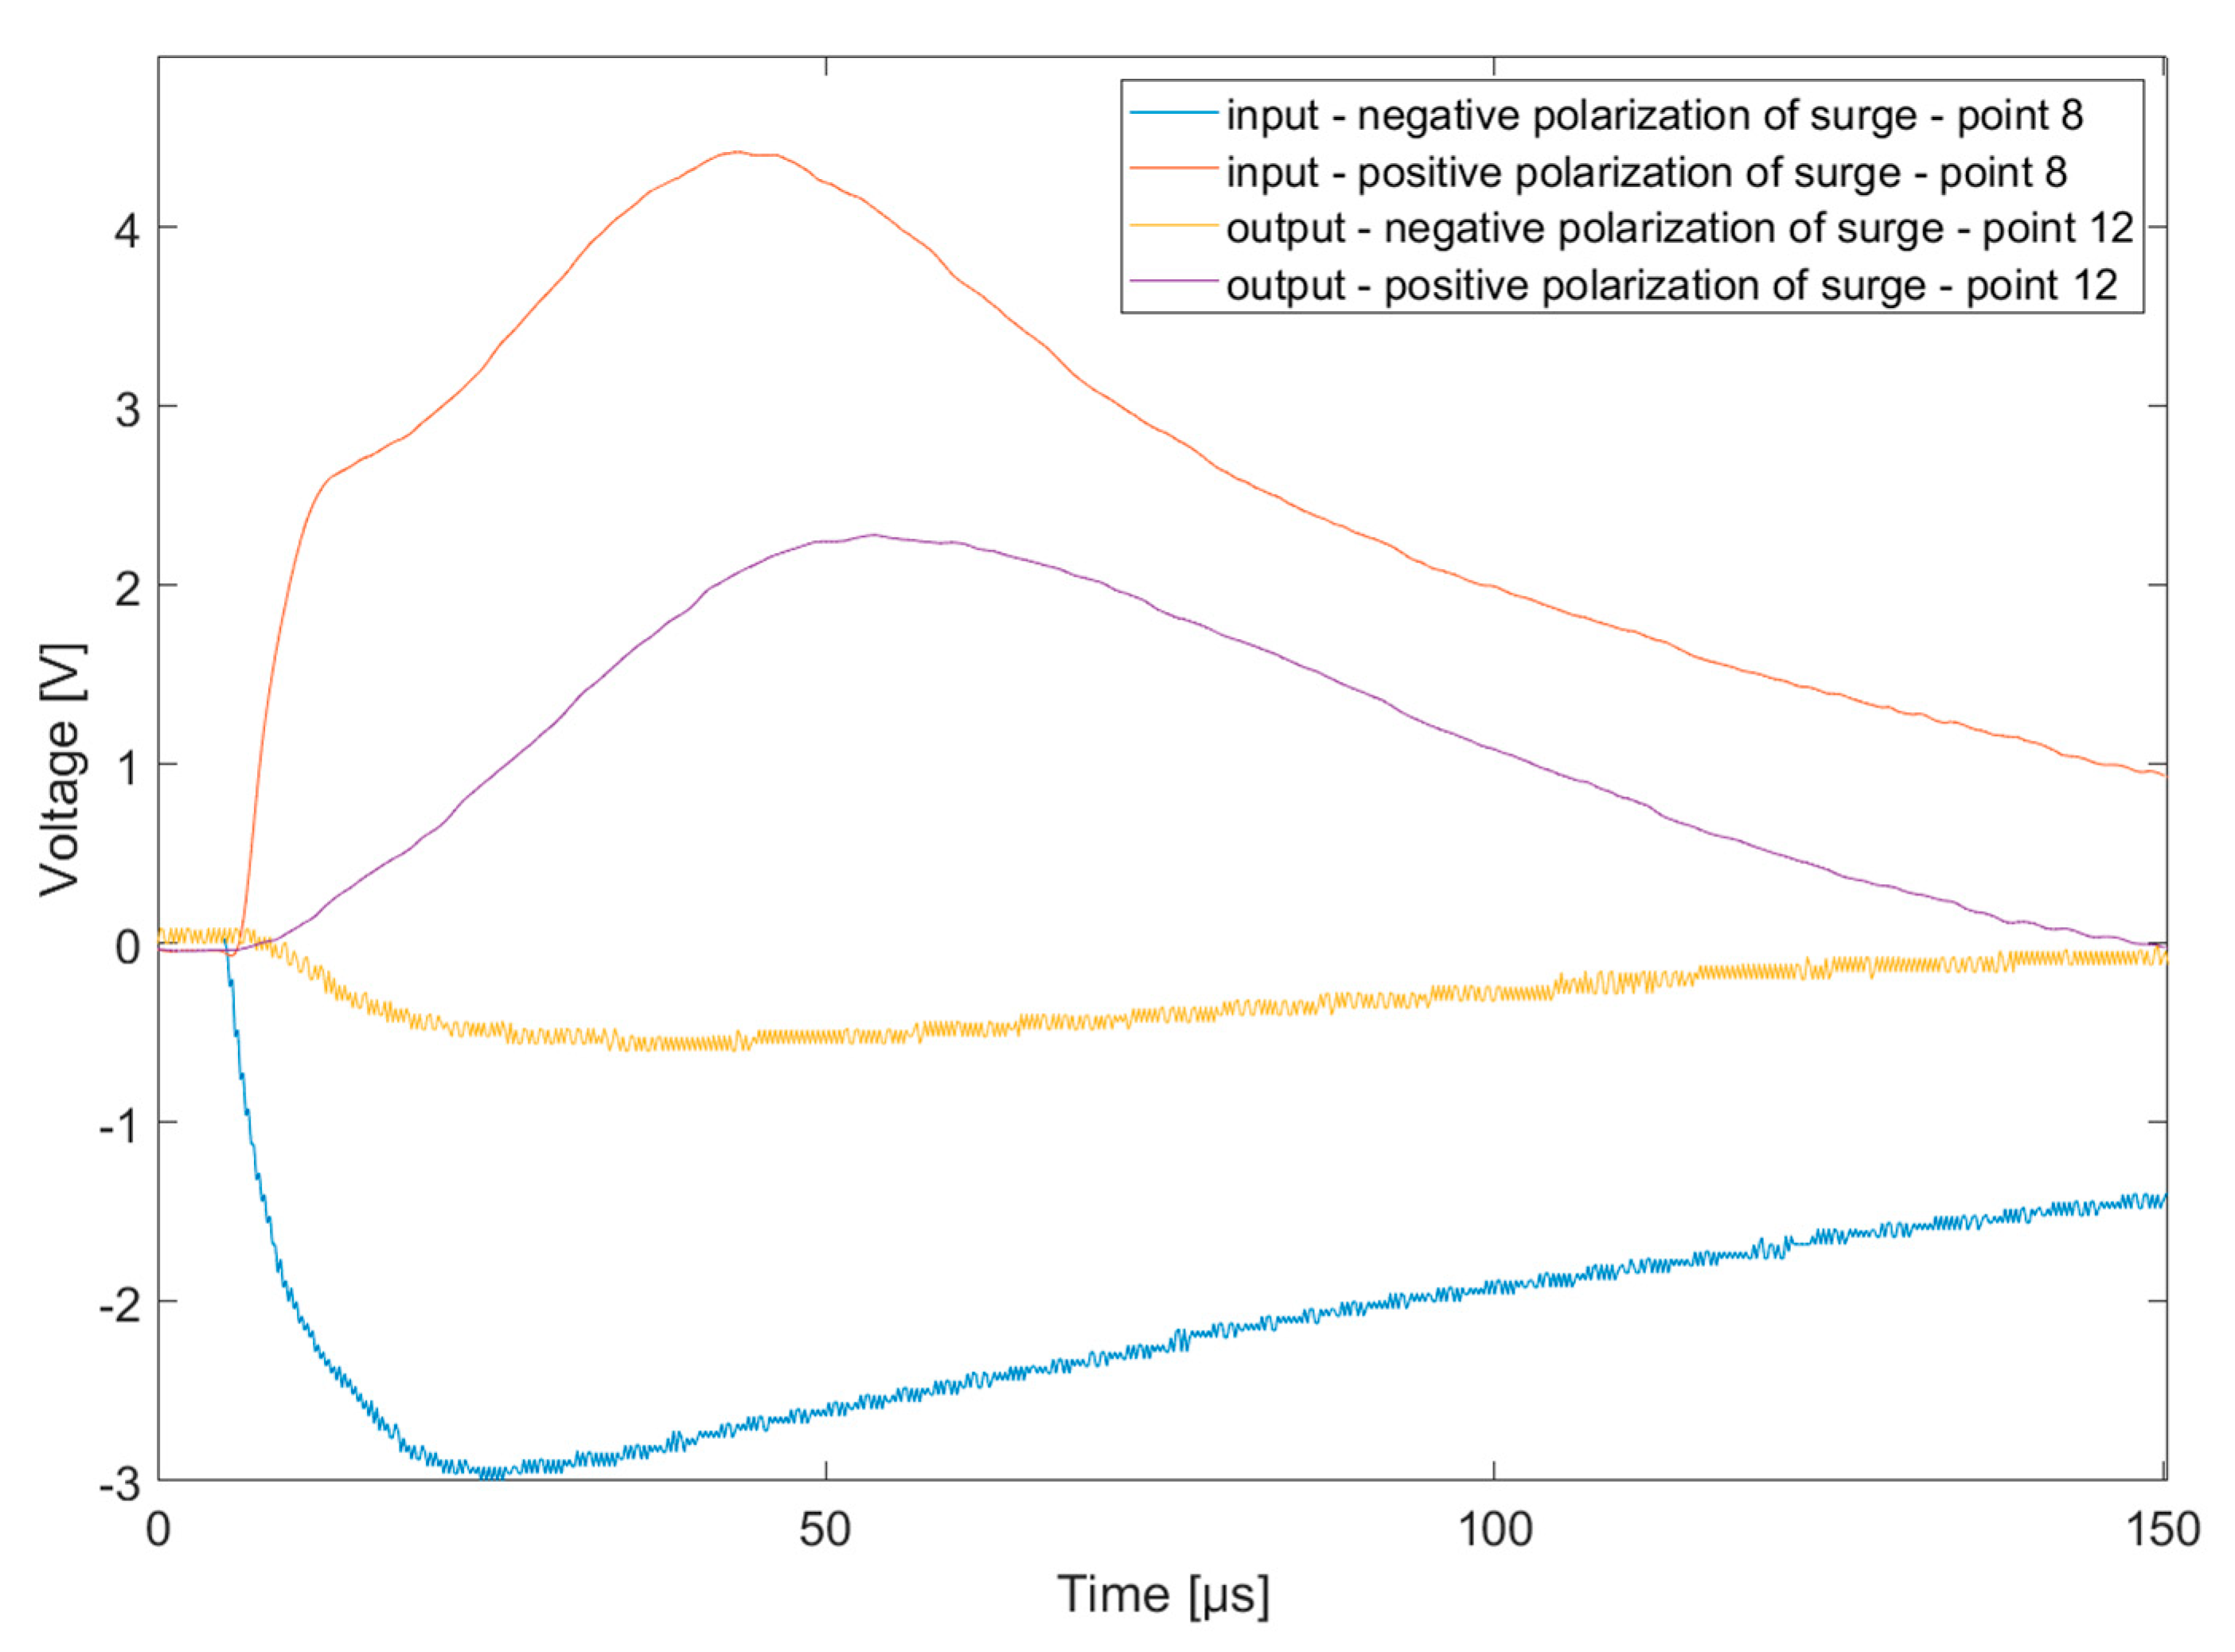
Next, the voltage stabilizer was tested. Both surge and measurement points were presented in Figure 2. For results presented in Figure 9, used input point no. 8 and measure point no. 12. Furthermore, the analysis of the influence of impulse polarization on this element was carried out as well. Overvoltage for negative polarity is not so high compared to positive—this is the first conclusion. The second is that the shape of input (surge) and output (propagated overvoltage) are shifted in time. They are similar but not the same, because the rising edge of output for positive polarity is gentler than for a negative one.
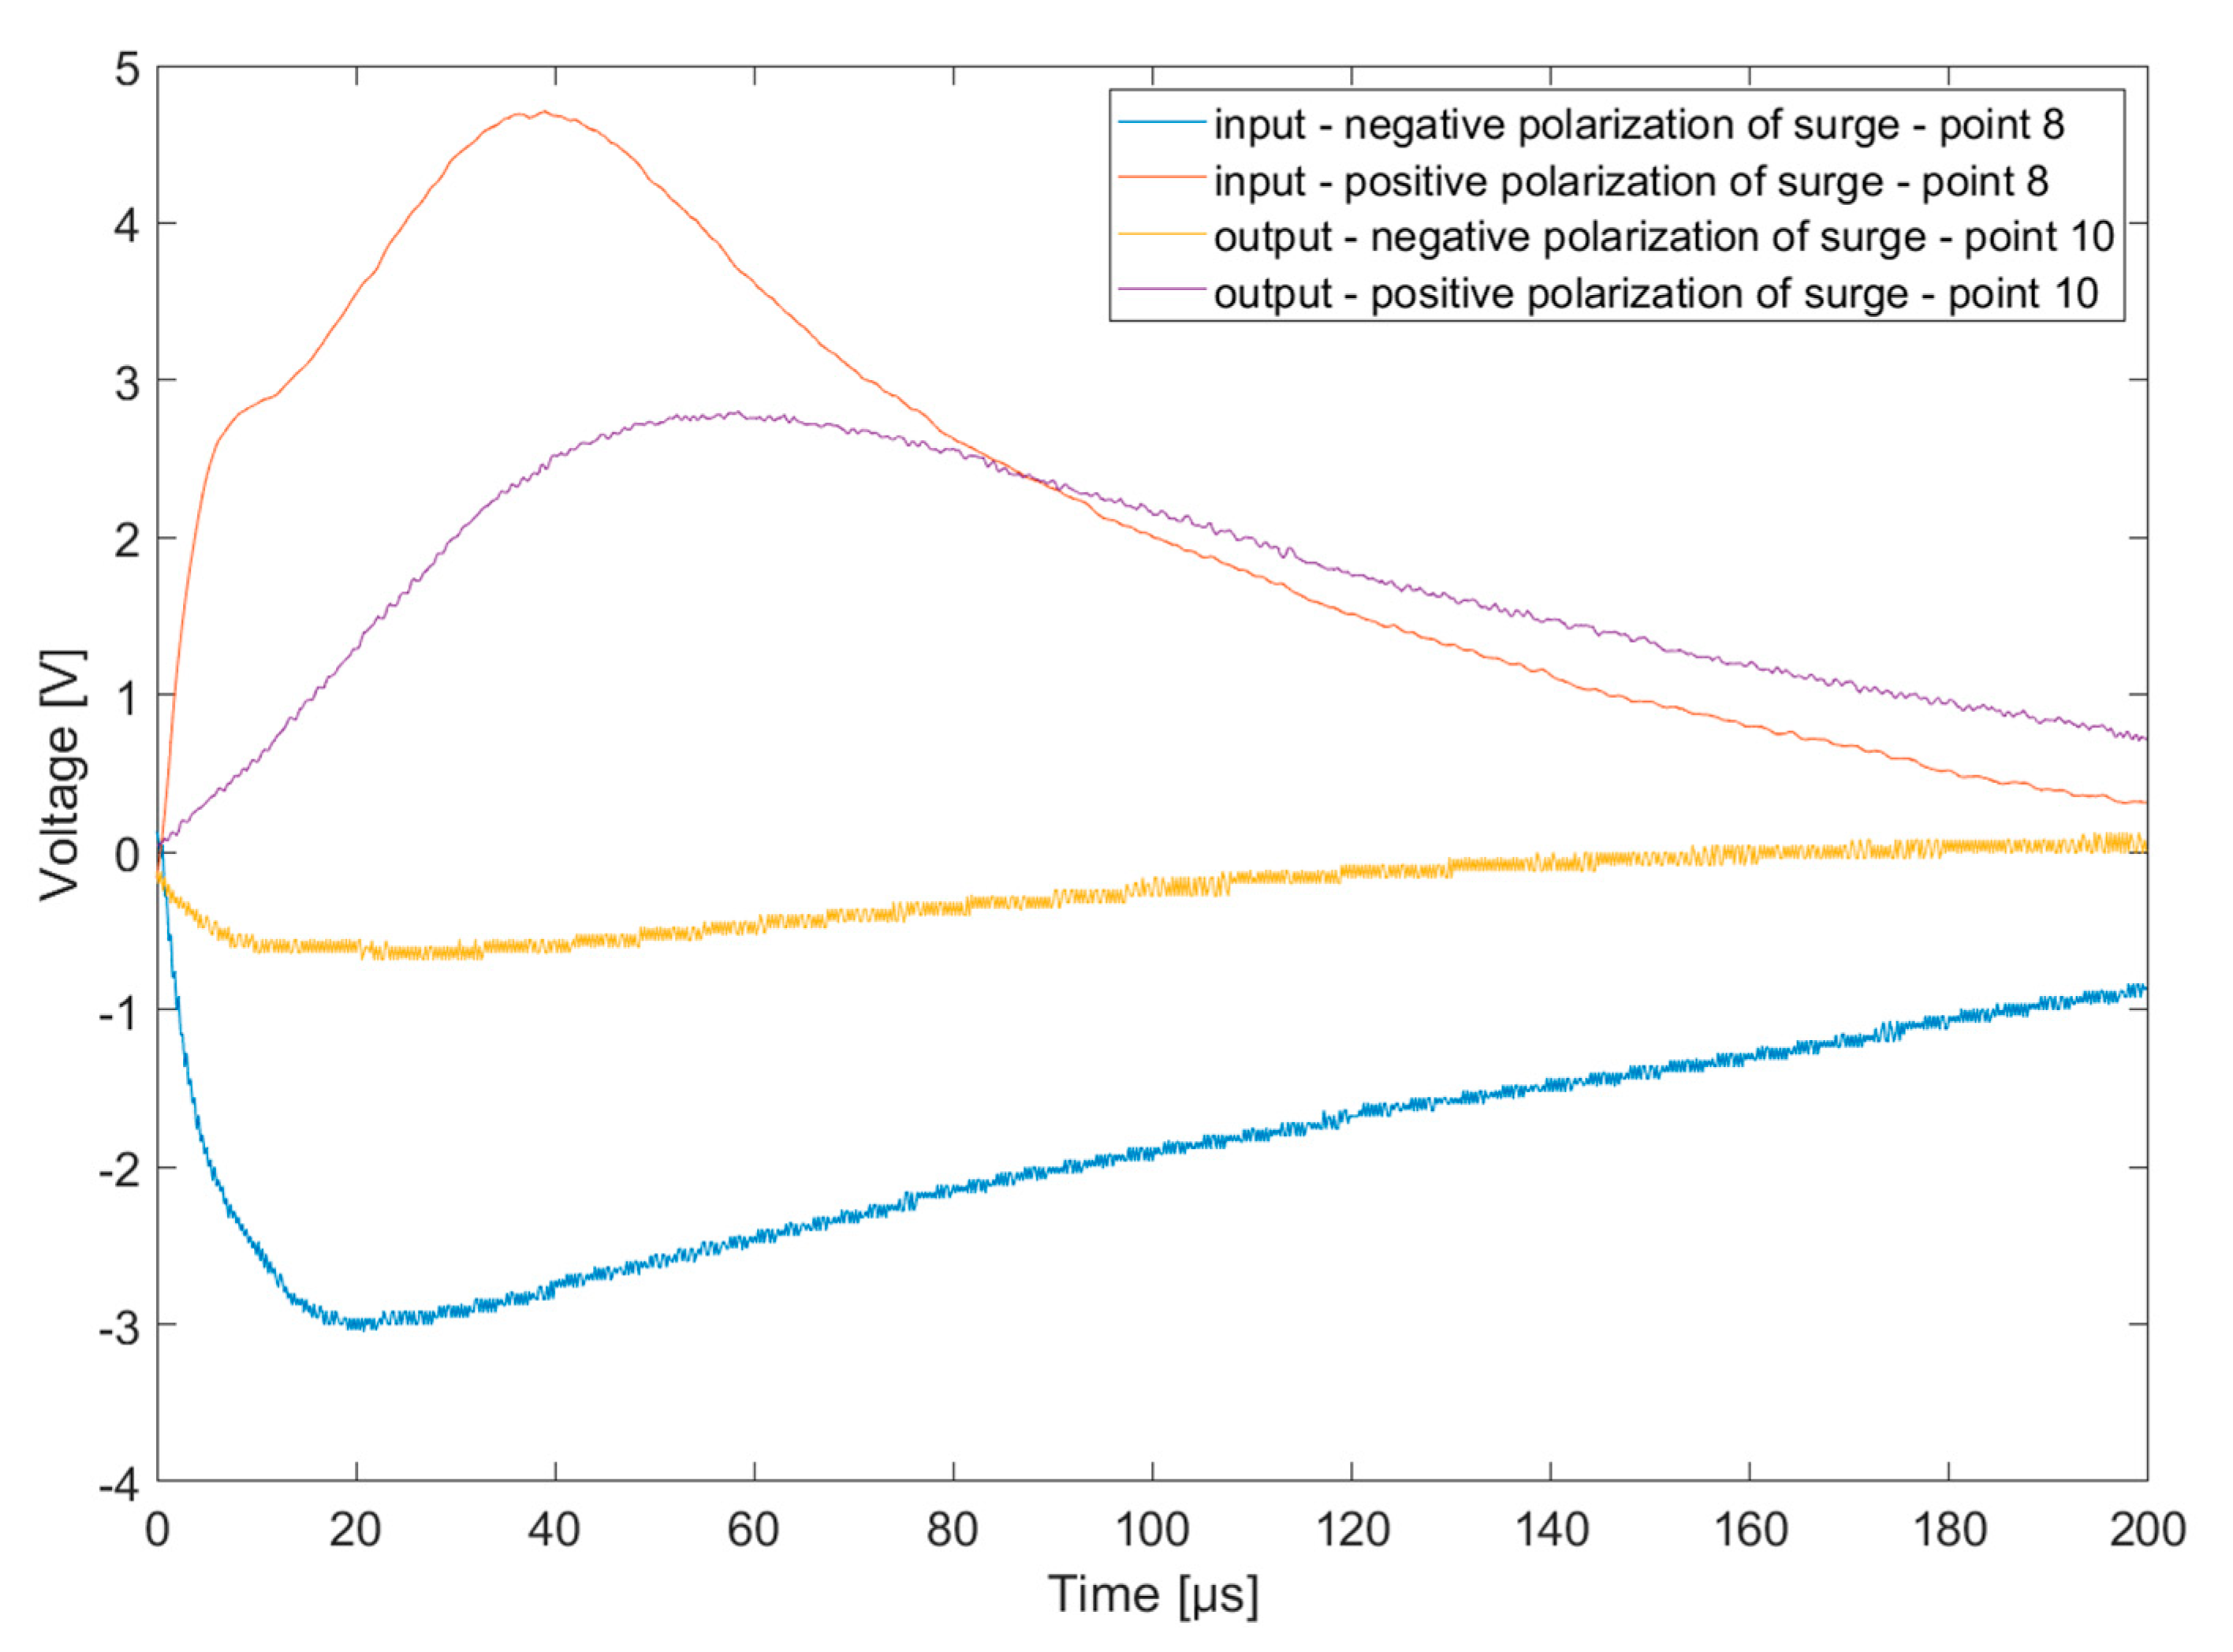
Figure 10 shows overvoltage on the GPS module (communication bus) for both polarities, to verify more sensitive circuits of the drone. Both surge and measurement points were presented in Figure 2. For results presented in Figure 10, used input point no. 8 and measure point no. 10. The surge pulse was the same as previously (25 V and 110 A). Conclusions are similar as for voltage stabilizer, i.e., negative polarization is safer than positive, because overvoltage levels are lower, around 5 times. Stochastic, negative discharges are nine times more frequent than those with the positive polarity. The overvoltage at 3 V is not dangerous for electronic components, but it should be noted that the surge pulse had a value of 25 V only. Assuming the linearity of the response of tested elements, it can be assumed that for 1 MV GC the overvoltage on coils or supply can reach 50 V and around 6 V on communication buses on GPS module. For nominally high levels, UART equal to 3.3 V and overvoltage 2 times greater can be dangerous. Errors in communication (all modules, GPS, accelerometer, RF) are not important, because surge pulses are very short (for single stroke, not for multi strokes). The hazard resulting in the destruction of semiconductors on these circuits is caused by the levels of voltage exceeding their maximum value. This is individual for each component and it is not possible to define one safe point.

4. Transmittance of Circuits and Modeling

Based on the previously represented results of measurements, it is possible to calculate the transmittance of all circuits (blocks from the scheme). The mathematical model in the Matlab environment was then created [17,18,19,31,32]. Transmittance of circuits is the result of dividing a signal from output over input. To describe mathematical equations, polynomial regression with least squares methods was used. As a result of this operation, we obtain a function where the sum of squared deviations from the measurement data is the smallest (to find the minimum of the function). Mathematically, we can write it as Equation (1). To calculate data for all testing units, the Matlab function (polyfit) [33] and online calculator (for verification) [34] using the described method were used (gives similar equations). Results (examples) were shown in Table 1.
f(x) = an xn + an1 xn1 + ⋯ + a1 x + a0
R2 determines the accuracy of the equation representation with respect to the data used to calculate it. As you can see, not every model (block) can be mapped with high accuracy. Notice that the transmittance must be calculated for both directions (from one side to another and vice versa). Any equation of transmittance from this table can be implemented in Matlab as a block. This block is equal to the physical part of the drone (part of circuit). It was then possible to build a whole model of the unmanned aircraft as a virtual machine. It is possible to define the point of input surge and points where we want to measure the overvoltage. It is possible to observe how surges of lightning propagate in all “blocks”. Amplitude of surge can be modified by the user, but currently there is only one type of surge shape (tested WF4). It can be assumed, that the other waveforms will also be right-handled in the model, but it would be wise to add them after repeating whole measurements for those other shapes (and recalculating the transmittance of all blocks) and confirm this assumption by analyzing the results.

5. Testing Model of the Drone in Matlab

The described model can show how overvoltage propagates in all important parts of the drone. It is possible to define the input point of the surge pulse. To verify this model, two tests were carried out. Comparison of the calculation result with measurements were made in two ways:
  • The direct path from input to the measuring point through two or three different circuits (e.g., Coil > ESC > supply).
  • Measuring each of the parts separately and adding results together.
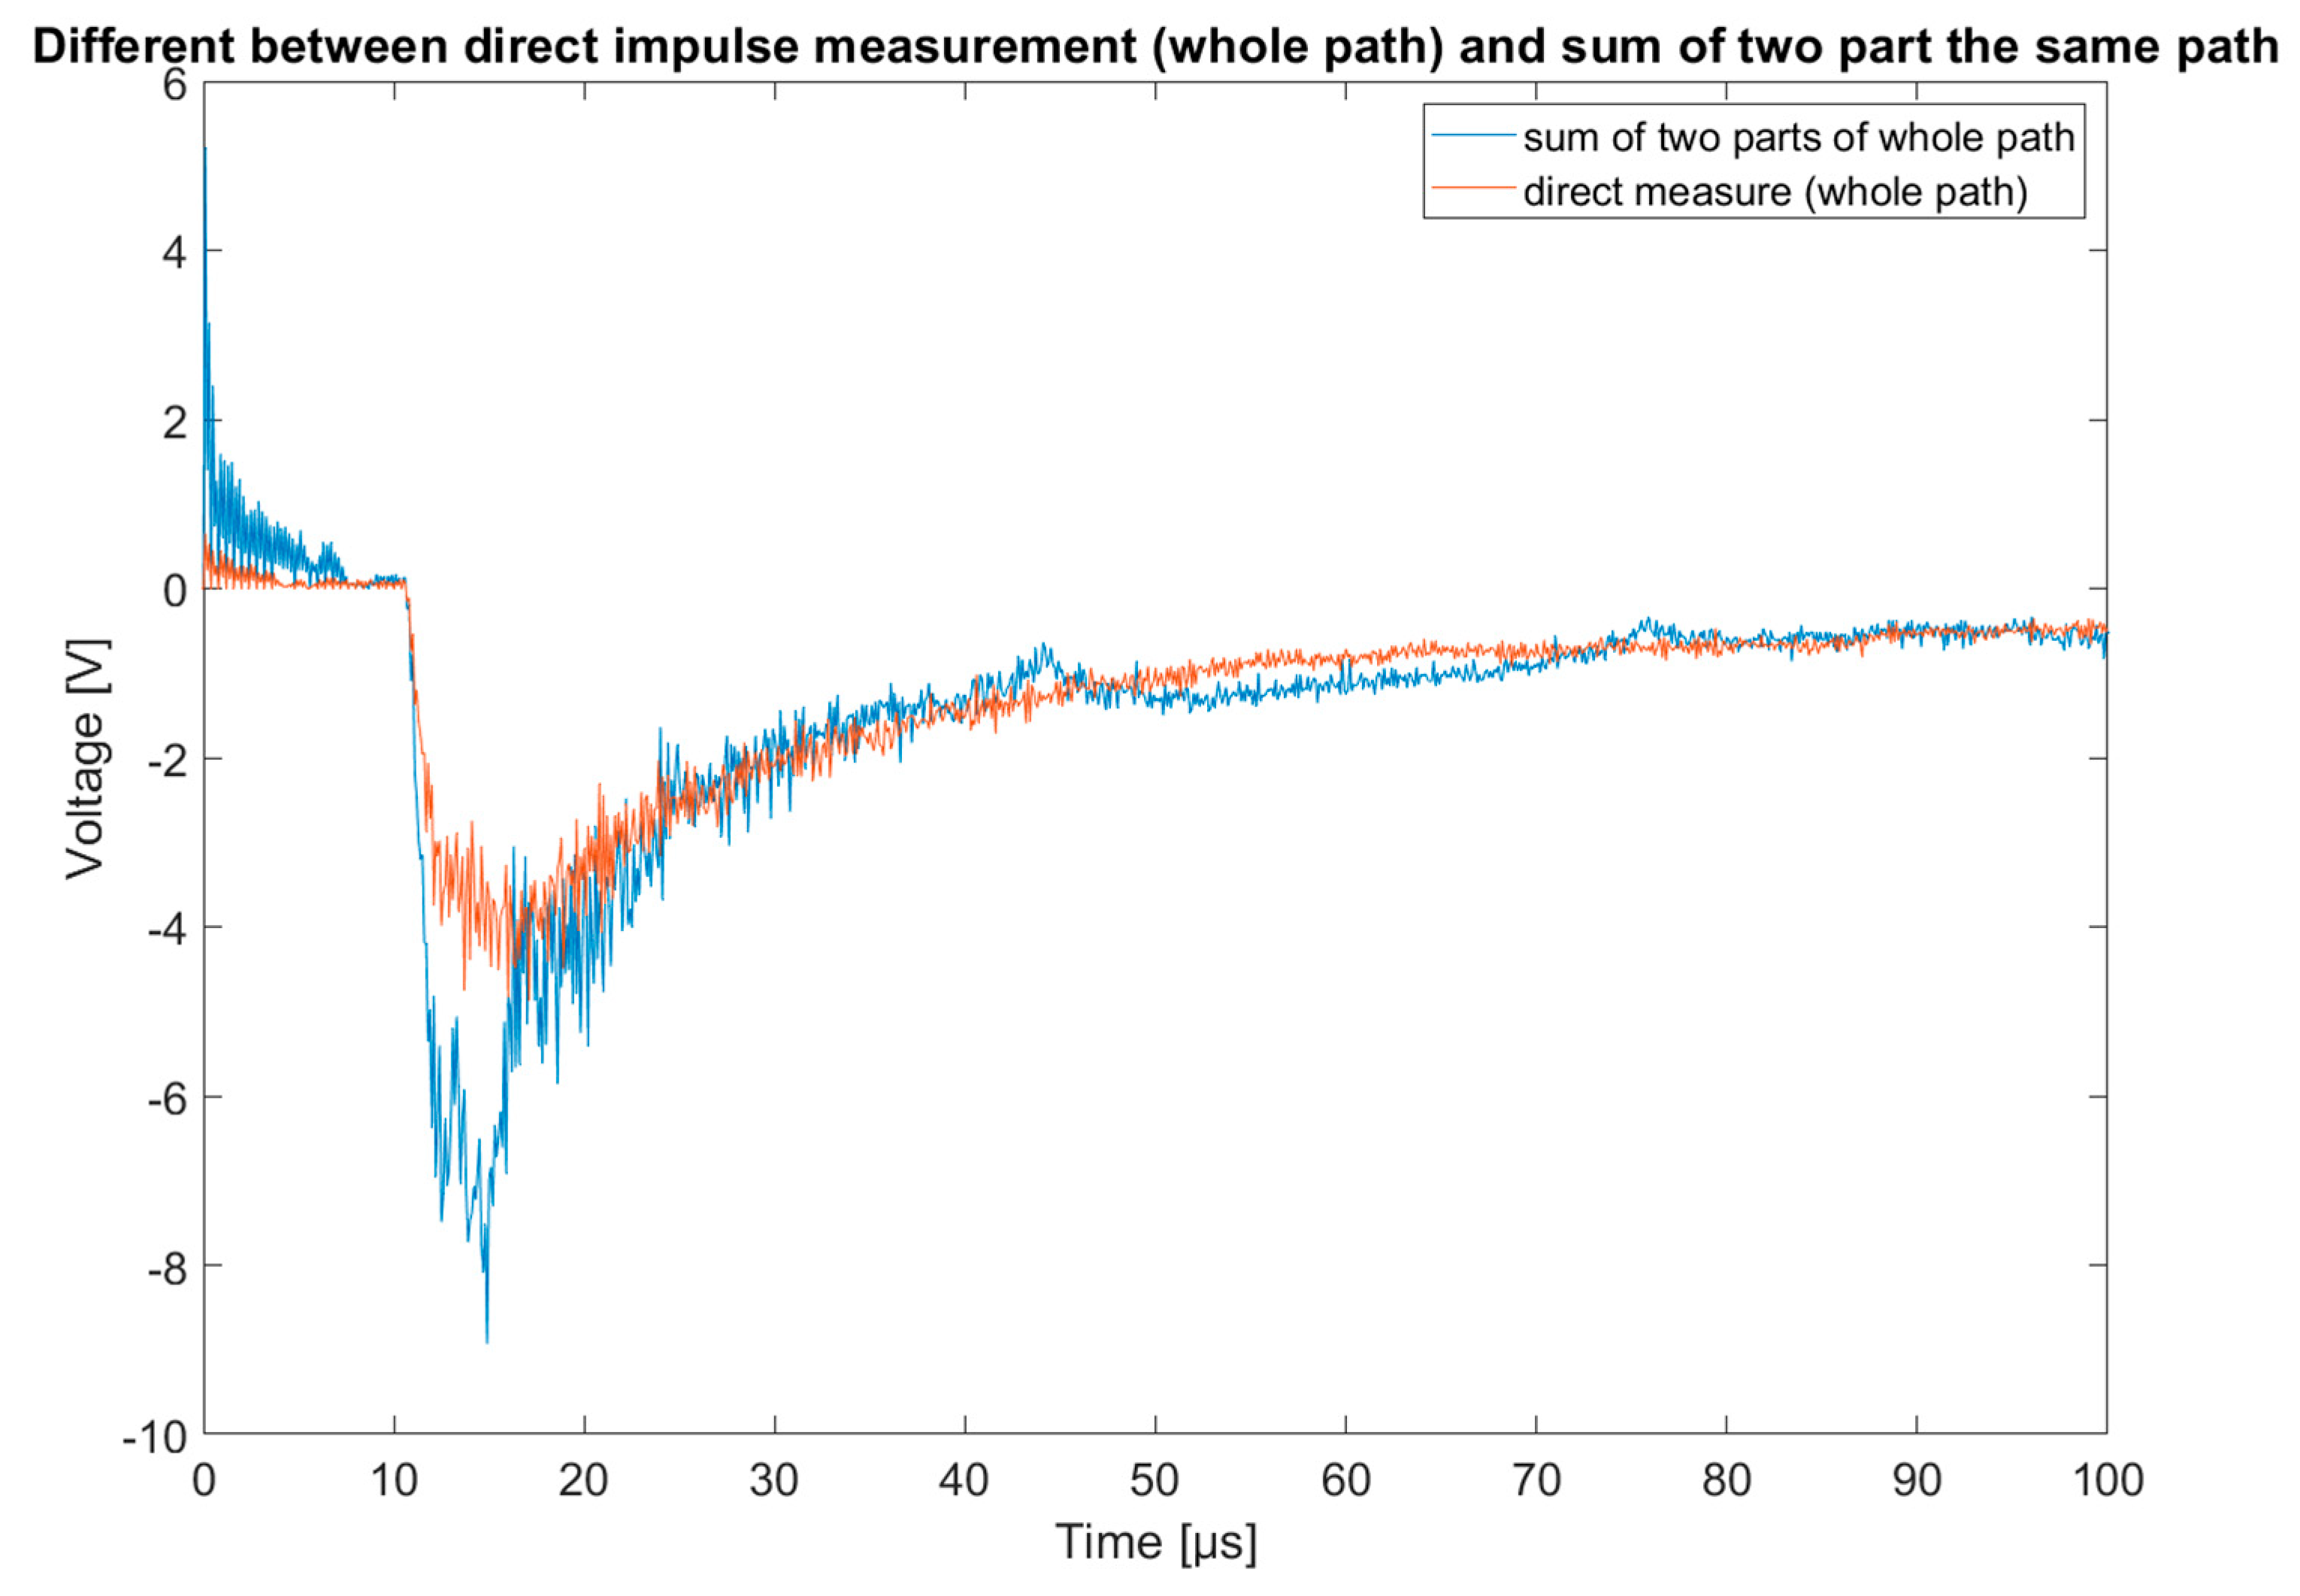
These two ways are measured by two paths (described in Figure 11). First, from motor coil through ESC through supply bus to supply after voltage stabilizer. Results, direct and calculated from model (summary of two block transmittance) were shown in Figure 12. The second path consists of the previous one with added communication pin from a GPS module. Results for measuring the whole path and calculating results from the model (sum of three blocks) is presented in Figure 13.
For both examples, the shapes of measured pulses and calculated from model are similar. Distortions are only on the rising edge (there is a greater probability of noises or reflections in circuits). Amplitudes of both signals are different. For first example, the maximum value of a model is greater than measured one, but only for the rising edge. The other parts of signals are similar. For the second example, the whole amplitude of the measured signal is greater than the calculated one (different by 25%). The developed model allows to estimate the spread of disturbances inside the drone. For other machines, however, the interference may differ depending on the construction of the particular unit. It is impossible to create a model that fits each device.

6. Conclusions

As part of the research described in this article, a mathematical description of the transmittance of selected fragments of circuits of the unmanned aircraft was developed. This made it possible to determine the method of propagation of overvoltage. It was possible to measure surges propagated through different circuits. To collect all the data, it was necessary to use a repeatable generator for avionics’ elements tests. Polynomial regression made it possible to design transmittance models on Matlab software. All the fundamental circuits for two ways (from input to output and vice versa) were described. Blocks are active or passive quadruple blocks, consisting of two input and two output pins. Next, it is possible to freely connect each block to define the testing path. It is impossible to use polynomial equations on all the obtained circuit transmittances, especially when the circuit is composed predominantly of semiconductor elements.
The accuracy of mapping the polynomial equation is too low for integrated circuits. Their complex structure (P-N junctions), switching circuits, and logic gates have complex transmittance depending on the pulse polarization, frequency, and voltage. Thanks to the model, we can simulate LEMP propagation through electronic parts of the drone without destroying it. It is very useful when it comes to estimating the risk of expensive, specialized machines. The most important achievements include
  • measurements under RTCA DO-160 standards (recommended for avionics),
  • data collection for all important circuits of the drone,
  • determination of transmittance for them,
  • designing the model using approximation and real measurement transmittance (and comparing them with each other).
The model allows observation of overvoltage in all circuits and enables determination of surge pulse point. It can be used in standardized (WF4) waveform or defined by the user. The developed model allows estimation of disturbances inside the unnamed aerial vehicle. However, the spread of impulses depends on the construction of a drone (number of engines, location of peripherals, layout of paths, etc.). It is impossible to create a universal model that fits each device. The model presented in the article will be developed on the basis of further research on other UAV constructions. This will increase the simulation possibilities and improve accuracy.

Author Contributions

Conceptualization, P.S. and T.K.; data curation, P.S. and T.K.; formal analysis, P.S. and T.K.; methodology, P.S. and T.K.; project administration, P.S.; resources, P.S. and T.K.; software, P.S. and T.K.; visualization, T.K.; writing—original draft, P.S. and T.K.; writing—review and editing, P.S. and T.K. All authors have read and agreed to the published version of the manuscript.

Funding

Ministry of Science and Higher Education of the Republic of Poland: Maintain the research potential of the discipline of automation, electronics, and electrical engineering.

Institutional Review Board Statement

Not applicable.

Informed Consent Statement

Not applicable.

Data Availability Statement

Not applicable.

Conflicts of Interest

The authors declare no conflict of interest.

References

  1. Divya, J. Exploring the Latest Drone Technology for Commercial, Industrial and Military Drone Uses. 2017. Available online: https://www.businessinsider.com/drone-technology-uses-2017-7?IR=T (accessed on 1 December 2021).
  2. Barr, L.C.; Newman, R.; Ancel, E.; Belcastro, C.M.; Foster, J.V.; Evans, J.; Klyde, D.H. Preliminary Risk Assessment for Small Unmanned Aircraft Systems. In Proceedings of the 17th AIAA Aviation Technology, Integration, and Operations Conference, Denver, CO, USA, 5–9 June 2017. [Google Scholar] [CrossRef]
  3. Gaynutdinov, R.R.; Chermoshentsev, S.F. Study of lightning strike impact on unmanned aerial vehicle. In Proceedings of the 2016 17th International Conference of Young Specialists on Micro/Nanotechnologies and Electron Devices (EDM), Erlagol, Altai, Russia, 30 June–4 July 2016; IEEE: Piscataway, NJ, USA, 2016; pp. 428–432. [Google Scholar]
  4. Masłowski, G.; Wyderka, S. Test-measurement system for open-air investigations of lightning hazards. Electr. Rev. 2012, 88, 67–72. [Google Scholar]
  5. Lin, T.; Uman, M.A.; Tiller, J.A.; Brantley, R.D.; Krider, E.P.; Weidman, C.D. Characteryzation of lightning return stroke electric and magnetic fiels form simultaneous two-station measurements. J. Geophys. Res. 1979, 84, 6307–6314. [Google Scholar] [CrossRef]
  6. Masłowski, G. Analiza i Modelowanie Wyładowań Atmosferycznych na Potrzeby Ochrony Przed Przepięciami; Monografia; Wydawnictwa AGH: Kraków, Poland, 2010. [Google Scholar]
  7. Fisher, F.A.; Plumer, J.A.; Perala, R.A. Aircraft Lightning Protection Handbook; DOT/FAA/CT-89/22; National Technical Information Service: Springfield, VA, USA, 1989.
  8. Gaynutdinov, R.R.; Sergey, F. Study of impact lightning at of electromagnetic and thermal stability of fuselage of unmanned aerial vehicle. In Proceedings of the 2016 International Conference on Actual Problems of Electron Devices Engineering (APEDE), Saratov, Russia, 22–23 September 2016; pp. 1–6. [Google Scholar]
  9. Gaynutdinov, R.R.; Chermoshentsev, S.F. Electromagnetic stability of an unmanned aerial vehicle at the indirect effect of a lightning discharge. In Proceedings of the 2017 International Multi-Conference on Engineering, Computer and Information Sciences (SIBIRCON), Novosibirsk, Russia, 18–22 September 2017; pp. 406–410. [Google Scholar] [CrossRef]
  10. Gizatullin, Z.M.; Nuriev, M.G.; Shleimovich, M.P. Physical Modeling of Electromagnetic Interference in Unmanned Aerial Vehicle under Action of Indirect Lightning Strike. In Proceedings of the 2017 Dynamics of Systems, Mechanisms and Machines (Dynamics), Omsk, Russia, 14–16 November 2017; IEEE: Piscataway, NJ, USA, 2017; pp. 1–4. [Google Scholar] [CrossRef]
  11. Szczupak, P.; Kossowski, T. Response of Drone Electronic Systems to a Standardized Lightning Pulse. Energies 2021, 14, 6547. [Google Scholar] [CrossRef]
  12. Kossowski, T.; Szczupak, P. Analysis of the influence of strong magnetic field on unmanned aircrafts, using Helmholtz coil. Electr. Rev. 2020, 96, 11–14. [Google Scholar]
  13. RTCA DO-160; Environmental Conditions and Test Procedures for Airborne Equipment. Radio Technical Commission for Aeronautics: Washington, DC, USA, 2010.
  14. PN-EN 62305-1:2011; Lightning Protection—Part 1. BSI Standards Publication: London, UK, 2011.
  15. PN-EN 61000-4-5:2014-10; Electromagnetic Compability (EMC)—Part 4–5: Methods of Research and Measurement—Shock Resistance Test. Standards Publication: Warsaw, Poland, 2014.
  16. Dupláková, D.; Flimel, M.; Duplák, J.; Hatala, M.; Radchenko, S.; Botko, F. Ergonomic rationalization of lighting in the working environment. Part I.: Proposal of rationalization algorithm for lighting redesign. Int. J. Ind. Ergon. 2019, 71, 92–102. [Google Scholar] [CrossRef]
  17. Yang, Y.; Chen, G.; Chen, P. The probability prediction method of domino effect triggered by lightning in chemical tank farm. Process Saf. Environ. Prot. 2018, 116, 106–114. [Google Scholar] [CrossRef]
  18. Tóth, Z.; Kiss, I.; Németh, B. Problems of the simulation and modeling the lightning protection of high structures. Pollack Period. 2019, 14, 223–234. [Google Scholar] [CrossRef]
  19. Visacro, S.; Soares, A.; Schroeder, M.A.O.; Cherchiglia, L.C.; de Sousa, V.J. Statistical analysis of lightning current parameters: Measurements at Morro do Cachimbo Station. J. Geophys. Res. Atmos. 2004, 109. [Google Scholar] [CrossRef]
  20. Tomasz, K.; Filik, K. Lightning tests of unmanned aircrafts with impulse generator. Prz. Elektrotech. 2020, 96, 67–70. [Google Scholar]
  21. Sehrawat, A.; Choudhury, T.A.; Choudhury, A.; Gaurav, R. Surveillance Drone for Disaster Management and Military Security. In Proceedings of the 2017 International Conference on Computing, Communication and Automation (ICCCA), Greater Noida, India, 20 February 2017; IEEE: Piscataway, NJ, USA, 2017. [Google Scholar]
  22. Bartlett, E. Drone vs Lightning. The University of Manchester. 2017. Available online: http://www.mub.eps.manchester.ac.uk/scienceengineering/2017/04/10/drone-vs-lightning/ (accessed on 11 March 2022).
  23. Environmental Conditions and Test Procedures for Aircraft Systems, wersja D, rozdział 22 i 23, 2006.
  24. MIL-STD-461 F; Department of Defense Interface Standard Requirements for the Control of Electromagnetic Interference Characteristics of Subsystems and Equipment. US Military Specs: USA, 2007. Available online: http://everyspec.com/MIL-STD/MIL-STD-0300-0499/MIL-STD-461G_53571/ (accessed on 11 March 2022).
  25. SAE. Aircraft Lightning Environment and Related Test Waveforms; Revision A.; SAE International: Warrendale, PA, USA, 2005. [Google Scholar]
  26. Rakov, V.A.; Uman, M.A. Lightning Physics and Effects; Cambridge University Press: Cambridge, Wielka Brytania, 2003. [Google Scholar]
  27. NO-16-A002:2006; Wojskowe Statki Powietrzne. Ochrona Przed Skutkami Wyładowania Atmosferycznego. Wymagania Ogólne, Dziennik Urzędowy: Warszawa, Poland, 2006.
  28. Filik, K. Badanie odporności zespołów awioniki statków powietrznych na narażenia LEMP. Prz. Elektrotech. 2014, 10, 60–63. [Google Scholar]
  29. Hacker, P.T.; Plumer, J.A. Measurements and Analysis of Lightning-Induced Voltages in Aircraft Electrical Circuits. SAE Trans. 1970, 79, 2735–2752. [Google Scholar] [CrossRef] [Green Version]
  30. Moore, C.B.; Rison, W.; Mathis, J.; Aulich, G. Lightning Rod Improvement Studies. J. Appl. Meteorol. 2000, 39, 593–609. [Google Scholar] [CrossRef]
  31. Trkulja, B.; Drandić, A.; Milardić, V.; Župan, T.; Žiger, I.; Filipović-Grčić, D. Lightning impulse voltage distribution over voltagetransformer windings—Simulation and measurement.Electr. Power Syst. Res. 2017, 147, 185–191. [Google Scholar] [CrossRef]
  32. Prácser, E.; Bozóki, T.; Sátori, G.; Williams, E.; Guha, A.; Yu, H. Reconstruction of global lightning activity based on Schumannresonance measurements: Model description and synthetic tests. Radio Sci. 2019, 54, 254–267. [Google Scholar] [CrossRef]
  33. Matlab Datasheet. Available online: https://www.mathworks.com/help/matlab/ref/polyfit.html (accessed on 12 June 2022).
  34. Available online: https://calculla.pl/ (accessed on 12 June 2022).
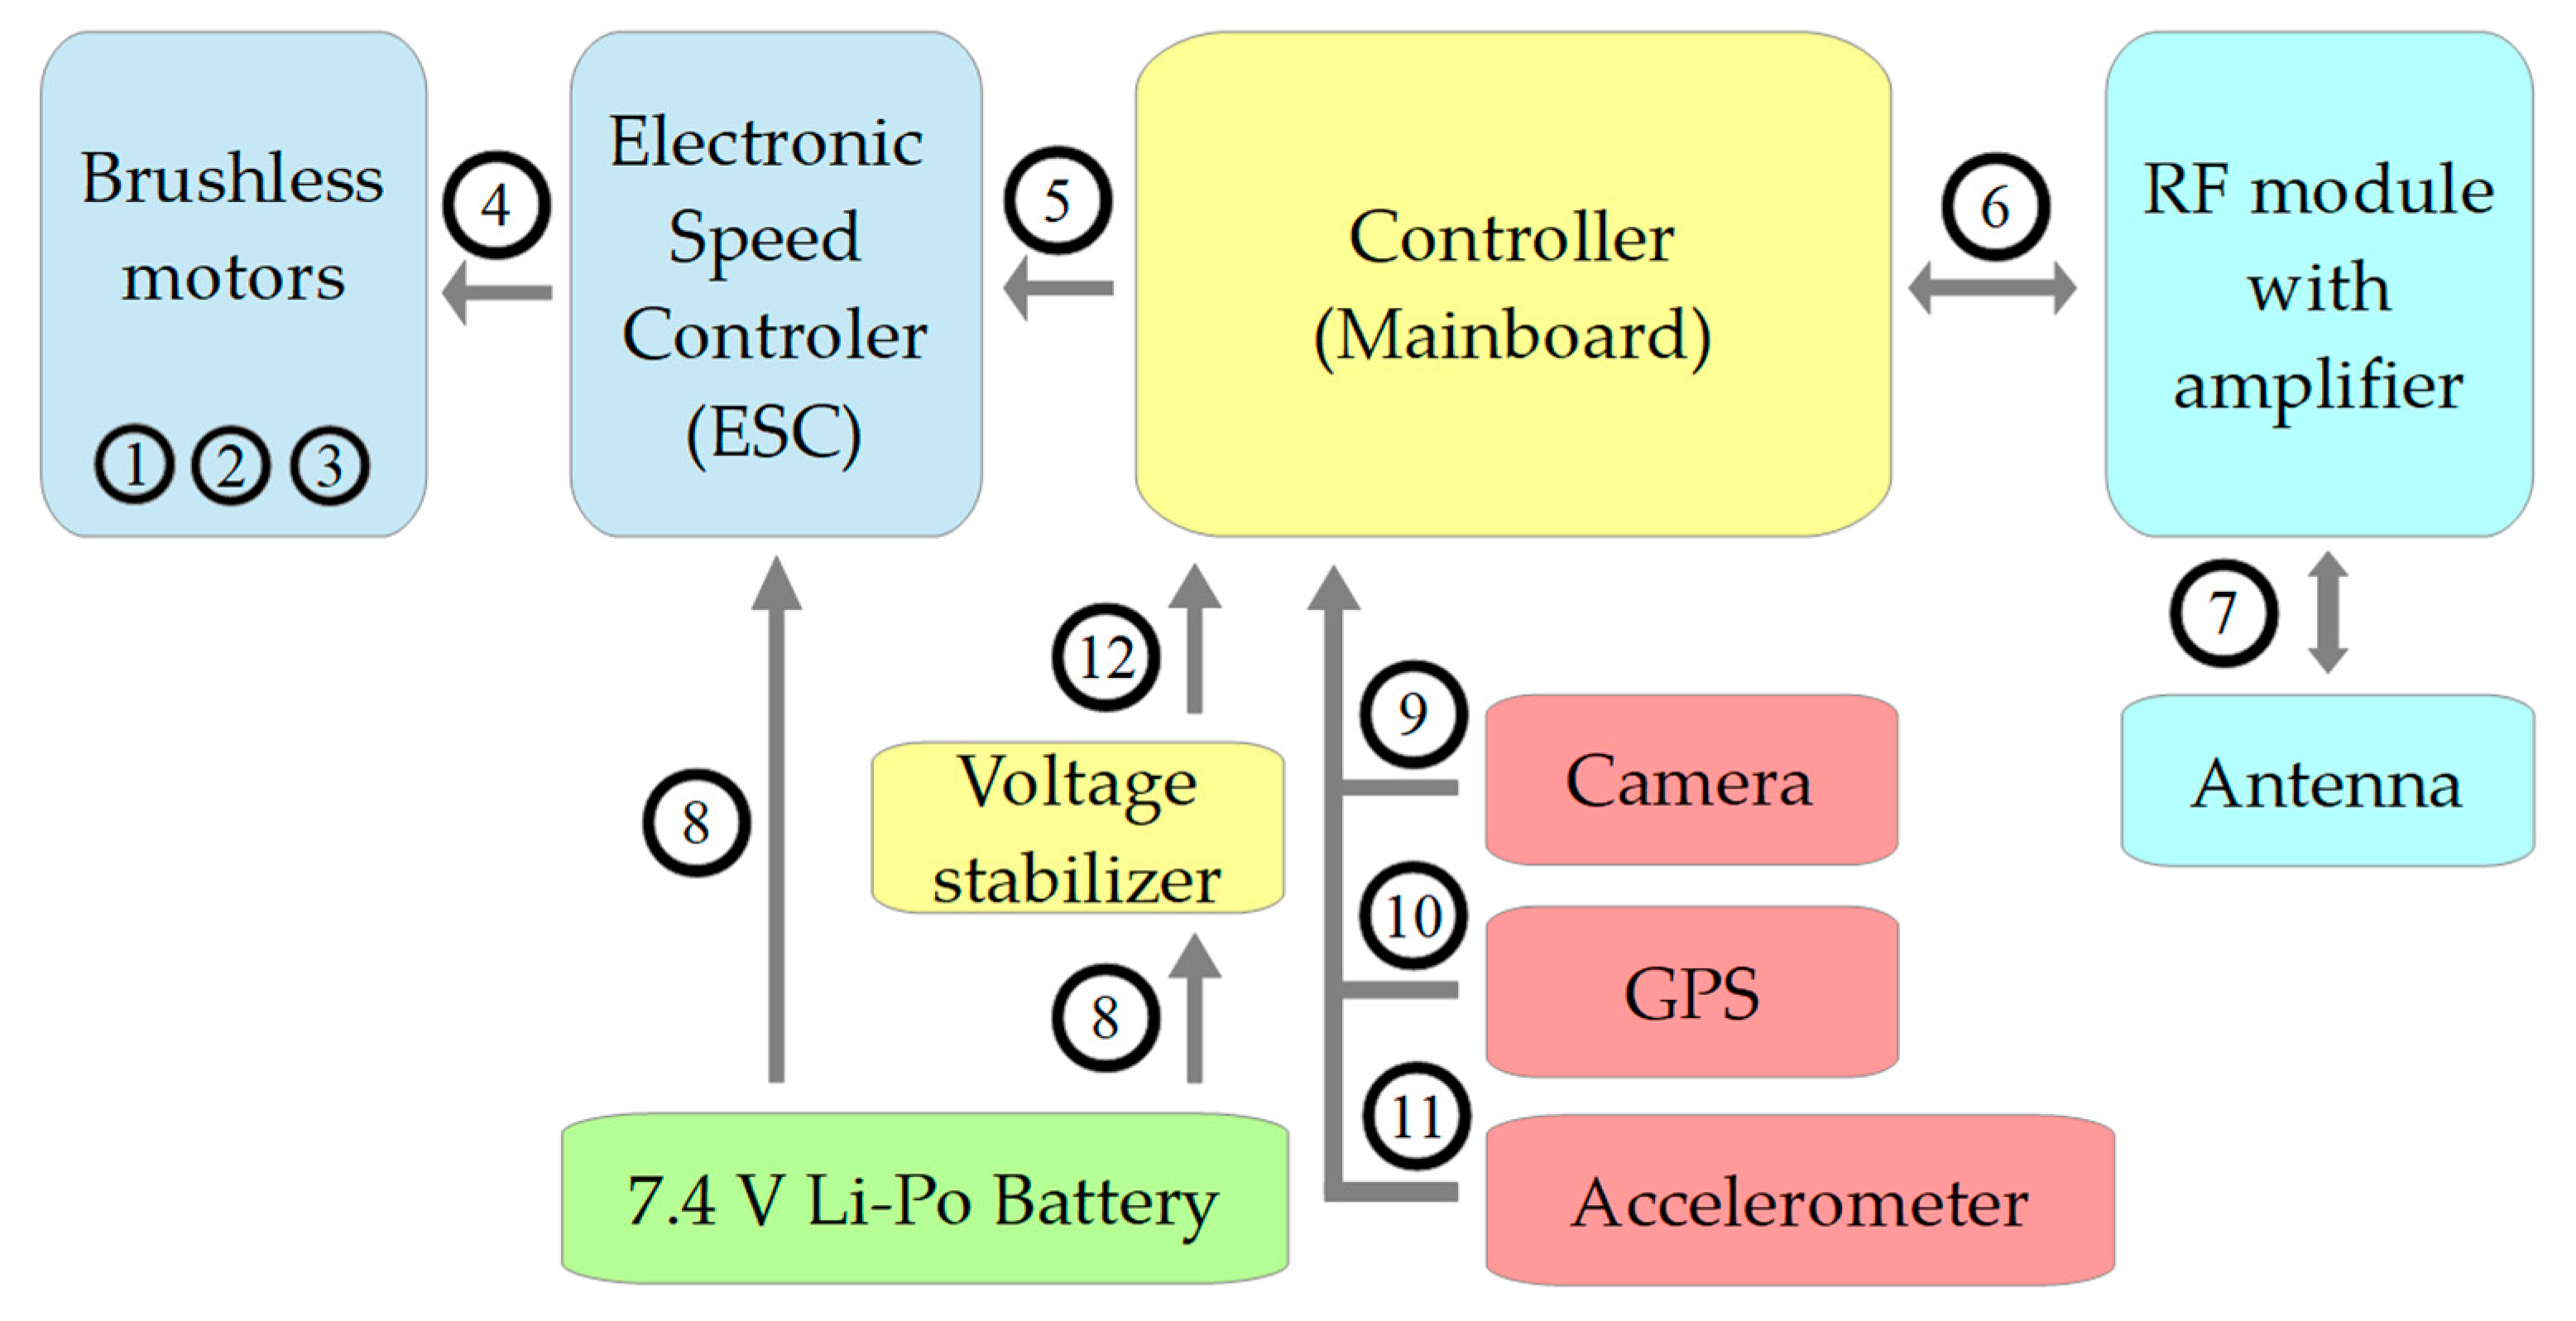
Figure 1. Idealized WF4 voltage waveforms T1 = 6.4 µs ± 20%, T2 = 69 µs ± 20%) [13,15].
Energies 15 06609 g001
Figure 2. Block diagram of the drone (the same peripherals are the same block color) with numbered measurement points.
Energies 15 06609 g002
Figure 3. Simplified measurement scheme of drone components.
Energies 15 06609 g003
Figure 4. Input impulse (surge) on all motor coils—the same points to inject and measure.
Energies 15 06609 g004
Figure 5. Overvoltage on ESC for surge impulse on all motor coils—input on coil pairs 1 and 2, 2 and 3, 1 and 3. The results were observed in point no. 5.
Energies 15 06609 g005
Figure 6. Value of surge pulse on supply bus (point no. 8) for both (negative and positive) polarity (negative polarity was inverted to show difference between them).
Energies 15 06609 g006
Figure 7. Overvoltage on all measurement circuits—input surge on supply bus (point no. 8) at negative polarity.
Energies 15 06609 g007
Figure 8. Overvoltage on all measurement circuits—input surge on supply bus (point no. 8) at positive polarity.
Energies 15 06609 g008
Figure 9. Overvoltage on output of voltage stabilizer (point 12) for both (negative and positive) polarity of surge pulse on supply bus (point 8).
Energies 15 06609 g009
Figure 10. Overvoltage on GPS antenna (point 10) for both (negative and positive) polarity of surge pulse on supply bus (point 8).
Energies 15 06609 g010
Figure 11. Scheme of measurement for described results.
Energies 15 06609 g011
Figure 12. Measured overvoltage and simulated for the same circuits (two blocks). Input in points 1, 2 (motor coil) and output in voltage stabilizer (point 12).
Energies 15 06609 g012
Figure 13. Measured overvoltage and simulated for the same circuits (three blocks). Input in points 1, 2 (motor coil) and output in GPS module communication line (point 10).
Energies 15 06609 g013
Table 1. Mathematical transmittance of selected blocks.
BlockInput/OutputEquationR2
Motor coilPoints 1, 3/Point 5f(x) = −4.8 × 10⁻⁹∙x3 + 7.479 × 10⁻⁶∙x2 − 2.623 × 10⁻³∙x + 0.1887%
ESCPoints 1, 3/Point 8f(x) = 1.21 × 10⁻⁸∙x3 − 1.3056 × 10⁻⁵∙x2 + 4.49 × 10⁻³∙x − 0.028052997%
Voltage StabilizerPoint 8/Point 12f(x) = 8.8 × 10⁻⁹∙x3 − 9.1164 × 10⁻⁶∙x2 + 2.8036154 × 10⁻³∙x − 0.05348890%
UARTPoint 8/Point 11f(x) = 2.8 × 10⁻⁹∙x3 − 3.1018 × 10⁻⁶∙x2 + 9.609775 × 10⁻⁴∙x − 0.0151453%
RF ModulePoint 8/Point 7f(x) = 8.8 × 10⁻⁹∙x3 − 9.1208 × 10⁻⁶∙x2 + 2.782078 × 10⁻³∙x − 0.046954689%
GPSPoint 8/Point 10f(x) = 3 × 10⁻¹⁰∙x3 − 6.598 × 10⁻⁷∙x2 + 4.10553 × 10⁻⁵∙x + 0.2230787%
I2CPoint 8/Point 9f(x) = 1.2 × 10⁻⁹∙x3 − 1.8723 × 10⁻⁶∙x2 + 5.246636 × 10⁻⁴∙x + 0.196542989%
Publisher’s Note: MDPI stays neutral with regard to jurisdictional claims in published maps and institutional affiliations.