Article

Measurement of Interfacial Characteristics of Horizontal and Inclined Oil–Water Flows by Using Wire-Mesh Sensor

School of Electrical and Information Engineering, Tianjin University, Tianjin 300072, China
*
Author to whom correspondence should be addressed.
Energies 2022, 15(18), 6638; https://doi.org/10.3390/en15186638
Submission received: 6 August 2022 / Revised: 7 September 2022 / Accepted: 8 September 2022 / Published: 11 September 2022
(This article belongs to the Section K: State-of-the-Art Energy Related Technologies)

Abstract

:
Oil–water flows are widely encountered in petroleum, chemical, nuclear reactors, and other crucial industrial processes. Due to gravity and interaction between phases, horizontal and inclined oil–water two-phase flows are characterized by remarkable multi-scale structure characteristics, such as large-scale stratified interface and small-scale droplets entrainment. Moreover, a slight change in the pipe inclination will lead to significant changes in the local oil–water flow structures, which results in great challenges in the measurement of the interface structures. In this study, we design a 10 × 10 conductance wire-mesh sensor (WMS) to detect the interfacial characteristics of horizontal and inclined oil–water flows. Firstly, we carry out horizontal and inclined oil–water flow experiments. The influence of pipe inclinations on the flow transition boundary is analyzed. The three-dimensional (3D) structures of oil–water flows are visualized based on the WMS measurement response. Then, edge detection is implemented to process the two-dimensional (2D) flow images visualized by the WMS. The influence of complexly distributed droplets is effectively removed by using binary image morphological transformation and watershed algorithm, and thus, oil–water interface structures are accurately extracted. Finally, the influence of the oil–water flow conditions and pipe inclinations on the configuration, height, and length of the stratified interface are investigated.

1. Introduction

Oil–water flows are always encountered in petroleum, chemical, nuclear reactors, and other industrial processes. The characteristics of an oil–water stratified interface have important significance for investigating the heat and mass transfer among different phases and uncovering the flow pattern transformation mechanism. Due to gravity and interaction between phases, horizontal and inclined oil–water flows are characterized by complex structures. A slight change in the pipe inclination will lead to obvious changes in the local oil–water flow structures, which bring great challenges to the measurement of the interfacial characteristics.
Early studies on oil–water flow mainly focused on flow pattern detection and classification. Trollra [1] studied the flow patterns of horizontal oil–water two-phase flow and proposed six typical structures: stratified flow (ST), stratified flow with mixing at interface (ST&MI), dispersion of water in oil and water flow (D O/W&W), dispersion of water in oil and oil in water flow (D W/O&D O/W), dispersion of oil in water flow (D O/W), dispersion of water in oil flow (D W/O). Angeli et al. [2] identified stratified wavy flow, three-layer flow, stratified mixed flow, and fully dispersed flow by using a high-frequency impedance probe. Zhai et al. [3] detected the structures of horizontal oil–water flow using mini-conductance probes and divided the ST&MI flow patterns more precisely. Rodriguez and Oliemans [4] carried out experimental studies on horizontal and inclined oil–water two-phase flows. It was observed that there were stratified wavy flows with smooth interfaces and no dispersed droplets in the inclined pipe. Grassi et al. [5] suggested that the change in pipe inclination angle (±10°, +15°) has little influence on the flow pattern in the state of liquid–liquid two-phase flow with a high viscosity ratio (800:1). Boostani et al. [6] observed P o/w (plugs of oil in water), P w/o (plugs of water in oil), SL (slug flow), and AN (annular flow) in the horizontal and inclined (+4°, +7°) pipe with an inner diameter of 11 mm. In addition, some scholars have investigated the flow pattern transition boundary of horizontal and inclined oil–water flows. Hanafizadeh et al. [7] studied the flow pattern transition boundary of oil–water flow at different inclination angles and found that the transition boundary between stratified and non-stratified flow patterns basically remained constant, while the transition boundary between non-stratified flow patterns would move horizontally to the right in the upward inclined pipeline. Zhang et al. [8] predicted the transition boundaries from oil–water stratified to annular flow based on mixed Froude number, and developed the shear deformation mechanism of a three-dimensional interfacial wave to describe the wave instability and the droplet formation. Paolinelli [9] proposed a mechanistic model to determine the stability of dispersed liquid–liquid flow patterns and achieved the prediction of the dispersed flow regime.
Generally, the horizontal and inclined oil–water flow patterns show obvious diversity and instability, and the mechanism of the flow pattern transition is complicated. The interfacial wave characteristics of ST flow were remarkably associated with the transition between the stratified to non-stratified flow [10,11,12]. Angeli et al. [13] measured the interfacial wave amplitude and wavelength with a parallel-wire conductivity probe and proposed that the waves have to reach a certain amplitude before droplets can detach from their crests. Zhai et al. [14] designed a novel conductance parallel-wire array probe to reconstruct the interface structures of stratified oil–water flows, and the interfacial wave evolution characteristics of the oil–water stratified flow without the droplet attachment were mainly studied. For ST&MI and D W/O&D O/W flow, both the oil and water phases are continuous. Droplets detach from the interface and are entrained in the continuous phases on account of the oil–water interface turbulence and shear action. In this regard, the study of oil–water interfacial characteristics plays an important role in revealing the entrainment of dispersed droplets. However, the conductance probes reported in the literature are only suitable for the measurement of the smooth liquid–liquid interface, and the existing measurement techniques show evident limitations when droplets detach from the stratified interface. The development of optical/laser-based techniques has allowed the application of particle image velocimetry (PIV) and planar laser-induced fluorescence (PLIF). Morgan et al. [15,16] used PLIF technology to extract the one-dimensional structure information of the stratified interface with droplet detachment and measured the local parameters of the droplets. Ibarra et al. [17] set up two-line planar laser-induced fluorescence and particle velocimetry to detect 2D phase and velocity information. Although laser-based techniques have obvious advantages in the microstructure detection of liquid–liquid two-phase flow, it is mostly used to measure the one-dimensional interface structure along the axial direction of the pipeline, while the liquid–liquid 3D interface structure has not been reported in the literature.
Electrical tomography, such as ECT and ERT, has been widely used in the visualization of liquid–liquid two-phase flow [18,19], but it has a low resolution for small-scale flow structures. Wire-mesh sensor (WMS) has obvious advantages in measuring the local structures of complex multiphase flow [20]. Conductance WMS was firstly proposed by Prasser et al. [21], which consists of two layers of parallel wires upstream and downstream. With the development of the hardware system and imaging algorithm [22,23,24], WMS has gradually been applied to the detection of complicated flow structures, such as huge wave and pseudo-slug in gas–liquid flows [25,26]. Despite the previous research efforts, the application of the WMS in liquid–liquid two-phase flow is rarely reported. Capacitance WMS was used by Da Silva et al. [27] and Rodriguez et al. [28] to detect horizontal oil–water two-phase flows. However, the capacitive WMS presents a low resolution for horizontal liquid–liquid flows, especially when the stratified interface and entrained droplets coexist. So far, the conductance WMS has never been used in the measurement of horizontal liquid–liquid flows. It is a beneficial attempt to explore the capability of the conductance WMS in measuring the complex interface characteristics in horizontal flows.
In this study, a 10 × 10 conductance WMS is designed to measure the interfacial characteristics of horizontal and inclined oil–water flows. Horizontal and inclined oil–water flow experiments were carried out and the flow pattern maps of the oil–water flow under different pipe inclinations were obtained. The influence of the pipe inclination on the flow transition boundary was analyzed. Edge detection was implemented to process the 2D flow images visualized by the sensor. Then, 2D and 3D interface structures of ST, ST&MI, and D W/O&D O/W flow were accurately extracted by using binary image morphological transformation and watershed algorithm. Meanwhile, the influence of the oil–water flow conditions and pipe inclinations on the configuration, height, and length of the stratified interface were investigated.

2. Materials and Methods

2.1. Wire-Mesh Sensor System

Figure 1 shows the schematic of the conductance wire-mesh sensor measurement system. The sensor is composed of two planes of stainless-steel wires which are positioned mutually perpendicular. The wire diameter is 0.2 mm. The number of parallel wires on each plane is ten. The two planes of the parallel wires form 10 × 10 crossing points. The wires at the two planes serve as transmitters (T1, T2, …, T10) and receivers (R1, R2, …, R10), respectively. The distance of two adjacent wires in the same plane is defined as the spatial resolution of the sensor. The spatial resolution of the sensor is generally related to the number of parallel wires and the pipe inner diameter. If the pipe inner diameter is fixed, a large number of parallel wires are accompanied by high spatial resolution. Table 1 shows the wire-mesh sensor configurations and spatial resolutions reported in the literature. The spatial resolution adopted by scholars is always lower than 2 mm. In this study, the 10 × 10 wire-mesh sensor is used in a horizontal pipe with an inner diameter of 20 mm, which has a higher spatial resolution of 2 mm. In addition, the axial spacing of the two wire planes are generally less than or equal to the spatial resolution [29]. It can be explained as follows. Wire-mesh sensor is expected to be sensitive to the conductivity of the phase at the crossing points. The sensor operates in periodic excitation mode. If one of the transmitter wires is activated, its neighboring transmitter wires and all the receiver wires are connected with reference ground to keep zero potential. Thus, the potential field from the activated transmitter wire was limited within a certain volume. The increasing of the axial spacing of the two wire planes will lead to weakened receiver current, which causes the accuracy of the measurements to deteriorate. Hence, the axial spacing of the two wire planes is selected as 2 mm in our study.
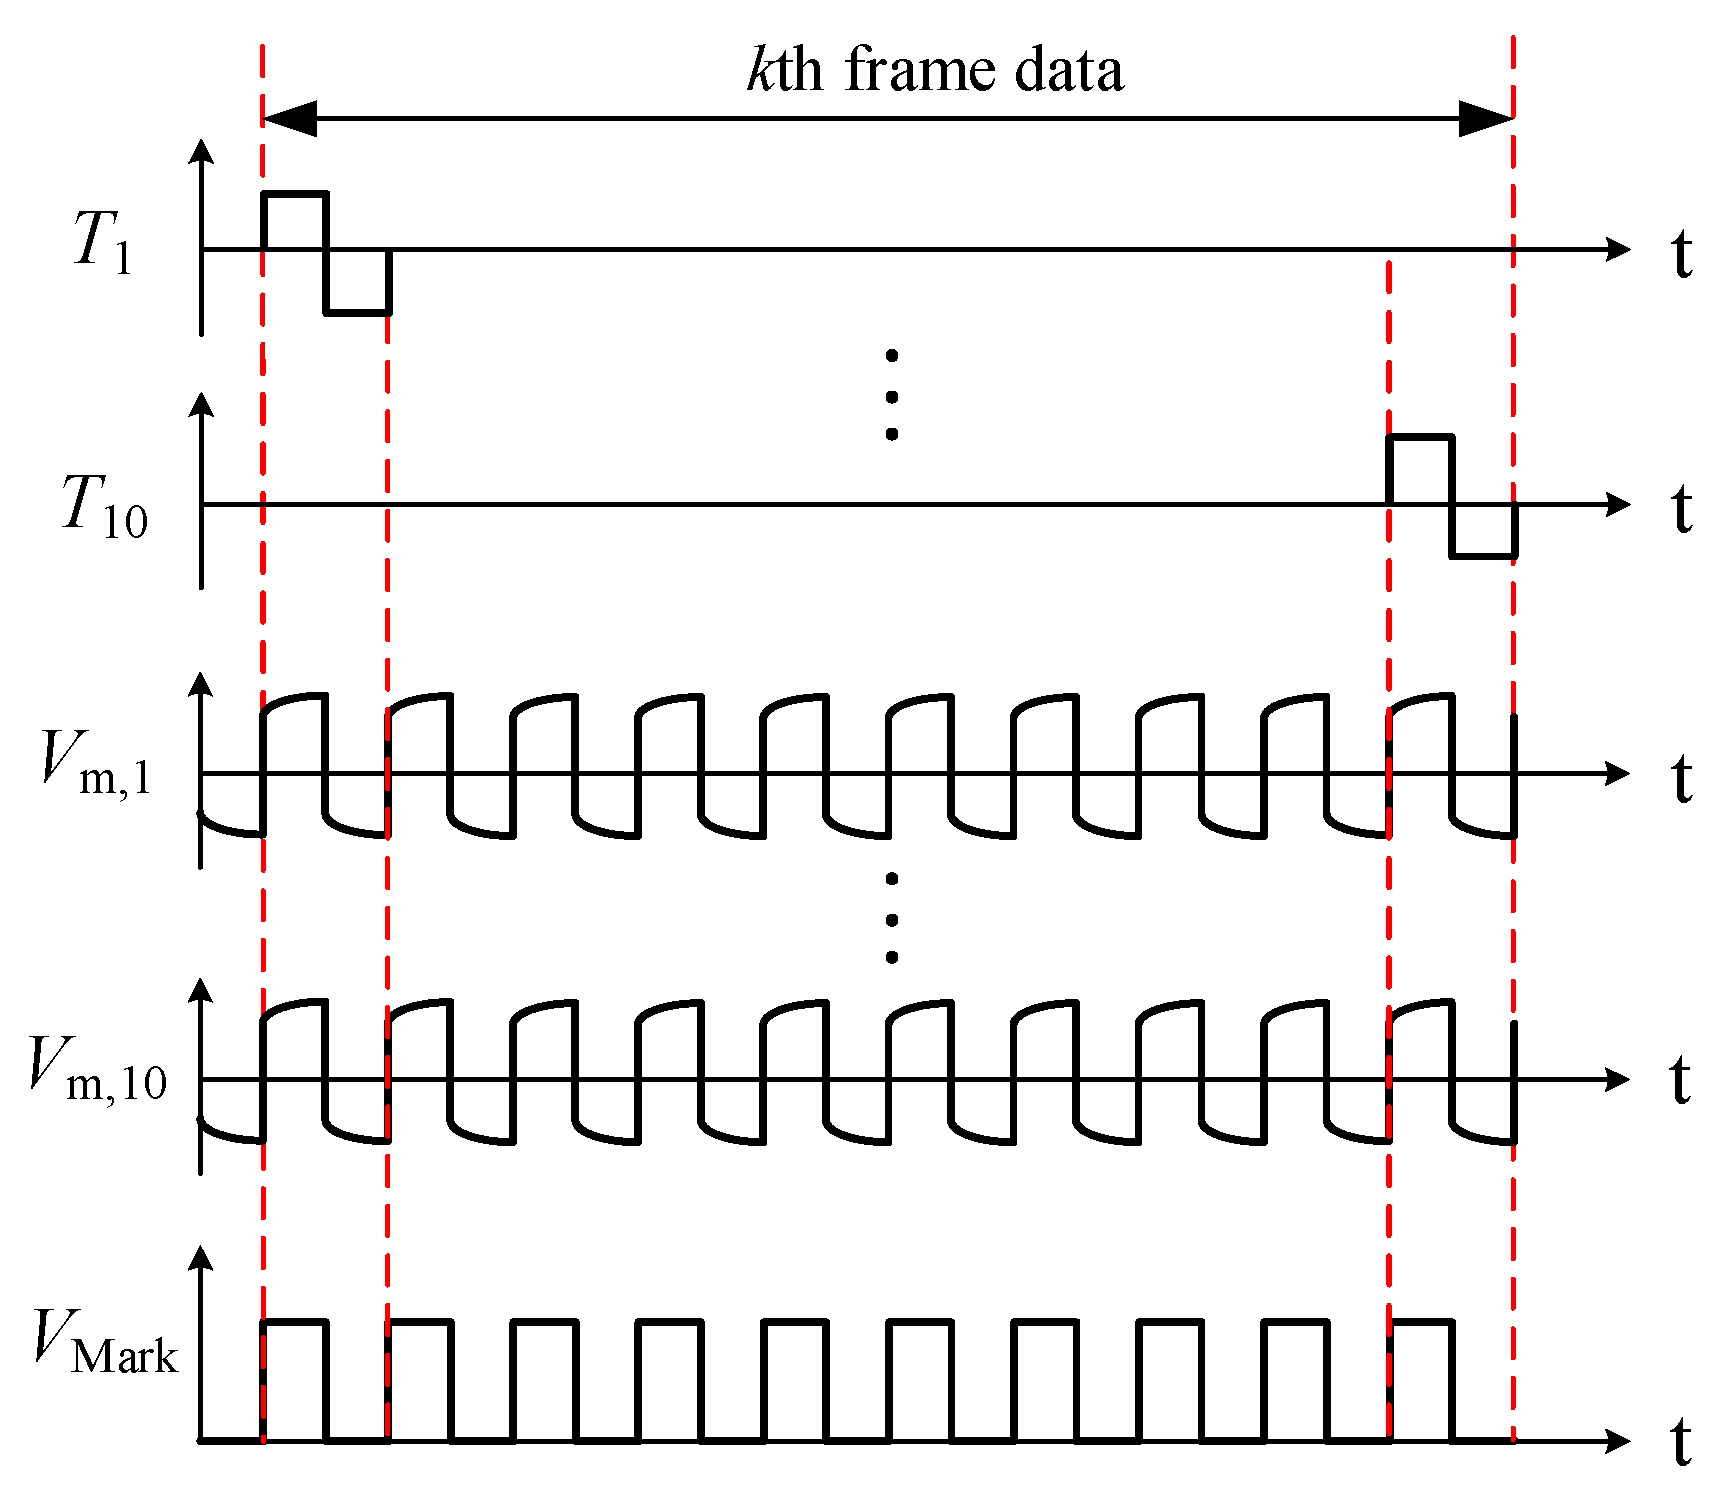
A square-wave voltage signal is selected as the excitation signal VE. The duty cycle and the peak-to-peak value of the excitation signal are 50% and 10 V, respectively. VE is cyclically applied to the transmitters by an analog switch array (MT8816). The input terminal of MT8816 is connected to +5 V, −5 V and GND cyclically according to the control signal from a microcontroller unit (AVR ATmega16). During a certain period, only one of the transmitters is connected with VE, and other transmitters are connected with a reference ground. A signal conditioning module converts the currents from all the receivers to voltage signals. For instance, the transmitter T9 is connected with the excitation signal. The crossing points formed by T9 and R1 to R10 are marked with red circles. R1 to R10 are connected with the I/V conversion circuits. The current signal at each crossing point is converted into a voltage signal, i.e., Vm,1 to Vm,10. Voltage signals Vm,1 to Vm,10 are simultaneously acquired by NI USB-6363, Ch1 to Ch10, and the sampling frequency of each channel is 90 kHz. Note that a marking signal VMark is generated by AVR ATmega16. The marking signal is a square wave with the same period as the excitation signal VE and collected by Ch0 of NI USB-6363. Figure 2 is a schematic of the sensor response signal. The excitation order of the transmitters is indicated by the signal VMark. One frame data corresponds to ten rising edges of VMark. The sensor response signals are expressed by Vm,1 (k) to Vm,10 (k) where k denotes the frame number. Based on the conductivity differences between the two phases (oil and water), the voltage signals Vm,1 to Vm,10 can represent the phase proportion at the crossing points.
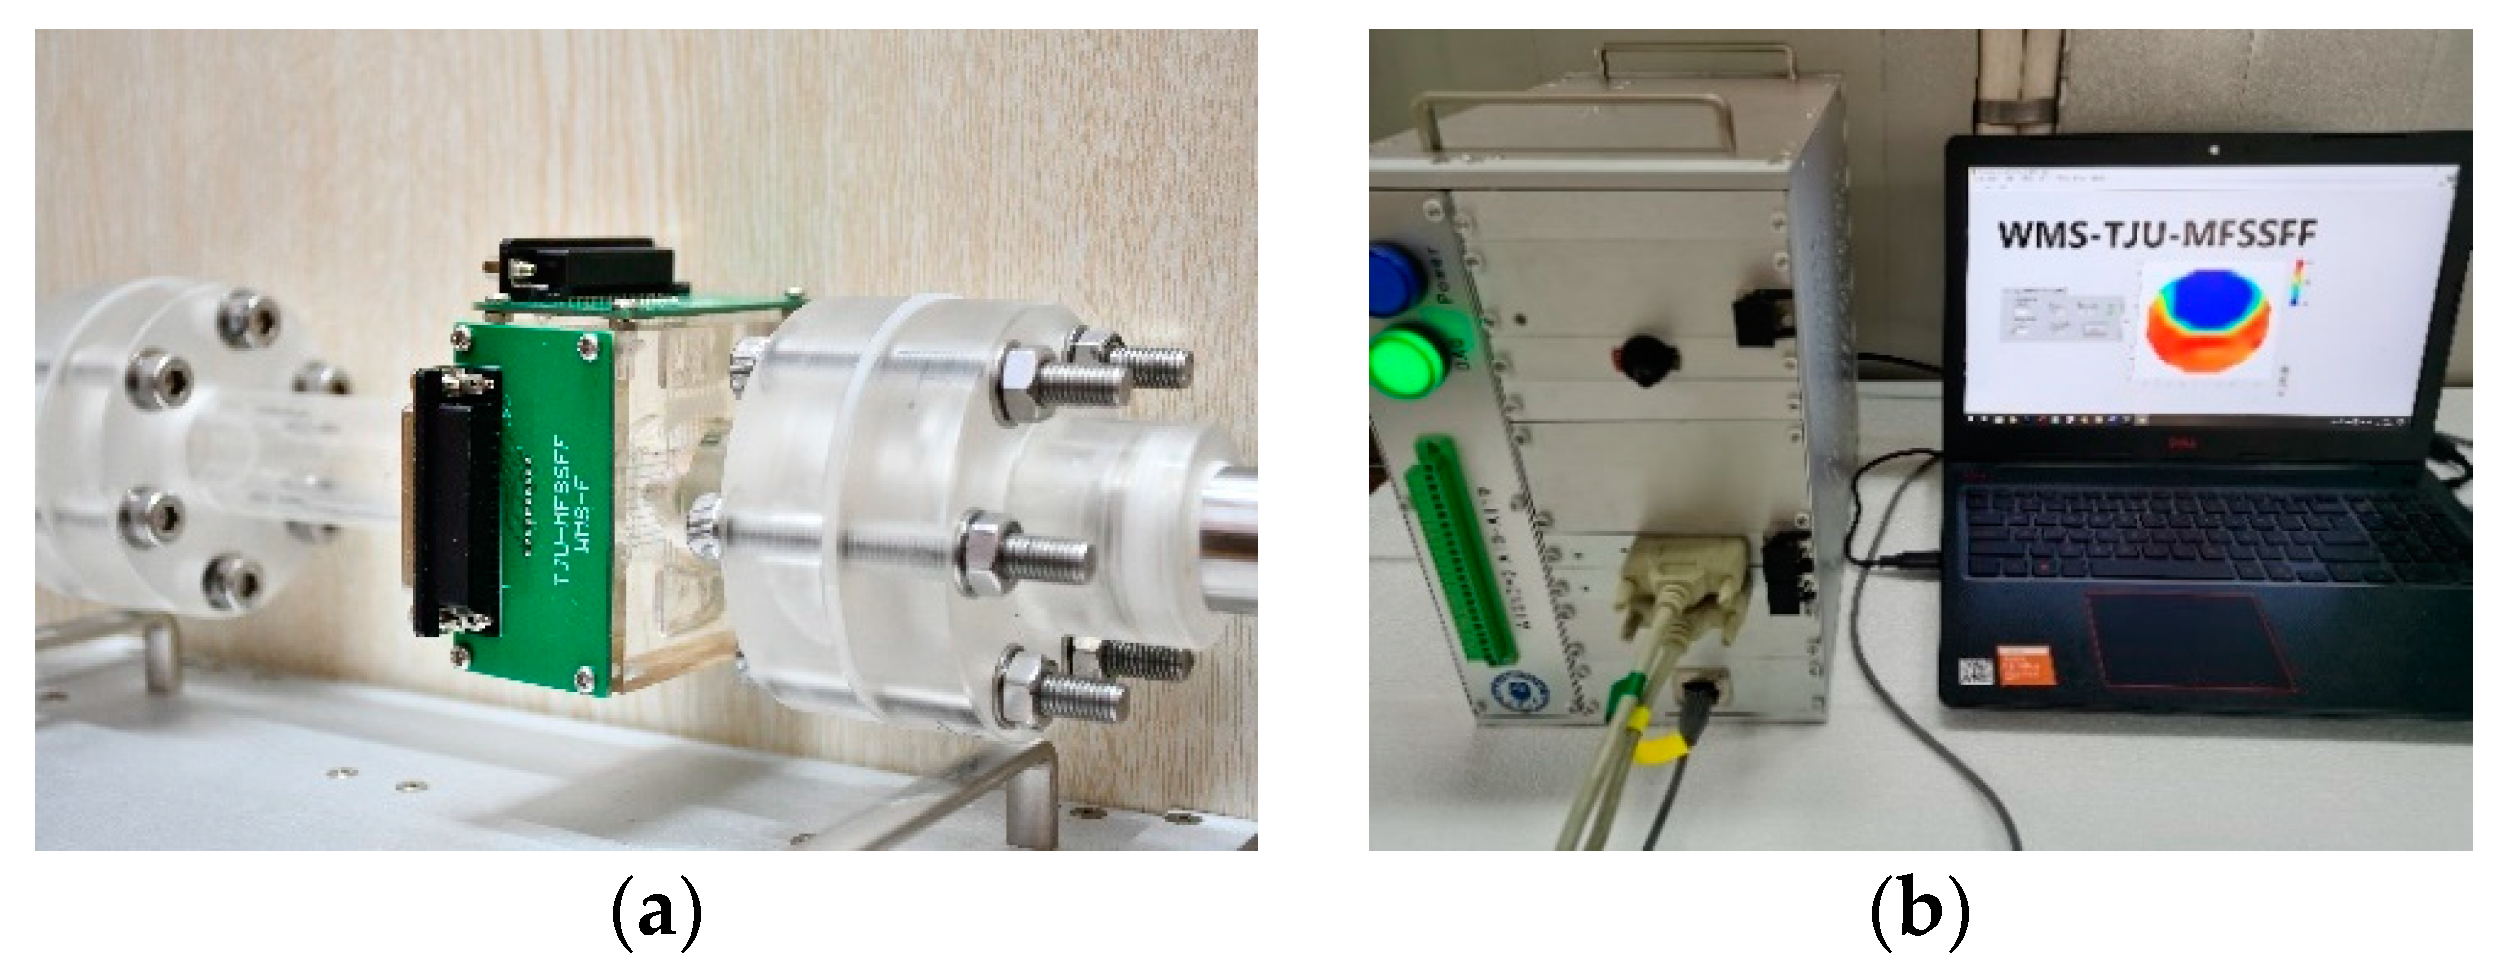
The conductance WMS system used in this study is shown in Figure 3. More details about the sensor systems can refer to Zhai et al. [34].

2.2. Experiment of Oil–Water Two-Phase Flows

2.2.1. Experimental Setup

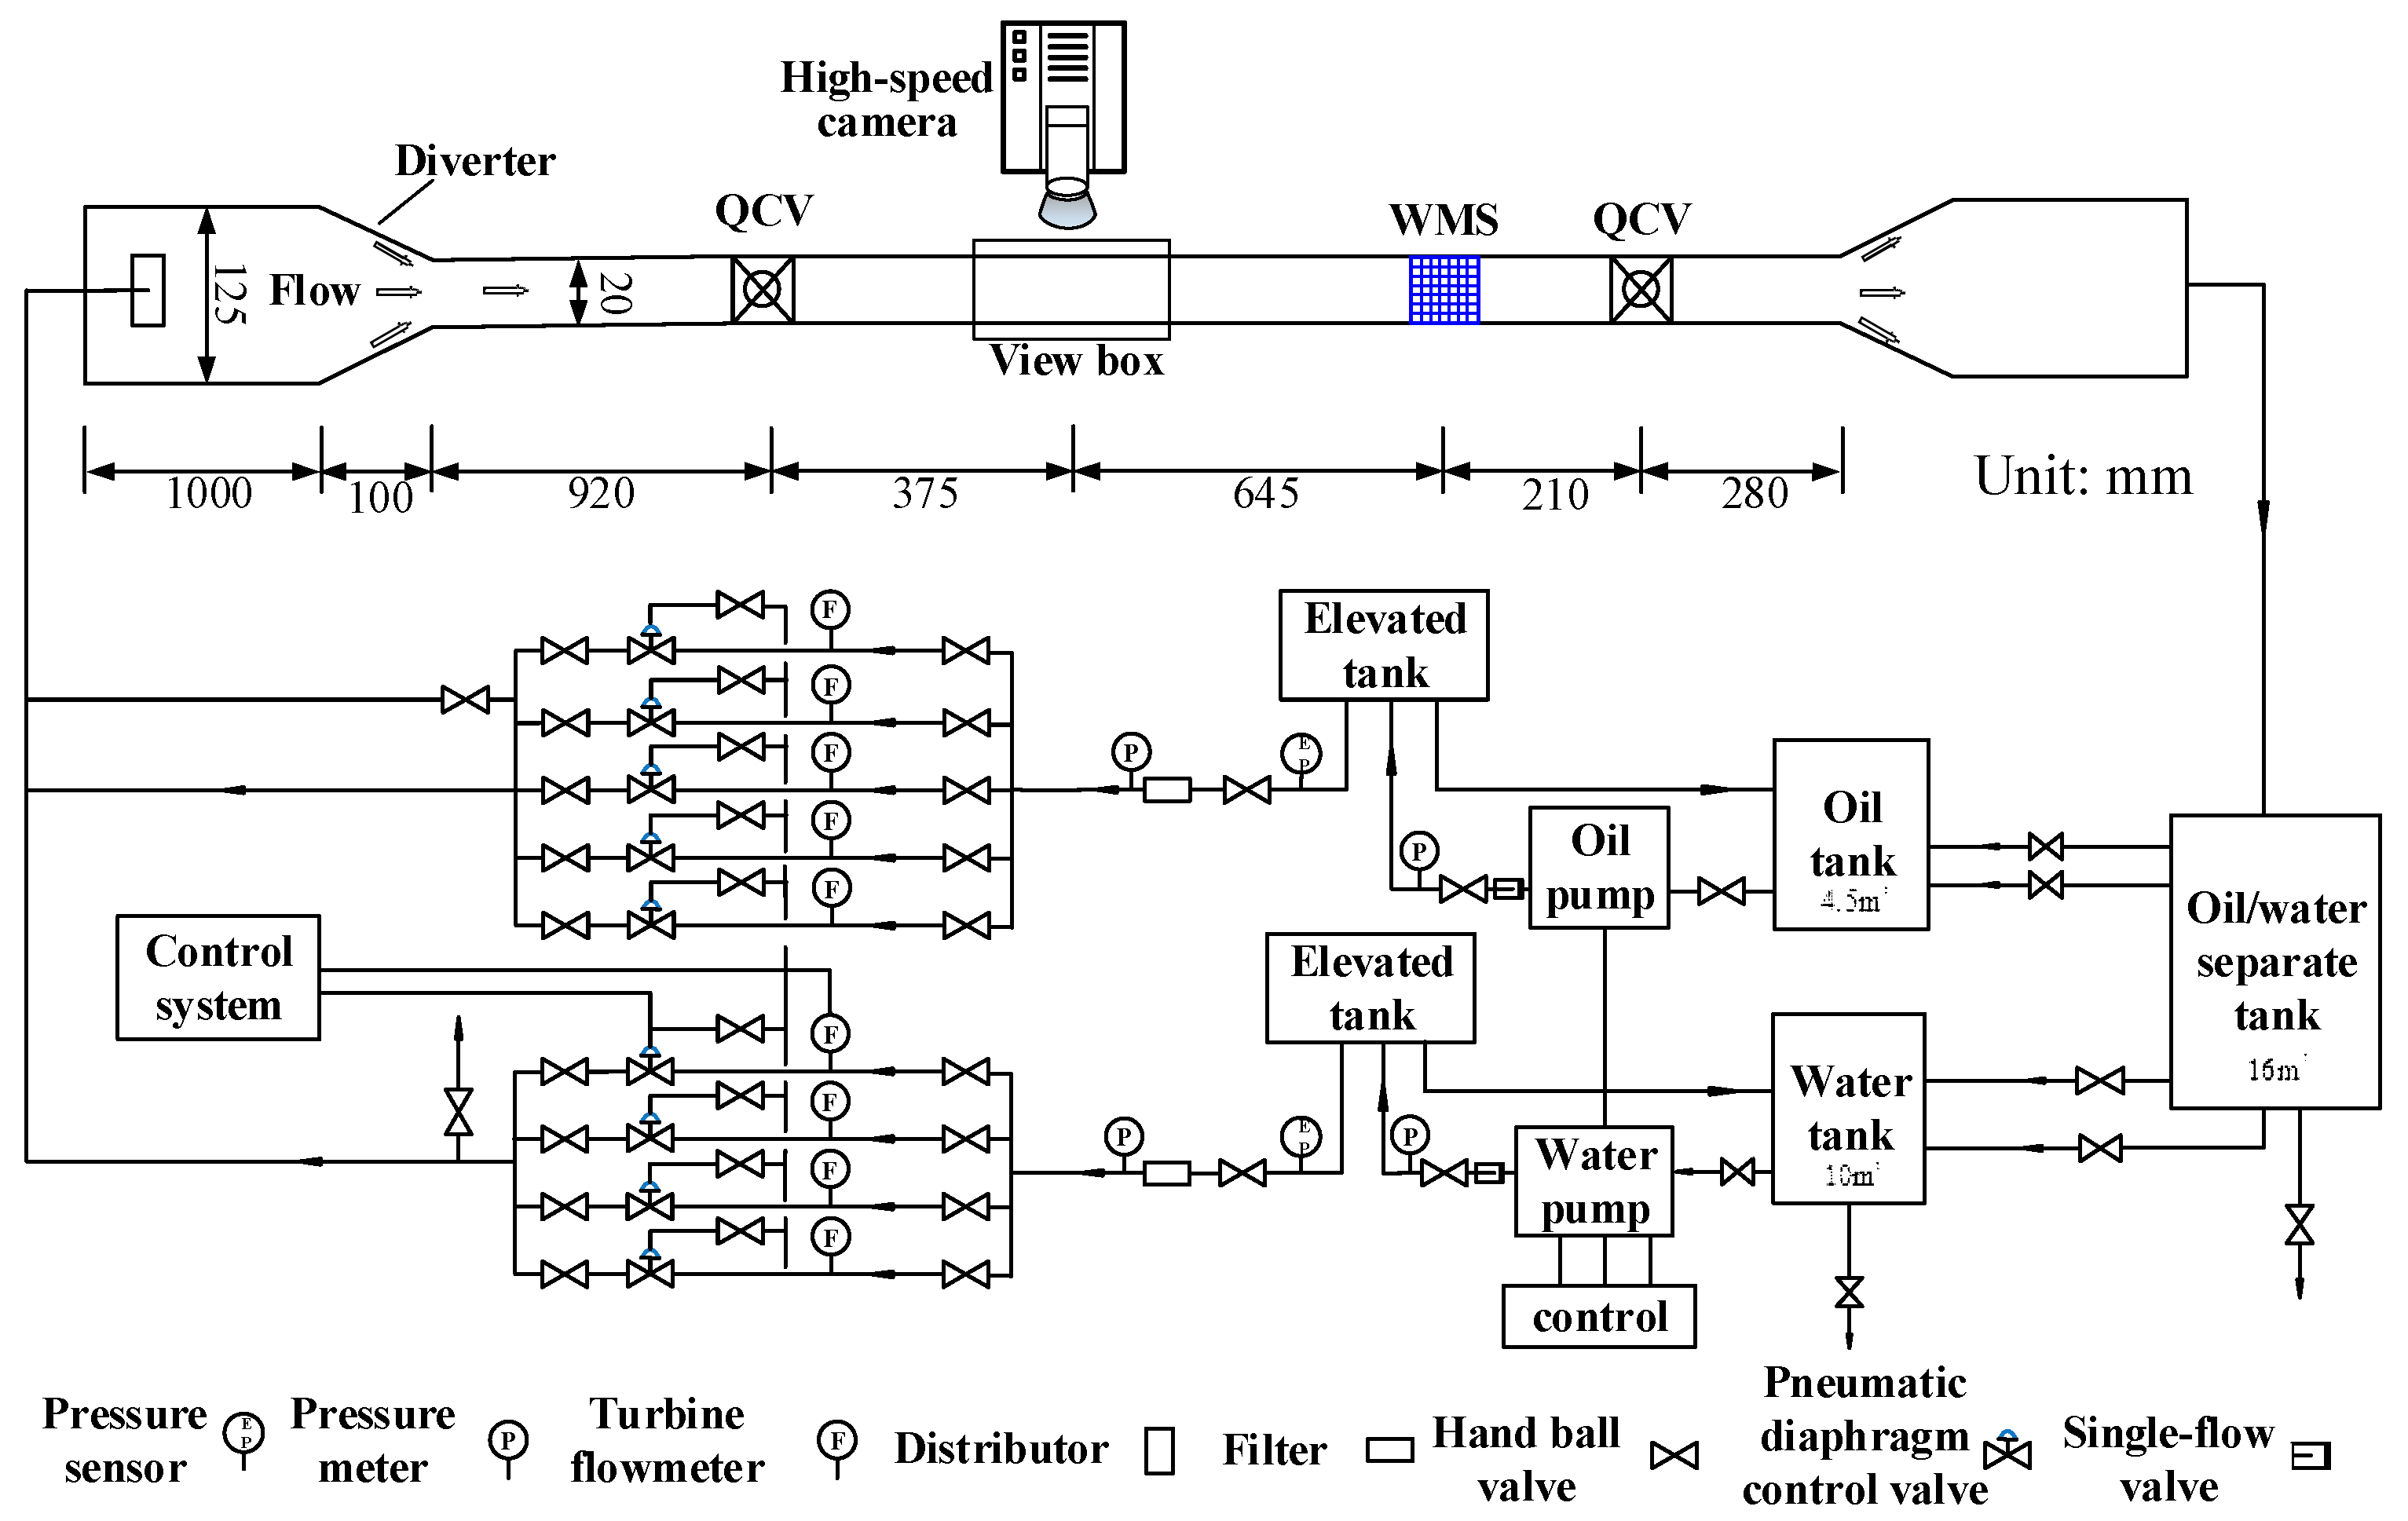
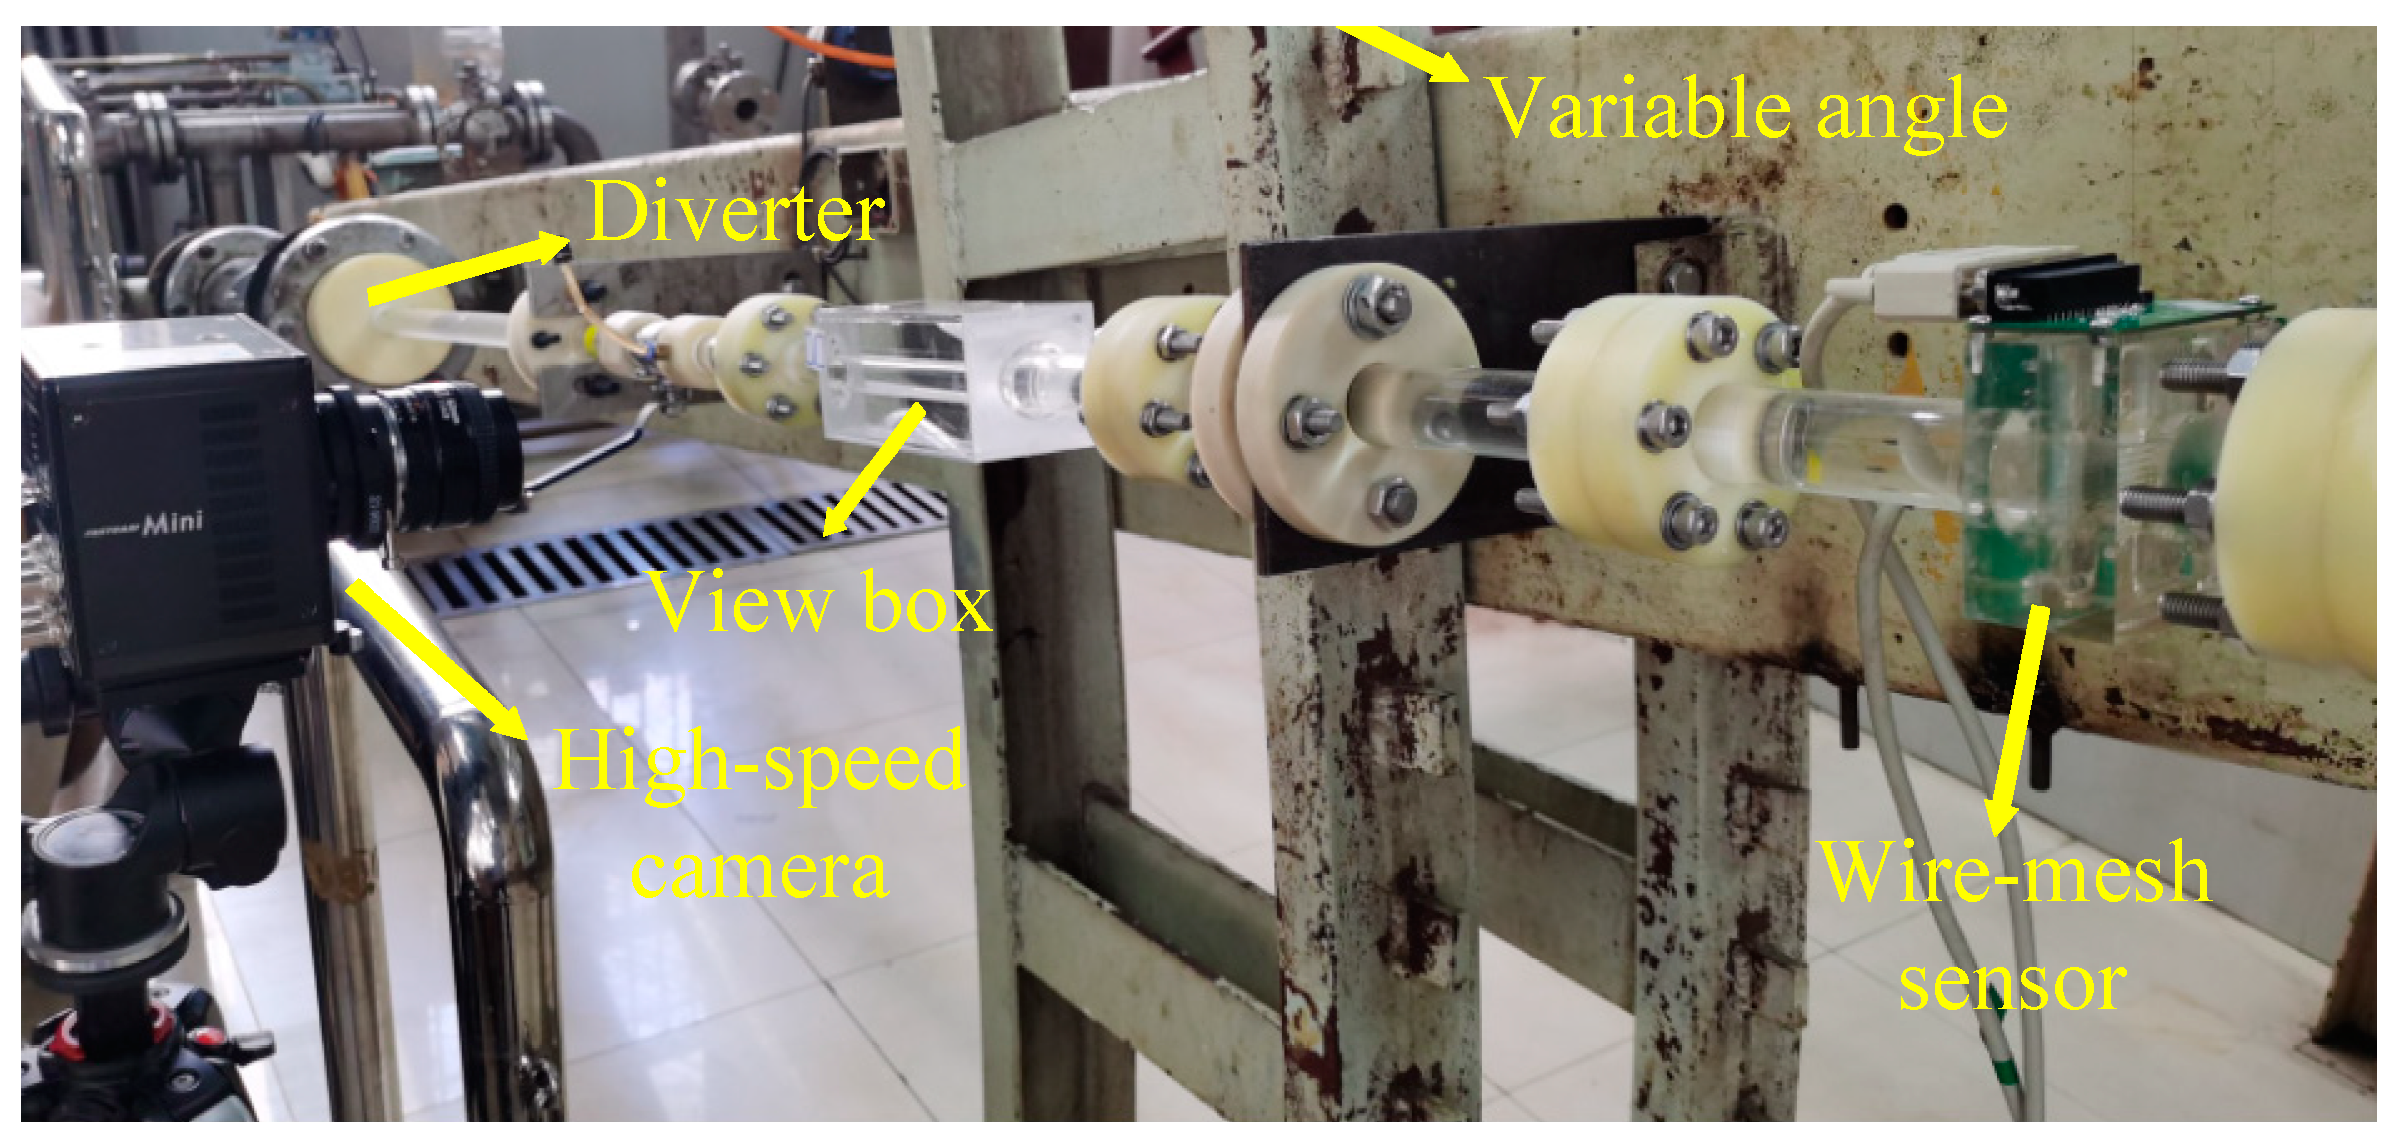
The schematic of the experimental setup for horizontal and inclined oil–water flows is exhibited in Figure 4. The fluids used in the experiment are tap water and #15 industrial white oil. The two phases are pumped from the tanks where they are stored separately and blended through T-shape junction before entering a big pipe (inner diameter 125 mm, length 1200 mm). The mixed flows then enter a small diameter acrylic pipe (inner diameter 20 mm) by a diverter. The length of the experimental section is 2430 mm. A high-speed camera is placed at 1295 mm downstream the entrance of the experimental section. The sensor is installed at 645 mm downstream of the high-speed camera. The experimental section is installed on an adjustable lifting platform. The experimental setup is shown in Figure 5. The test section is installed on an adjustable lifting platform, and the pipe inclinations can be changed from 0 to 90°.
Horizontal and inclined oil–water two-phase flow experiments are carried out, respectively. The inclination angle is set to 0°, +5°, +10° and +15°. The oil phase superficial velocity Uso ranges from 0.106–1.842 m/s, while the water phase superficial velocity Usw ranges from 0.111–1.67 m/s. We adopt that the water flow rate is fixed and the oil flow rate is increased gradually for experiments with different pipe inclinations. A higher total velocity of the two phases can be obtained due to the small diameter of the test section, and thus, various flow patterns can be encountered in the experiment.

2.2.2. Flow Pattern Map

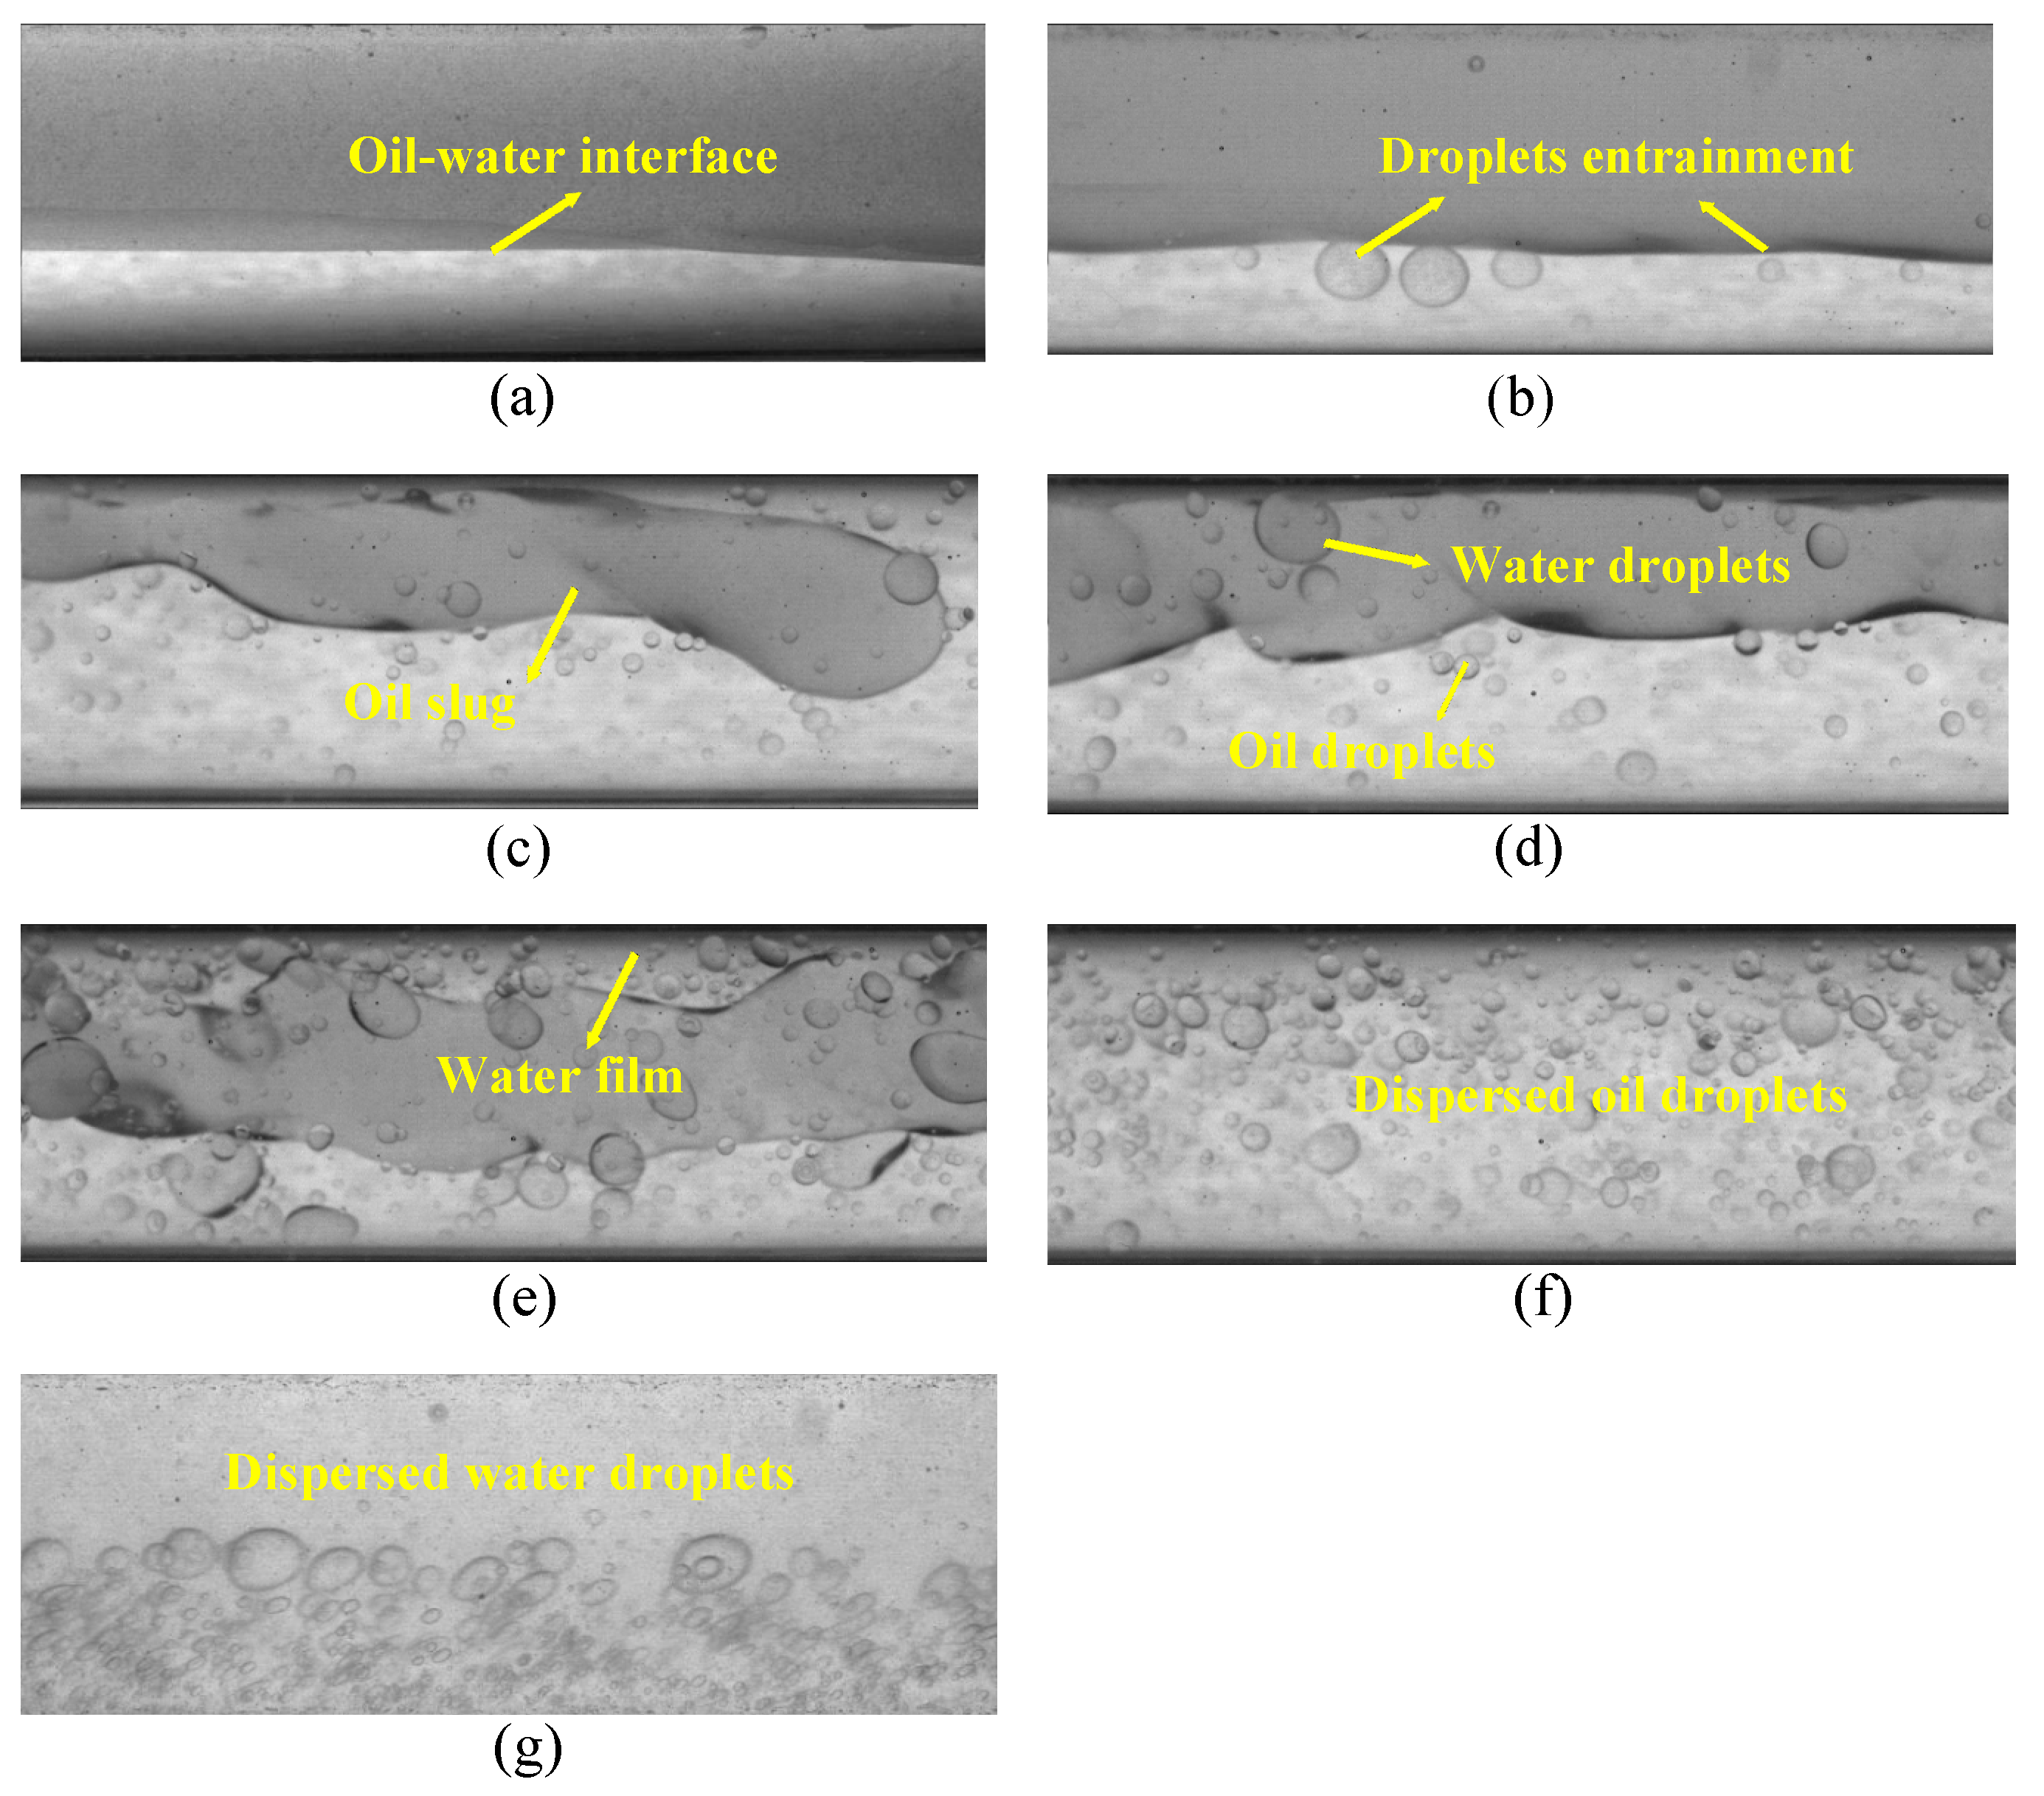
Flow images of oil–water two-phase flows captured by the high-speed camera are shown in Figure 6. Seven flow patterns are observed in the horizontal oil–water flow experiment, i.e., stratified flow (ST), stratified flow with mixing at interface (ST&MI), dispersed oil slug and water flow (D OS&W), dispersion of oil in water flow (D O/W), dispersion of water in oil flow (D W/O), dispersion of water in oil and dispersion of oil in water flow (D W/O&D O/W), dispersion of water in oil and dispersion of oil in water flow with water film (D W/O&D O/W WF). The ST flow has two separate layers and is characterized by a smooth interface, as shown in Figure 6a. As for ST&MI, the oil–water interface fluctuates, and small droplets gradually detach from the stratified interface (see Figure 6b). For D OS&W, as shown in Figure 6c, the oil phase is not completely broken by the water phase and is distributed in the upper part of the pipeline in the form of oil slugs or larger oil droplets. D W/O&D O/W is composed of double continuous phases while water and oil droplets exist in the other phase (see Figure 6d). The structures of D W/O&D O/W WF and D W/O&D O/W indicate some similarity (see Figure 6e). A water film occurs at the top area of the pipe and wraps the continuous oil phase in D W/O&D O/W WF. In D O/W, as shown in Figure 6f, the oil phase is broken by the water phase and distributed in the form of small oil droplets in the continuous water phase. For D W/O, as shown in Figure 6g, the oil phase is continuous and the water phase exists in the form of droplets in the continuous oil phase.
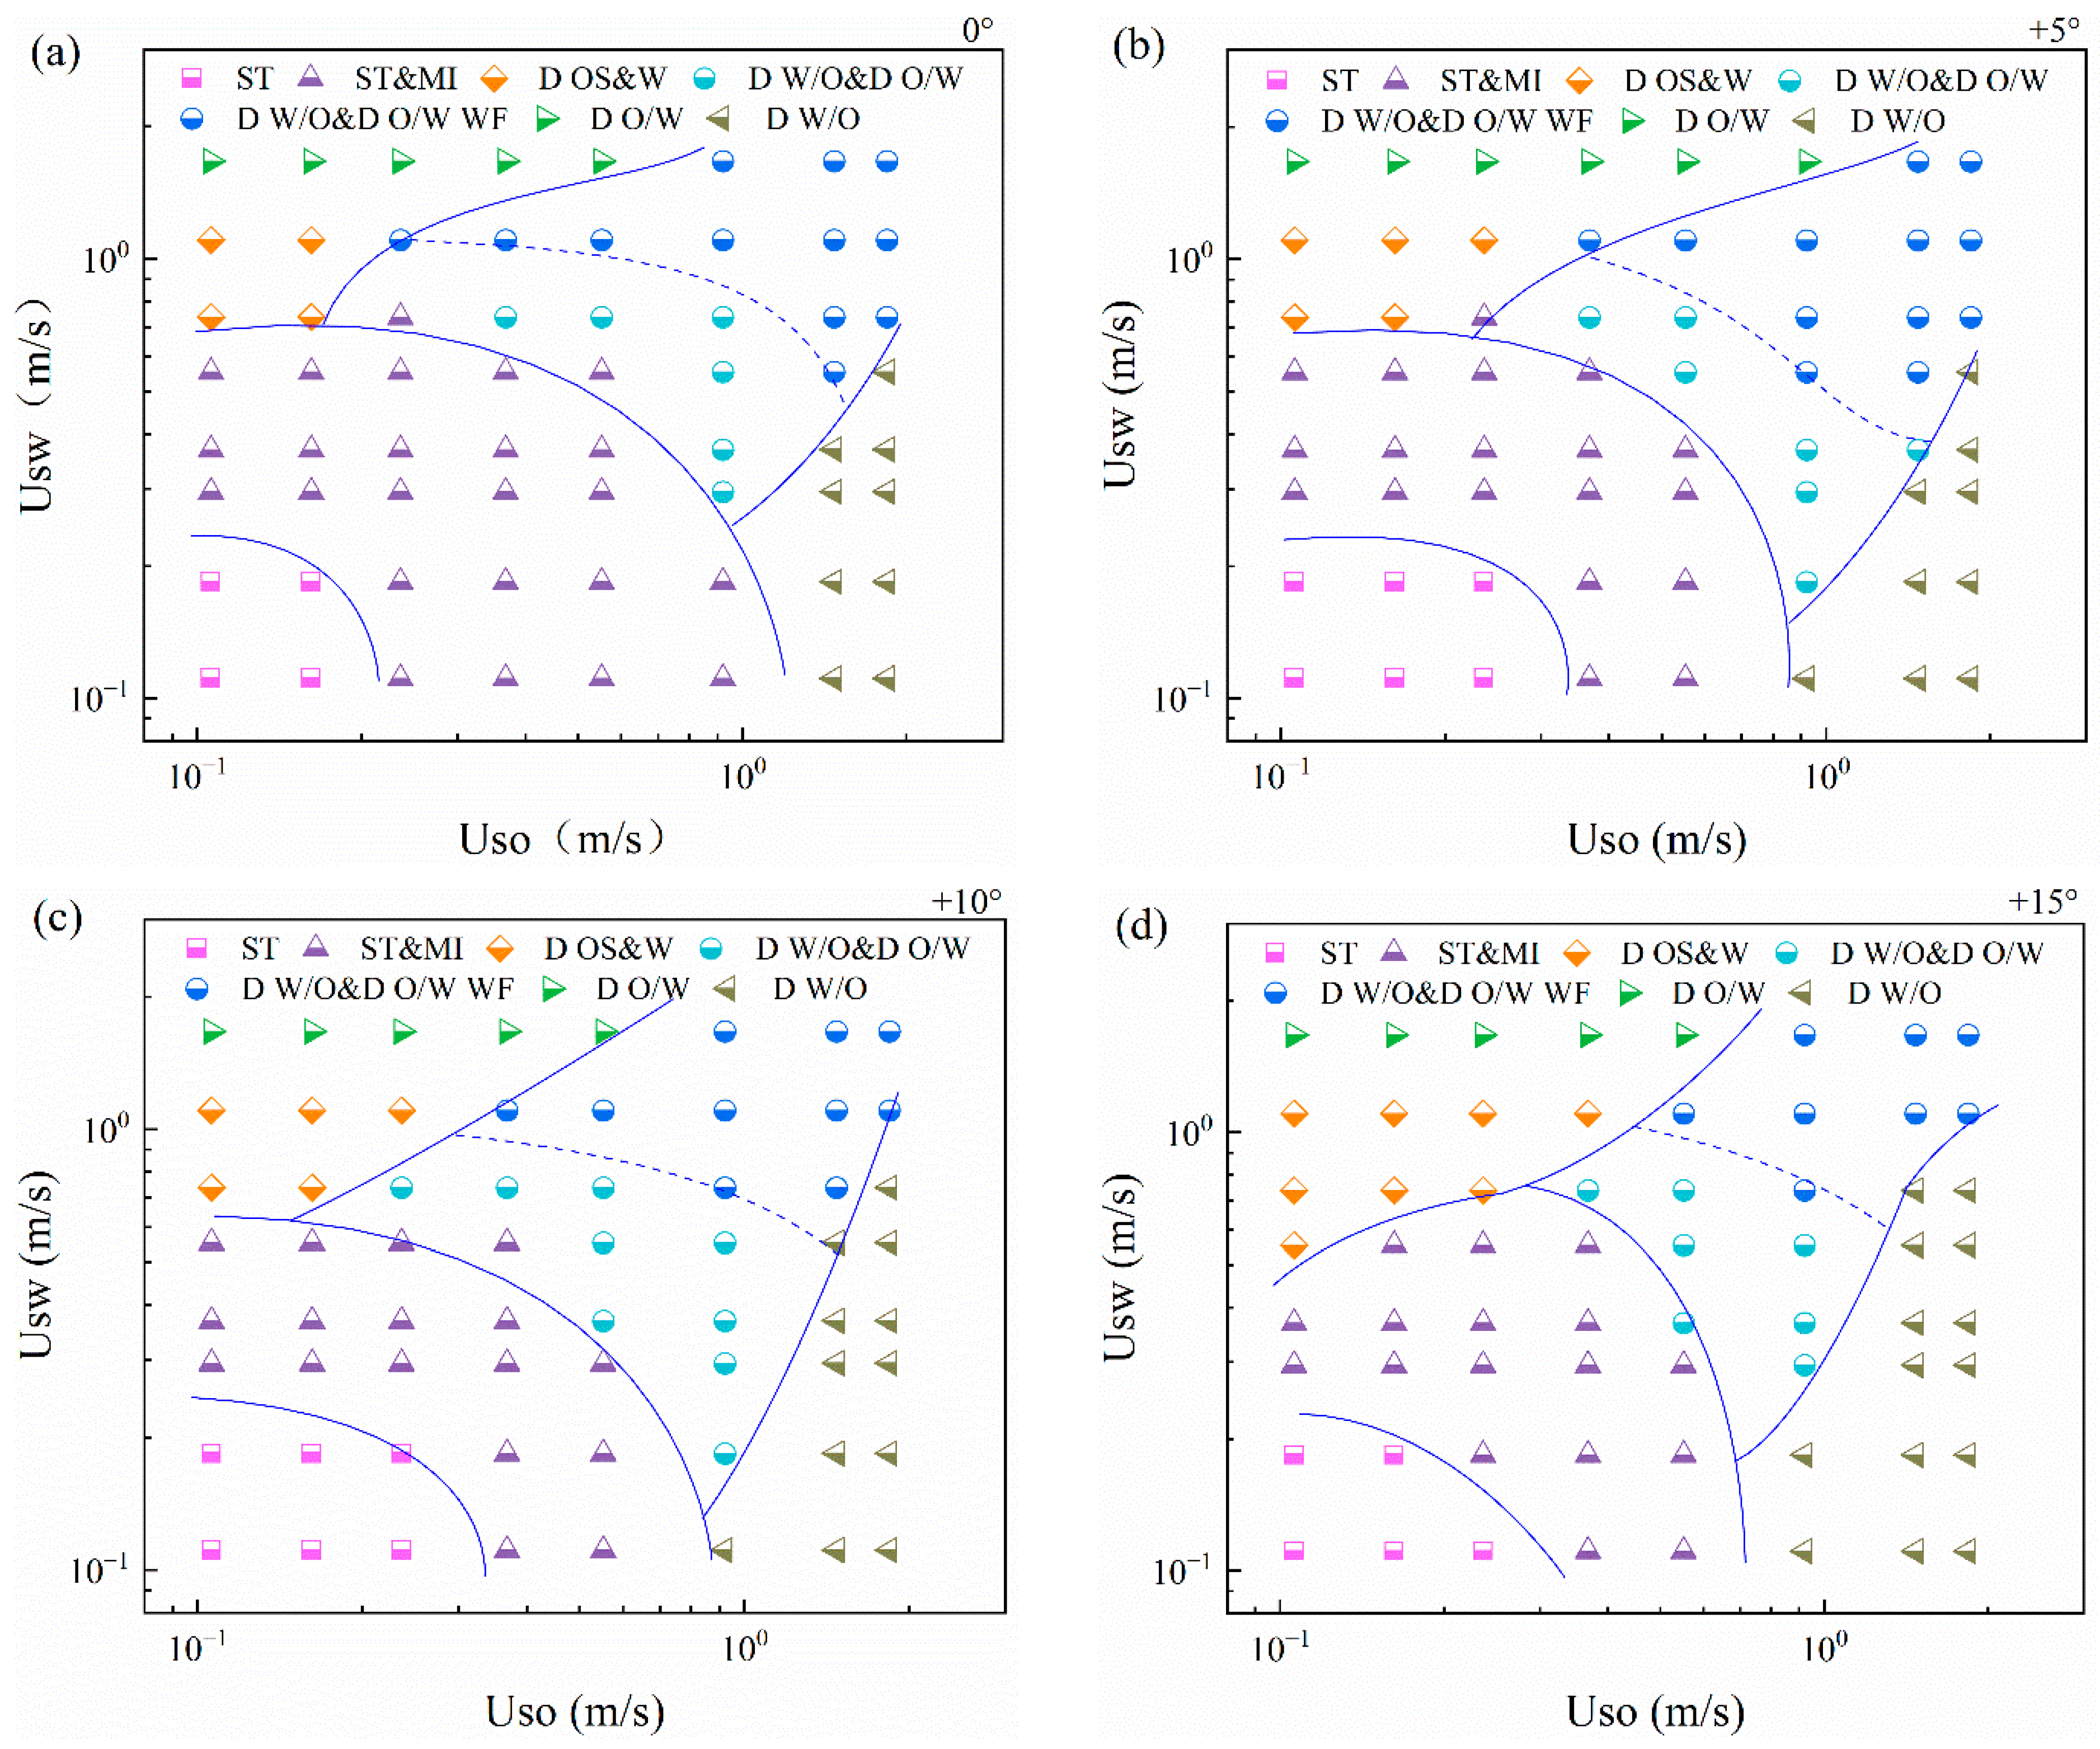
Flow pattern maps of horizontal and inclined oil–water flows are shown in Figure 6. For horizontal oil–water flows, as shown in Figure 7a, ST and ST&MI flow dominate when Usw and Uso are both low. With the increase in the total flow rate, the fluctuation of the interface becomes more and more obvious, and the flow pattern transforms to D W/O&D O/W and D W/O&D O/W WF flow. For a constant water flow rate, the flow pattern gradually transforms to D W/O flow as the oil superficial velocity is increased. Conversely, with the increase in the water flow rate, the flow pattern gradually evolves to D O/W flow. For inclined oil–water flows, as shown in Figure 7b–d, the transition boundary between ST and ST&MI moves to the right side as the pipe inclination increases. In addition, the region occupied by the D W/O flow presents a tendency for expansion in the flow pattern map. The transition boundary between D OS&W and D W/O&D O/W WF moves to the right side, indicating that the oil slugs move faster in inclined pipes and are more difficult to coalesce into the continuous oil phase, due to the slippage effect between phases.

2.3. Processing of Data

2.3.1. Wire-Mesh Sensor Responses

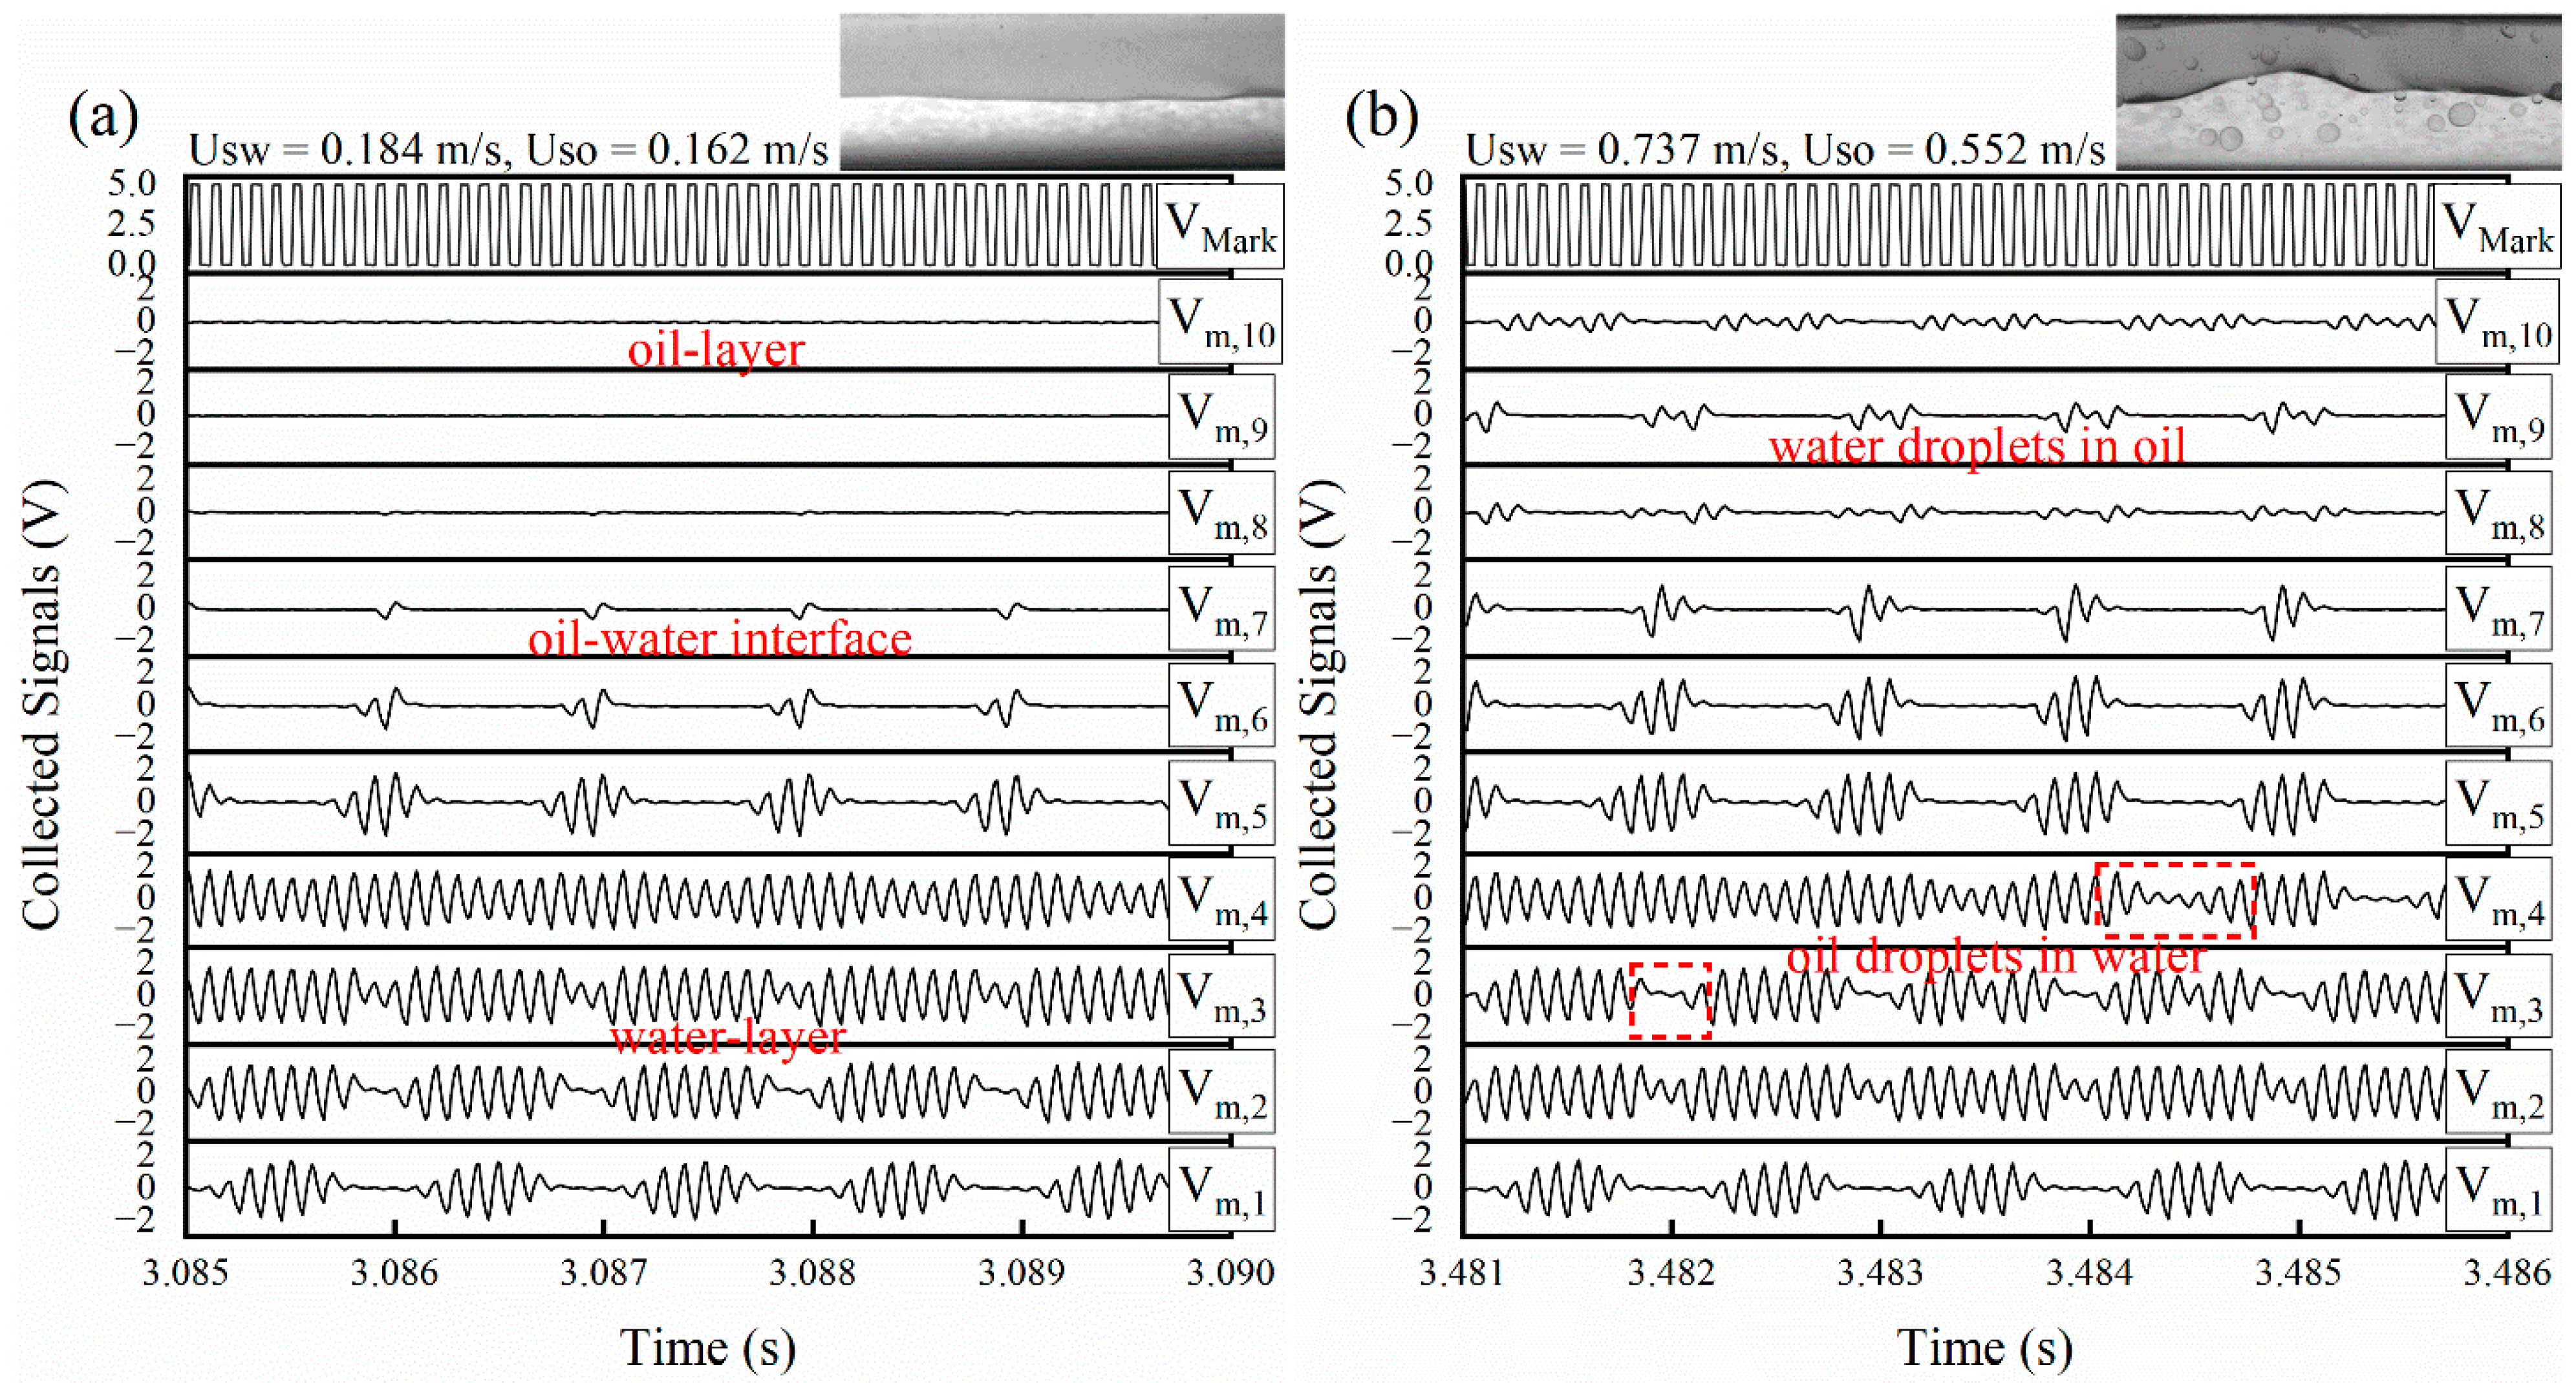
Figure 8 shows the sensor response signals under typical flow conditions of horizontal oil–water flows. In ST flow, as shown in Figure 7a, the amplitudes of Vm,8 to Vm,10 are nearly 0 V, which corresponds to the oil phase around the receiver R8 to R10. In contrast, Vm,1 to Vm,3 indicates high levels, which corresponds to the water layer. Note that although receivers R1 and R2 are completely in the water phase, Vm,1 and Vm,2 still have low-level signals. This is because some crossing points formed between receiver R1, R2 and transmitters are outside the fluids. For D W/O&D O/W flow, as shown in Figure 8b, Vm,8 to Vm,10 indicate that amplitude fluctuates due to the presence of the water droplets in the continuous oil phase. Note that Vm,3 to Vm,4 are high-level signals with transient decrease, indicating the ability of the sensor in detecting the oil droplets.

2.3.2. 3D Flow Visualization

The sensor response signal Vm,1 to Vm,10 is preprocessed by following the steps shown in Figure 9. First, the mark signal VMark is read, and its rising edge information is derived. In one frame data, the ith rising edge of VMark indicates that the excitation signal is applied to the ith transmitter. Afterwards, for kth frame data, the extreme deviation, Vm (i, j, k), of the jth receiver signal Vm,j (k) is figured out when the ith transmitter is excited (i, j = 1, 2, …, 10; k = 1, 2, …, N). Finally, normalized Vm (i, j, k) is normalized as:
V N ( i , j , k ) = V m ( i , j , k ) V o ( i , j ) V w ( i , j ) V o ( i , j )
where Vw (i, j) and Vo (i, j) are the calibration data when the pipe is full of water and oil separately. VN (i, j, k) has an approximately linear relation with the local water volume fraction and thus can be used to visualize the flow structures.
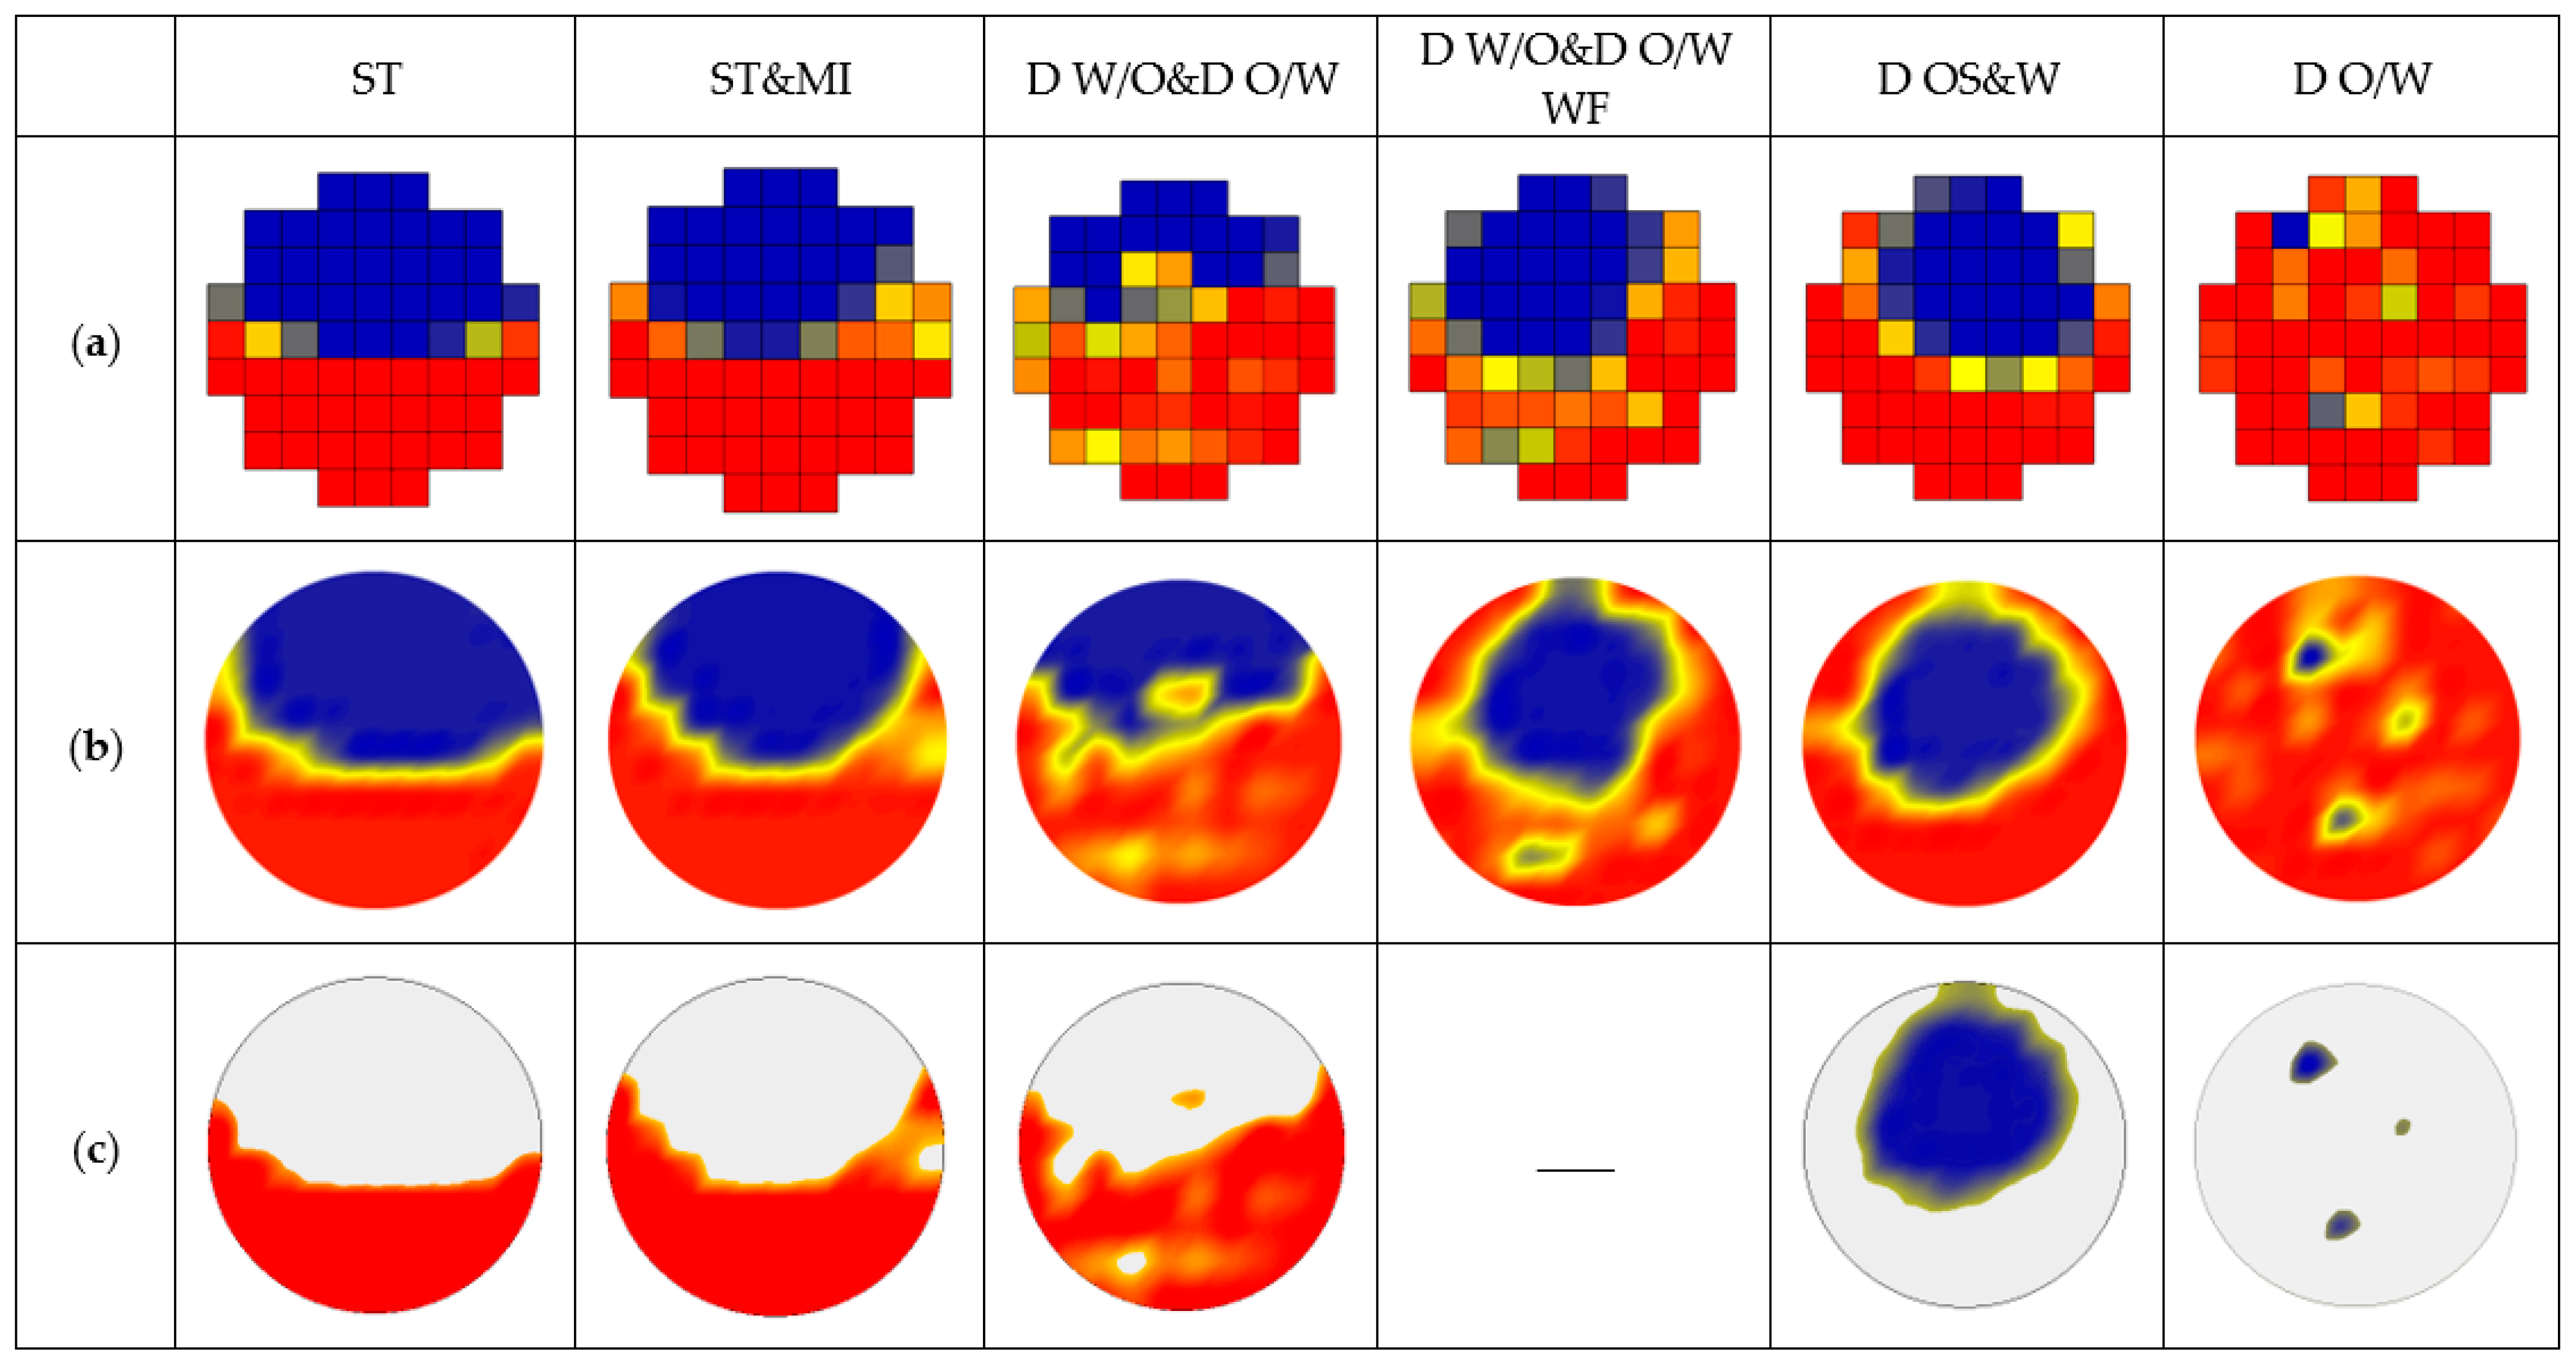
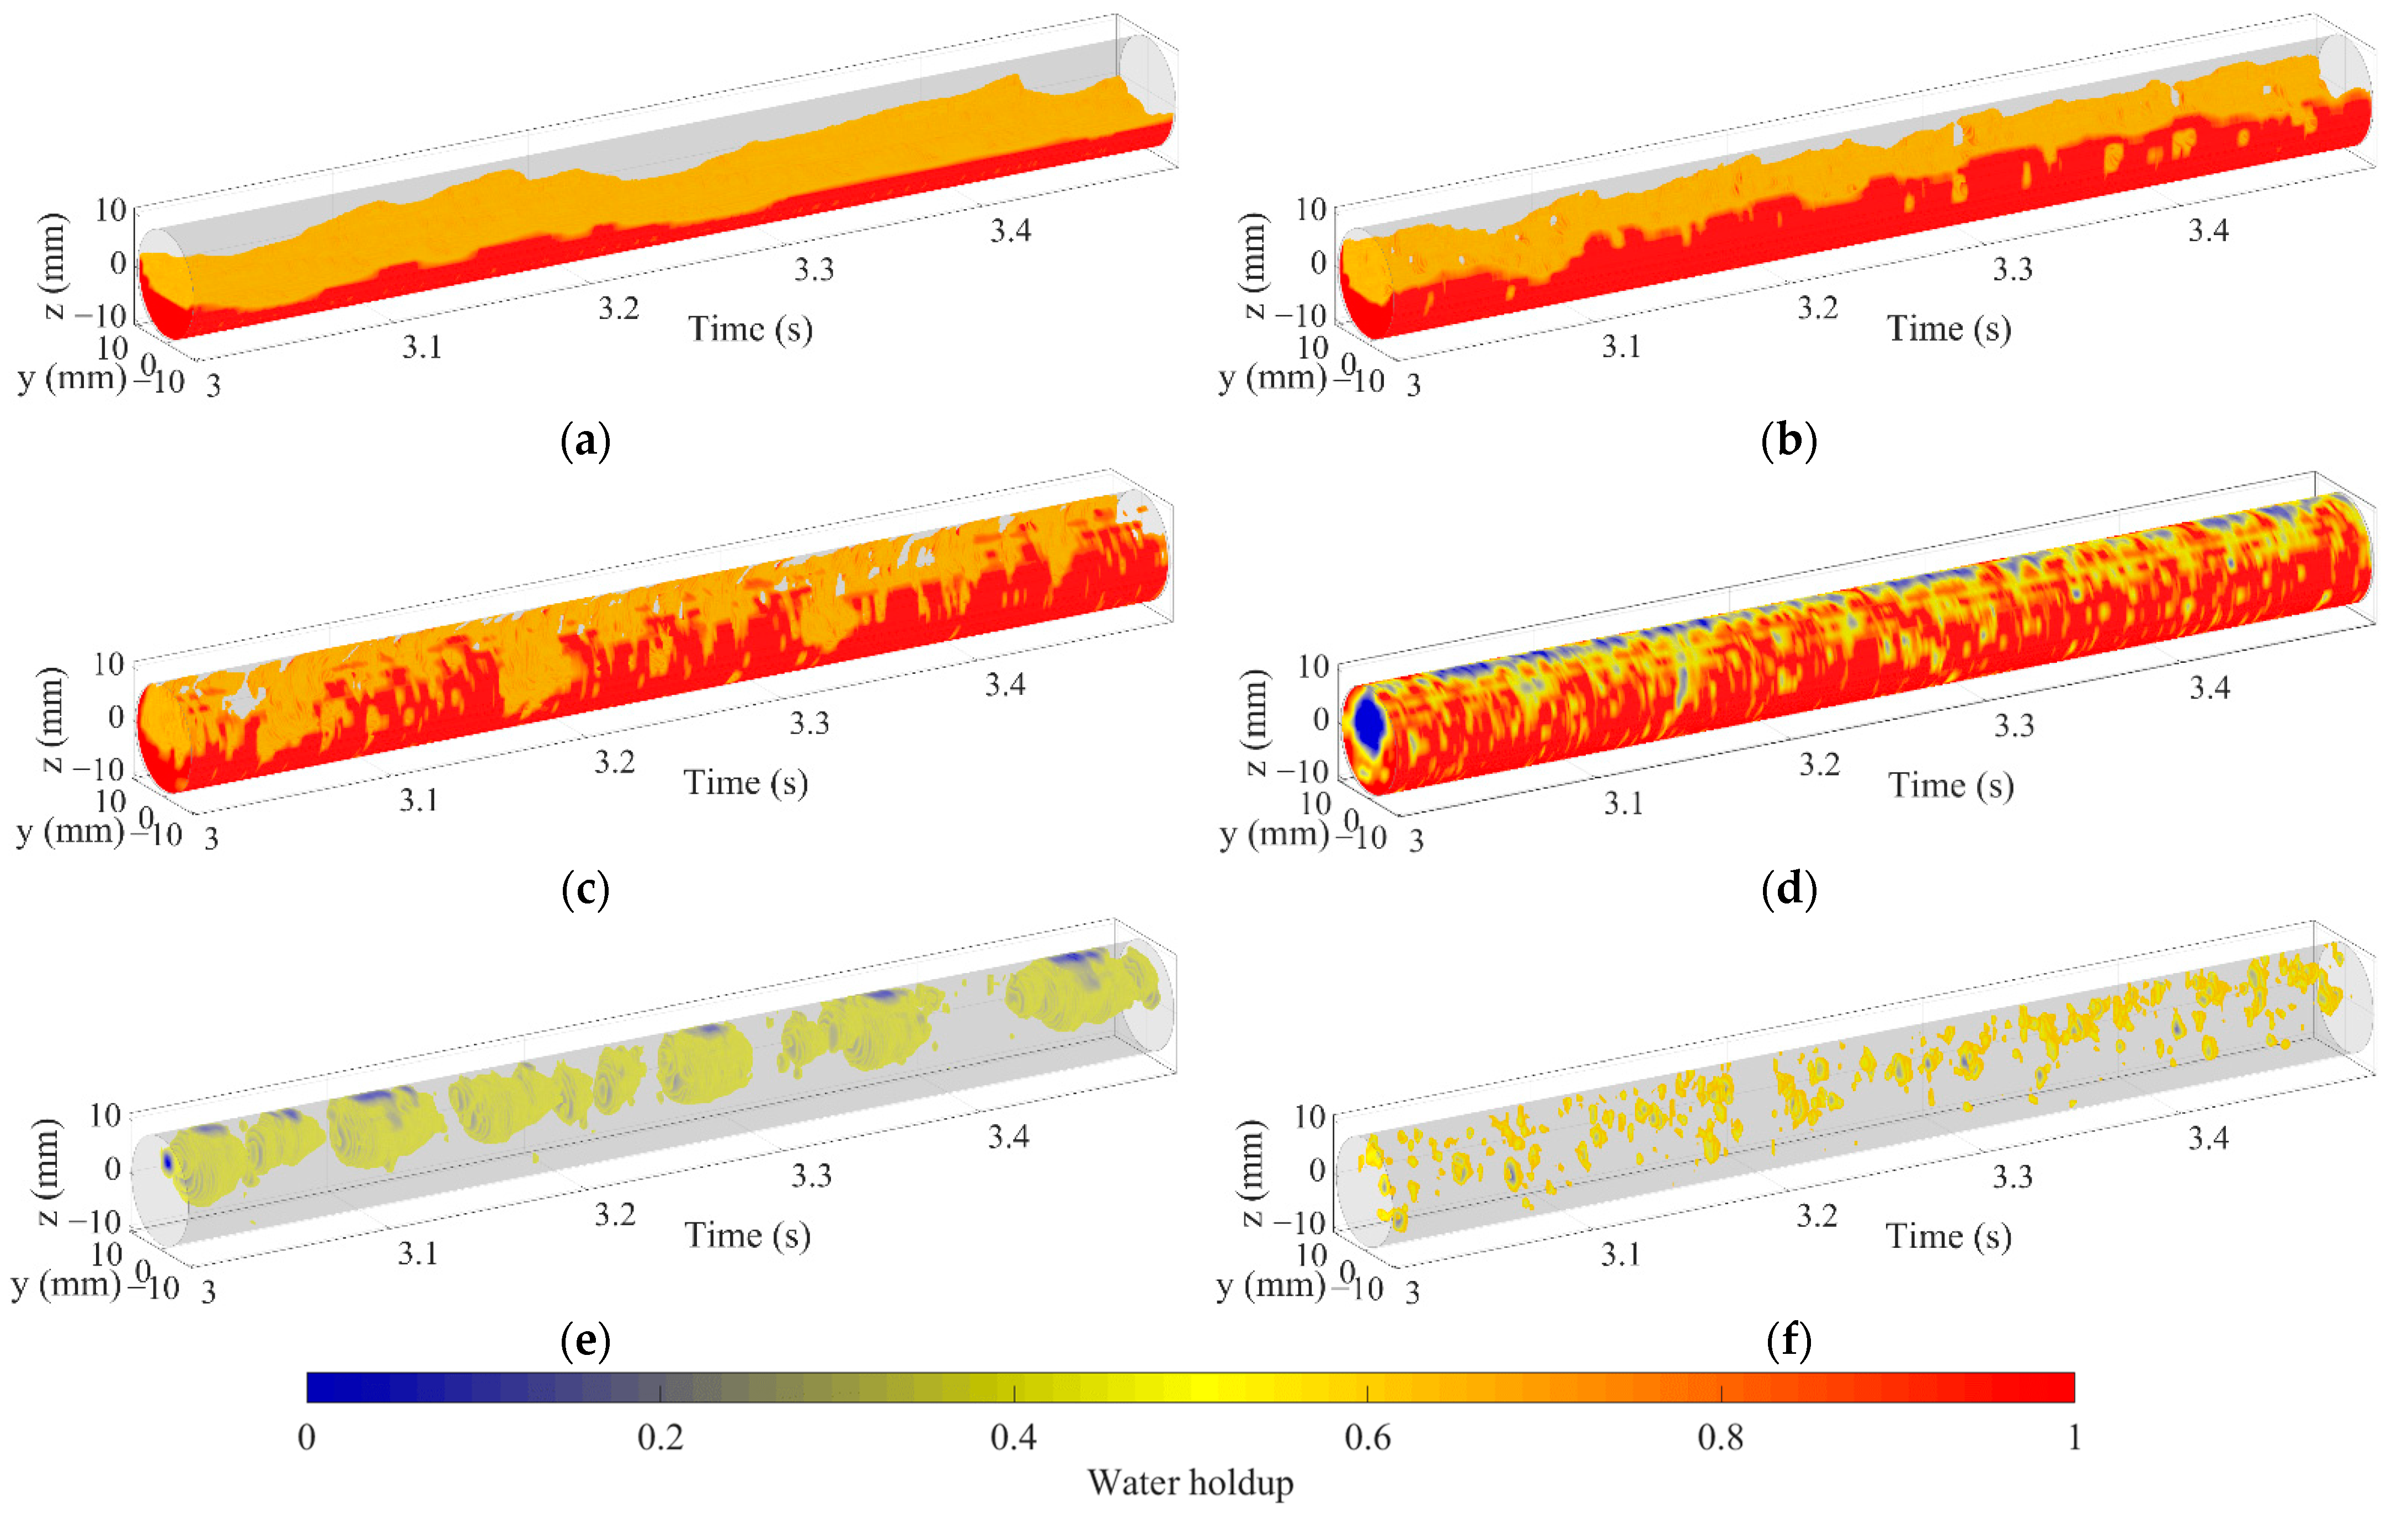
Figure 10 shows the flow chart of 3D flow visualization. Normalized matrix VN (k) is corresponding to the local water volume fraction of the kth frame data, as shown in Figure 11a. Firstly, cubic spline interpolation is conducted for VN (k) to obtain the interpolation matrix Vip (k), which can be used to visualize the 2D phase distribution, as shown in Figure 11b. Then, dual thresholds, εw and εo, are introduced to remove or retain the selected phase distribution. For ST, ST&MI and D W/O&D O/W flow, the value of each point in the interpolation matrix Vip (k) is compared with εw. If Vip (k) is less than εw, Vip (k) is set to a null value so that only the water layer and the oil droplets entrained in the continuous water phase can be displayed. For D OS&W and D O/W flow, the values of each point in Vip (k) are compared with εo. If Vip (k) is higher than εo, Vip (k) is set to a null value, and thus, only the distribution of oil slug and oil droplets are retained. As for D W/O&D O/W WF flow, all the phases are retained in the 2D flow visualization without threshold processing. After the threshold processing, the interpolation matrix Vip (k) is converted to Vε (k), which is used to visualize the selected phase distribution, as shown in Figure 11c. In this paper, εw and εo are selected as 0.7 and 0.3, respectively.
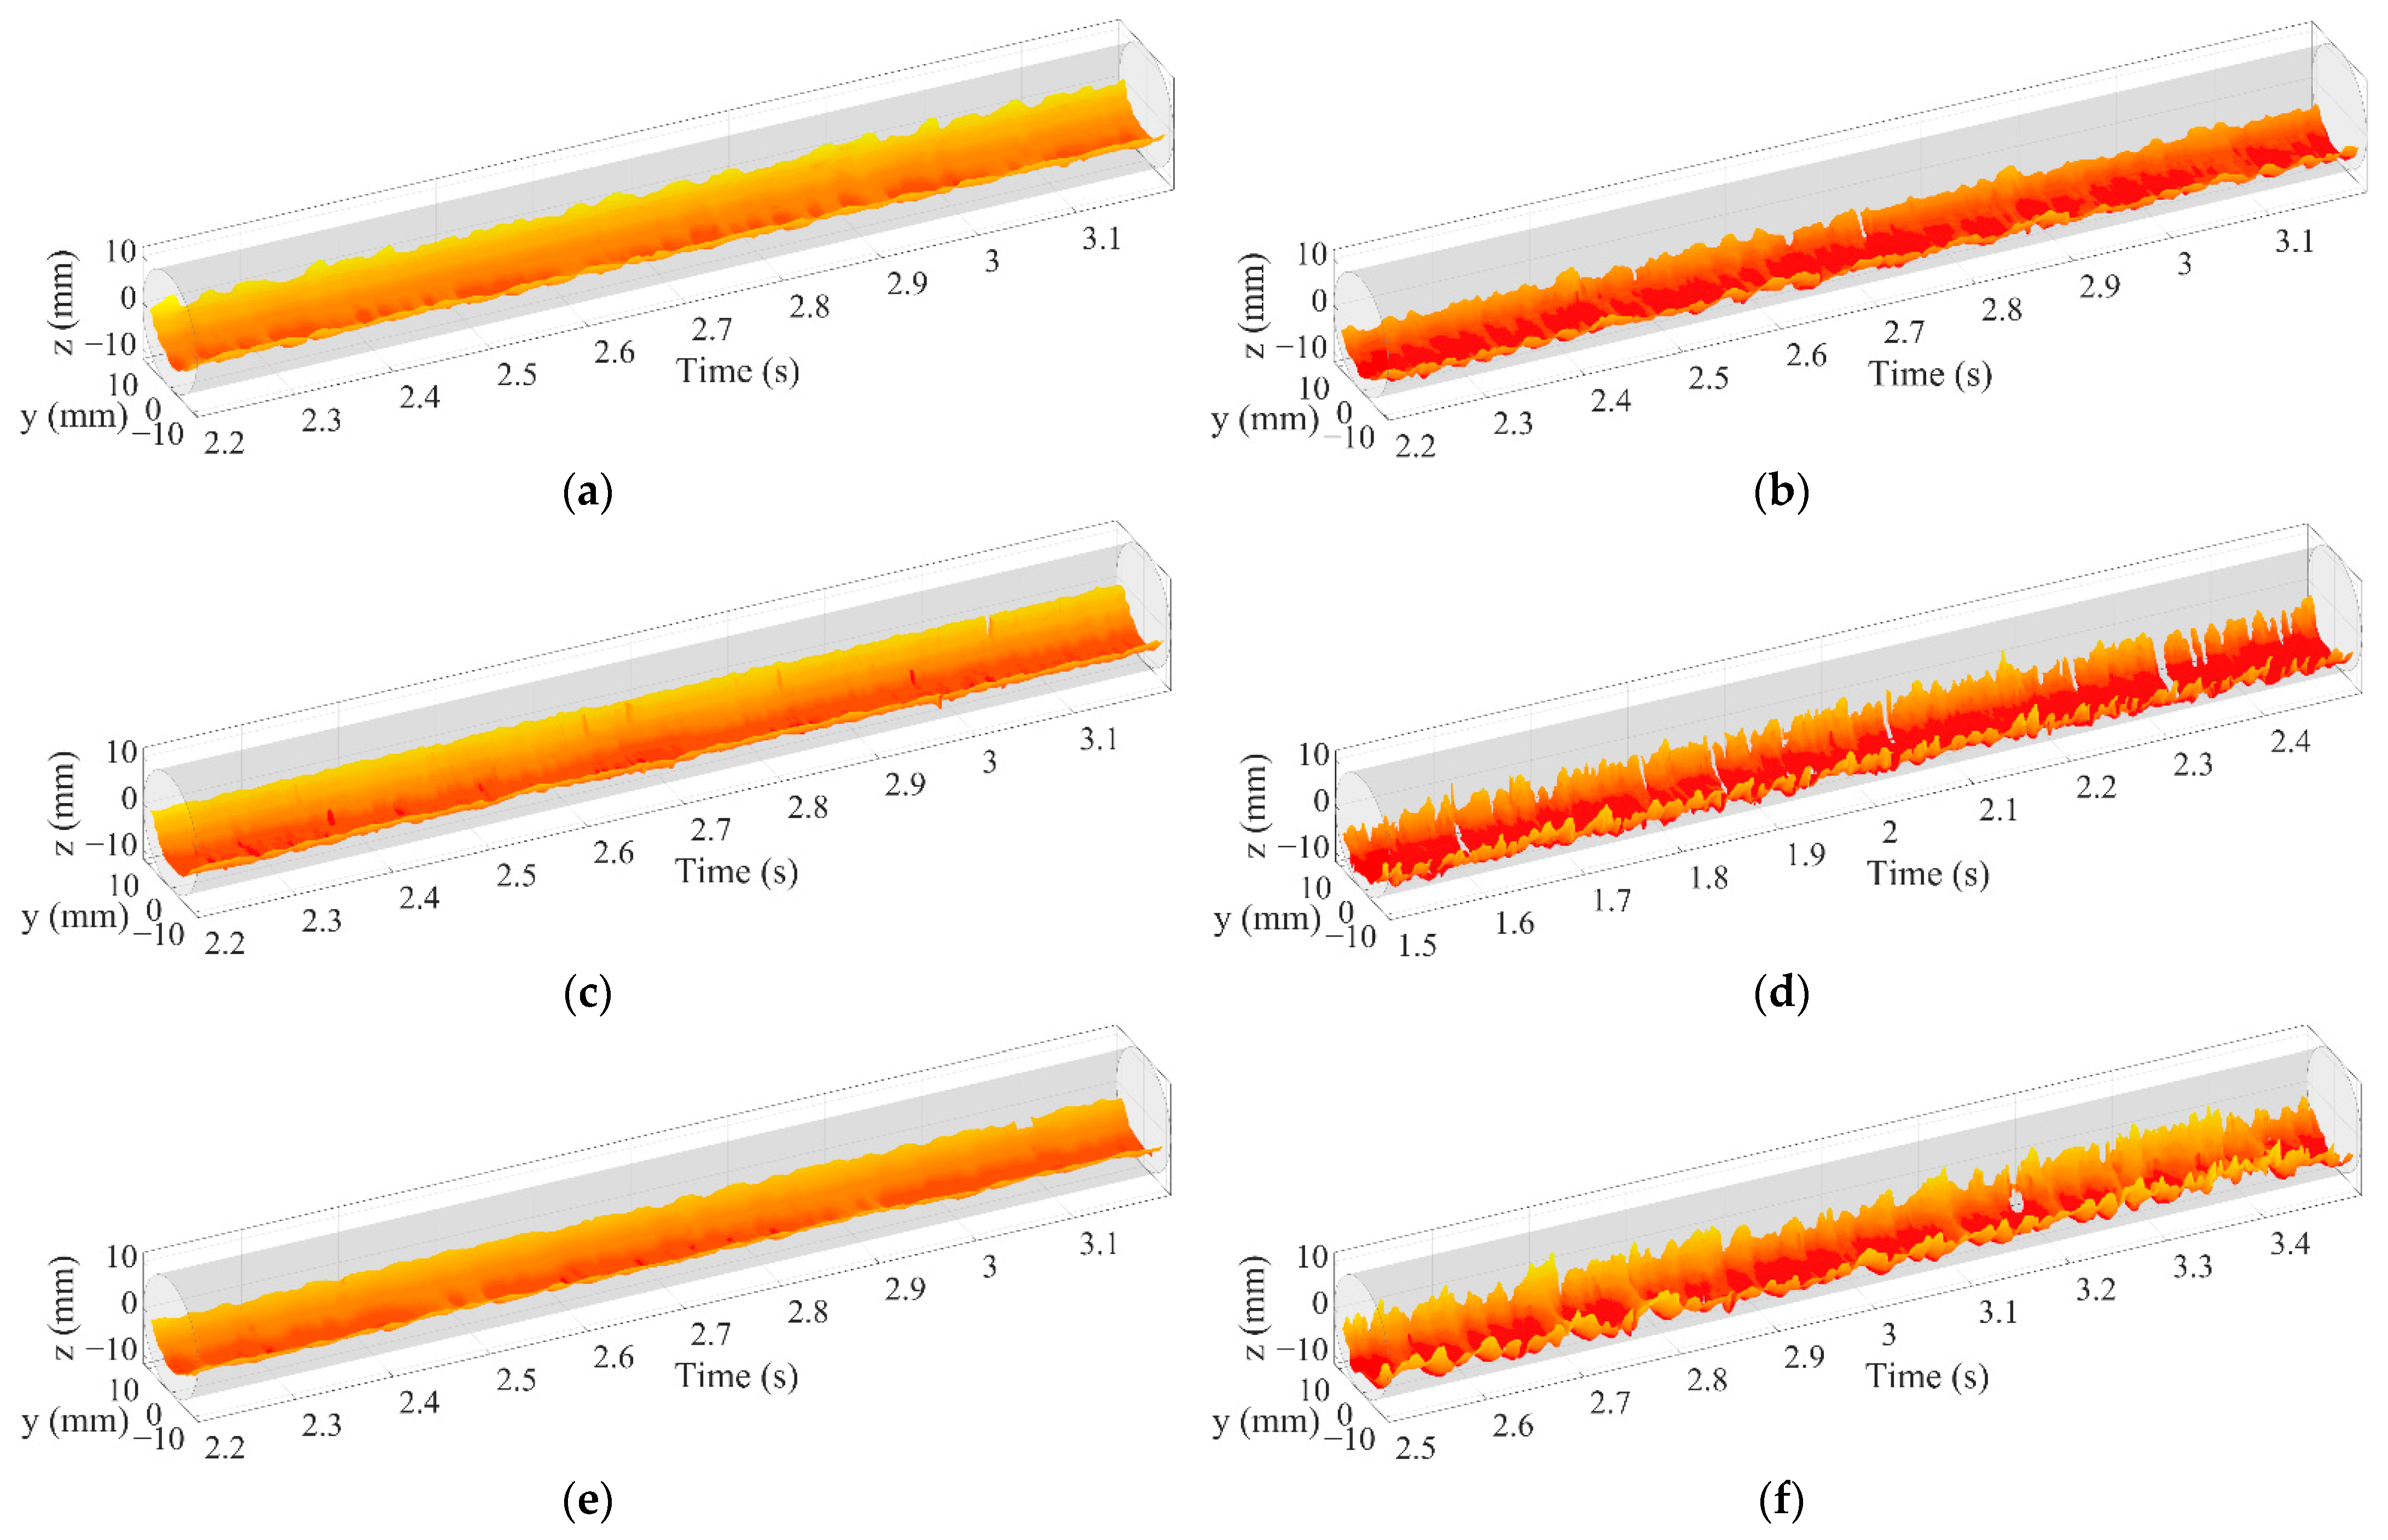
The 3D flow visualization can be obtained by arranging matrix Vε (k) along the time axis and smooth transition between frames using cubic spline interpolation. Figure 12 shows the 3D flow visualization for different oil–water flow patterns. For ST and ST&MI flow, as shown in Figure 12a,b, the 3D flow visualization can indicate that the interface varies in configuration, and the oil droplets detach from the interface. When the flow pattern changes to D W/O&D O/W flow, the interaction between oil and water phases becomes more complex, leading to extremely nonuniform phase distribution. In this case, as shown in Figure 12c, the 3D flow visualization fails to indicate the structures of the interface, which is probably caused by the interaction between the interface and the entrained droplets. In the D W/O&D O/W WF flow, the interface indicates an obvious curve shape, and the intermittent water film can be seen at the upper part of the pipe, as shown in Figure 12d. As for the D OS&W shown in Figure 12e, the oil phase mainly exists in the form of a slug, and dispersed oil droplets can occasionally be observed in the continuous water phase. For D O/W flow, as shown in Figure 12f, the 3D flow visualization shows a large number of dispersed oil droplets, indicating that the sensor has a good resolution for small-scale oil droplets.

2.4. Reconstruction of Interface Structures

The characteristics of the oil–water stratified interface are of great significance for investigating the heat and mass transfer between phases and uncovering the mechanism of flow pattern transition. This paper focuses on the measurement of oil–water interface characteristics. The sensor is used to detect the configuration, the height and the length of the oil–water interface and explore the influence of oil–water flow conditions and pipe inclinations on the interface characteristics.
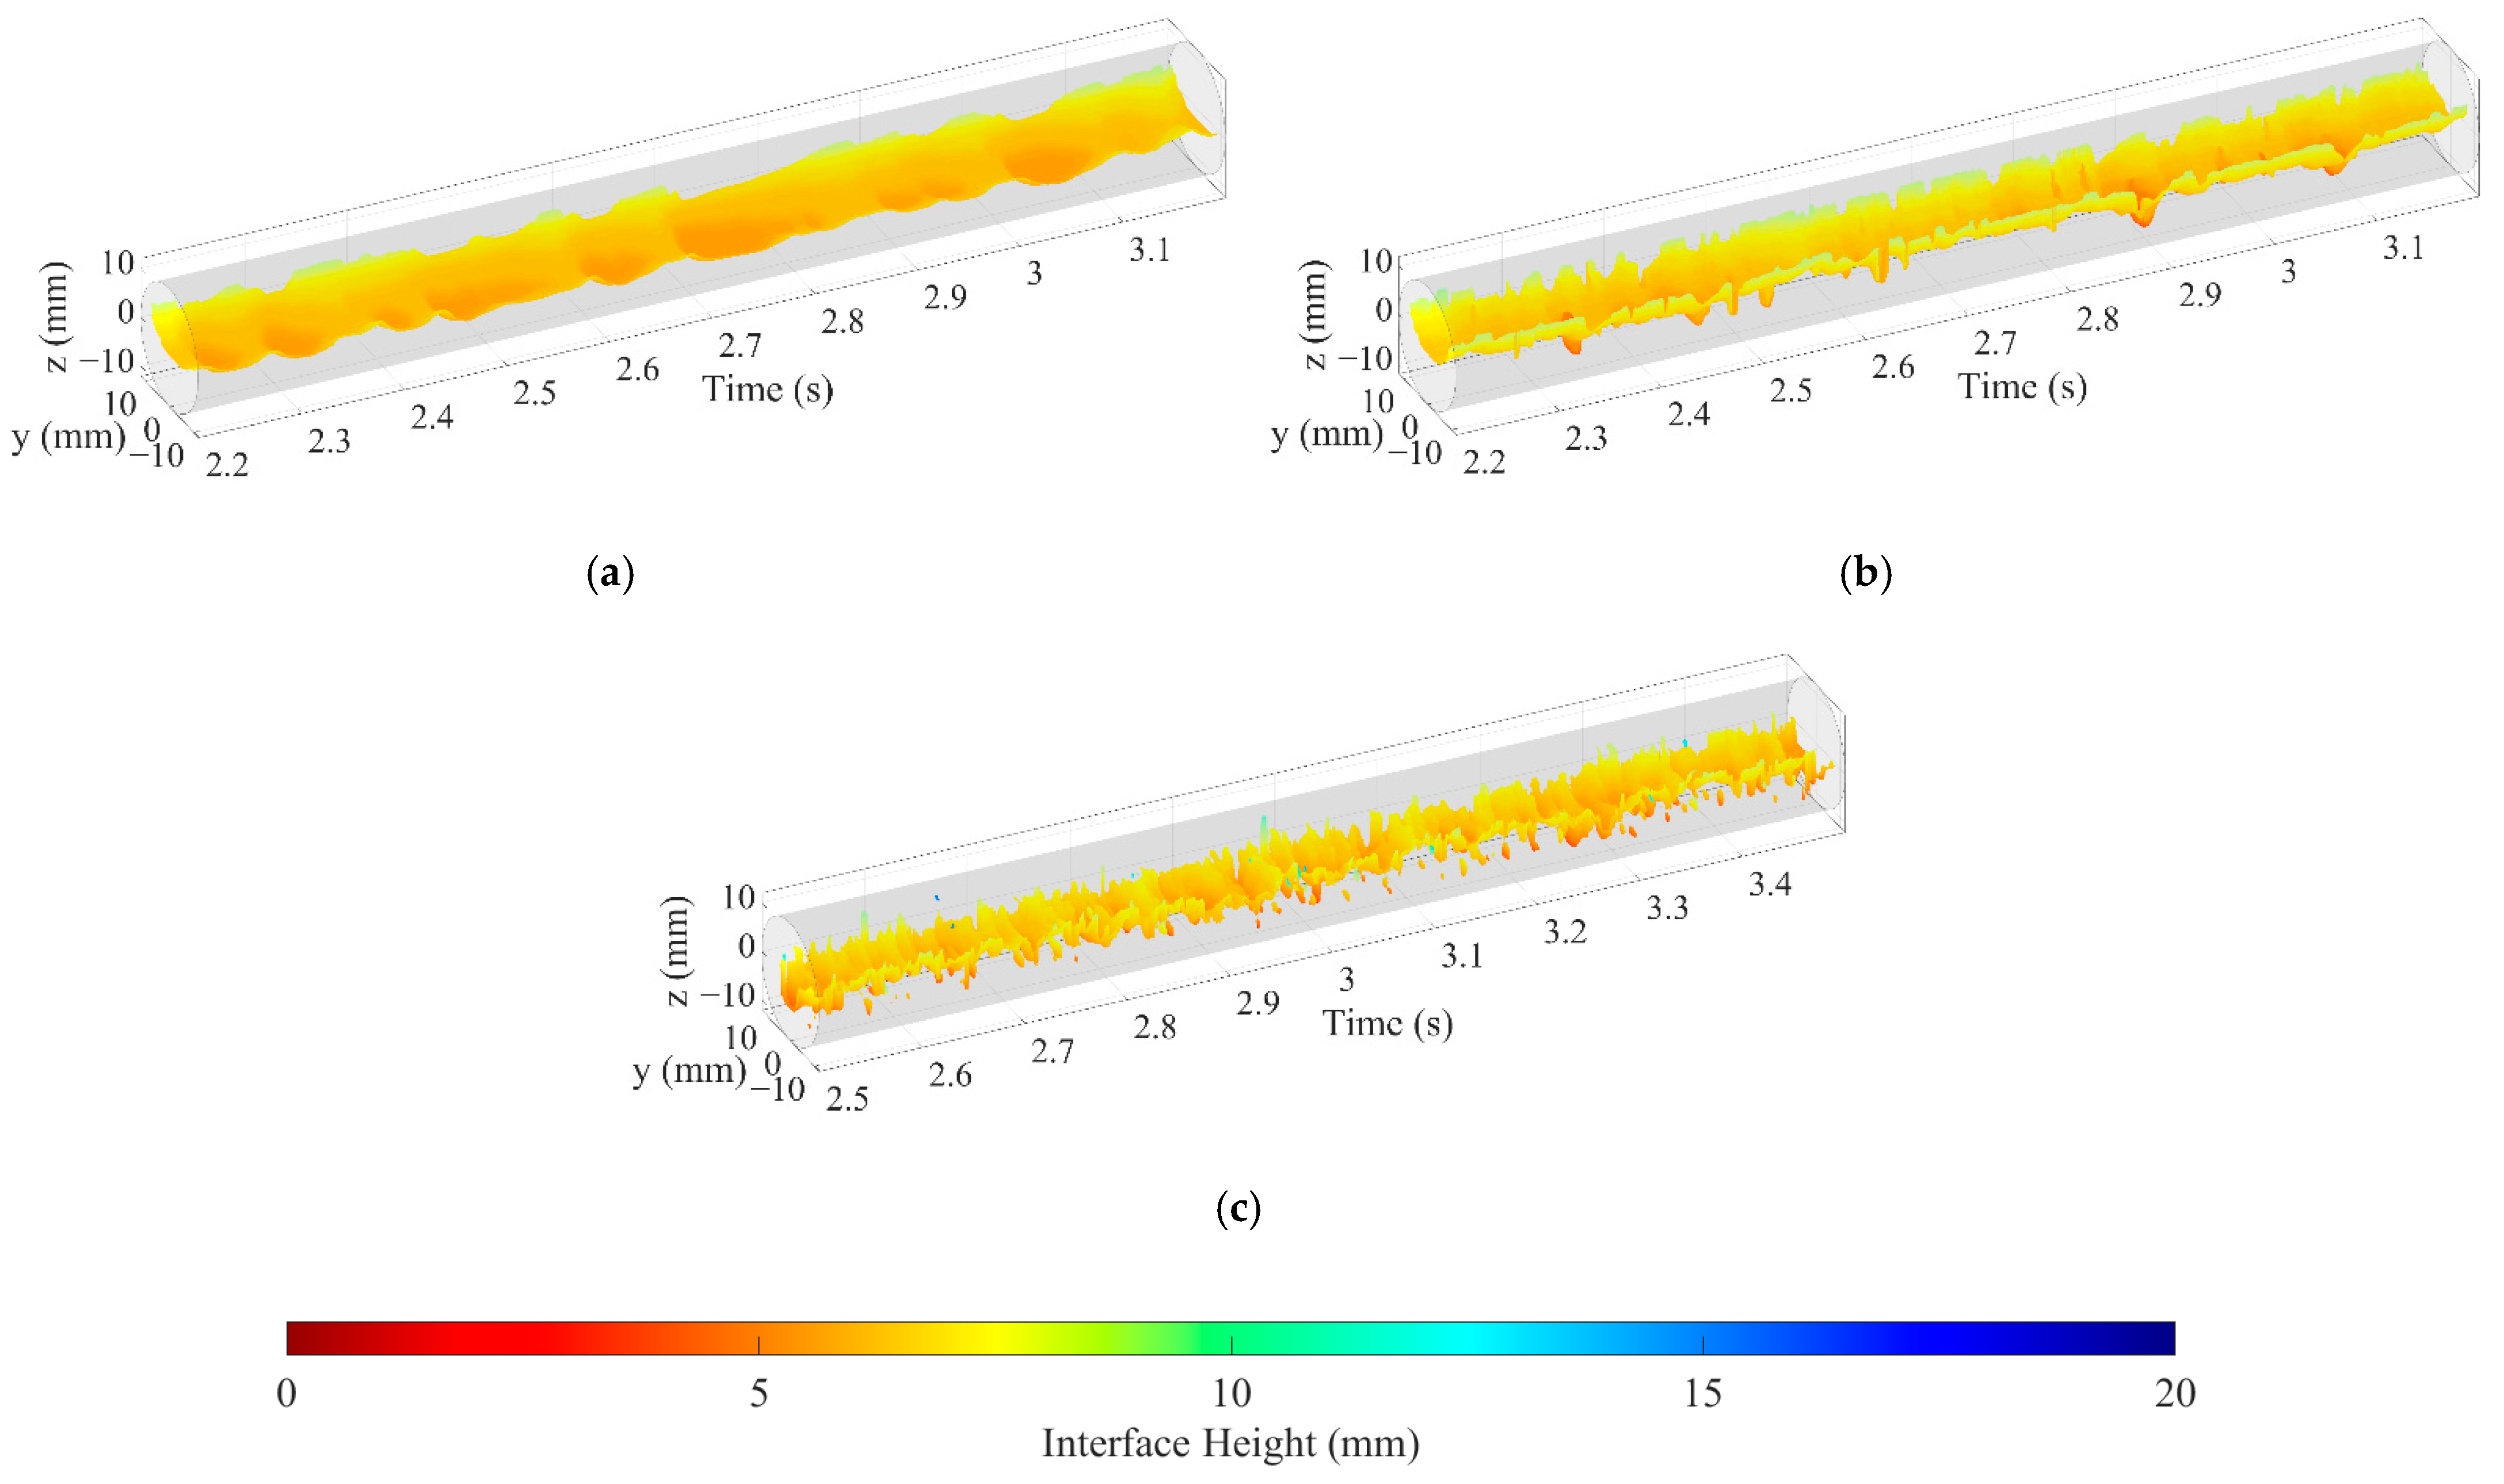
The extraction process of the oil–water stratified interface and droplets are shown in Figure 13. First, cubic spline interpolation is performed on the normalized matrix VN (k) to obtain the interpolation matrix Vip (k), as shown in Figure 13a,b. Then, edge extraction is conducted for Vip (k), and only the oil–water stratified interface and droplets are retained, as shown in Figure 13c. Finally, cubic spline interpolation and smoothing transition are carried out along the time axis to obtain 3D stratified interface and droplets, as shown in Figure 14. As can be seen, the droplets around the oil–water interface in ST&MI and D W/O&D O/W flows can distort the interface shape.
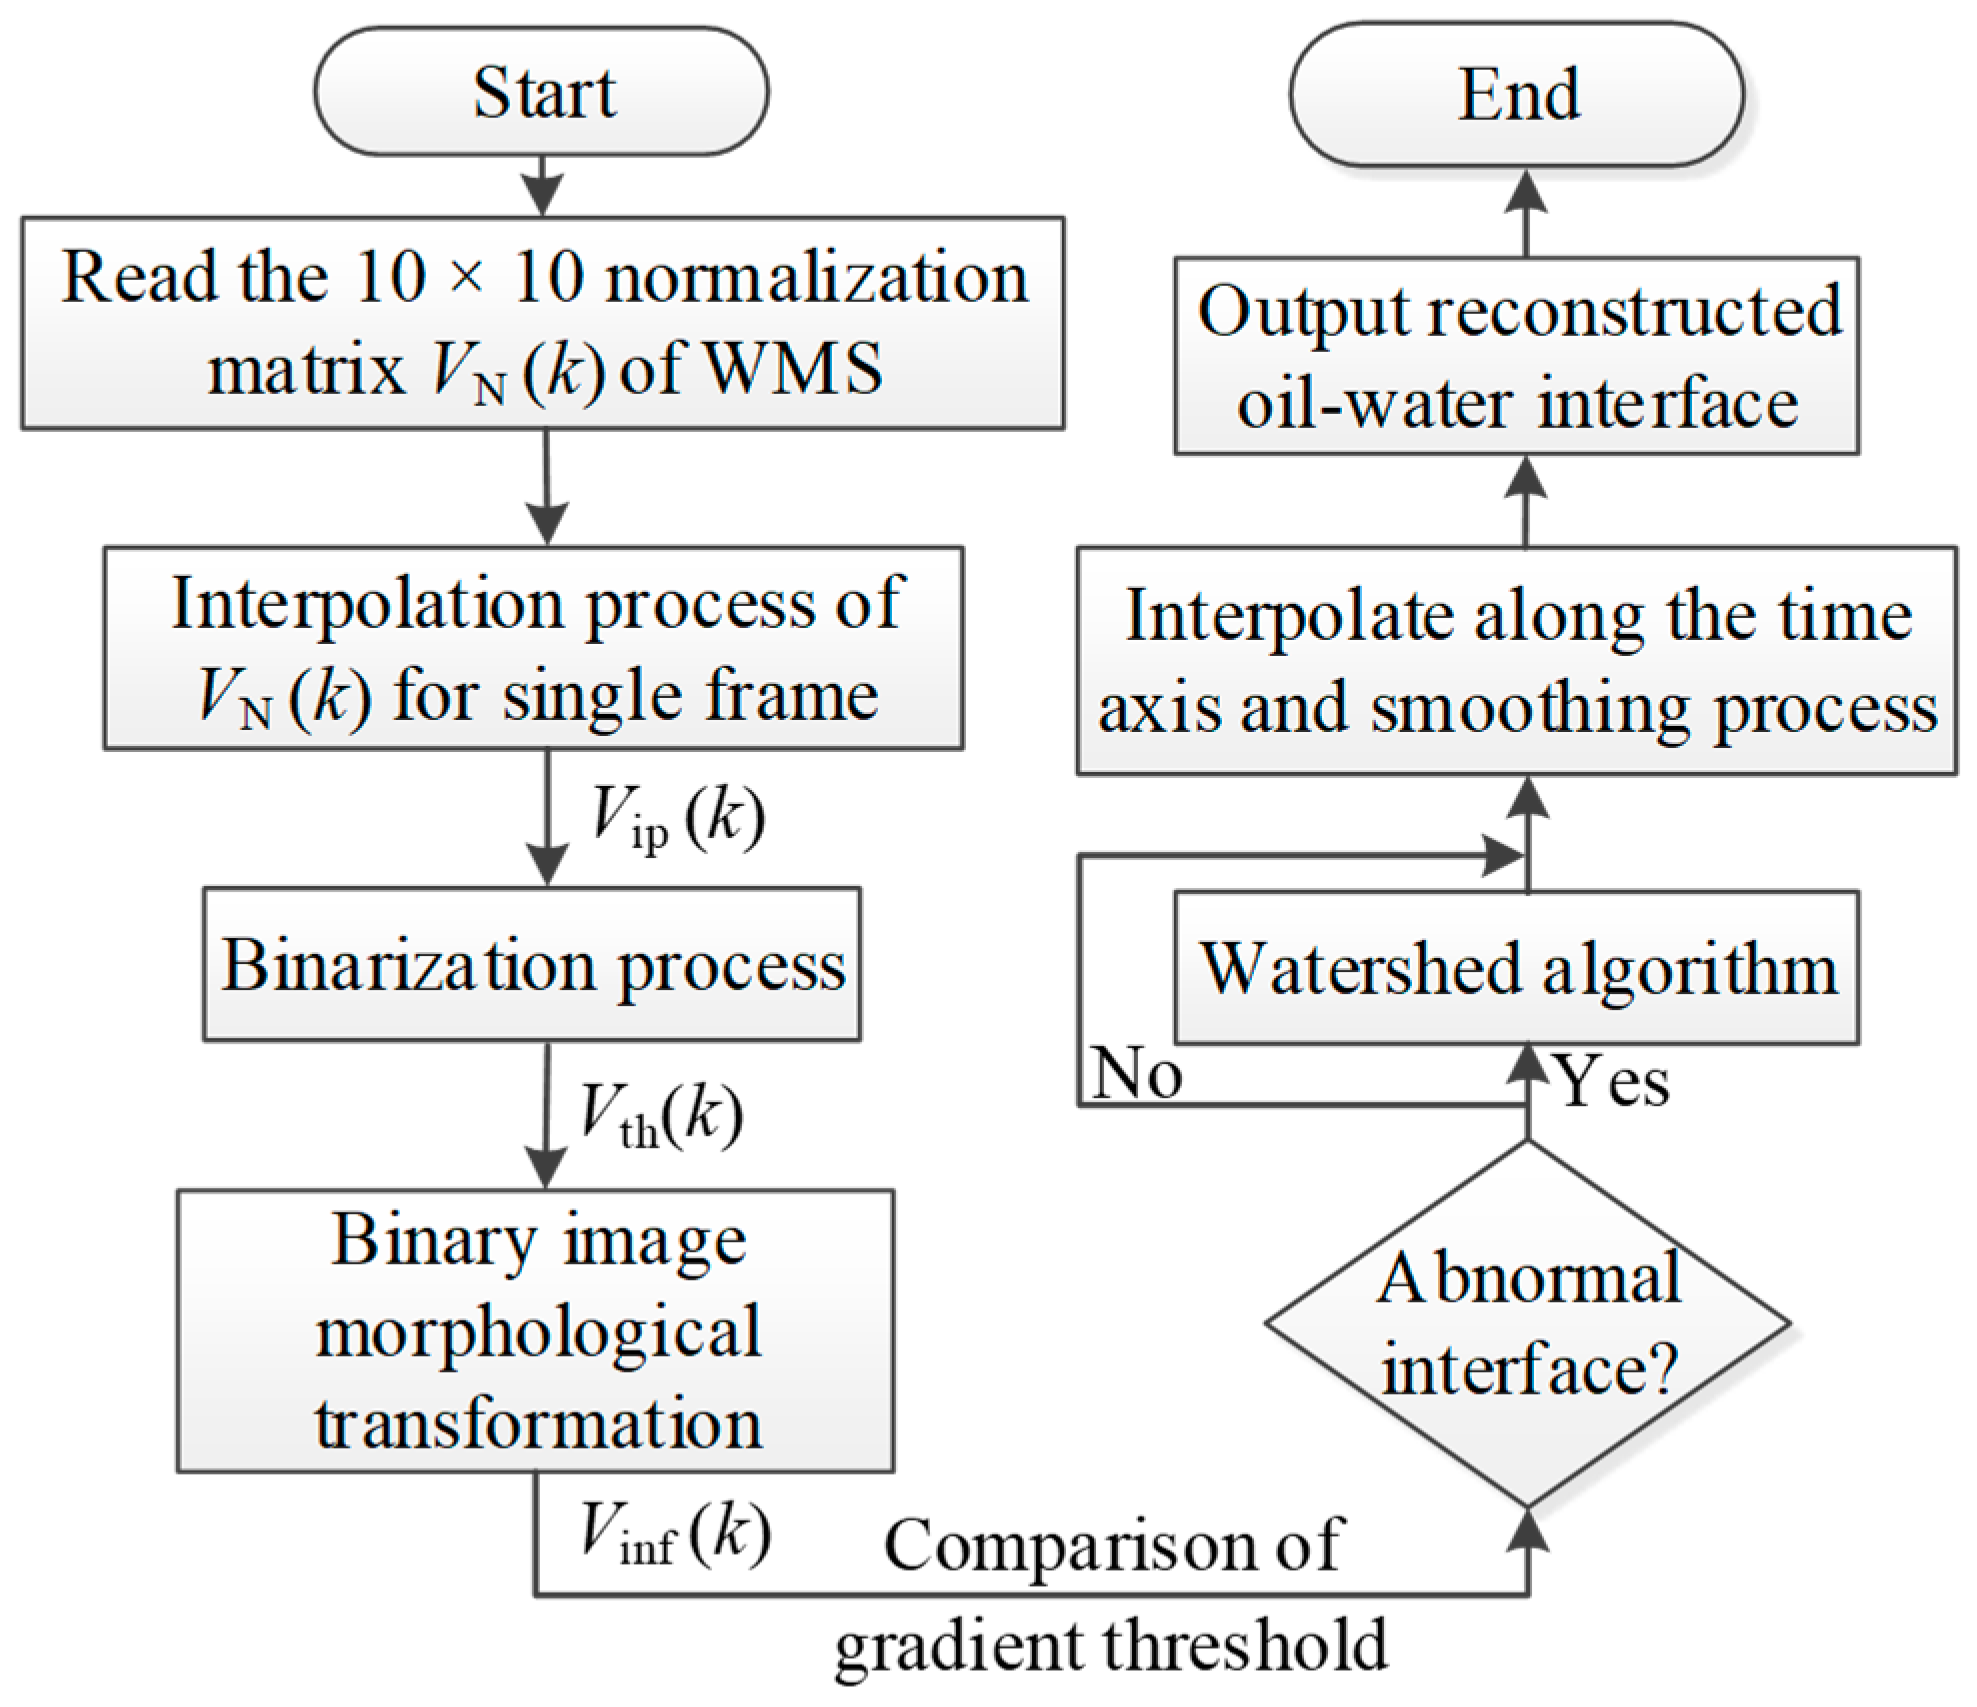
The droplets shown in Figure 14 should be removed to accurately extract the interface characteristics of the oil–water flows. The extraction process of the oil–water stratified interface is shown in Figure 15. Threshold transformation is performed on the interpolation matrix Vip (k) to obtain the binarization matrix Vth (k), where the water phase and oil phase are regarded as 1 and 0, respectively, as shown in Figure 16a,b. The binarization matrix Vth (k) is processed by the morphological transformation, including the closed operation and the open operation. The small holes can be filled through the closed operation so that the dispersed oil droplets are removed. By using the open operation, the small connected components can be deleted, and thus, the dispersed water droplets are removed. After the morphological transformation, the binarization matrix Vth (k) is changed to Vinf (k), as shown in Figure 16c.
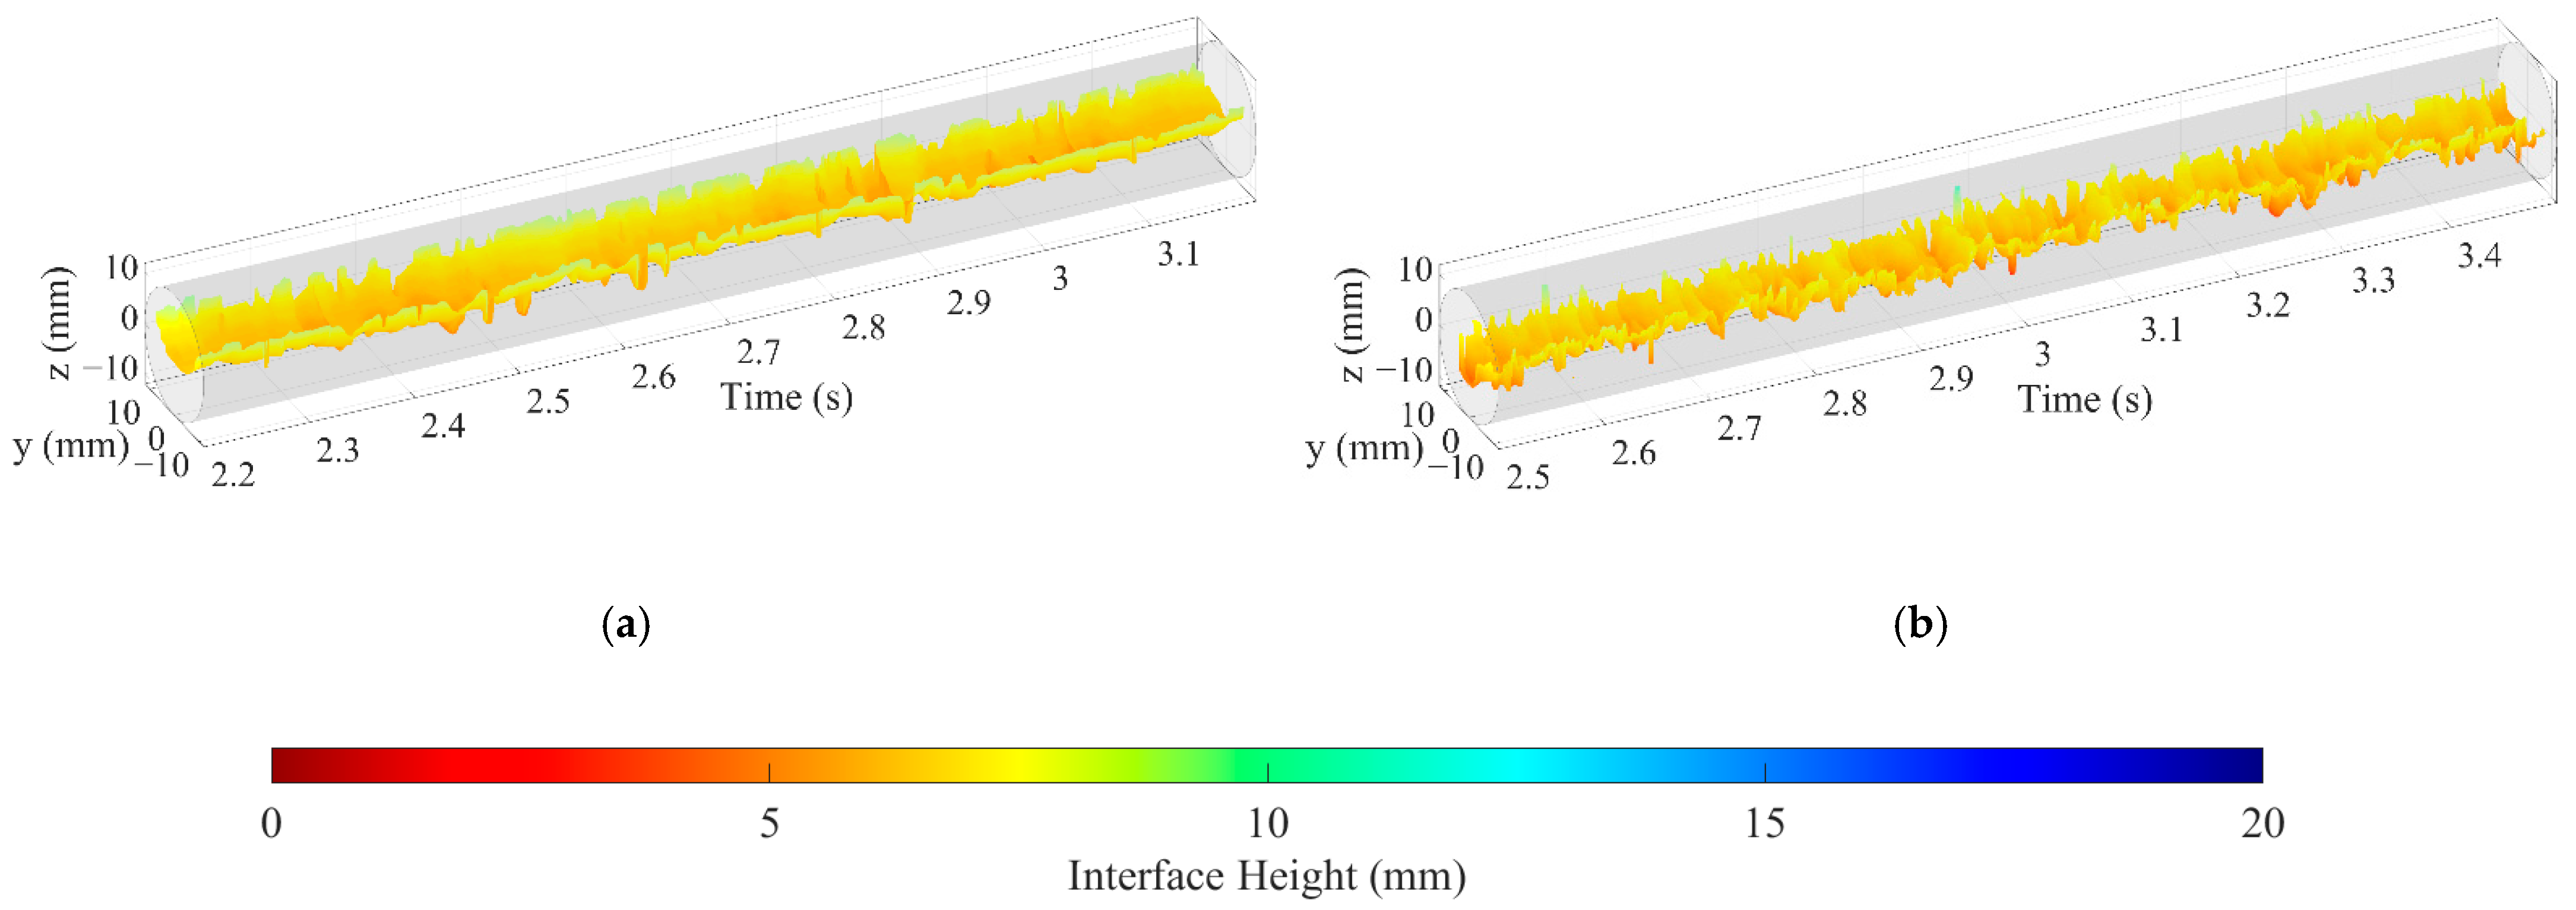
When large droplets adhere to the oil–water stratified interface or the distance between droplets and the stratified interface is small, the sensor fails to identify the droplet and interface due to its limited spatial resolution. In this case, the watershed algorithm based on the morphology theory [35] is introduced to separate the droplets and interface. The watershed algorithm includes operations based on distance transformation, gradient, and marker control. Firstly, the gradient threshold is set according to the correct interface extraction results to determine whether the interface is normal. If the gradient value of the pixel points changes abnormally, the watershed algorithm is run to segment the droplet and stratified interface. In the course of segmentation, the algorithm takes the gradient similarity of the neighboring pixels into account. Then, the pixels with an approximately equal spatial gradient are connected to come into a closed contour, and thus, the influence of oil droplets on the interface is eliminated, as shown in Figure 16d. The oil–water interfaces extracted under typical oil–water flow conditions are shown in Figure 17. The result shows that the data processing method adopted in this paper can effectively separate the entrainment droplets around the stratified interface and achieve an accurate oil–water interface.

3. Results and Discussion

3.1. Interfacial Configuration

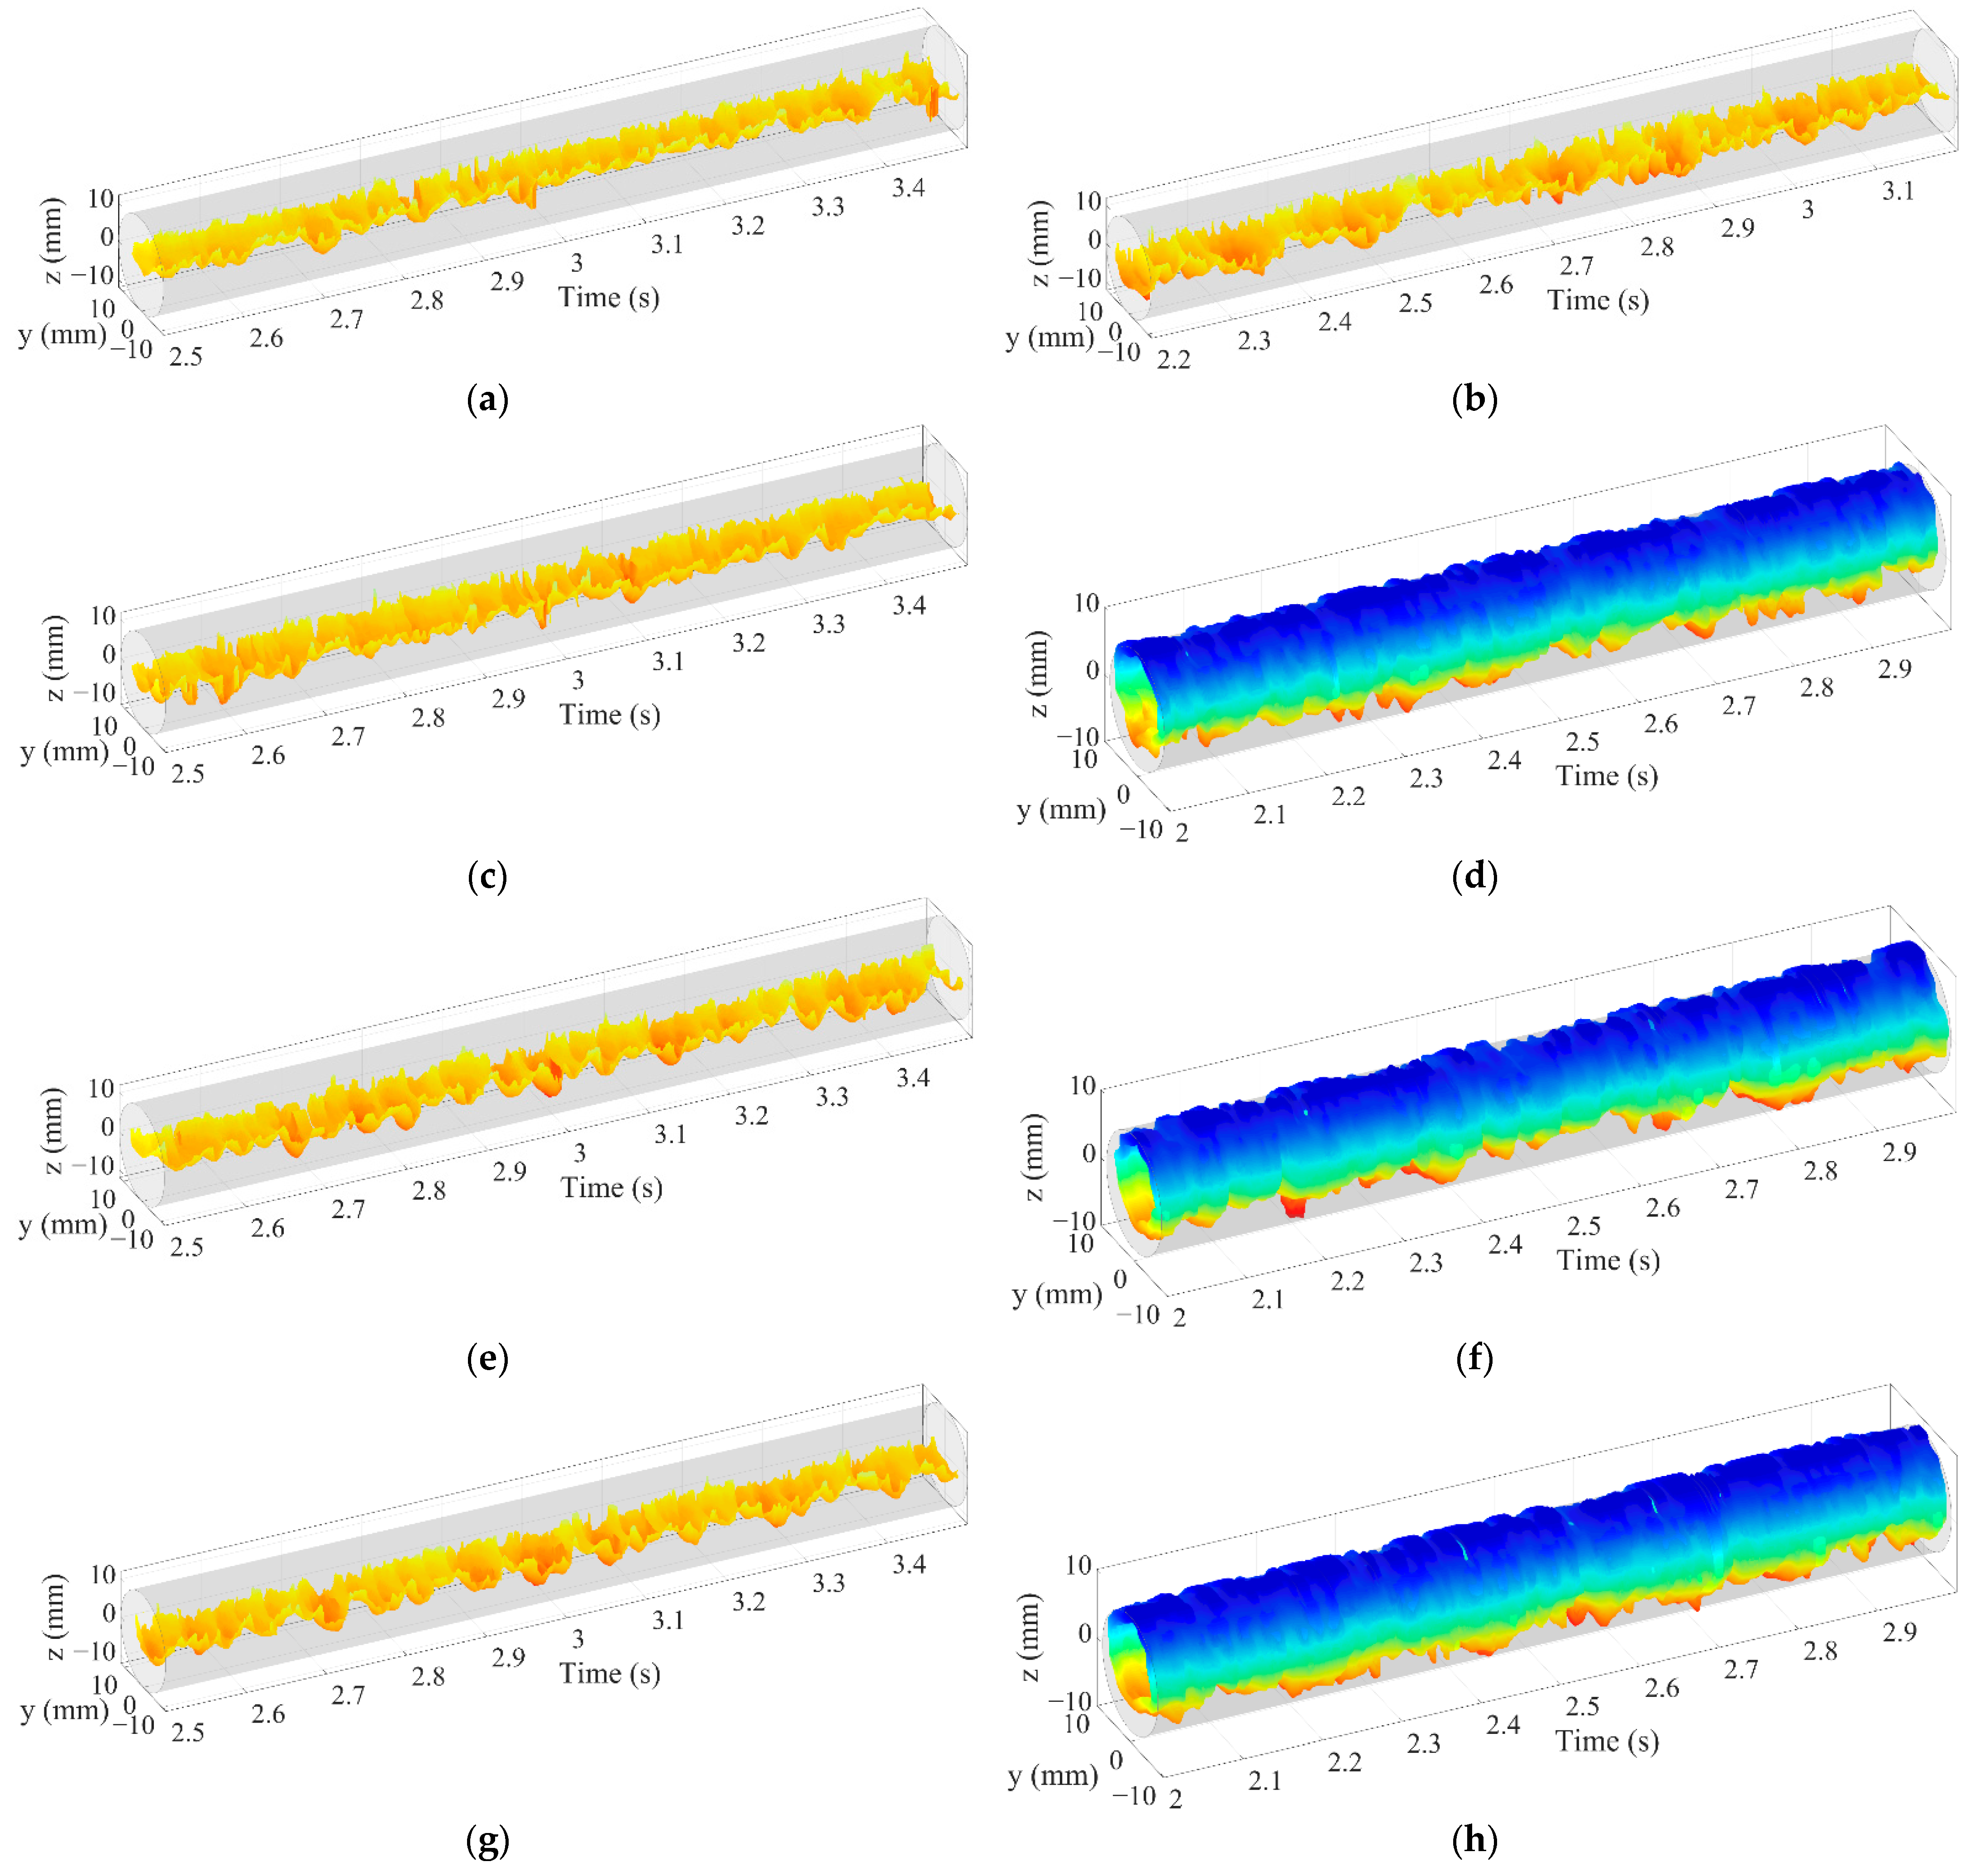
Evolution characteristics of the oil–water interfacial configuration at different pipe inclinations are shown in Figure 18 and Figure 19. When the water superficial velocity is low (Usw= 0.184 m /s), as shown in Figure 18, the ST flow gradually transforms to ST&MI flow, and then to D W/O&D O/W flow as the oil superficial velocity is increased. The stratified interface of ST and ST&MI flow is concave, and the interface fluctuation characteristic is not obvious, as shown in Figure 18a–c,e. When the flow pattern changes to D W/O&D O/W flow, the fluctuations of the oil–water stratified interface are intensified, and the curved interface shape is obvious, as shown in Figure 18d,f. A high oil-phase flow rate will lead to an obvious interface wave, which is corresponding to remarkable droplets entrainment near the stratified interface. When the inclination angle of the pipe increases, the fluctuation of the stratified interface increases correspondingly.
If the water superficial velocity is further increased to 0.737 m/s, as shown in Figure 19. The oil–water flow changes from ST&MI flow to D W/O&D O/W flow as the oil superficial velocity is increased. It should be noted that the top of the D W/O&D O/W flow is often accompanied by water film in inclined pipes. This means the D W/O&D O/W WF flow occurs. With the increase in oil superficial velocity, the height of oil–water stratified interface does not decrease due to the appearance of water film structure in D W/O&D O/W WF flow. The concave shape of the oil–water interface in D W/O&D O/W flow is not obvious. In contrast, the interface characteristics are dominated by the remarkable fluctuations. The pipe inclination has little influence on the wave characteristics of D W/O&D O/W flow, as shown in Figure 19a,c,e,g. However, the curved degree of the oil–water interface in the inclined pipe is larger than that in the horizontal one, and the water phase gathers at the top of the pipeline. For D W/O&D O/W WF flow, as shown in Figure 19d,f,h, the oil–water interface is almost cylindrical, and the water phase wets the entire pipe interior while the oil phase exists in the form of an oil core.

3.2. Interfacial Height and Length

The interfacial height is derived in this section to quantitatively describe the interface characteristics of oil–water two-phase flow. Figure 20 shows the time series of the interfacial height under typical flow conditions. Each point in the interfacial height series is derived from one frame data of the sensor. As can be seen, the instantaneous interfacial height is sensitive to the flow conditions. For ST flow, as shown in Figure 20a, the interfacial height series shows low-frequency fluctuation, which can effectively reflect the interfacial wave propagation. For ST&MI flow, as shown in Figure 20b, the interfacial height series presents low-amplitude and high-frequency fluctuations, which are mainly caused by the interaction between the interface and a few droplets detaching from the stratified interface. When the flow pattern changes to D W/O&D O/W flow, as shown in Figure 20c, the interfacial height series present obvious high-amplitude and high-frequency fluctuations.
The average height of the oil–water stratified interface for different flow patterns is shown in Figure 21. In general, with the increase in the inclination angle, the average interfacial height increases due to the slippage effect. With the increase in the oil phase rate, the average interfacial height decreases. It is worth noting that, as shown in Figure 21c, when Uso is equal to 0.921 m/s, the inclination of the pipe no longer leads to a decrease in the average interfacial height, whilst the average interfacial height increases significantly due to the appearance of D W/O&D O/W WF flow when the pipe is inclined.
Interfacial length is significantly associated with the heat and mass transfer characteristics between phases and is a necessary parameter in calculating the interfacial shear stress [36,37], which plays an important role in modeling the interface instability [38] and predicting the flow parameters, such as pressure drop [39,40,41], phase volume fraction [42], flow rate [43] and droplet entrainment fraction [44,45]. Thus, the interfacial length is derived to quantificationally describe the interfacial characteristics of oil–water flows.
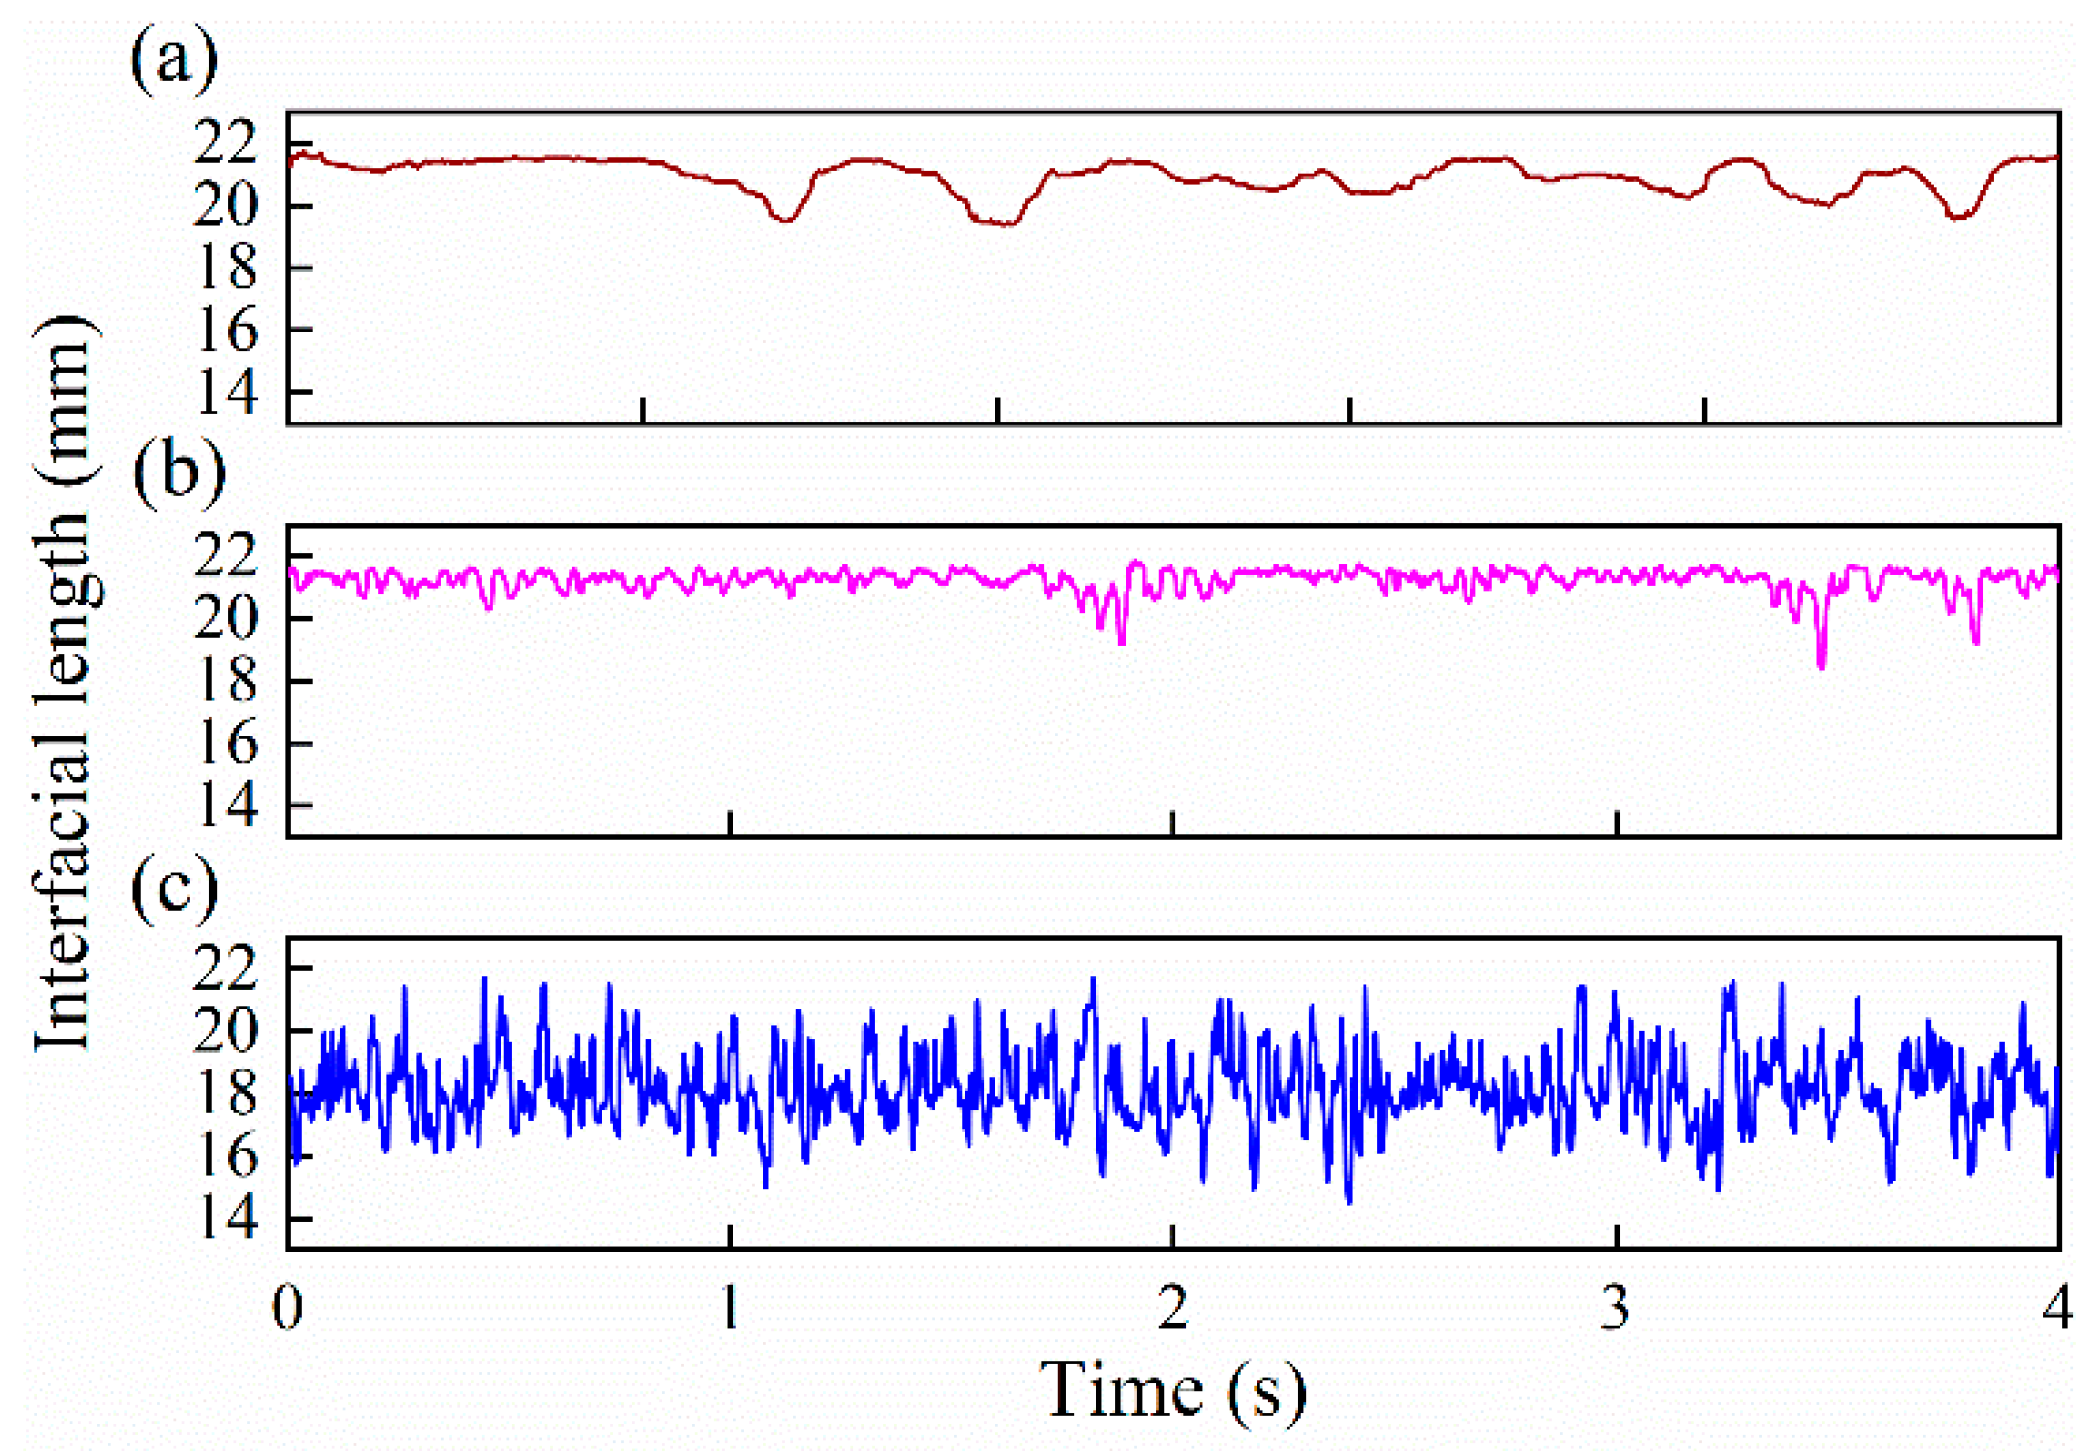
Figure 22 shows the time series of the interfacial length under typical flow conditions. When the oil–water flow presents ST flow, as shown in Figure 22a, there are some fluctuations in the interfacial length series in the horizontal pipe. This is because the oil–water flow in the horizontal pipe is in the critical state of ST to ST&MI flow transition, and the oil–water interface gradually loses its instability. When the oil–water two-phase flow pattern changes to ST&MI flow, as shown in Figure 22b, the variation frequency of the interfacial length series in horizontal pipelines increases. When the water and oil superficial velocities are 0.737 and 0.921 m/s, respectively, as shown in Figure 22c, the oil–water flow presents D W/O&D O/W flow in horizontal pipe. The interfacial length series show obvious fluctuations due to the interface instability and curved interfacial configuration of D W/O&D O/W flow.
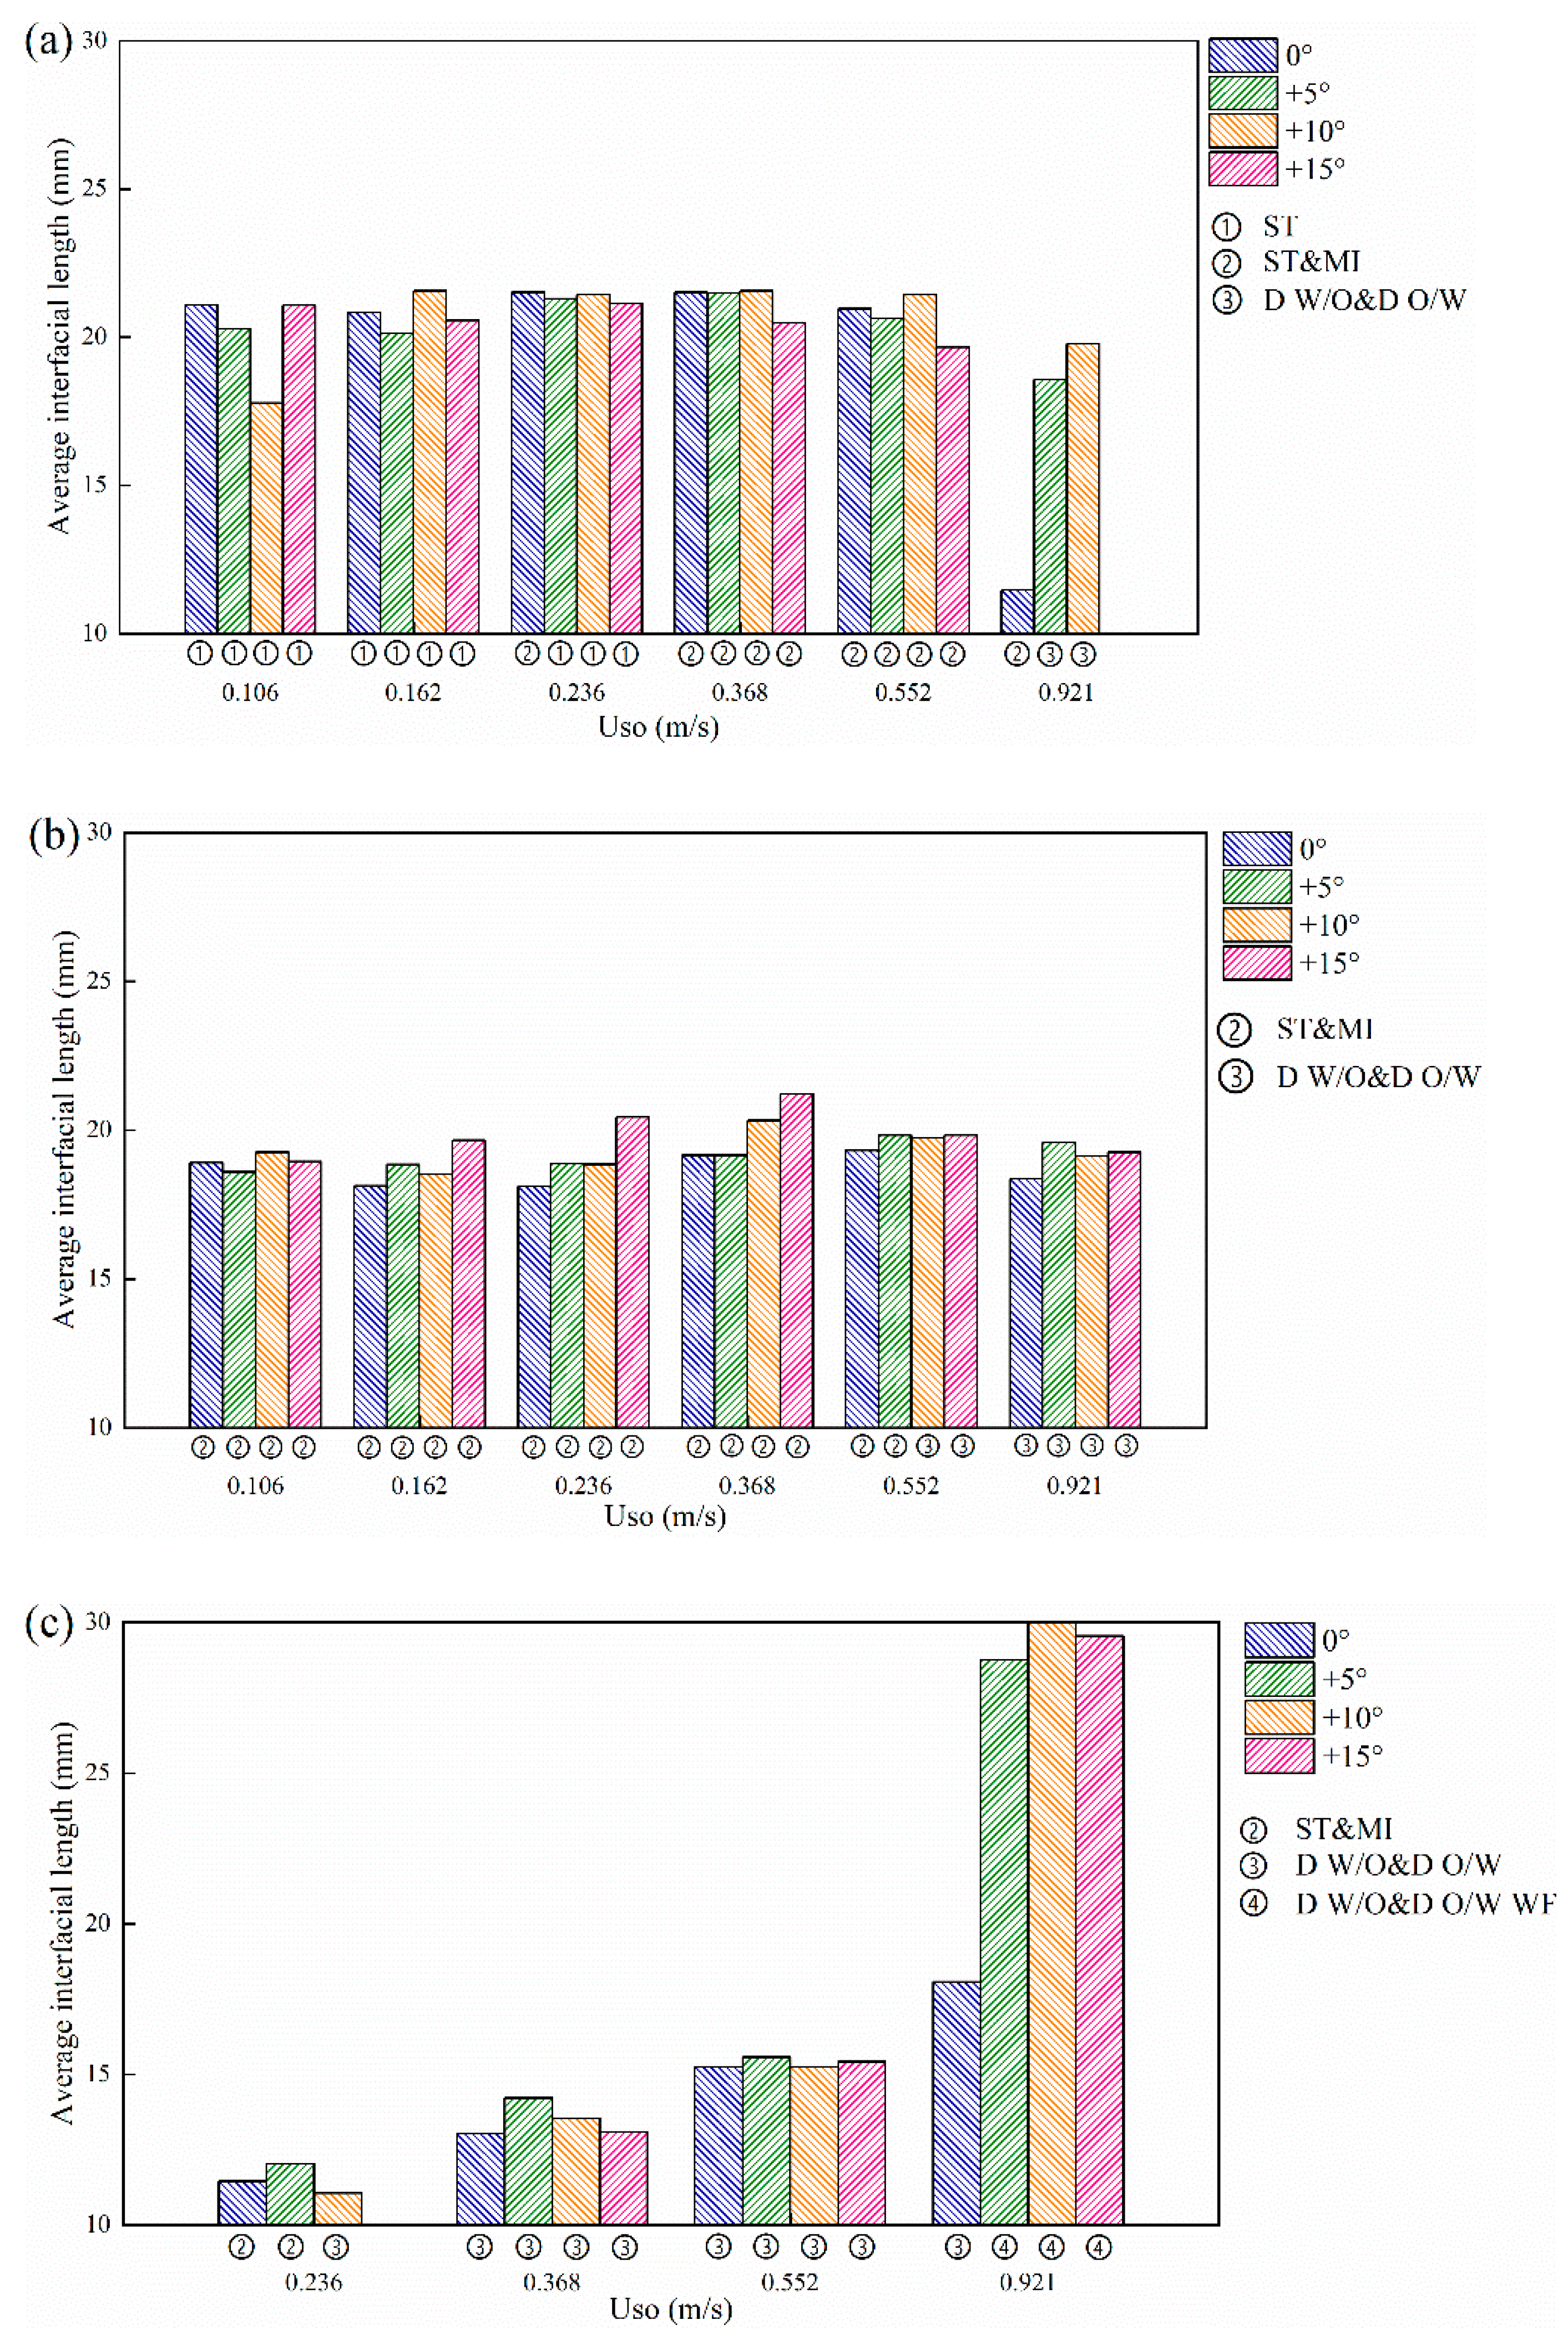
Figure 23 shows the calculation results of the average length of the oil–water stratified interface. When the water superficial velocity is low (Usw = 0.184 m /s), as shown in Figure 23a, with the increase in the oil superficial velocity, the average interfacial length first increases and then decreases. The flow pattern gradually changes from ST to ST&MI flow. In this case, the interface fluctuation is small, and the interface shape is the main influencing factor of the interfacial length. The average interfacial length tends to increase as the curvature of the concave interface increases. When the oil superficial velocity increase to 0.552 m/s, the average interfacial length reduces due to the decrease in the interfacial height. When the oil superficial velocity is equal to 0.921 m/s, the average interfacial length increases as the pipe inclination increases. This result coincides with the increase in the interface curvature in inclined pipes.
When the water superficial velocity Usw reaches 0.368 m/s, as shown in Figure 23b, with the increase in the oil superficial velocity, the average interfacial length also first increases and then decreases. The flow pattern gradually changes from ST&MI to D W/O&D O/W flow, and the interface shape gradually becomes complex, which means the average interfacial length tends to increase. When the oil-phase superficial velocity exceeds 0.552 m/s, the interfacial height decreases, and it leads to a decrease in the average interfacial length. In addition, it is observed that the average interfacial length of the inclined pipe is basically higher than that of the horizontal pipe, which results from the curvature increase in the concave interface in the inclined pipes.
When the water superficial velocity is equal to 0.737 m/s, as shown in Figure 23c, the average interfacial length shows an increasing tendency with the increase in the oil flow rate. The interfacial length in D W/O&D O/W flow is dominated by wave characteristics. The pipe inclination always makes the interface structure complex and produces an increase in the average interfacial length. When the oil superficial velocity reaches 0.921 m/s, the average interfacial length increases obviously due to the presence of water film in the D W/O&D O/W WF flow.

4. Conclusions

We designed a 10 × 10 conductance wire-mesh sensor (WMS) for detecting the interfacial characteristics of horizontal and inclined oil–water flows. The experiments for horizontal and inclined (+5°, +10°, +15°) oil–water flow were carried out, and flow pattern maps of oil–water flows with different inclinations were drawn. The influence of pipe inclinations on the flow transition boundary was analyzed. The three-dimensional structure of the oil–water two-phase flow was visualized based on the sensor measurement response. It is found that the three-dimensional visualization results have limitations in uncovering the oil–water stratified interface structure.
The evolution characteristics of oil–water interfacial configuration at different pipe inclinations were studied. The stratified interface of ST and ST&MI flow is concave and curved, and the interface fluctuation characteristic is not obvious. For D W/O&D O/W flow, when the water phase flow rate is low, the fluctuation of the oil–water stratified interface is intensified and the curved interface shape is obvious. When the water flow rate is larger, the concave interface of D W/O&D O/W flow is no longer obvious. In contrast, the interface characteristics are dominated by remarkable fluctuations. Additionally, when the inclination angle of the pipe increases, the fluctuation of the stratified interface increases correspondingly. It is worth pointing out that the top of D W/O&D O/W flow is often accompanied by water film in inclined pipes. The curved degree of the oil–water interface in the inclined pipe is larger than that in the horizontal one.
The oil–water interfacial height and length were measured based on the detected interfacial configuration. The influence of oil–water flow conditions and pipe inclinations on the interfacial height and length was studied. With the increase in the pipe inclination, the average interfacial height increases due to the slippage effect. For a constant water flow rate, the average interfacial height decreases as the oil phase flow rate is increased. The average interfacial height increases significantly due to the appearance of D W/O&D O/W WF flow when the pipe is inclined. The interfacial length is dependent on the configuration and the fluctuations of the interface. The increase in the pipe inclination angle makes the curvature of the concave interface and the shape change, which leads to an increase in the interfacial length.
In general, the sensor designed in our study presents good performance for measuring the interfacial characteristics of oil–water flows. As an effective tomography method for multiphase flows, the sensor is applicable to pipelines with high temperature and pressure and, thus, has good application prospects in oil–gas production and transportation, nuclear engineering, and chemical engineering.

Author Contributions

Conceptualization, L.Z. and J.Q.; methodology, L.Z.; validation, J.Q., W.W. and Y.W.; formal analysis, J.Q.; investigation, J.Q.; data curation, J.Q.; writing—original draft preparation, J.Q.; writing—review and editing, L.Z.; visualization, L.Z.; supervision, L.Z.; project administration, L.Z.; funding acquisition, L.Z. All authors have read and agreed to the published version of the manuscript.

Funding

This study was supported by National Natural Science Foundation of China (Grant No. 41974139), Natural Science Foundation of Tianjin City, China (19JCYBJC18400), Tianjin Research Innovation Project for Postgraduate Students (2021YJSS021).

Institutional Review Board Statement

Not applicable.

Informed Consent Statement

Not applicable.

Data Availability Statement

Not applicable.

Conflicts of Interest

The authors declare no conflict of interest.

References

  1. Trallero, J.L.; Sarica, C.; Brill, J.P. A Study of Oil/Water Flow Patterns in Horizontal Pipes. SPE Prod. Facil. 1997, 12, 165–172. [Google Scholar] [CrossRef]
  2. Angeli, P.; Hewitt, G.F. Flow structure in horizontal oil–water flow. Int. J. Multiph. Flow 2000, 26, 1117–1140. [Google Scholar] [CrossRef]
  3. Zhai, L.-S.; Jin, N.-D.; Zong, Y.-B.; Hao, Q.-Y.; Gao, Z.-K. Experimental flow pattern map, slippage and time–frequency representation of oil–water two-phase flow in horizontal small diameter pipes. Int. J. Multiph. Flow 2015, 76, 168–186. [Google Scholar] [CrossRef]
  4. Rodriguez, O.M.H.; Oliemans, R.V.A. Experimental study on oil–water flow in horizontal and slightly inclined pipes. Int. J. Multiph. Flow 2006, 32, 323–343. [Google Scholar] [CrossRef]
  5. Grassi, B.; Strazza, D.; Poesio, P. Experimental validation of theoretical models in two-phase high-viscosity ratio liquid–liquid flows in horizontal and slightly inclined pipes. Int. J. Multiph. Flow 2008, 34, 950–965. [Google Scholar] [CrossRef]
  6. Boostani, M.; Karimi, H.; Azizi, S. Heat transfer to oil-water flow in horizontal and inclined pipes: Experimental investigation and ANN modeling. Int. J. Therm. Sci. 2017, 111, 340–350. [Google Scholar] [CrossRef]
  7. Hanafizadeh, P.; Hojati, A.; Karimi, A. Experimental investigation of oil–water two phase flow regime in an inclined pipe. J. Petrol. Sci. Eng. 2015, 136, 12–22. [Google Scholar] [CrossRef]
  8. Zhang, D.; Zhang, H.; Rui, J.; Pan, Y.; Liu, X.; Shang, Z. Prediction model for the transition between oil–water two-phase separation and dispersed flows in horizontal and inclined pipes. J. Petrol. Sci. Eng. 2020, 192, 107161. [Google Scholar] [CrossRef]
  9. Paolinelli, L.D. A comprehensive model for stability of dispersed oil-water flow in horizontal and inclined pipes. Chem. Eng. Sci. 2020, 211, 115325. [Google Scholar] [CrossRef]
  10. Al-Wahaibi, T.; Smith, M.; Angeli, P. Transition between stratified and non-stratified horizontal oil–water flows. Part II: Mechanism of drop formation. Chem. Eng. Sci. 2007, 62, 2929–2940. [Google Scholar] [CrossRef]
  11. de Castro, M.S.; Pereira, C.C.; dos Santos, J.N.; Rodriguez, O.M.H. Geometrical and kinematic properties of interfacial waves in stratified oil–water flow in inclined pipe. Exp. Therm. Fluid Sci. 2012, 37, 171–178. [Google Scholar] [CrossRef]
  12. Perera, K.; Time, R.W.; Pradeep, C.; Kumara, A.S. Interfacial wave analysis of low viscous oil-water flow in upwardly inclined pipes. Chem. Eng. Sci. 2019, 196, 444–462. [Google Scholar] [CrossRef]
  13. Al-Wahaibi, T.; Angeli, P. Experimental study on interfacial waves in stratified horizontal oil–water flow. Int. J. Multiph. Flow 2011, 37, 930–940. [Google Scholar] [CrossRef]
  14. Zhai, L.; Zhang, H.; Yan, C.; Jin, N. Measurement of Oil-Water Interface Characteristics in Horizontal Pipe Using a Conductance Parallel-Wire Array Probe. IEEE Trans. Instrum. Meas. 2019, 68, 3232–3243. [Google Scholar] [CrossRef]
  15. Morgan, R.G.; Markides, C.N.; Hale, C.P.; Hewitt, G.F. Horizontal liquid–liquid flow characteristics at low superficial velocities using laser-induced fluorescence. Int. J. Multiph. Flow 2012, 43, 101–117. [Google Scholar] [CrossRef]
  16. Morgan, R.G.; Markides, C.N.; Zadrazil, I.; Hewitt, G.F. Characteristics of horizontal liquid–liquid flows in a circular pipe using simultaneous high-speed laser-induced fluorescence and particle velocimetry. Int. J. Multiph. Flow 2013, 49, 99–118. [Google Scholar] [CrossRef]
  17. Ibarra, R.; Matar, O.K.; Markides, C.N. Experimental investigations of upward-inclined stratified oil-water flows using simultaneous two-line planar laser-induced fluorescence and particle velocimetry. Int. J. Multiph. Flow 2021, 135, 103502. [Google Scholar] [CrossRef]
  18. Jia, J.; Wang, H.; Millington, D. Electrical Resistance Tomography Sensor for Highly Conductive Oil-Water Two-Phase Flow Measurement. IEEE Sens. J. 2017, 17, 8224–8233. [Google Scholar] [CrossRef]
  19. Hossain, M.S.; Abir, M.T.; Alam, M.S.; Volakis, J.L.; Islam, M.A. An Algorithm to Image Individual Phase Fractions of Multiphase Flows Using Electrical Capacitance Tomography. IEEE Sens. J. 2020, 20, 14924–14931. [Google Scholar] [CrossRef]
  20. Tompkins, C.; Prasser, H.-M.; Corradini, M. Wire-mesh sensors: A review of methods and uncertainty in multiphase flows relative to other measurement techniques. Nucl. Eng. Des. 2018, 337, 205–220. [Google Scholar] [CrossRef]
  21. Prasser, H.M.; Böttger, A.; Zschau, J. A new electrode-mesh tomograph for gas–liquid flows. Flow Meas. Instrum. 1998, 9, 111–119. [Google Scholar] [CrossRef]
  22. Furuya, M.; Kanai, T.; Arai, T.; Takiguchi, H.; Prasser, H.-M.; Hampel, U.; Schleicher, E. Three-dimensional velocity vector determination algorithm for individual bubble identified with Wire-Mesh Sensors. Nucl. Eng. Des. 2018, 336, 74–79. [Google Scholar] [CrossRef]
  23. Kickhofel, J.; Yang, J.; Prasser, H.-M. Designing a high temperature high pressure mesh sensor. Nucl. Eng. Des. 2018, 336, 122–128. [Google Scholar] [CrossRef]
  24. Dias, F.D.A.; Pipa, D.R.; Morales, R.E.M.; Silva, M.J.d. Wire-Mesh Sensor Super-Resolution Based on Statistical Reconstruction. IEEE Trans. Instrum. Meas. 2021, 70, 4503212. [Google Scholar] [CrossRef]
  25. Sharaf, S.; van der Meulen, G.P.; Agunlejika, E.O.; Azzopardi, B.J. Structures in gas–liquid churn flow in a large diameter vertical pipe. Int. J. Multiph. Flow 2016, 78, 88–103. [Google Scholar] [CrossRef]
  26. Kesana, N.R.; Parsi, M.; Vieira, R.E.; Azzopardi, B.; Schleicher, E.; McLaury, B.S.; Shirazi, S.A.; Hampel, U. Visualization of gas-liquid multiphase pseudo-slug flow using Wire-Mesh Sensor. J. Nat. Gas Sci. Eng. 2017, 46, 477–490. [Google Scholar] [CrossRef]
  27. Da Silva, M.J.; dos Santos, E.N.; Hampel, U.; Rodriguez, I.H.; Rodriguez, O.M.H. Phase fraction distribution measurement of oil–water flow using a capacitance wire-mesh sensor. Meas. Sci. Technol. 2011, 22, 104020. [Google Scholar] [CrossRef]
  28. Rodriguez, I.H.; Velasco Peña, H.F.; Bonilla Riaño, A.; Henkes, R.A.W.M.; Rodriguez, O.M.H. Experiments with a Wire-Mesh Sensor for stratified and dispersed oil-brine pipe flow. Int. J. Multiph. Flow 2015, 70, 113–125. [Google Scholar] [CrossRef]
  29. Zhang, H.; Xiao, Y.; Gu, H. A new method to determine conductivity distribution based on wire-mesh sensor by iteration. Ann. Nucl. Energy 2020, 143, 107443. [Google Scholar] [CrossRef]
  30. Prasser, H.-M.; Beyer, M.; Carl, H.; Gregor, S.; Lucas, D.; Pietruske, H.; Schütz, P.; Weiss, F.-P. Evolution of the structure of a gas–liquid two-phase flow in a large vertical pipe. Nucl. Eng. Des. 2007, 237, 1848–1861. [Google Scholar] [CrossRef]
  31. da Silva, M.J.; Hampel, U. Capacitance wire-mesh sensor applied for the visualization of three-phase gas–liquid–liquid flows. Flow Meas. Instrum. 2013, 34, 113–117. [Google Scholar] [CrossRef]
  32. Zhang, H.; Xiao, Y.; Gu, H.; Liu, D. Study on bubbly and cap-bubbly flow in a square channel using dual wire-mesh sensors. Int. J. Multiph. Flow 2020, 133, 103461. [Google Scholar] [CrossRef]
  33. Lee, J.; Kim, M.; Park, H. Single-layer wire-mesh sensor to simultaneously measure the size and rise velocity of micro-to-millimeter sized bubbles in a gas-liquid two-phase flow. Int. J. Multiph. Flow 2021, 139, 103620. [Google Scholar] [CrossRef]
  34. Zhai, L.; Wang, Y.; Yang, J.; Jin, N. Visualization of Vertical Oil–Water–Gas Flows Using Conductance Compensated Wire-Mesh Sensor. IEEE Trans. Instrum. Meas. 2022, 71, 7500516. [Google Scholar] [CrossRef]
  35. Beucher, S.; Meyer, F. The Morphological Approach to Segmentation: The Watershed Transformation. In Mathematical Morphology in Image Processing; CRC Press: Boca Raton, FL, USA, 1993; Volume 34, pp. 433–481. [Google Scholar]
  36. Tzotzi, C.; Andritsos, N. Interfacial shear stress in wavy stratified gas–liquid flow in horizontal pipes. Int. J. Multiph. Flow 2013, 54, 43–54. [Google Scholar] [CrossRef]
  37. Rodriguez, O.M.H.; Castro, M.S. Interfacial-tension-force model for the wavy-stratified liquid–liquid flow pattern transition. Int. J. Multiph. Flow 2014, 58, 114–126. [Google Scholar] [CrossRef]
  38. Al-Sarkhi, A.; Pereyra, E.; Mantilla, I.; Avila, C. Dimensionless oil-water stratified to non-stratified flow pattern transition. J. Petrol. Sci. Eng. 2017, 151, 284–291. [Google Scholar] [CrossRef]
  39. Rodriguez, O.M.H.; Baldani, L.S. Prediction of pressure gradient and holdup in wavy stratified liquid–liquid inclined pipe flow. J. Petrol. Sci. Eng. 2012, 96–97, 140–151. [Google Scholar] [CrossRef]
  40. Premanadhan, V.K.; Hernandez-Perez, V.; Teik, W.T.; Tam, N.D.; Bratland, O.; Loh, W.L. Experimental investigation of interfacial waves in stratified liquid-liquid flows in horizontal pipelines: Characteristics and pressure gradients. J. Petrol. Sci. Eng. 2019, 173, 20–36. [Google Scholar] [CrossRef]
  41. Zhai, L.; Zhang, H.; Jin, N. Prediction of pressure drop for segregated oil-water flows in small diameter pipe using modified two-fluid model. Exp. Therm. Fluid Sci. 2020, 114, 110078. [Google Scholar] [CrossRef]
  42. Sharma, A.; Al-Sarkhi, A.; Sarica, C.; Zhang, H.-Q. Modeling of oil–water flow using energy minimization concept. Int. J. Multiph. Flow 2011, 37, 326–335. [Google Scholar] [CrossRef]
  43. Guet, S.; Rodriguez, O.M.H.; Oliemans, R.V.A.; Brauner, N. An inverse dispersed multiphase flow model for liquid production rate determination. Int. J. Multiph. Flow 2006, 32, 553–567. [Google Scholar] [CrossRef]
  44. Al-Wahaibi, T.; Angeli, P. Predictive model of the entrained fraction in horizontal oil–water flows. Chem. Eng. Sci. 2009, 64, 2817–2825. [Google Scholar] [CrossRef]
  45. Hibiki, T.; Rassame, S. Analytical model for predicting oil fraction in horizontal oil–water two-phase flow. Exp. Comput. Multiph. Flow 2019, 1, 73–84. [Google Scholar] [CrossRef] [Green Version]
Figure 1. The schematic of the wire-mesh sensor system.
Energies 15 06638 g001
Figure 2. Schematic of the sensor excitation scheme and response signals.
Energies 15 06638 g002
Figure 3. Wire-mesh sensor system used in this study: (a) Wire-mesh sensor; (b) Sensor system.
Energies 15 06638 g003
Figure 4. Schematic of the experimental setup for horizontal and inclined oil–water two-phase flows.
Energies 15 06638 g004
Figure 5. The experimental setup for horizontal and inclined oil–water flows.
Energies 15 06638 g005
Figure 6. Typical oil–water flow images captured by the high-speed camera (0°): (a) Usw = 0.184 m/s, Uso = 0.162 m/s, ST; (b) Usw = 0.368 m/s, Uso = 0.236 m/s, ST&MI; (c) Usw = 1.105 m/s, Uso = 0.106 m/s, D OS &W; (d) Usw = 0.737 m/s, Uso = 0.552 m/s, D W/O&D O/W; (e) Usw = 1.105 m/s, Uso = 0.552 m/s, D W/O&D O/W WF; (f) Usw = 1.67 m/s, Uso = 0.236 m/s, D O/W; (g) Usw = 0.111 m/s, Uso = 1.474 m/s, D W/O.
Energies 15 06638 g006
Figure 7. Flow pattern map of horizontal and inclined oil–water two-phase flows: (a) 0°; (b) + 5°; (c) +10°; (d) +15°.
Energies 15 06638 g007
Figure 8. Response signals of the wire-mesh sensor (0°): (a) ST; (b) D W/O&D O/W.
Energies 15 06638 g008
Figure 9. Flow chart for the preprocessing of the sensor response signal.
Energies 15 06638 g009
Figure 10. Flow chart for 3D flow visualization.
Energies 15 06638 g010
Figure 11. The 2D phase distribution visualized by the sensor: (a) Original normalized matrix VN (k); (b) Interpolation matrix Vip (k); (c) Matrix Vε (k) after threshold processing.
Energies 15 06638 g011
Figure 12. The 3D flow visualization for different oil–water flow patterns (0°): (a) Usw = 0.184 m/s, Uso = 0.162 m/s, ST; (b) Usw = 0.368 m/s, Uso = 0.236 m/s, ST&MI; (c) Usw = 0.737 m/s, Uso = 0.552 m/s, D W/O&D O/W; (d) Usw = 1.105 m/s, Uso = 0.552 m/s, D W/O&D O/W WF; (e) Usw = 1.105 m/s, Uso = 0.106 m/s, D OS &W; (f) Usw = 1.67 m/s, Uso = 0.236 m/s, D O/W.
Energies 15 06638 g012
Figure 13. Extraction process of oil–water stratified interface and droplets: (a) Original normalized matrix VN (k); (b) Interpolation matrix Vip (k); (c) Extraction result of oil–water interface and droplets.
Energies 15 06638 g013
Figure 14. Extraction result of oil–water interfaces and droplets (0°): (a) Usw = 0.184 m/s, Uso = 0.162 m/s, ST; (b) Usw = 0.368 m/s, Uso = 0.236 m/s, ST&MI; (c) Usw = 0.737 m/s, Uso = 0.552 m/s, D W/O&D O/W.
Energies 15 06638 g014
Figure 15. Flow chart for the extraction of the oil–water interface.
Energies 15 06638 g015
Figure 16. Extraction process of 2D oil–water interface: (a) Interpolation matrix Vip (k); (b) Binarization processes (Vth (k)); (c) Remove dispersed droplets (Vinf (k)); (d) Interface extraction using watershed algorithm.
Energies 15 06638 g016
Figure 17. Oil–water interfaces extracted under typical oil–water flow conditions (0°): (a) Usw = 0.368 m/s, Uso = 0.236 m/s, ST&MI; (b) Usw = 0.737 m/s, Uso = 0.552 m/s, D W/O&D O/W.
Energies 15 06638 g017
Figure 18. Evolution characteristics of oil–water interfacial configuration at different pipe inclinations (Usw = 0.184 m/s): (a) Uso = 0.368 m/s, ST&MI, 0°; (b) Uso = 0.921 m/s, ST&MI, 0°; (c) Uso = 0.368 m/s, ST&MI, +5°; (d) Uso = 0.921 m/s, D W/O&D O/W, +5°; (e) Uso = 0.368 m/s, ST&MI, +10°; (f) Uso = 0.921 m/s, D W/O&D O/W, +10°.
Energies 15 06638 g018
Figure 19. Evolution characteristics of oil–water interfacial configuration at different pipe inclinations (Usw = 0.737 m/s): (a) Uso = 0.368 m/s, D W/O&D O/W, 0°; (b) Uso = 0.921 m/s, D W/O&D O/W, 0°; (c) Uso = 0.368 m/s, D W/O&D O/W, +5°; (d) Uso = 0.921 m/s, D W/O&D O/W WF, +5°; (e) Uso = 0.368 m/s, D W/O&D O/W, +10°; (f) Uso = 0.921 m/s, D W/O&D O/W WF, +10°; (g) Uso = 0.368 m/s, D W/O&D O/W, +15°; (h) Uso = 0.921 m/s, D W/O&D O/W WF, +15°.
Energies 15 06638 g019
Figure 20. Time series of the interfacial height under typical flow conditions (0°): (a) Usw = 0.184 m/s, Uso = 0.162 m/s, ST; (b) Usw = 0.368 m/s, Uso = 0.552 m/s, ST&MI; (c) Usw = 0.737 m/s, Uso = 0.921 m/s, D W/O&D O/W.
Energies 15 06638 g020
Figure 21. Average interfacial height under typical flow conditions. (a) Usw = 0.184 m/s; (b) Usw = 0.368 m/s; (c) Usw = 0.737 m/s.
Energies 15 06638 g021
Figure 22. Time series of the interfacial length under typical flow conditions (0°): (a) Usw = 0.184 m/s, Uso = 0.162 m/s, ST; (b) Usw = 0.368 m/s, Uso = 0.552 m/s, ST&MI; (c) Usw = 0.737 m/s, Uso = 0.921 m/s, D W/O&D O/W.
Energies 15 06638 g022
Figure 23. Average interfacial length at different pipe inclinations: (a) Usw = 0.184 m/s; (b) Usw = 0.368 m/s; (c) Usw = 0.737 m/s.
Energies 15 06638 g023
Table 1. WMS configuration and spatial resolution reported in the literature.
NO.AuthorMeasurement ObjectPipe Diameter (mm)WMS ConfigurationSpatial Resolution (mm)
1Prasser et al. [21] Air–water flow51.216 × 163.2
2Prasser et al. [30] Air–water flow19264 × 643
3Da Silva et al. [31]Gas–liquid–liquid flow50 × 5016 × 163.12
4Parsi et al. [26]Air–water flow76.216 × 164.76
5Xiao et al. [32]Air–water flow66 × 6616 × 162.06
6Lee et al. [33] Air–water flow60 × 60 5 × 53
Publisher’s Note: MDPI stays neutral with regard to jurisdictional claims in published maps and institutional affiliations.