
Sustainability Impact Assessment of Forest Bioenergy Value Chains in Quebec (Canada)—A ToSIA Approach


Abstract
:1. Introduction
2. Materials and Methods
2.1. Study Area
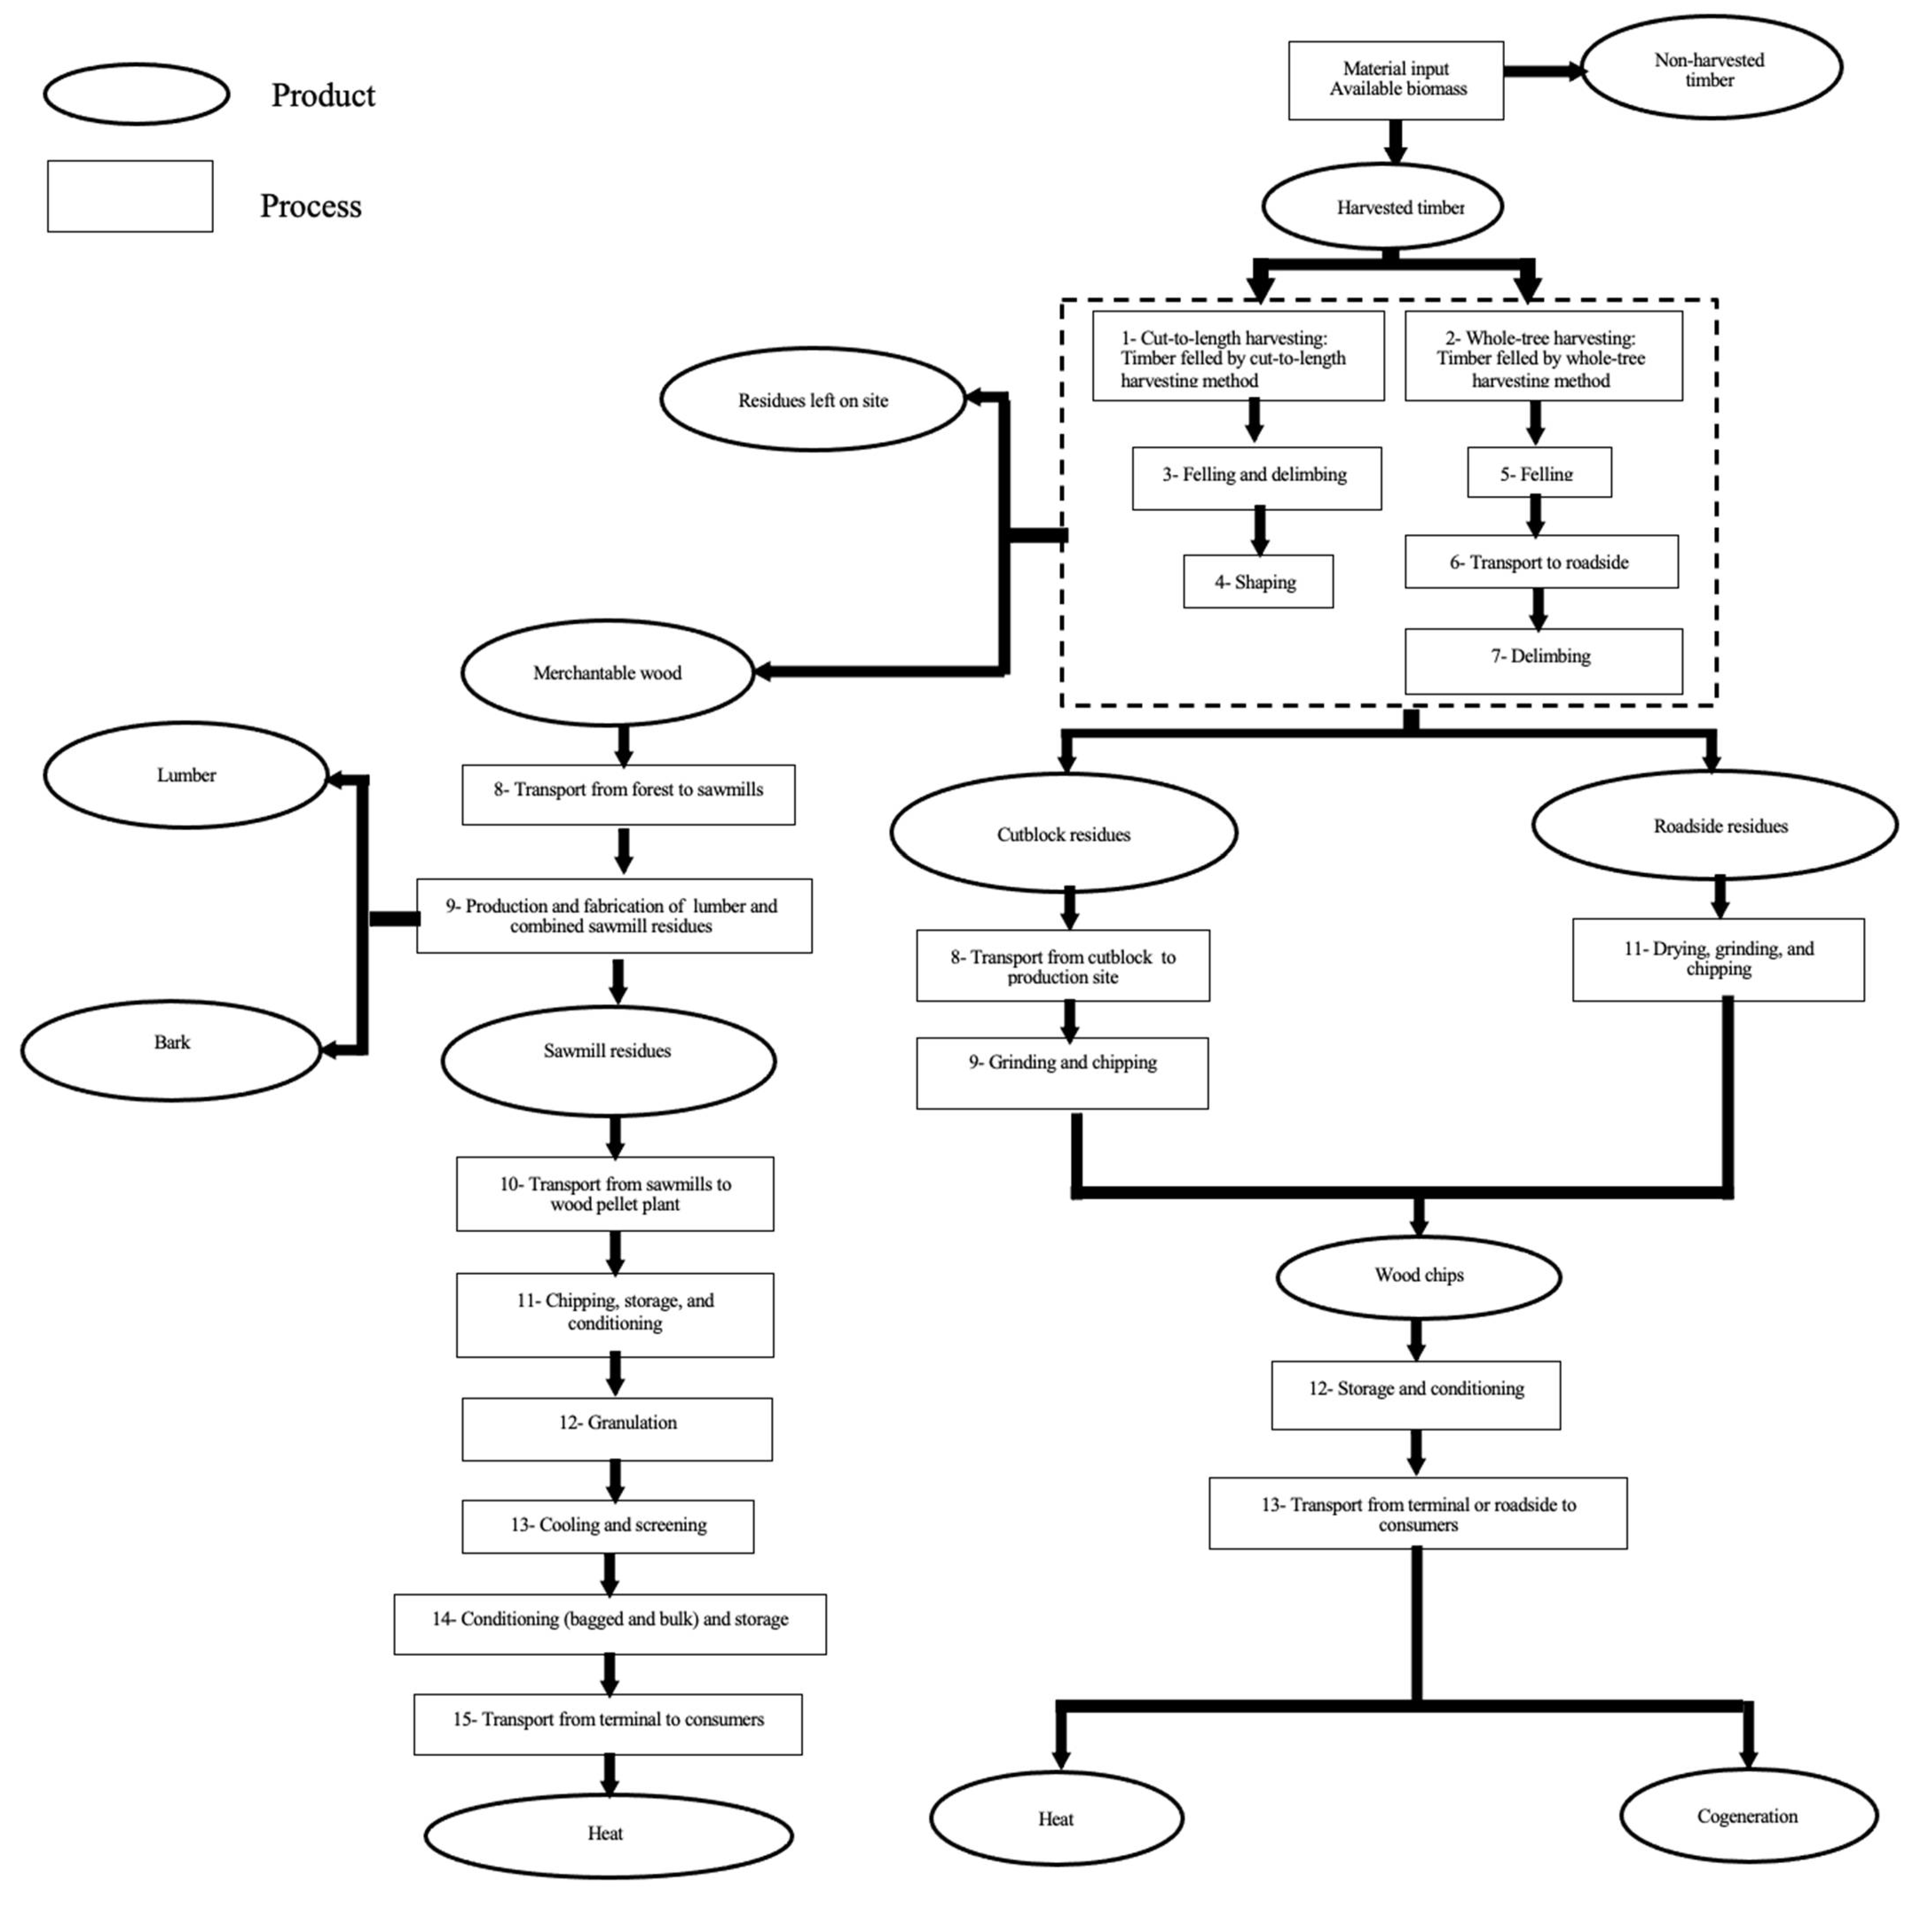
2.2. Value Chain Topology
2.3. Scenario Definition
2.3.1. Scenarios
- Policy measure scenarios
- Biomass supply and energy production scenarios
2.3.2. Description of Scenarios
- Business-as-usual (BaU) scenarios
- 1-
- Wood chipsThe baseline BaU scenario represents a picture of the Capitale-Nationale region’s forest bioenergy sector in 2008. For the wood chip value chains in the 2008BaU scenario, wood chips for bioenergy were assumed to be produced only from production residues.In the BaU scenarios for 2030 (2030HEAT-BaU and 2030CHP-BaU), wood chips for bioenergy would come both from production residues (70% of the total annual wood chip supply) and roadside residues (30% of the total annual supply).
- 2-
- Wood pelletsFor the wood pellet value chains in the 2008BaU scenario, available sawmill residues not already allocated to other products (such as pulp and paper or fiberboard) were assumed to be used for pellet production.In the 2030HEAT-BaU scenario, we assumed that about 95% of available sawmill residues would be allocated to pellet production.
- Increased biomass mobilization (B) scenarios
- 1-
- Wood chipsThe B scenarios were defined to represent instances in which all available residues from timber harvesting are mobilized for bioenergy. In the 2008B scenario, this translated into an input of 424,891 odt of harvest residues for wood chip production (all production residues). In the B scenarios for 2030 (2030HEAT-B and 2030CHP-B), the total input of harvest residues for wood chip production would be the same as in the 2008B scenario but 64% was assumed to be production residues and the remaining 36% roadside residues.It was assumed that all wood chip production in the 2030HEAT-B and 2030CHP-B scenarios would be used only for heating and only for cogeneration, respectively.
- 2-
- Wood pelletsFor the wood pellet value chains, the B scenarios represent instances in which a larger share of sawmill residues would be dedicated to wood pellet production. An input of 193,406 odt of residues were used in the 2008B scenario (corresponding to about 67% of total sawmill residues generated in the region) and 286,560 odt in the 2030HEAT-B scenario (corresponding to 100% of available sawmill residues).
- Harvesting methods (M) scenarios
- 1-
- Wood chipsThe M scenarios reflect instances in which a higher proportion of timber harvesting would be whole-tree harvesting operations and a greater share of the residues used for bioenergy would thus be generated using this method. In the 2008M scenario, it was assumed that 61% of available harvest residues would be generated by whole-tree harvesting operations and the remaining 39% using the cut-to-length method.In the M scenarios for 2030 (2030HEAT-M and 2030CHP-M), 95% of the average annual amount of available harvest residues would be recovered from whole-tree harvesting operations and 5% from cut-to-length harvesting operations.
- 2-
- Wood pelletsFor the wood pellet value chains in the 2008M scenario, 61% of sawmill residues generated by wood processing was assumed to come from timber harvested using the whole-tree harvesting method and 39% using the cut-to-length method. (Note that sawmill residues are used as feedstock for pellet production.)In the 2030HEAT-M scenario, 95% of the annual amount of sawmill residues generated by wood processing was assumed to come from timber harvested during whole-tree harvesting operations and 5% during cut-to-length harvesting operations.
- Energy generation systems (S) scenarios
- 1-
- Wood chipsIn the S scenarios, it was assumed only wood chips made from production residues would be used in heat production systems and only those made from roadside residues would be used in cogeneration production systems.This means that in the 2008S scenario, wood chips made from production residues would be used to heat buildings. In the 2030HEAT-S scenario, it was assumed that 94% of total available wood chips made from production residues would be mobilized. In the 2030CHP-S scenario, it was assumed that only wood chips generated from roadside residues would be used for cogeneration production; however, only 6% of roadside residues would actually be mobilized for this purpose.
- 2-
- Wood pelletsThe amount of sawmill residue used for pellet production in the 2008-S and 2030HEAT-S scenarios would be the same as in the 2008BaU and 2030HEAT-BaU scenarios, respectively.
2.4. Indicator Choice and Related Data
3. Results
3.1. Environmental Indicators
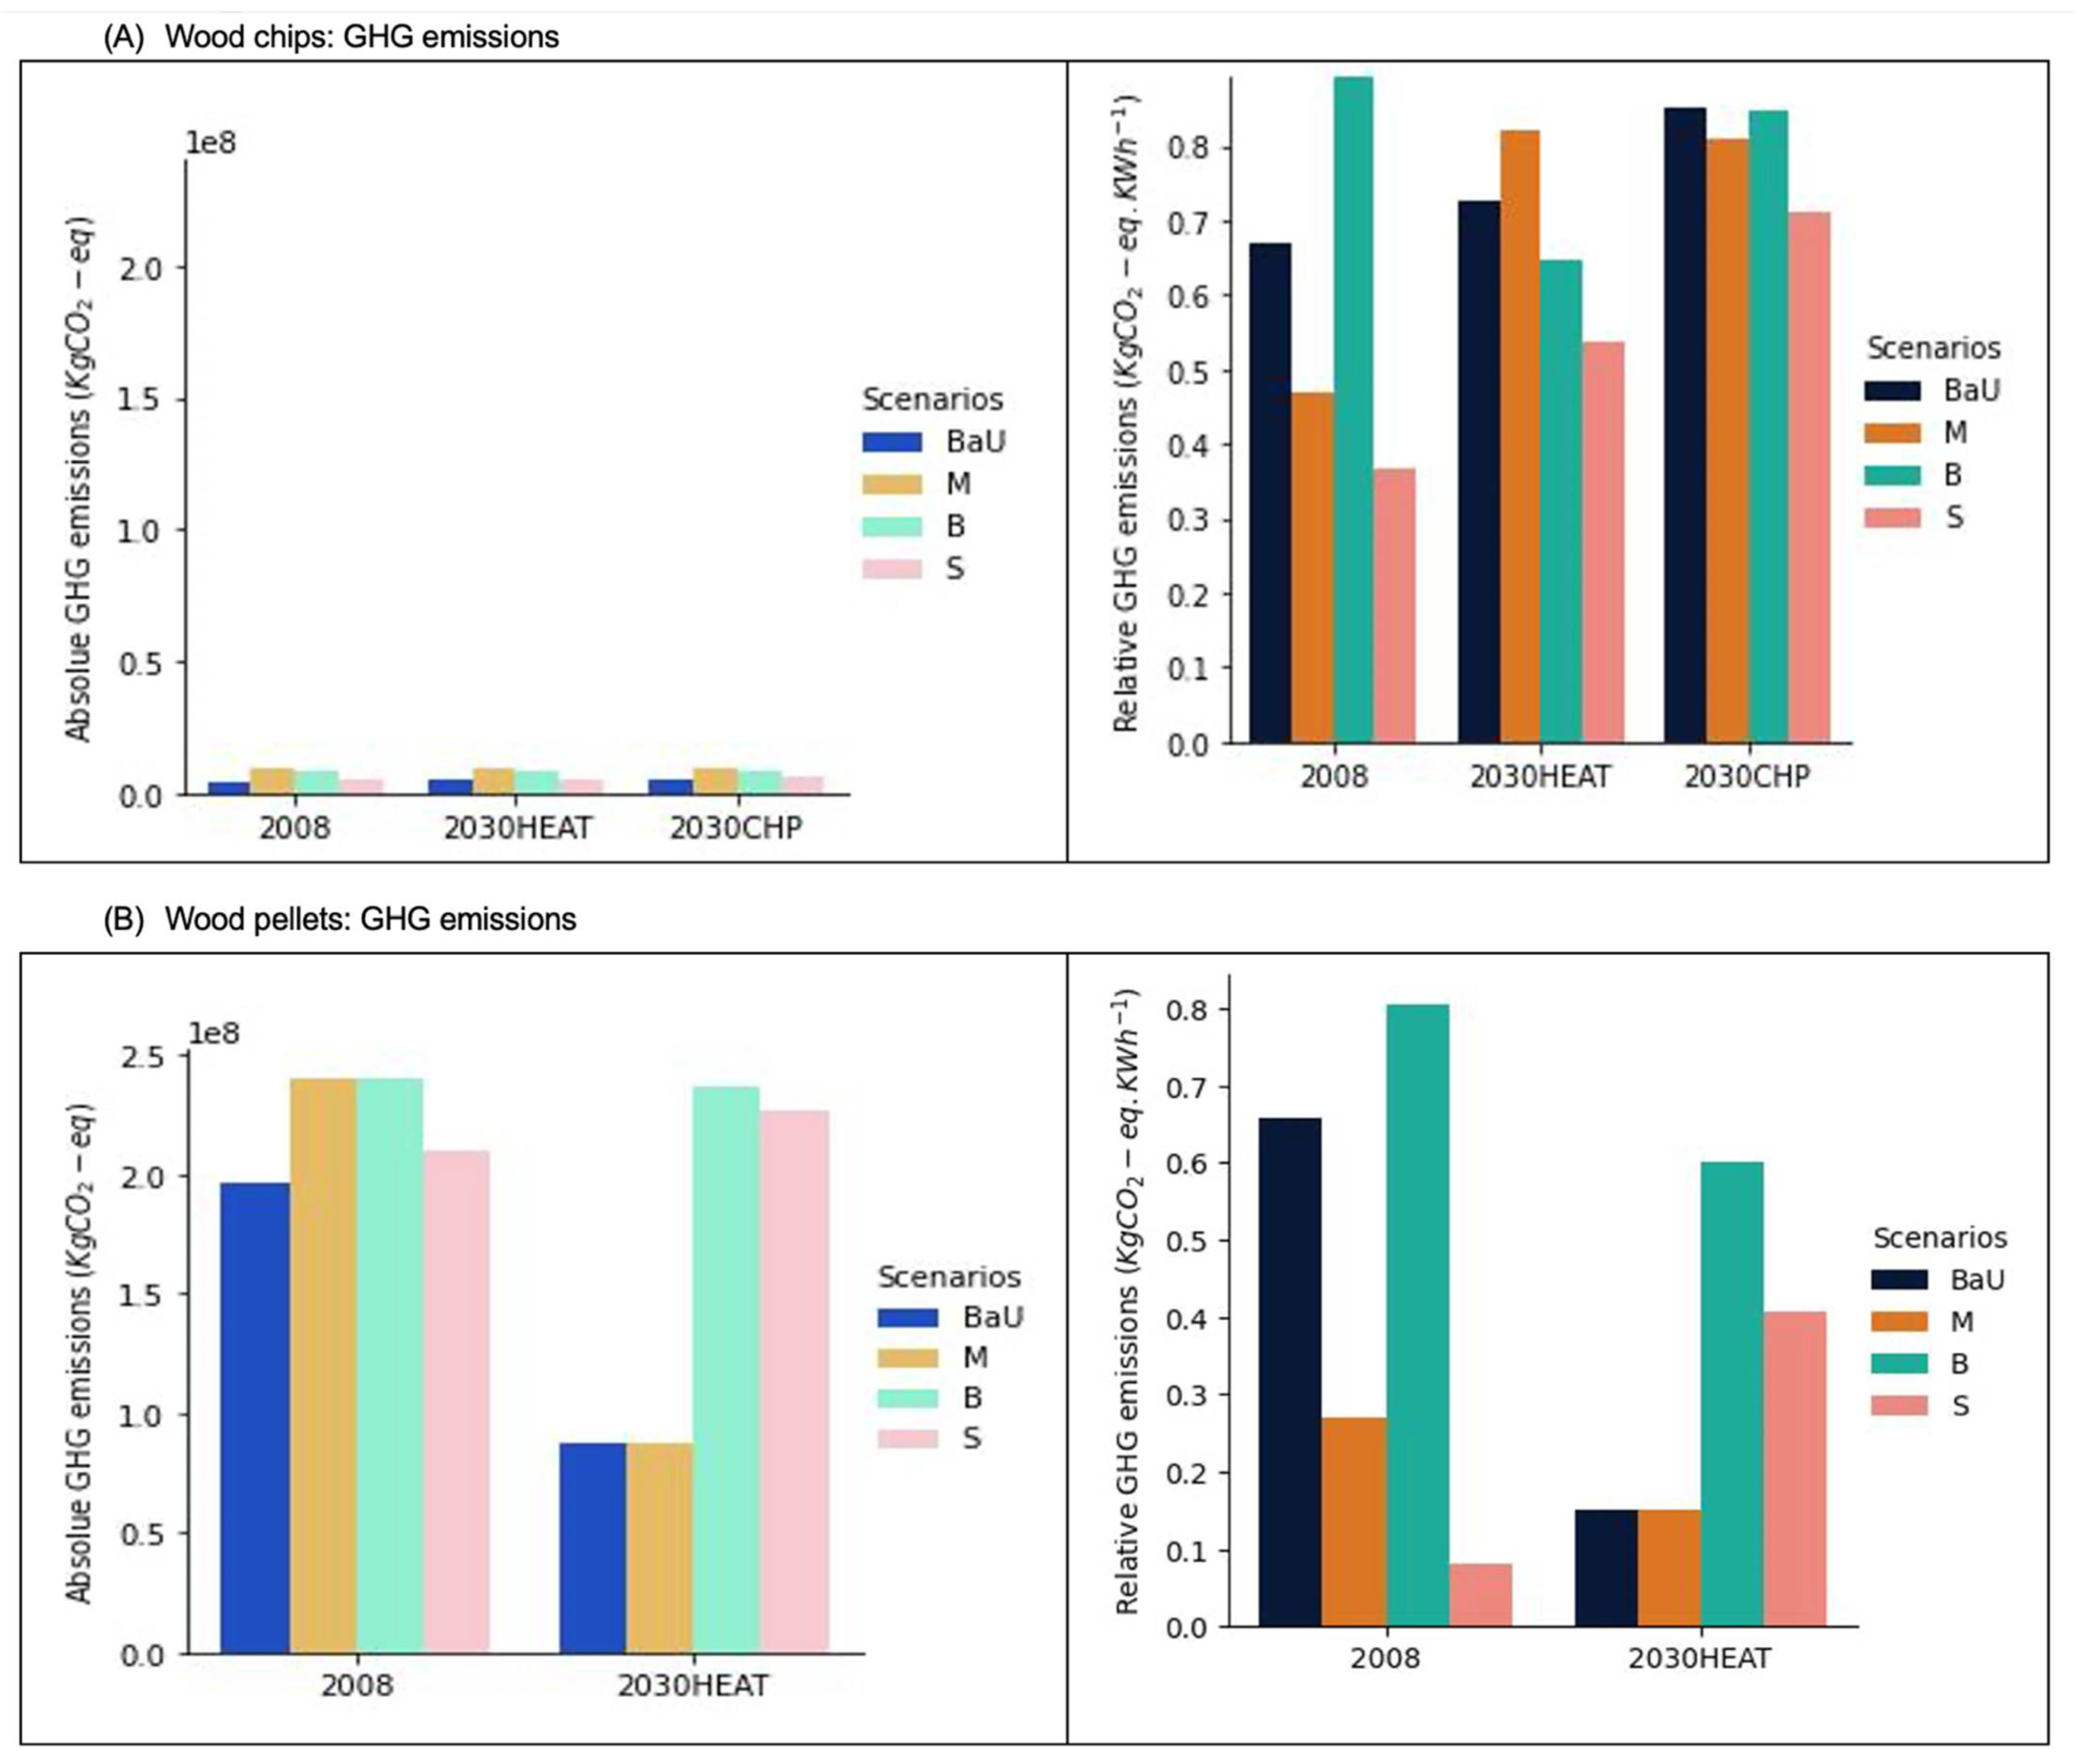
3.1.1. GHG Emissions
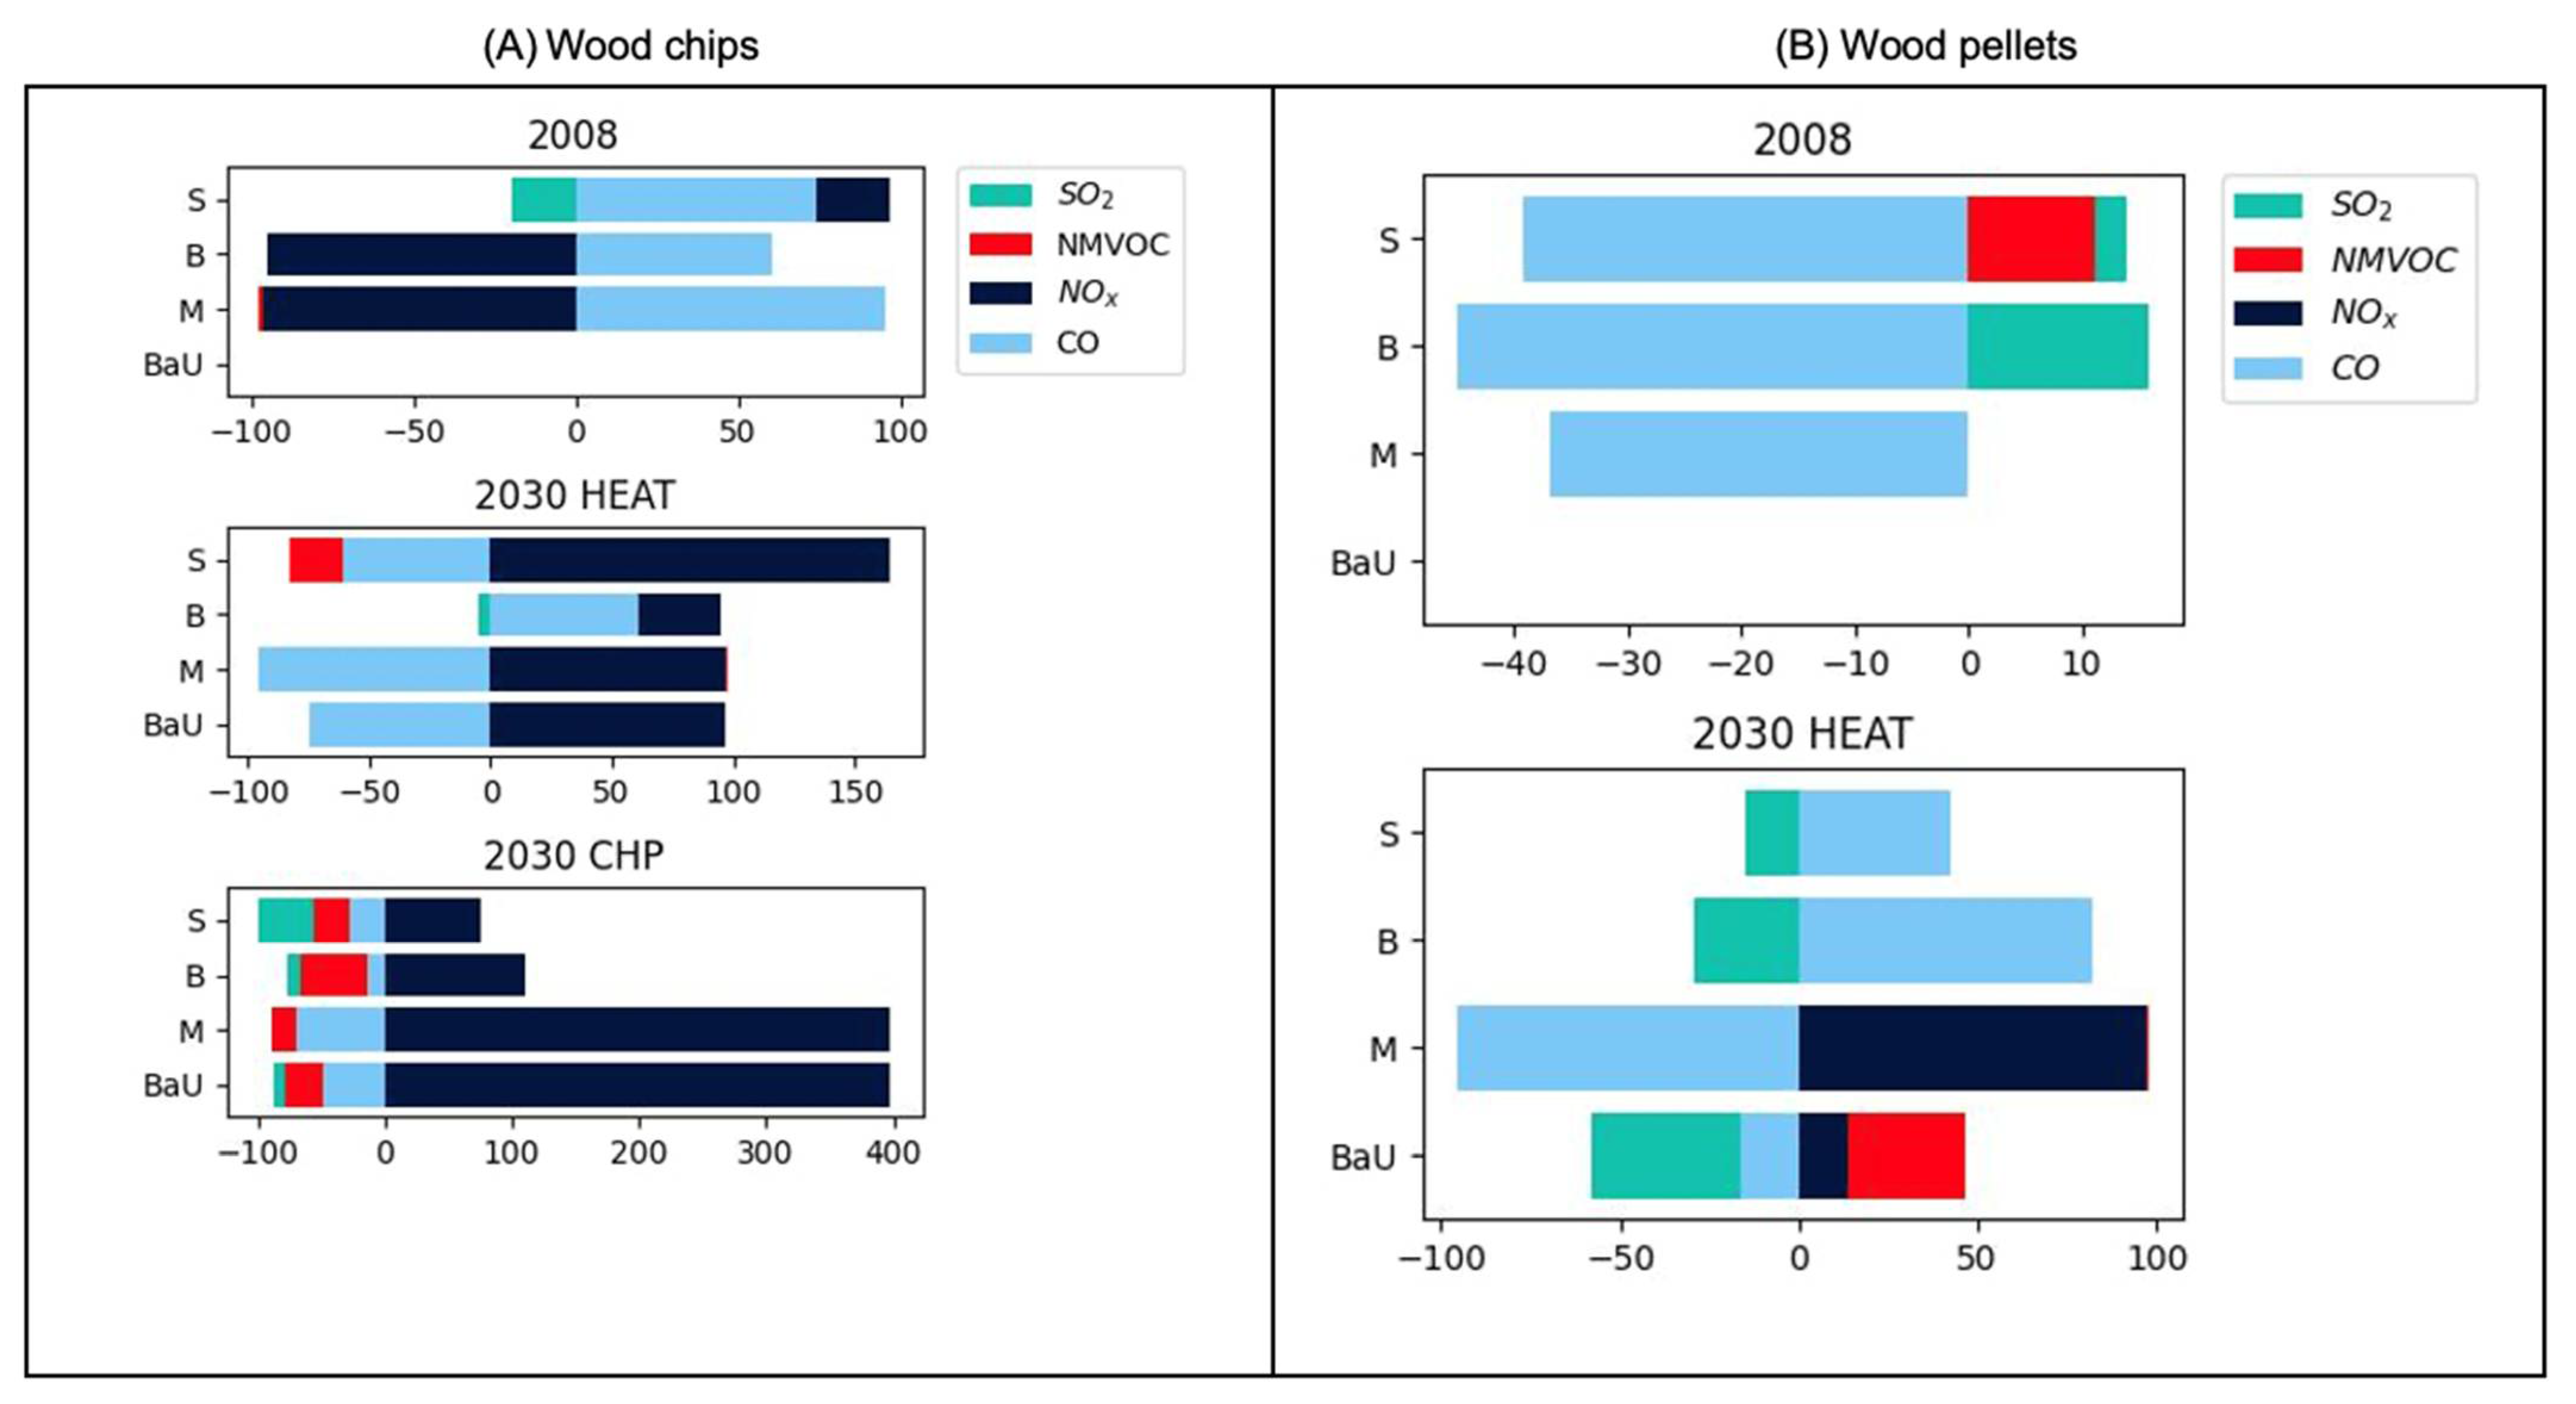
3.1.2. Air Pollution
- -
- CO, NMVOC, NOx, and SO2 emissionsThe impacts wood chip and wood pellet value chains have on air pollution were determined using five non-GHG emission indicators that are expressed as a percentage of 2008BaU emissions (Figure 3). The impacts of the various scenarios were mixed, with no clear pattern in the effect of the biomass supply and energy production scenarios. Nevertheless, most 2030 scenarios seem to show an increase in NOx emissions relative to the 2008BaU scenario (except for the 2030HEAT-S and -B scenarios for the wood pellet value chains) and a relative decrease in CO and SO2 emissions (except for the 2030HEAT-B scenario, which causes a relative increase in CO for both value chains). Most 2030 scenarios cause either no change or a relative decrease in NMVOC.
- -
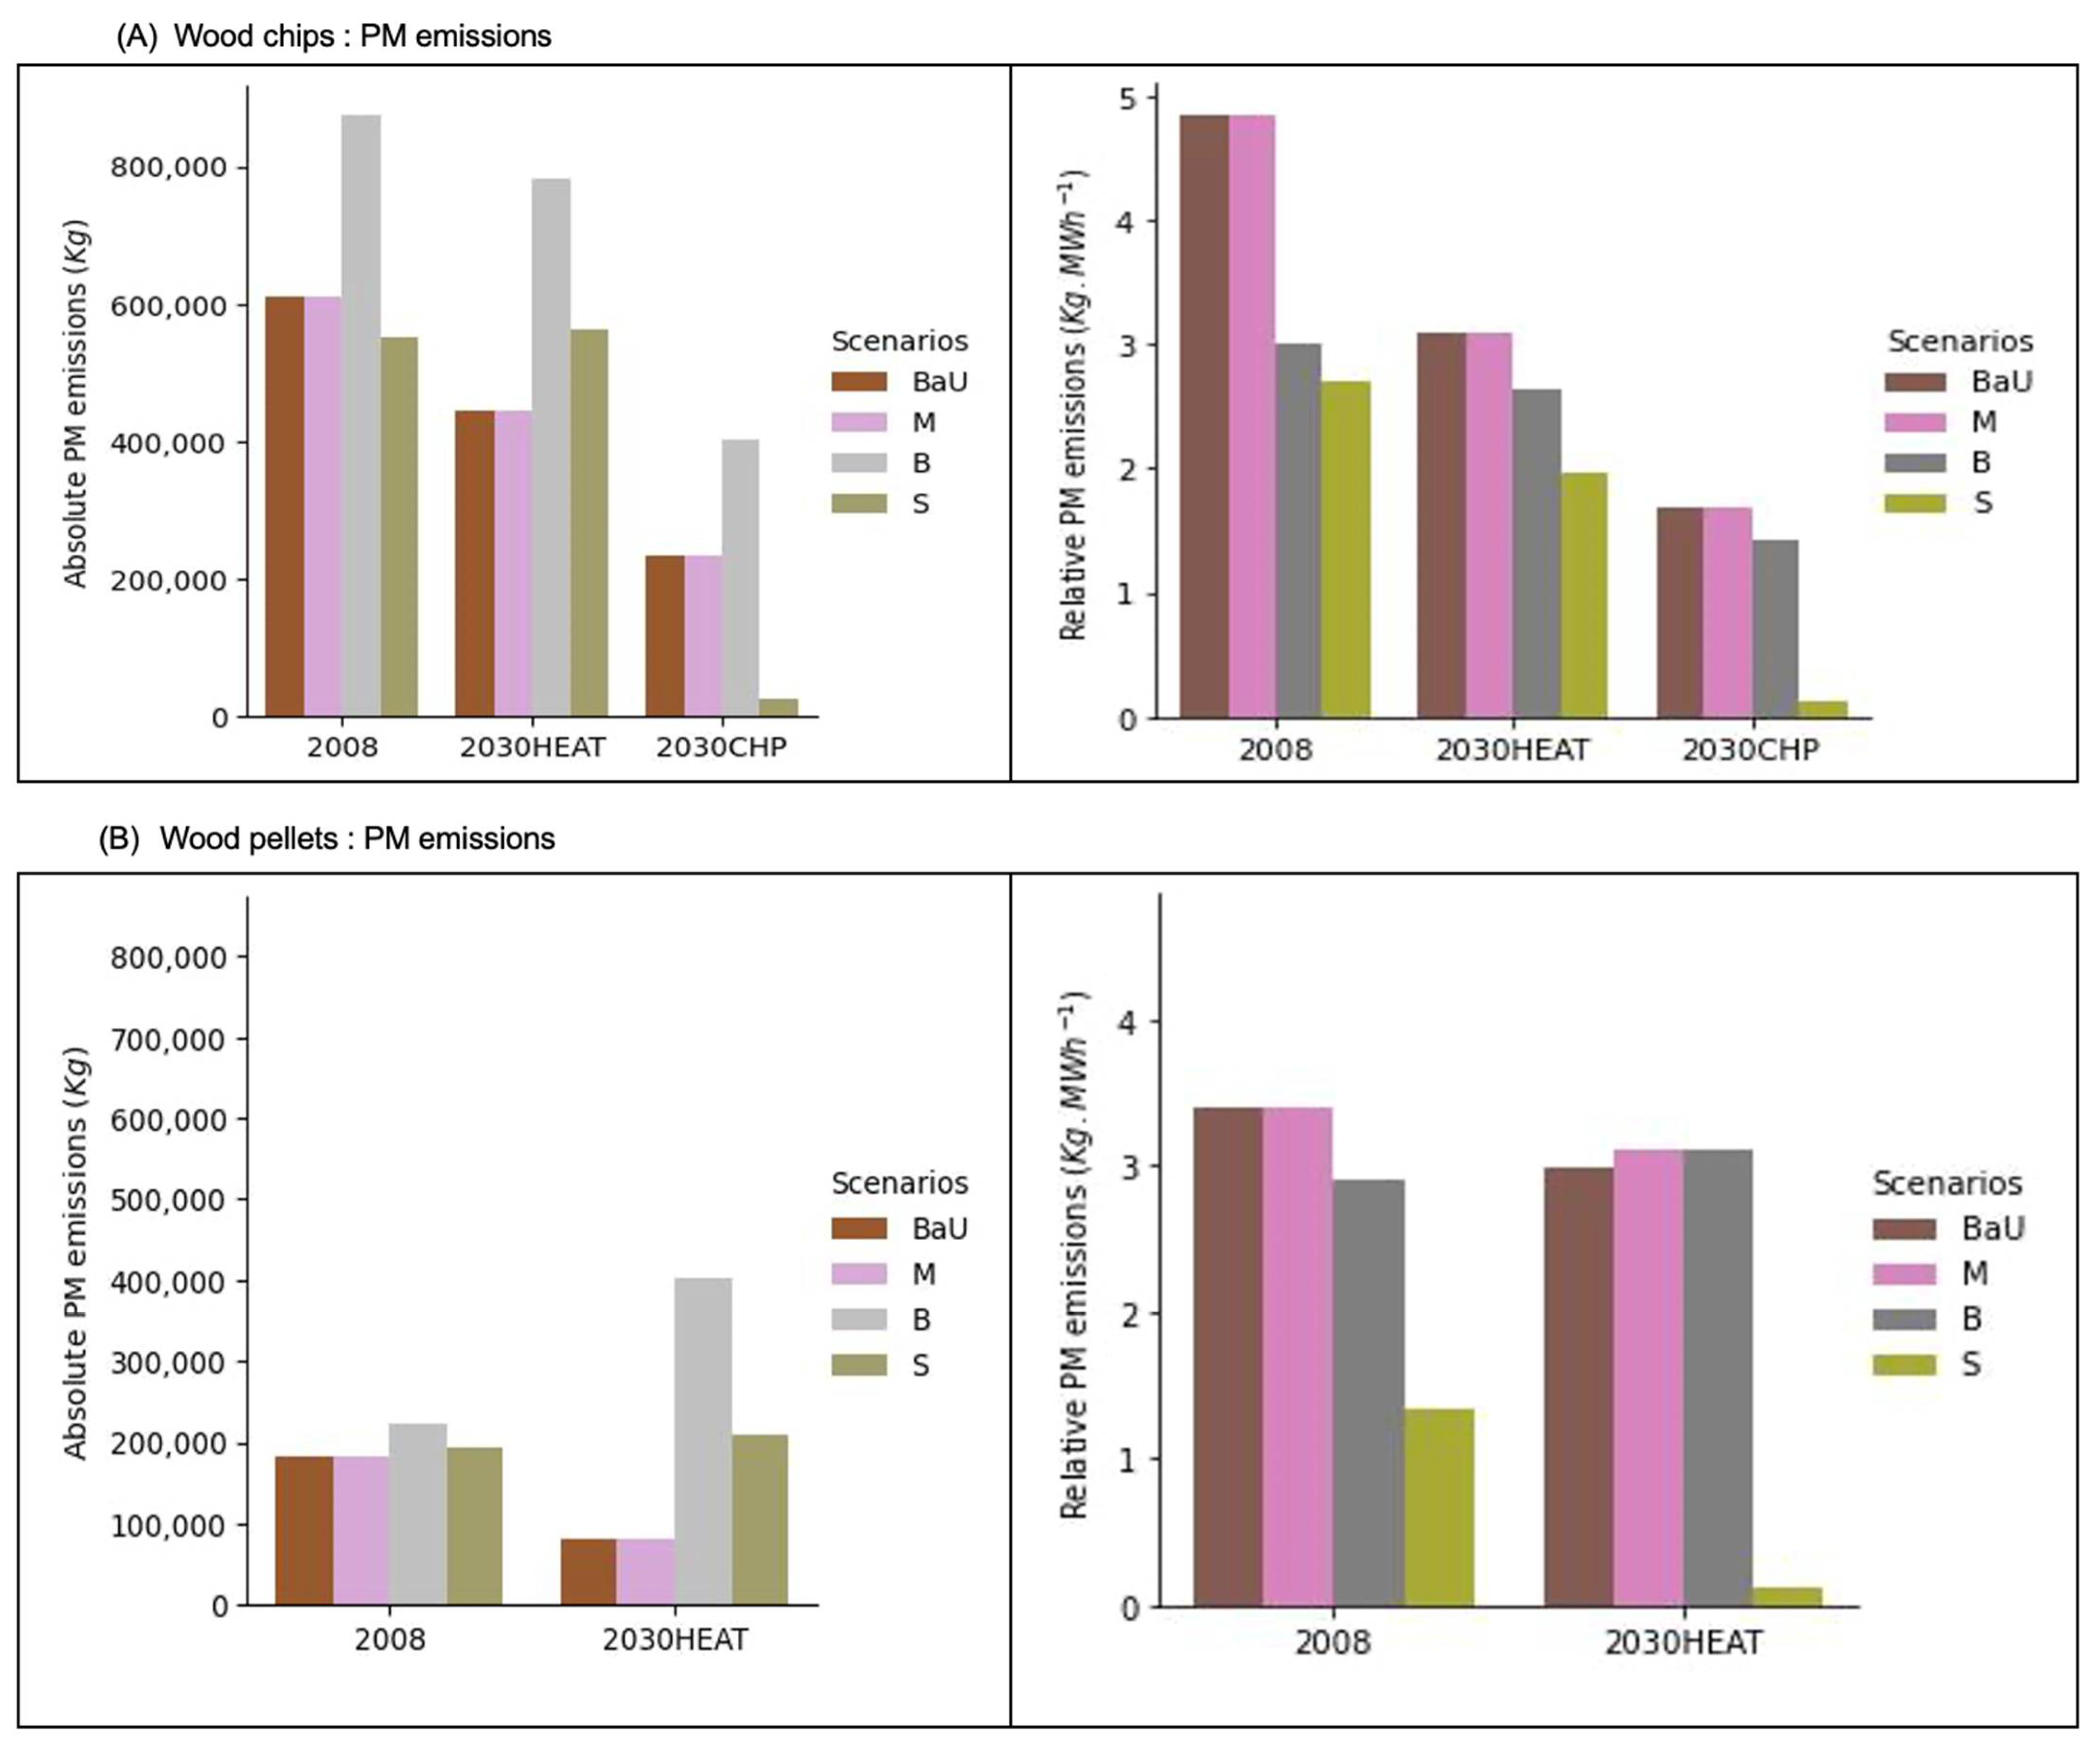
- Particulate matter emissions
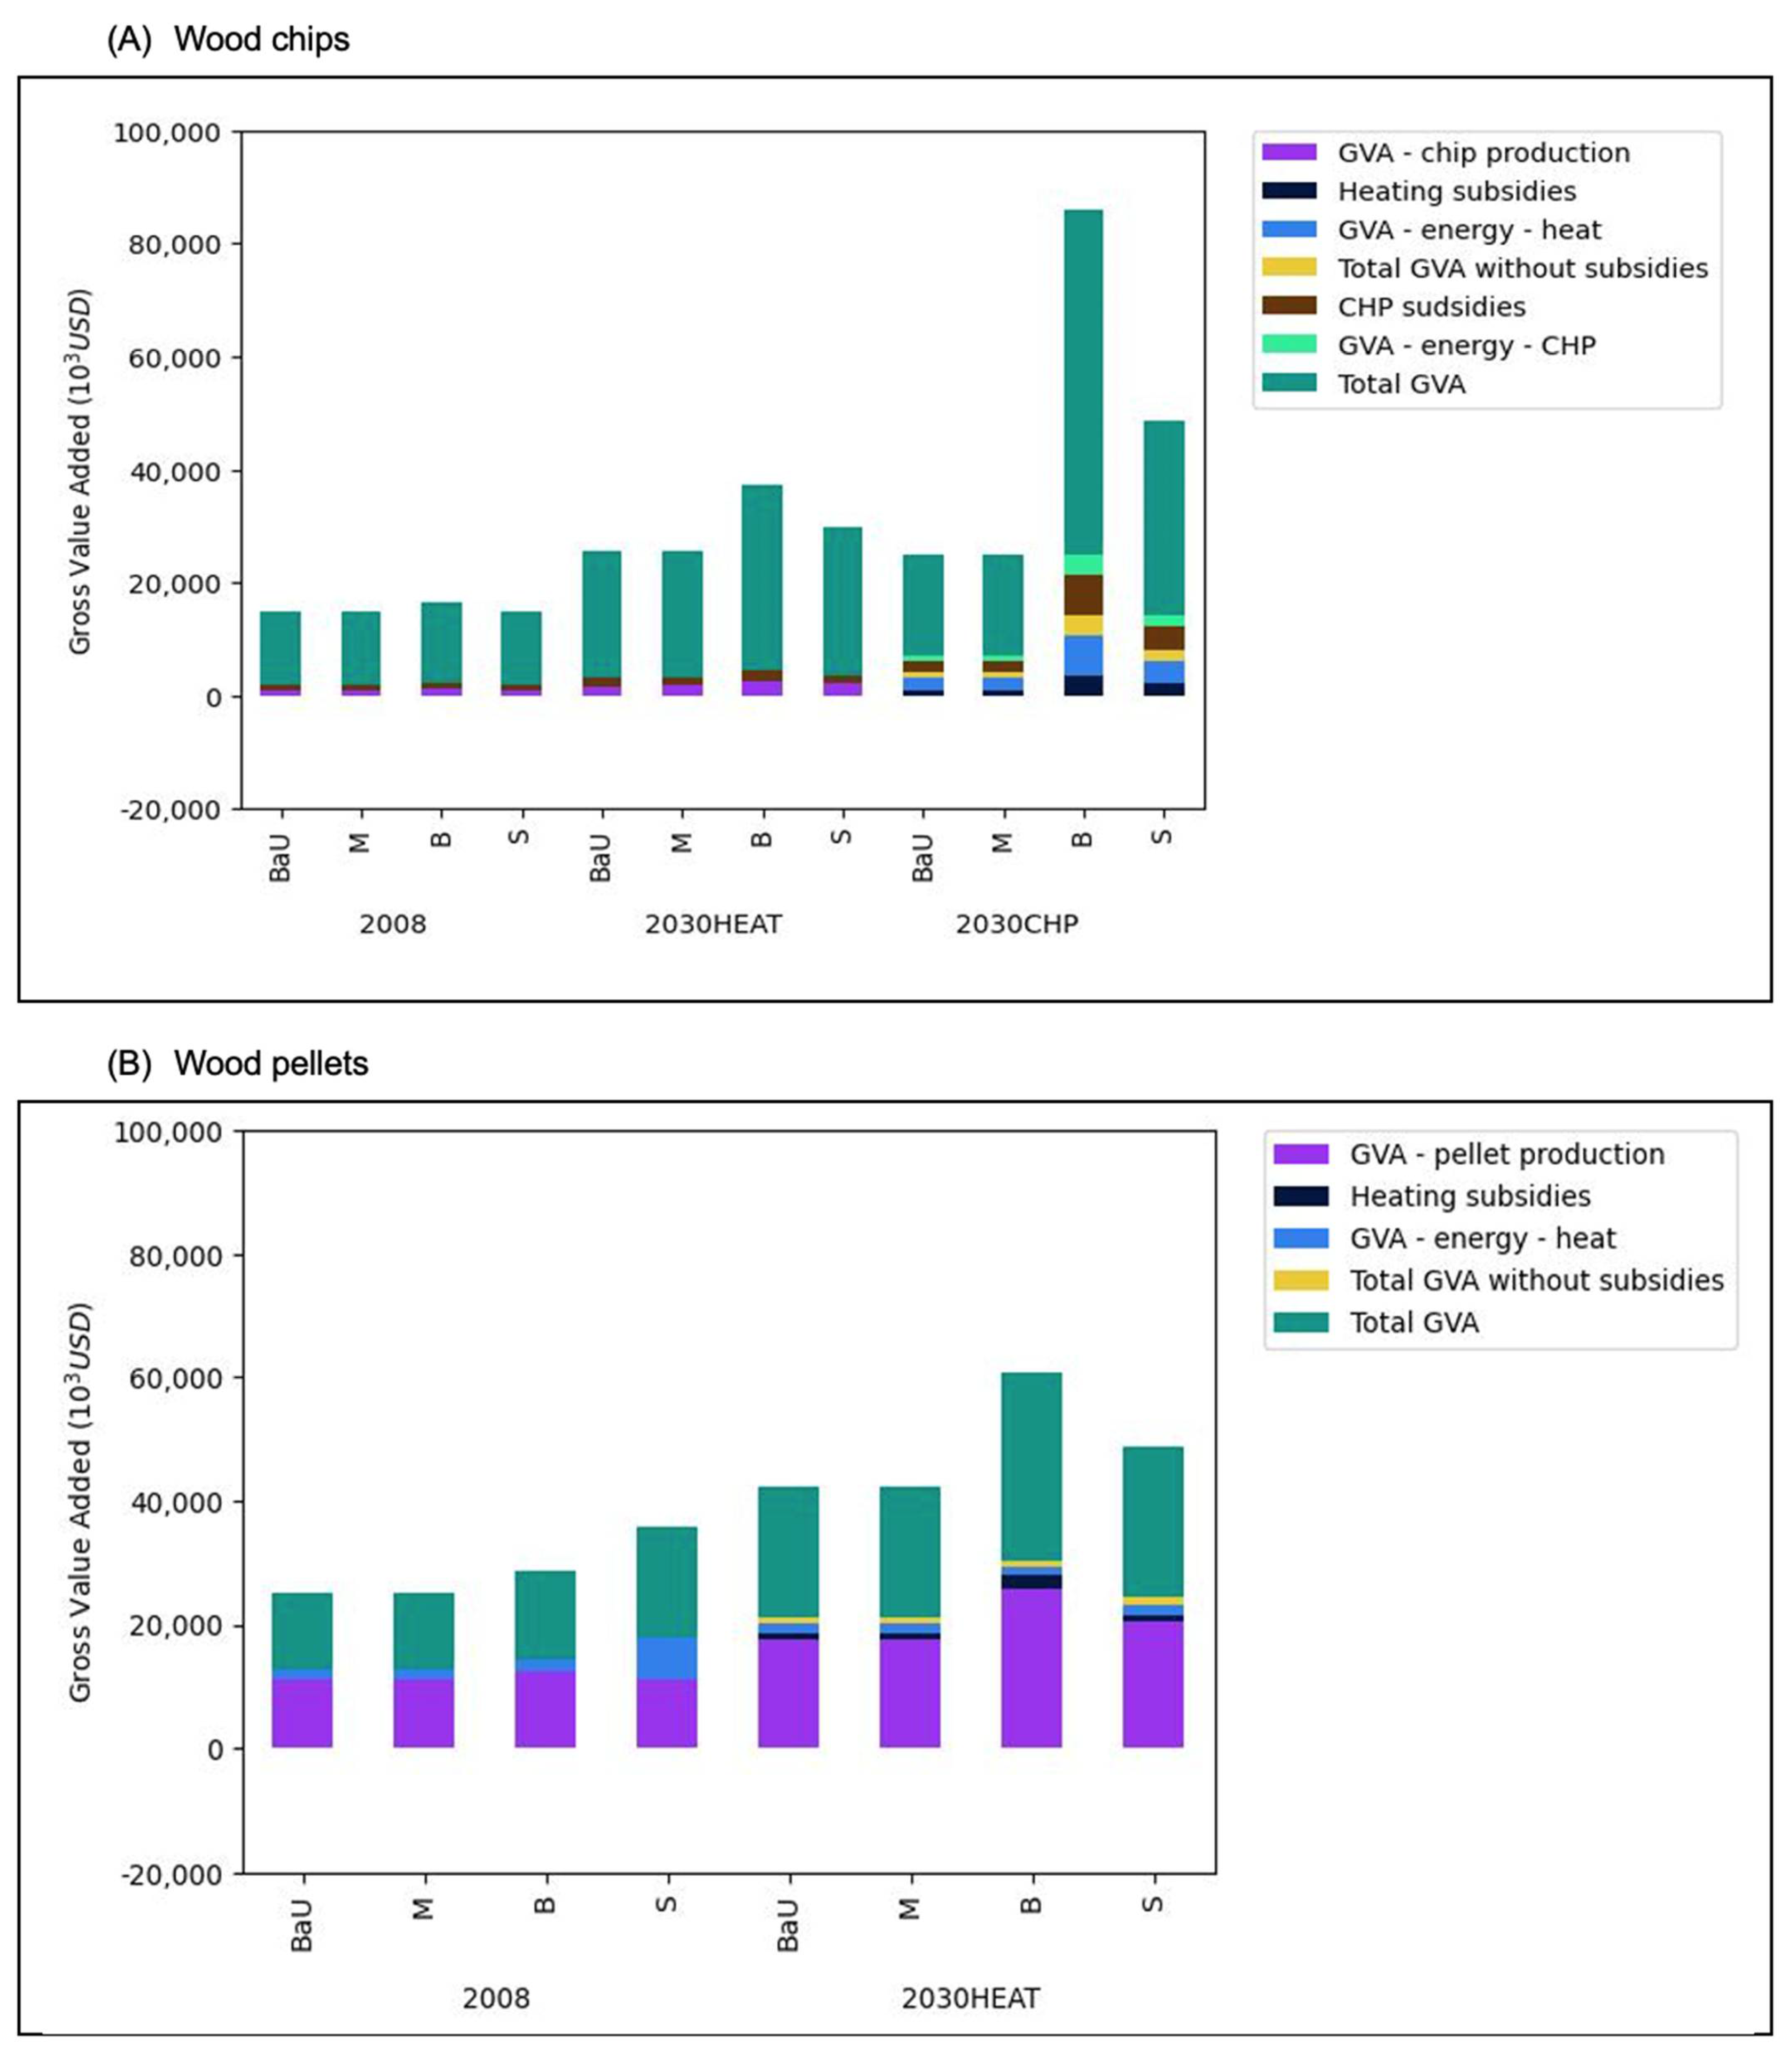
3.2. Economic Indicators
3.2.1. Gross Value Added (GVA)
3.2.2. Energy Generation
3.3. Social Indicators
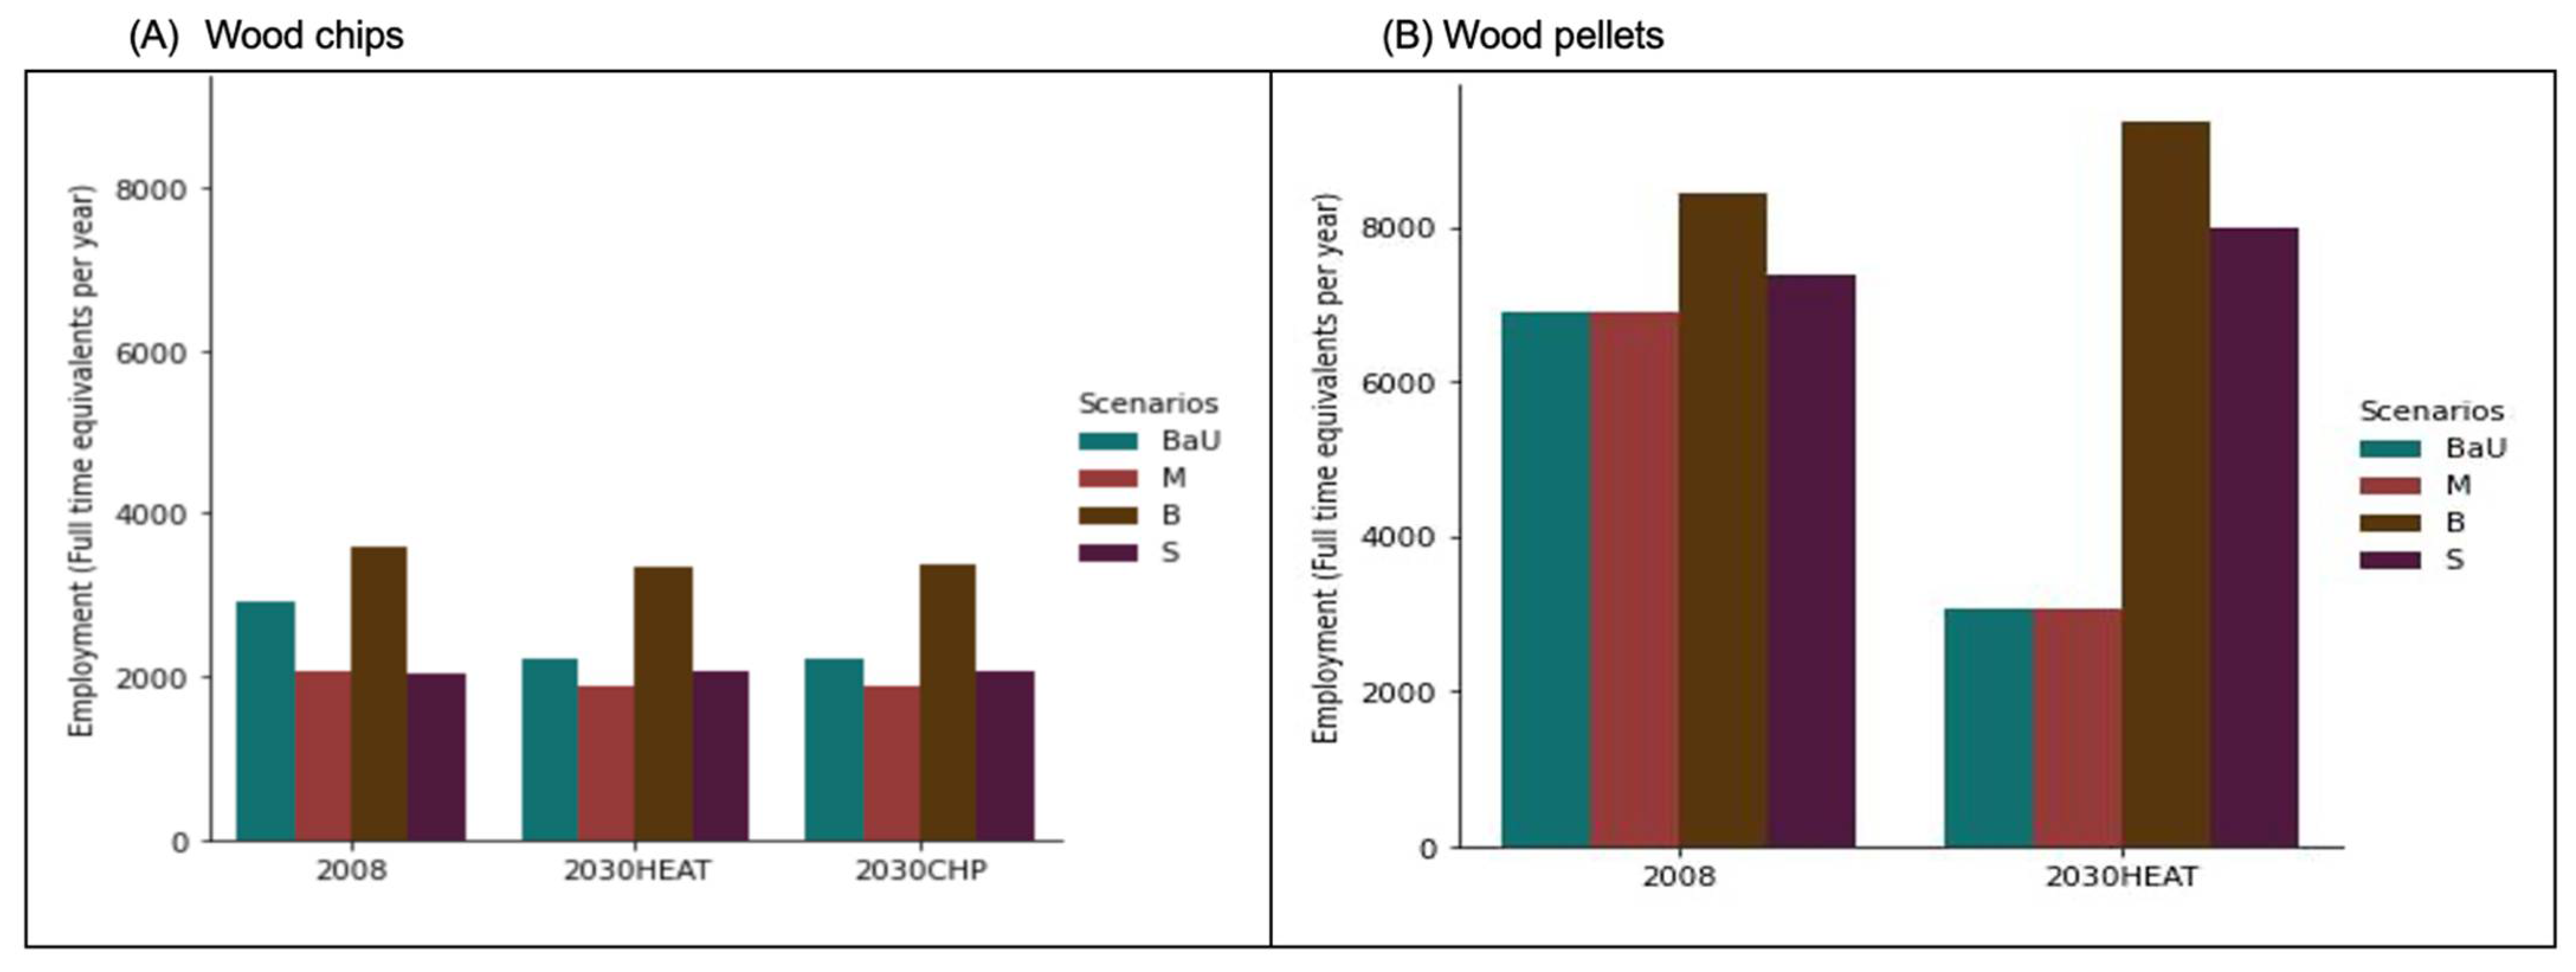
3.3.1. Employment
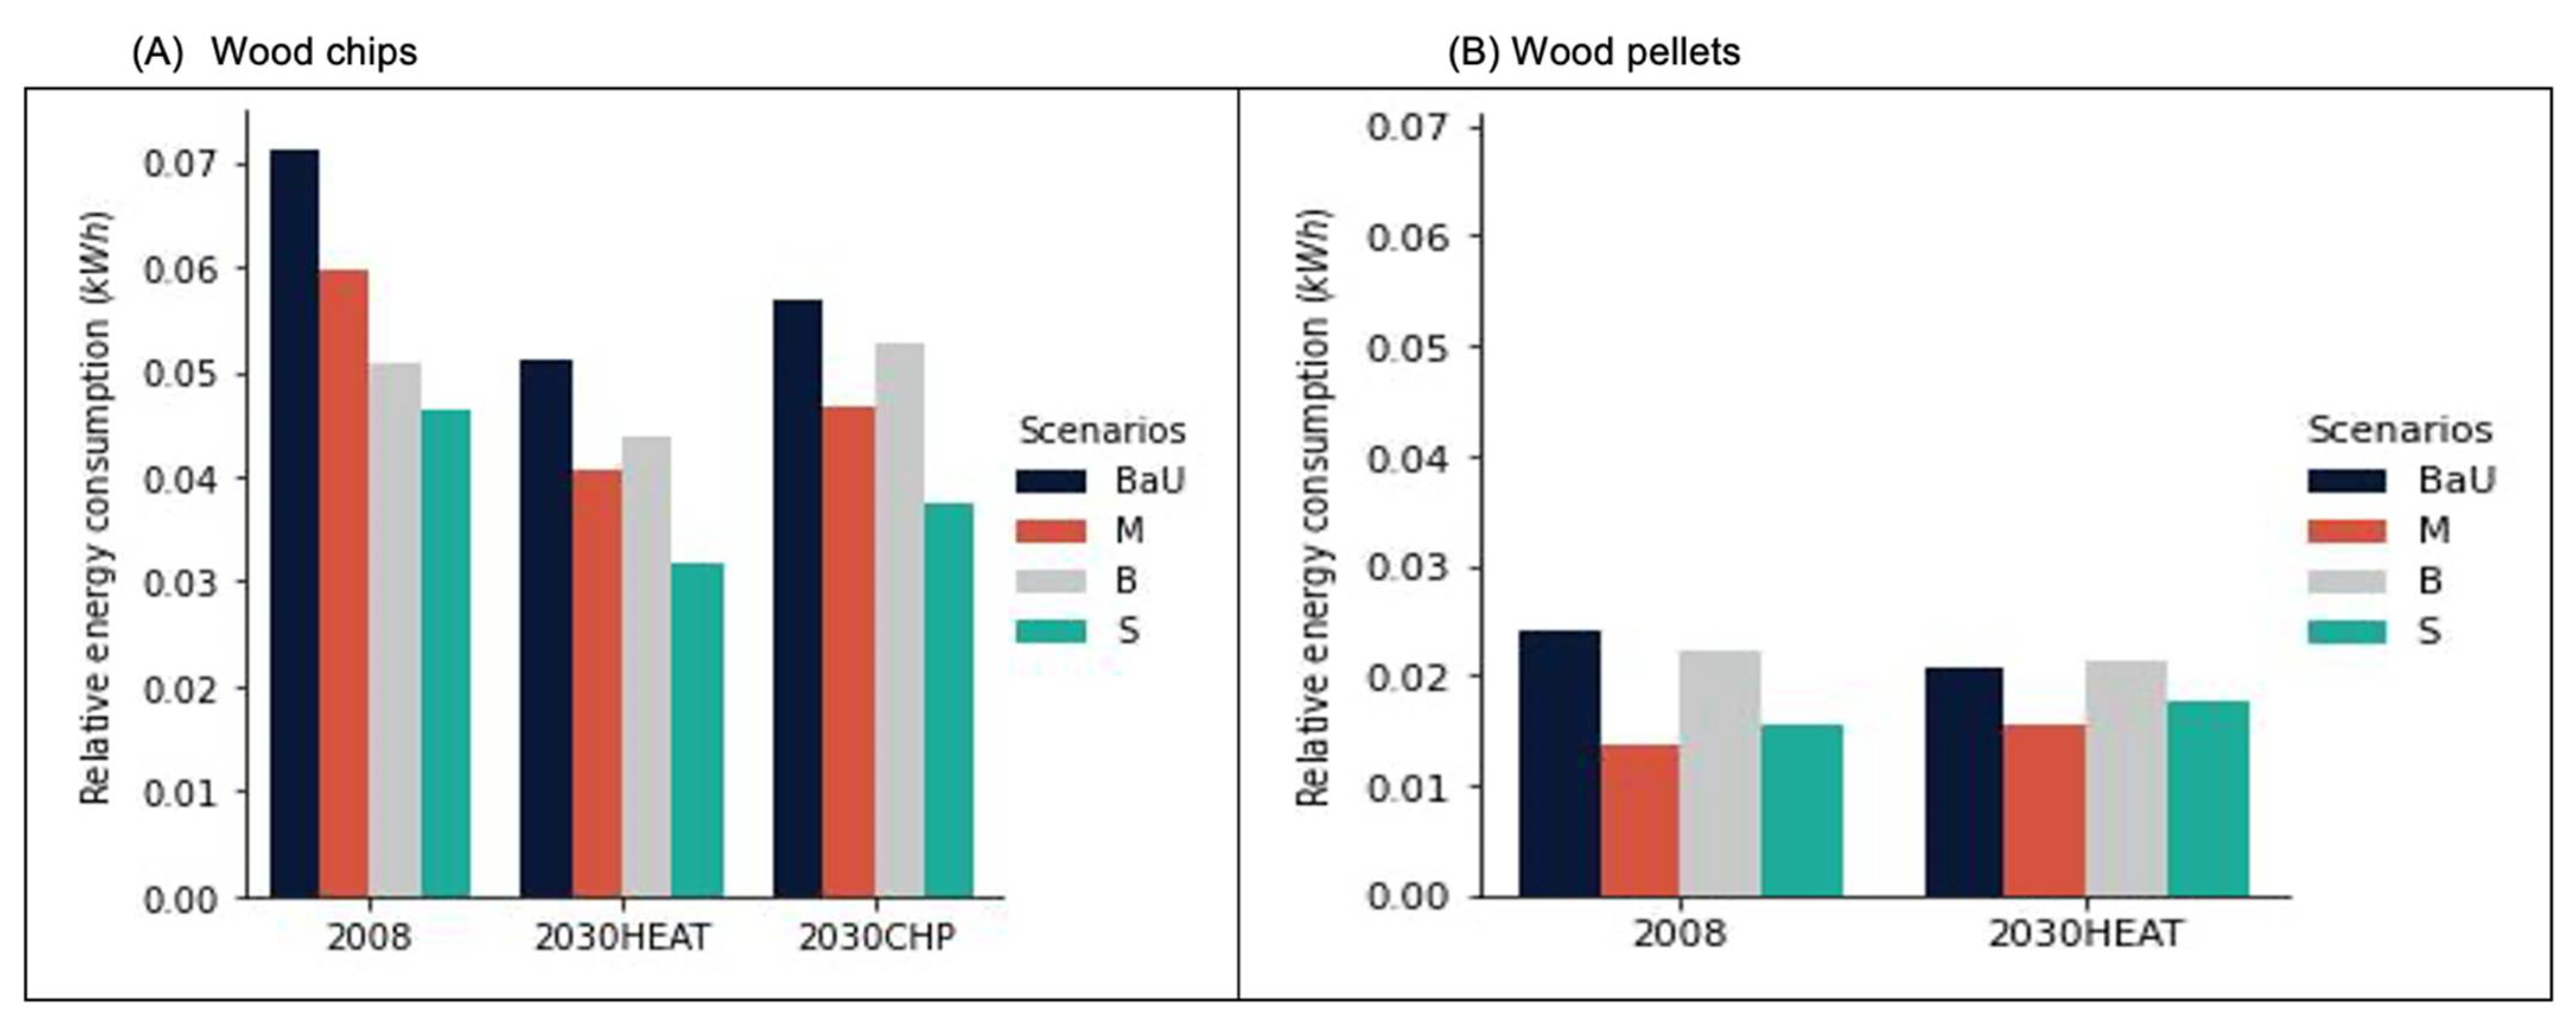
3.3.2. Energy Use
4. Discussion
4.1. Environmental Aspects
4.2. Economic Aspects
4.3. Social Aspects
5. Conclusions
Author Contributions
Funding
Institutional Review Board Statement
Informed Consent Statement
Data Availability Statement
Acknowledgments
Conflicts of Interest
References
- Kurz, W.; Dymond, C.C.; Stinson, G.; Rampley, G.J.; Neilson, E.T.; Carroll, A.L.; Ebata, T.; Safranyik, L. Mountain pine beetle and forest carbon feedback to climate change. Nature 2008, 452, 987–990. [Google Scholar] [CrossRef] [PubMed]
- Nabuurs, G.J.; Andrasko, K.; Benitez-Ponce, P.; Boer, R.; Dutschke, M.; Elsiddig, E. Forestry. In Climate Change 2007: Mitigation. Contribution of Working Group III to the Fourth Assessment Report of the Intergovernmental Panel on Climate Change; Metz, B., Davidson, O.R., Bosch, P.R., Dave, R., Meye, L.A., Eds.; Cambridge University Press: Cambridge, UK; New York, NY, USA, 2007. [Google Scholar]
- Röder, M.; Thiffault, E.; Martínez-Alonso, C.; Senez-Gagnon, F.; Paradis, L.; Thornley, P. Understanding the timing and variation of greenhouse gas emissions of forest bioenergy systems. Biomass Bioenergy 2019, 121, 99–114. [Google Scholar] [CrossRef]
- Smeets, E.M.W.; Faaij, A.P.C. Bioenergy potentials from forestry in 2050 An assessment of the drivers that determine the potentials. Clim. Chang. 2007, 81, 353–390. [Google Scholar] [CrossRef]
- IEA Bioenergy. IEA Bioenergy: Technology Collaboration Programme Annual Report 2020; Report No. 2; IEA Bioenergy: Paris, France, 2021; p. 148. Available online: https://www.ieabioenergy.com/wp-content/uploads/2021/04/IEAB-Annual-Report-2020.pdf (accessed on 5 July 2021).
- Kellomäki, S.; Kilpeläinen, A.; Alam, A. (Eds.) Forest BioEnergy Production; Springer: New York, NY, USA, 2013; Available online: http://link.springer.com/10.1007/978-1-4614-8391-5 (accessed on 17 September 2020).
- Martire, S.; Tuomasjukka, D.; Lindner, M.; Fitzgerald, J.; Castellani, V. Sustainability impact assessment for local energy supplies’ development—The case of the alpine area of Lake Como, Italy. Biomass Bioenergy 2015, 83, 60–76. [Google Scholar] [CrossRef]
- Ke, S.; Pan, C. Forestry Actions to Tackle Climate Change and Its Impact on Carbon Emission and Employment Creation in China—ProQuest. Manag. Eng. 2011, 3, 1838–5745. [Google Scholar]
- Manfren, M.; Caputo, P.; Costa, G. Paradigm shift in urban energy systems through distributed generation: Methods and models. Appl. Energy 2011, 88, 1032–1048. [Google Scholar] [CrossRef]
- Openshaw, K. Biomass energy: Employment generation and its contribution to poverty alleviation. Biomass Bioenergy 2010, 34, 365–378. [Google Scholar] [CrossRef]
- Sastresa, E.L.; Usón, A.A.; Bribián, I.Z.; Scarpellini, S. Local impact of renewables on employment: Assessment methodology and case study. Renew. Sustain. Energy Rev. 2010, 14, 679–690. [Google Scholar] [CrossRef]
- Pergola, M.; Gialdini, A.; Celano, G.; Basile, M.; Caniani, D.; Cozzi, M.; Gentilesca, T.; Mancini, I.M.; Pastore, V.; Romano, S.; et al. An environmental and economic analysis of the wood-pellet chain: Two case studies in Southern Italy. Int. J. Life Cycle Assess. 2018, 23, 1675–1684. [Google Scholar] [CrossRef]
- Mansuy, N.; Thiffault, E.; Lemieux, S.; Manka, F.; Paré, D.; Lebel, L. Sustainable biomass supply chains from salvage logging of fire-killed stands: A case study for wood pellet production in eastern Canada. Appl. Energy 2015, 154, 62–73. [Google Scholar] [CrossRef]
- Muñoz, E.; Vargas, S.; Navia, R. Environmental and economic analysis of residual woody biomass transport for energetic use in Chile. Int. J. Life Cycle Assess. 2015, 20, 1033–1043. [Google Scholar] [CrossRef]
- Hughes, N.M.; Shahi, C.; Pulkki, R. A Review of the Wood Pellet Value Chain, Modern Value/Supply Chain Management Approaches, and Value/Supply Chain Models. J. Renew. Energy 2014, 2014, 654158. [Google Scholar] [CrossRef]
- Thiffault, E.; Smith, C.T.; Junginger, M.; Berndes, G. Mobilisation of Forest Bioenergy in the Boreal and Temperate Biomes: Challenges, Opportunities and Case Studies; Academic Press: Cambridge, MA, USA, 2016. [Google Scholar]
- Allen, R.W.; Carlsten, C.; Karlen, B.; Leckie, S.; van Eeden, S.; Vedal, S.; Wong, I.; Brauer, M. An Air Filter Intervention Study of Endothelial Function among Healthy Adults in a Woodsmoke-impacted Community. Am. J. Respir. Crit. Care Med. Am. Thorac. Soc.-AJRCCM 2011, 183, 1222–1230. [Google Scholar] [CrossRef] [PubMed]
- Allen, R.W.; Mar, T.; Koenig, J.; Liu, L.-J.S.; Gould, T.; Simpson, C.; Larson, T. Changes in Lung Function and Airway Inflammation among Asthmatic Children Residing in a Woodsmoke-Impacted Urban Area. Inhal. Toxicol. 2008, 20, 423–433. [Google Scholar] [CrossRef] [PubMed]
- Delfino, R.J.; Staimer, N.; Tjoa, T.; Polidori, A.; Arhami, M.; Gillen, D.L.; Kleinman, M.T.; Vaziri, N.D.; Longhurst, J.; Zaldivar, F.; et al. Circulating Biomarkers of Inflammation, Antioxidant Activity, and Platelet Activation Are Associated with Primary Combustion Aerosols in Subjects with Coronary Artery Disease. Environ. Health Perspect. 2008, 116, 898–906. [Google Scholar] [CrossRef]
- Wolfslehner, B.; Brüchert, F.; Fischbach, J.; Rammer, W.; Becker, G.; Lindner, M.; Lexer, M.J. Exploratory multi-criteria analysis in sustainability impact assessment of forest-wood chains: The example of a regional case study in Baden-Württemberg. Eur. J. For. Res. 2012, 131, 47–56. [Google Scholar] [CrossRef]
- Päivinen, R.; Lindner, M.; Rosén, K.; Lexer, M.J. A concept for assessing sustainability impacts of forestry-wood chains. Eur. J. For. Res. 2012, 131, 7–19. [Google Scholar] [CrossRef]
- Pülzl, H.; Prokofieva, I.; Berg, S.; Rametsteiner, E.; Aggestam, F.; Wolfslehner, B. Indicator development in sustainability impact assessment: Balancing theory and practice. Eur. J. For. Res. 2012, 131, 35–46. [Google Scholar] [CrossRef]
- Gouvernement du Québec. L’énergie des Québécois: Source de Croissance: Politique Énergétique 2030; Gouvernement du Québec: Quebec City, QC, Canada, 2016.
- Whitmore, J.; Pineau, P.-O. État de L’énergie au Québec 2021. Chaire Gest. Sect. Lénergie. 2021. Available online: https://energie.hec.ca/eeq/ (accessed on 13 July 2021).
- MFFP. Statistiques Forestières. Ministère For. Faune Parcs. 2020. Available online: https://mffp.gouv.qc.ca/les-forets/connaissances/statistiques-forestieres/ (accessed on 2 October 2020).
- MEI. Capitale-Nationale/Démographie—MEI. Ministère L’Économie L’Innovation. 2021. Available online: https://www.economie.gouv.qc.ca/pages-regionales/capitale-nationale/portrait-regional/demographie/ (accessed on 8 June 2021).
- MFFP. Ressources et Industries Forestières du Québec, Portrait Statistique 2020. 2021, p. 160. Available online: https://mffp.gouv.qc.ca/wp-content/uploads/PortraitStatistique_2020.pdf (accessed on 13 July 2021).
- QWEB. Quebec Wood Export Bureau. Quebec Wood Export Bur. 2018. Available online: https://quebecwoodexport.com/ (accessed on 23 July 2020).
- Vision Biomasse. Vitrine Projets Chauffage Biomasse Forestière Vision Biomasse Québec. Vis. Biomasse Qué. 2022. Available online: https://visionbiomassequebec.org/vitrine-de-projets-chauffage-a-la-biomasse-forestiere/ (accessed on 27 January 2022).
- QWEB. Granules de Bois—Manufacturiers—QWEB. Quebec Wood Export Bur. 2022. Available online: https://quebecwoodexport.com/produits/granules-de-bois/manufacturiers/ (accessed on 27 January 2022).
- WSP. Inventaire de Biomasse Disponivle pour Produire de la Bioénergie et Portrait de la Bioénergie sur le Territoire Québécois. Canada, Québec: Rapport Réalisé par WSP Canada Inc. pour le Compte du Ministère de l’Énergie et des Ressources Naturelles; WSP: Montreal, QC, Canada, 2021; p. 277. [Google Scholar]
- Lindner, M.; Suominen, T.; Palosuo, T.; Garcia-Gonzalo, J.; Verweij, P.; Zudin, S.; Päivinen, R. ToSIA—A tool for sustainability impact assessment of forest-wood-chains. Ecol. Model. 2010, 221, 2197–2205. [Google Scholar] [CrossRef]
- Lindner, M.; Werhahn-Mees, W.; Suominen, T.; Vötter, D.; Zudin, S.; Pekkanen, M.; Päivinen, R.; Roubalova, M.; Kneblik, P.; Brüchert, F.; et al. Conducting sustainability impact assessments of forestry-wood chains: Examples of ToSIA applications. Eur. J. For. Res. 2012, 131, 21–34. [Google Scholar] [CrossRef]
- Tuomasjukka, D.; Martire, S.; Lindner, M.; Athanassiadis, D.; Kühmaier, M.; Tumajer, J.; Vis, M.; Spinelli, R.; Dees, M.; Prinz, R.; et al. Sustainability impacts of increased forest biomass feedstock supply—A comparative assessment of technological solutions. Int. J. For. Eng. 2018, 29, 99–116. [Google Scholar] [CrossRef]
- Suominen, T.; Kunttu, J.; Jasinevičius, G.; Tuomasjukka, D.; Lindner, M. Trade-offs in sustainability impacts of introducing cascade use of wood. Scand. J. For. Res. 2017, 32, 588–597. [Google Scholar] [CrossRef]
- Tuomasjukka, D.; Athanassiadis, D.; Vis, M. Threefold sustainability impact assessment method comparison for renewable energy value chains. Int. J. For. Eng. 2017, 28, 116–122. [Google Scholar] [CrossRef]
- Berg, S.; Schweier, J.; Brüchert, F.; Lindner, M.; Valinger, E. Economic, environmental and social impact of alternative forest management in Baden-Württemberg (Germany) and Västerbotten (Sweden). Scand. J. For. Res. 2014, 29, 485–498. [Google Scholar] [CrossRef]
- Haatanen, A.; den Herder, M.; Leskinen, P.; Lindner, M.; Kurttila, M.; Salminen, O. Stakeholder engagement in scenario development process—Bioenergy production and biodiversity conservation in eastern Finland. J. Environ. Manag. 2014, 135, 45–53. [Google Scholar] [CrossRef]
- Tuomasjukka, D.; Lindner, M.; Edwards, D. A Concept for Testing Decision Support Tools in Participatory Processes Applied to the ToSIA Tool. Challenges 2013, 4, 34–55. [Google Scholar] [CrossRef]
- Den Herder, M.; Kolström, M.; Lindner, M.; Suominen, T.; Tuomasjukka, D.; Pekkanen, M. Sustainability Impact Assessment on the Production and Use of Different Wood and Fossil Fuels Employed for Energy Production in North Karelia, Finland. Energies. Mol. Divers. Preserv. Int. 2012, 5, 4870–4891. [Google Scholar] [CrossRef]
- Prasara-A, J.; Gheewala, S.H.; Silalertruksa, T.; Pongpat, P.; Sawaengsak, W. Environmental and social life cycle assessment to enhance sustainability of sugarcane-based products in Thailand. Clean Technol. Environ. Policy 2019, 21, 1447–1458. [Google Scholar] [CrossRef]
- Papong, S.; Rewlay-ngoen, C.; Itsubo, N.; Malakul, P. Environmental life cycle assessment and social impacts of bioethanol production in Thailand. J. Clean. Prod. 2017, 157, 254–266. [Google Scholar] [CrossRef]
- FERIC. Optimiser les Résultats de la Coupe avec Protection de la Régénération et des Sols: Guide de Saines Pratiques; Institut Canadien de Recherches en Génie Forestier (FERIC): Ottawa, ON, Canada, 2006; p. 53.
- Locoh, A.; Thiffault, E.; Barnabé, S.; Bouthillier, L. Caractérisation des modèles types de chaînes de valeur de la biomasse forestière. VertigO 2022, 22. [Google Scholar] [CrossRef]
- MFFP. Ressources et Industries Forestières du Québec: Portrait Statistique -Édition 2008. Gouvernement du Québec-Ministère des Ressources Naturelles; MFFP: Quebec, QC, Canada, 2009. Available online: https://mffp.gouv.qc.ca/wp-content/uploads/PortraitStatistique_2008.pdf (accessed on 5 May 2020).
- MFFP. Evolution de la Consommation de Biomasse Forestière pour la Production Bioénergétique; Ministère des Forêts, de la Faune et des Parcs (MFFP): Quebec, QC, Canada, 2005; p. 22.
- CMQ; FQCF; VBQ. Cahier du Participant: 1re Rencontre de Travail dans le Cadre du Projet de Développement de L’utilisation de la Biomasse Forestière sur le Territoire de la Région de la Capitale-Nationale et de Lévis; Report No. 1; Communauté métropolitaine de Québec: Quebec, QC, Canada, 2017; p. 16. [Google Scholar]
- TEQ. Programme Bioénergies|Secteur de la Transition Énergétique. Transit. Énergétique Qué. 2021. Available online: https://transitionenergetique.gouv.qc.ca/en/affaires/programmes/bioenergies (accessed on 11 May 2021).
- IPCC. IPCC Guidelines for National Greenhouse Gas Inventories—A Primer. Prepared by the National Greenhouse Gas Inventories Programme; IPCC: Geneva, Switzerland, 2008; p. 20. Available online: https://www.ipcc-nggip.iges.or.jp/support/Primer_2006GLs.pdf (accessed on 13 July 2021).
- Eggleston, H.S.; Buendia, L.; Miwa, K.; Ngara, T.; Tanabe, K. 2006 IPCC Guidelines for National Greenhouse Gas Inventories. 2006. Available online: https://www.osti.gov/etdeweb/biblio/20880391 (accessed on 11 May 2021).
- CMQ; FQCF; VBQ. Cahier du Participant: 3e Rencontre de Travail dans le Cadre du Projet de Développement de L’utilisationde la Biomasse Forestière sur le Territoire de la Région de la Capitale-Nationale et de Lévis; Report No. 3; Communauté métropolitaine de Québec: Quebec, QC, Canada, 2017; p. 9. [Google Scholar]
- MFFP. Enquête 2013–2014 sur les Coûts D’opération et les Revenues Liés au Bois D’oeuvre de L’industrie Forestière du Québec; Ministère des Forêts, de la Faune et des Parcs (MFFP): Quebec, QC, Canada, 2016; 38p.
- Thiffault, E.; Boulanger, Y.; Cyr, D.; Dorion, H.; Grondin, P.; Moreau, L. Stratégies D’aménagement Forestier et de Production de Bois en Forêt Boréale et Tempérée: Bilan Carbone et Impacts sur la Biodiversité; Département des Sciences du Bois et de la Forêt, Faculté de Foresterie, de Géographie et de Géomatique Université Laval: Quebec, QC, Canada, 2020; 87p. [Google Scholar]
- ILOSTAT. Home—ILOSTAT—The Leading Source of Labour Statistics. ILOSTAT. 2022. Available online: https://ilostat.ilo.org/ (accessed on 10 May 2022).
- Canuel, C.-M.; Bernard, A.; Thiffault, N.; Gélinas, N.; Drapeau, P.; Thiffault, E.; Bélanger, N. Analysis of a wood production strategy from expert perspectives. For. Chron. 2022, 98, 1–9. [Google Scholar] [CrossRef]
- GHGenius. Home—GHGenius. 2022. Available online: https://ghgenius.ca/ (accessed on 20 May 2022).
- Cowie, A.L.; Berndes, G.; Bentsen, N.S.; Brandão, M.; Cherubini, F.; Egnell, G.; George, B.; Gustavsson, L.; Hanewinkel, M.; Harris, Z.M.; et al. Applying a science-based systems perspective to dispel misconceptions about climate effects of forest bioenergy. GCB Bioenergy 2021, 13, 1210–1231. [Google Scholar] [CrossRef]
- Laganière, J.; Angers, D.A.; Paré, D. Carbon accumulation in agricultural soils after afforestation: A meta-analysis. Glob. Chang. Biol. 2010, 16, 439–453. [Google Scholar] [CrossRef]
- U.S. Environmental Protection Agency. Science and Research at the U.S. Environmental Protection Agency—EPA Progress Report 2010; U.S. Environmental Protection Agency: Washington, DC, USA, 2011; Volume 80.
- Hakkarainen, E.; Hannula, I.; Vakkilainen, E. Bioenergy RES hybrids—Assessment of Status in Finland, Austria, Germany, and Denmark. Biofuels Bioprod. Biorefining 2019, 13, 1402–1416. [Google Scholar] [CrossRef]
- Hannula, I.; Hakkarainen, E. Integrated Bioenergy Hybrids: Flexible Renewable Energy Solutions. International Energy Agency Bionergy. 2017. Available online: https://task41project7.ieabioenergy.com/wp-content/uploads/sites/9/2017/05/Final-Report_Integrated-Bioenergy-Hybrids_Flexible-RE-Solutions.pdf (accessed on 5 September 2022).
- Jensen, S.Ø.; Marszal-Pomianowska, A.; Lollini, R.; Pasut, W.; Knotzer, A.; Engelmann, P. IEA EBC Annex 67 Energy Flexible Buildings. Energy Build. 2017, 155, 25–34. [Google Scholar] [CrossRef]
- Sjølie, H.K.; Trømborg, E.; Solberg, B.; Bolkesjø, T.F. Effects and costs of policies to increase bioenergy use and reduce GHG emissions from heating in Norway. For. Policy Econ. 2010, 12, 57–66. [Google Scholar] [CrossRef]
- Carleton, L.E.; Becker, D. Forest Biomass Policy in Minnesota: Supply Chain Perspectives on Barriers to Bioenergy Development. Forests 2018, 9, 254. [Google Scholar] [CrossRef]
- Bauen, A.; Berndes, G.; Junginger, M.; Londo, M.; Vuille, F. Bioenergy—A Sustainable and Reliable Energy Source A Review of Status and Prospects; IEA Bioenergy: Paris, France, 2010; p. 108. Available online: https://www.ieabioenergy.com/wp-content/uploads/2013/10/MAIN-REPORT-Bioenergy-a-sustainable-and-reliable-energy-source.-A-review-of-status-and-prospects.pdf (accessed on 13 July 2021).
- Chen, G.; Zhang, L.; Arinez, J.; Biller, S. Energy-Efficient Production Systems Through Schedule-Based Operations. IEEE Trans. Autom. Sci. Eng. 2013, 10, 27–37. [Google Scholar] [CrossRef]
- Dietmair, A.; Verl, A. A generic energy consumption model for decision making and energy efficiency optimisation in manufacturing. Int. J. Sustain. Eng. 2009, 2, 123–133. [Google Scholar] [CrossRef]
- Jacob-Lopes, E.; Zepka, L.Q. Renewable Resources and Biorefineries; BoD—Books on Demand: Norderstedt, Germany, 2019. [Google Scholar]
- Carlon, E.; Schwarz, M.; Golicza, L.; Verma, V.K.; Prada, A.; Baratieri, M. Efficiency and operational behaviour of small-scale pellet boilers installed in residential buildings. Appl. Energy 2015, 155, 854–865. [Google Scholar] [CrossRef]
- IEA Bioenergy. Bioenergy and Job Generation. Biomass Bioenergy 2013, 31, 9. [Google Scholar]
- Takala, T.; Kähkönen, T.; Laakkonen, A.; Tikkanen, J. Towards more sustainable bioenergy production—Forest owners’ readiness for change. Scand. J. For. Res. 2020, 35, 108–116. [Google Scholar] [CrossRef]


| Description | 2008BaU | 2030HEAT | 2030CHP | Data Sources |
|---|---|---|---|---|
| Cost of electricity (USD/kWh) | 0.09 | [47] a | ||
| Cost of natural gas (USD/kWh) | 0.053 | [47] a | ||
| Subsidies for heat production in buildings (USD/kWh) | - | 0.101 | - | [48] b |
| Subsidies for cogeneration production in buildings (USD/kWh) | - | - | 0.101 | [48] b |
| Biomass Supply and Energy Production Scenarios | Increased Biomass Mobilization | Harvesting Methods | Energy Generation Systems | ||
|---|---|---|---|---|---|
| Policy measure scenarios | Business-as-usual | 2008BaU | 2008B | 2008M | 2008S |
| Subsidies for heat production in buildings | 2030HEAT-BaU | 2030HEAT-B | 2030HEAT-M | 2030HEAT-S | |
| Subsidies for cogeneration production in buildings | 2030CHP-BaU | 2030CHP-B | 2030CHP-M | 2030CHP-S | |
| Scenarios | Wood Chips (Harvest Residues (odt)) | Wood Pellets (Sawmill Residues (odt)) | |||
|---|---|---|---|---|---|
| BaU | Production sites | Roadside | |||
| 2008 | 18,485 | 0 | 158,242 | ||
| 2030HEAT | 297,424 | 127,467 | 272,232 | ||
| 2030CHP | 297,424 | 127,467 | - | ||
| B | Production sites | Roadside | |||
| 2008 | 424,891 | 0 | 193,406 | ||
| 2030HEAT | 271,930 | 152,961 | 286,560 | ||
| 2030CHP | 271,930 | 152,961 | - | ||
| M | CTL | WTH | CTL | WTH | |
| 2008 | 11,282 | 7213 | 96,528 | 61,714 | |
| 2030HEAT | 403,646 | 21,244 | 166,061 | 106,170 | |
| 2030CHP | 403,646 | 21,244 | - | - | |
| S | Production sites | Roadside | |||
| 2008 | 18,485 | 0 | 158,242 | ||
| 2030HEAT | 399,398 | 0 | 272,232 | ||
| 2030CHP | 0 | 25,493 | - | ||
| Indicators | Units | Description | Data Sources |
|---|---|---|---|
| Environmental indicators | |||
| Greenhouse gas (GHG) emissions | Kg CO2 -eq | GHG emissions are reported as carbon dioxide (CO2) equivalents and calculated according to IPCC guidelines [50]. They were estimated based on the Global Warming Potential (GWP) metric over 100 years of direct GHG emissions from fuel combustion for harvesting and transport, and of direct GHG emissions from wood combustion for energy generation. | [50] |
| Air pollution | Kg | The air pollution indicator is assessed by quantifying five non-GHG emission indicators—fine particulate matter (PM10), carbon monoxide (CO), nitric oxide or nitrogen monoxide (NOx), sulfur dioxide (SO2) and non-methane volatile organic compounds (NMVOC). PM10 emissions depend on the type of energy production system and biomass used. | |
| Economic indicators | |||
| Gross value added (GVA) | USD | “Gross value added” is defined as the gross amount of added value remaining in the Capitale-Nationale region at a given point in time, in USD. It is calculated using the following formula: GVA = consumer price of finished product − production costs + subsidies [40]. | [51] |
| Energy generation | GWh | “Energy generation” is defined as heat and electricity generation from harvest and sawmill residues. | [52] |
| Social indicators | |||
| Employment | Full-time equivalents per year | The employment indicator is reported as the absolute number of full-time equivalent workers per year that can be allocated to a specific process. | [53] |
| Energy use | KWh | The energy use indicator reports direct fossil fuel and electricity use. It is an environmental indicator, but it also affects economic performance through production costs, especially labor costs. Labor costs are the costs incurred by an employer in the employment of labor and include remuneration for work performed, paid time not worked, bonuses, gratuities, employers’ social security expenditures, and costs incurred by the employer for vocational training [54]. In this study, it is considered a social indicator. | [47] |
| Scenarios | Wood Chips (GWh Year−1) | Wood Pellets (GWh Year−1) | ||
|---|---|---|---|---|
| Heat | Electricity | Heat | ||
| 2008 | BaU | 29.839 | 0 | 155.981 |
| M | 29.839 | 0 | 155.981 | |
| B | 88.621 | 0 | 190.643 | |
| S | 25.927 | 0 | 155.981 | |
| 2030HEAT | BaU | 580.947 | 0 | 693.248 |
| M | 580.947 | 0 | 693.248 | |
| B | 726.493 | 0 | 735.624 | |
| S | 559.682 | 0 | 693.248 | |
| 2030CHP | BaU | 355.098 | 112.249 | - |
| M | 355.098 | 112.249 | - | |
| B | 372.812 | 202.065 | - | |
| S | 293.361 | 183.148 | - | |
|
Actions Policy Aims | Increased Biomass Mobilization | Construction of Efficient Heat Plants | Construction of CHP Plants | Replacement of Less Efficient Plants |
|---|---|---|---|---|
| Increase the availability of heat from renewable resources | * † | * † | ||
| Increase regional income | * † | * | * | |
| Increase employment | * † | |||
| Minimize GHG and air pollutant emissions | × | * † |
Publisher’s Note: MDPI stays neutral with regard to jurisdictional claims in published maps and institutional affiliations. |
© 2022 by the authors. Licensee MDPI, Basel, Switzerland. This article is an open access article distributed under the terms and conditions of the Creative Commons Attribution (CC BY) license (https://creativecommons.org/licenses/by/4.0/).
Share and Cite
Locoh, A.; Thiffault, É.; Barnabé, S. Sustainability Impact Assessment of Forest Bioenergy Value Chains in Quebec (Canada)—A ToSIA Approach. Energies 2022, 15, 6676. https://doi.org/10.3390/en15186676
Locoh A, Thiffault É, Barnabé S. Sustainability Impact Assessment of Forest Bioenergy Value Chains in Quebec (Canada)—A ToSIA Approach. Energies. 2022; 15(18):6676. https://doi.org/10.3390/en15186676
Chicago/Turabian StyleLocoh, Ayaovi, Évelyne Thiffault, and Simon Barnabé. 2022. "Sustainability Impact Assessment of Forest Bioenergy Value Chains in Quebec (Canada)—A ToSIA Approach" Energies 15, no. 18: 6676. https://doi.org/10.3390/en15186676