Article

Experimental Characterization of Hydrodynamic Properties of a Deformable Rock Fracture

Department of Civil and Environmental Engineering, University of Alberta, Edmonton, AB T6G 2R3, Canada
*
Author to whom correspondence should be addressed.
Energies 2022, 15(18), 6769; https://doi.org/10.3390/en15186769
Submission received: 16 August 2022 / Revised: 13 September 2022 / Accepted: 14 September 2022 / Published: 16 September 2022
(This article belongs to the Special Issue State of the Art Geo-Energy Technology in North America)

Abstract

:
Characterization of stress-dependent single-phase and multiphase fluid transport in fractured geo-materials is essential for a wide range of applications, including CO2 sequestration, energy storage, and geo-energy extraction. However, pivotal studies on capillarity and multiphase fluid flow in deformable rock fractures are surprisingly sparse. In this study, we initially investigated the hydro-mechanical properties of an intact mixed-wet Calumet carbonate from the Waterways formation (Alberta) under isothermal conditions (40 °C). Then, we conducted core-flooding experiments using water and N2 to assess changes in the aperture, absolute permeability, relative permeability, and capillary pressure of an artificially fractured Calumet core in response to changes in effective confining stress during loading (0–10 MPa) and unloading (10–3 MPa). We quantified the fracture’s non-linear closure and hysteresis effect during the cyclic loading–unloading processes. We found that porosity and absolute permeability of the fracture decreased from 1.5% and 19.8 D to 1.18% and 0.22 D, respectively, during the loading. We revealed a systematic rightward shift in the relative permeability and a significant upward shift in the dynamic capillary pressure curves as the fracture deformed. This fundamental study demonstrates the critical role of fracture deformation on fluid flow in fractured rocks, which paves the way for future research in geoscience and engineering.

1. Introduction

An authentic understanding of the physical interaction between multiphase flow properties (e.g., relative permeability and capillary pressure) and the stress-dependent deformation of fractures is essential to describe the multiphase flow in fractured porous media for applications of the recovery of oil and gas fields and geothermal reservoirs [1], the performance of CO2 subsurface sequestration and H2 storage [2], and groundwater transport [3]. Most of the research on flow in deformable fractures has been focused on single-phase fluid transport [4]. The stress dependency of the multiphase flow properties of fractures has been given far less attention, despite the critical role of fractures on multiphase fluid transport in geological formations. The limited number of experimental studies have shown contradictory changes in the relative permeability of fractured rock in response to an increasing effective confining stress [5,6,7]. Complex physical mechanisms and contradictory findings challenge our grasp of stress-dependent multiphase flow in deformable fractures.
The state of stress in subsurface geological formations depends on depth, pore pressure, and active geological processes [8]. Many researchers have reported the state of present-day in-situ stress across scales [9,10,11], and the World Stress Map project has been developed by compiling the global stress data [12]. However, effective stress changes rapidly in response to injection and production operations in almost all petroleum/geothermal reservoirs and CO2/H2 storage formations [13]. Changes in effective stress lead to rock and fracture deformations (i.e., opening or closure) in geological formations, directly impacting porosity and absolute permeability [4,14,15,16,17] as well as multiphase flow properties, including relative permeability and capillary pressure [5,18]. Several equations have been presented to model the fracture closure under normal and shear deformation; Barton–Bandis’s hyperbolic fracture closure model is a popular empirical method for reservoir simulation that incorporates the joint roughness coefficient (JCR) and joint compressive strength (JCS) [19]. The theory of fluid transport in fractures was primarily developed by solving the Navier–Stokes equation [20] for flow between two smooth parallel walls, and the cubic law was developed on this basis [21]. Later studies have integrated various kinds of geometric and kinematic conditions, fracture roughness, contact area, and stiffness into fracture hydraulic conductivity models [22,23]. Aperture heterogeneity along deformable fractures has been shown to substantially impact equivalent permeability in naturally fractured reservoirs [24]. These models have been broadly studied through numerical simulations and experimental approaches [25,26,27]. Building on these findings, Haghi et al. [17] developed an analytical model of the stress-dependent flow properties and the multiphase flow mechanism in fractured rock.
In contrast with the abundance of experimental studies on single-phase flow in deformable fractures, the stress dependency of the relative permeability and capillary pressure of fractures remains relatively unexplored, even though the interplay of capillary, gravitational, and viscous forces in pore-space is fully understood [4]. Our recent experimental studies have demonstrated the systematic shifts in the relative permeability and capillary pressure for intact rocks of Berea sandstone and Indiana limestone [28,29,30]. However, previous observations of the relative permeability of fractured rocks were contradictory regarding the impact of confining stress on irreducible water saturation [5,7]. Irreducible water saturation is the least-producible water saturation under normal flow operation [31]. McDonald et al. [7] reported a reduction in S w i r and a leftward shift in the relative permeability curves in response to an increase in effective stress of a fractured carbonate. On the contrary, Lian et al. [6] found an increase in S w i r and a rightward shift in the relative permeability curves with stress in a similar fractured carbonate.
In this study, we initially quantified the stress-dependent deformation, porosity, flow path tortuosity, and absolute permeability of a mixed-wet carbonate from the middle Devonian Calumet member of the Waterways formation (McMurray reservoir underburden formation, Alberta) under isothermal conditions (40 °C). Then, we showed changes in porosity, absolute permeability, drainage capillary pressure, and drainage relative permeability of an artificially fractured Calumet core in response to a cyclic loading–unloading processes under isothermal conditions (40 °C). We revealed a non-linear closure and hysteresis effect during the loading and unloading processes of the fracture. We found that the fracture closure with effective stress led to an increase in gas relative permeability, a decrease in water relative permeability, and a significant upward shift in capillary pressure, resulting in a subsequent rise in the irreducible water saturation. These findings demonstrate the predominant role of stress-dependent fracture closure on the single-phase and multiphase flow properties of fractures in subsurface formations, which has not been extensively explored in the literature.

2. Theoretical Background

2.1. Intact Rock and Fracture Deformation

Intact rocks show strain ( ε i j I ) or deformation in response to stresses ( σ i j ). The poroelastic constitutive equation for an isotropic linear elastic fluid-saturated porous material is as follows [32]:
ε i j I = σ i j 2 G ( 1 6 G 1 9 K ) δ i j σ i j + 1 3 H δ i j P
where G and K represent the drained elastic shear and bulk modulus, respectively. The constitutive constant H specifies the grain and fluid stress/strain coupling. For the non-linear stress and strain relation in rocks, Zimmerman et al. [15] proposed an empirical correlation for volumetric strain as a function of stress, modified by Haghi et al. [29] as follows (assuming equal pore and volumetric strain):
ε p = ( 1 γ S ) K H σ γ S e σ / K S + γ S
where K H , K S , and γ S are defined as the bulk moduli of hard parts (e.g., solid grain), bulk moduli of soft parts (e.g., pores), and the fraction (volume of soft part)/(bulk volume) at the unstressed condition, respectively. In the derivation of Equation (2), the exponential function represents the natural-strain-based Hook’s law for the soft parts, and the linear function expresses the engineering-strain-based Hook’s law for the hard parts [29,33].
As with rock, fractures respond to applied effective stress with strain ( ε i j F ), deforming distinctly in response to applied normal and shear stress. In the current experiment, we were dealing with the normal strain of a fracture due to applied isotropic confining stress. Hooke’s constitutive equation for elastic material describes the relationship between strain and effective stress ( σ k l ) as follows:
d ε i j F = D i j k l d σ k l n k
where n k represents the components of the normal vector to the fracture surface [34]. The simplified stress–strain relations for a plane fracture perpendicular to the principal stress (shear displacement being disregarded) with an aperture of J is as follows [35]:
d σ n = k n d J n ,
where k n is the fracture’s normal stiffness.
Several models have been introduced to delineate fracture stiffness [35,36,37]. The Barton–Bandis fracture model is a nonlinear empirical fracture deformation model [19,38] that outlines the hyperbolic loading and unloading curves of normal effective stress, σ n , and fracture closure, Δ J , as follows:
σ n = k n i Δ J ( 1 Δ J Δ J m a x )
where k n i is the initial fracture’s normal stiffness and Δ J m a x is the maximum fracture closure.
Based on the equivalent continuum concept, the total strain change ( d ε i j ) of the dual medium (i.e., intact rock + fracture) in response to an effective stress change was defined as d ε i j = d ε i j F + d ε i j I . Hence, by measuring d ε i j and d ε i j I from independent compression tests, we can determine d ε i j F .

2.2. Intact Rock and Fracture Porosity and Permeability Relations

In the absence of expensive experimental data, the permeability of intact rocks is often estimated using empirical porosity–permeability equations. For example, Kozeny and Carman presented the following equation for absolute permeability ( k ) of a packing of spherical grains as a function of rock porosity ( φ ), grain diameter ( d ), and flow path tortuosity ( τ ) [39,40]:
k = φ 3 d 2 72 ( 1 φ ) 2 τ
Based on Equation (6), the normalized absolute permeability k n = k / k i as a function of normalized porosity φ n = φ / φ i of an intact rock at each effective stress condition can be derived as follows [29]:
k n = ( φ n ) 3 ( 1 φ i 1 φ n φ i ) 2 ( 1 τ n )
where τ n = a ( φ n m 1 ) + 1 specifies the non-linear normalized flow path tortuosity ( a and m are material constants). In Equation (7), the index i refers to the property at an unconfined condition.
A fracture in a rock mass can be treated as an empty flow path or a porous medium. The primary governing flow equation of an incompressible Newtonian viscous fluid was represented by the following form of the Navier–Stokes equation [20,41]:
ρ ( v t + ( v . ) v ) = F 1 ρ p + μ ρ 2 v
where ρ is the fluid density, F is the body force vector (per unit mass), p is the fluid pressure, μ is the fluid viscosity, and v is the velocity vector. For subsurface flow, replacing the body force F with g (gravitational acceleration) is a prevalent practice.
For the single-phase fluid flow between two parallel smooth plates ( ( v . ) v ) in a steady-state condition ( v / t = 0 ), Equation (8) changes as follows:
μ 2 v x ( z ) = P
where P = p + ρ g is the reduced pressure, z is the coordinate axis perpendicular to the fracture wall, and v x is the flow velocity parallel to P [41]. By integrating Equation (9), the equation for the total volumetric flux through the fracture was derived as follows:
Q x = w J 3 ( P ) 12 μ
where w is the fracture width. Recalling the volumetric flux equation from Darcy’s law for flow in porous media Q x = k w J ( P ) / μ (assuming the fracture is a porous material), the permeability of the fracture was developed as,
k = J 2 12
Similarly, the fracture transmissivity for the parallel plate model was given as T = k w J = w J 3 / 12 , which is known as the “cubic law”. Several models have been proposed over the years to incorporate deviations from the cubic law (the exact solution of the Navier–Stokes equation) due to fracture surface roughness, flow turbulence, aperture variations, and contact area. Many numerical and experimental studies have found the results of the following derivation of the cubic law promising in the prediction of fracture conductivity [42,43,44]:
T = J 3 12 [ 1 1.5 ( S D J ) 2 + ]
where S D is the standard deviation of the fracture aperture. In this study, we developed a second-order polynomial function (i.e., k = a J 2 + b J + c ) to fit the permeability data based on Equation (12).

2.3. Two-Phase Flow

The flow of two or more immiscible fluids inside the porous media leads to further complexity in the flow equations and introduces relative permeability (instead of absolute permeability) and capillary pressure. Numerous empirical and analytical equations have been proposed to model relative permeability and capillary pressure curves with fluid saturation [27,45,46,47,48]. Brooks and Corey’s [47] power-law functions (modified Brooks–Corey type-curves) for drainage capillary pressure ( P c ) and water and gas drainage relative permeability ( k r w and k r g , respectively) are commonly used to describe the multiphase flow properties of rock (Equations (13)–(15)).
P c = P e ( S w * )   β
k r w = ( S w * )   n w
k r g = k r g m a x ( 1 S w * )   n g
S w * = S w S w i r 1 S w i r .
In Equation (16), S w i r is the irreducible wetting phase. In Equations (13)–(15), P e and k r g m a x refer to the entry capillary pressure and maximum gas relative permeability (end-point), respectively. The parameters β , n w , and n n w in Equations (13)–(15) are fitting constants. In this study, Equations (13)–(15) were used to fit curves on experimental data using the least-squares regression method.

3. Materials and Methods
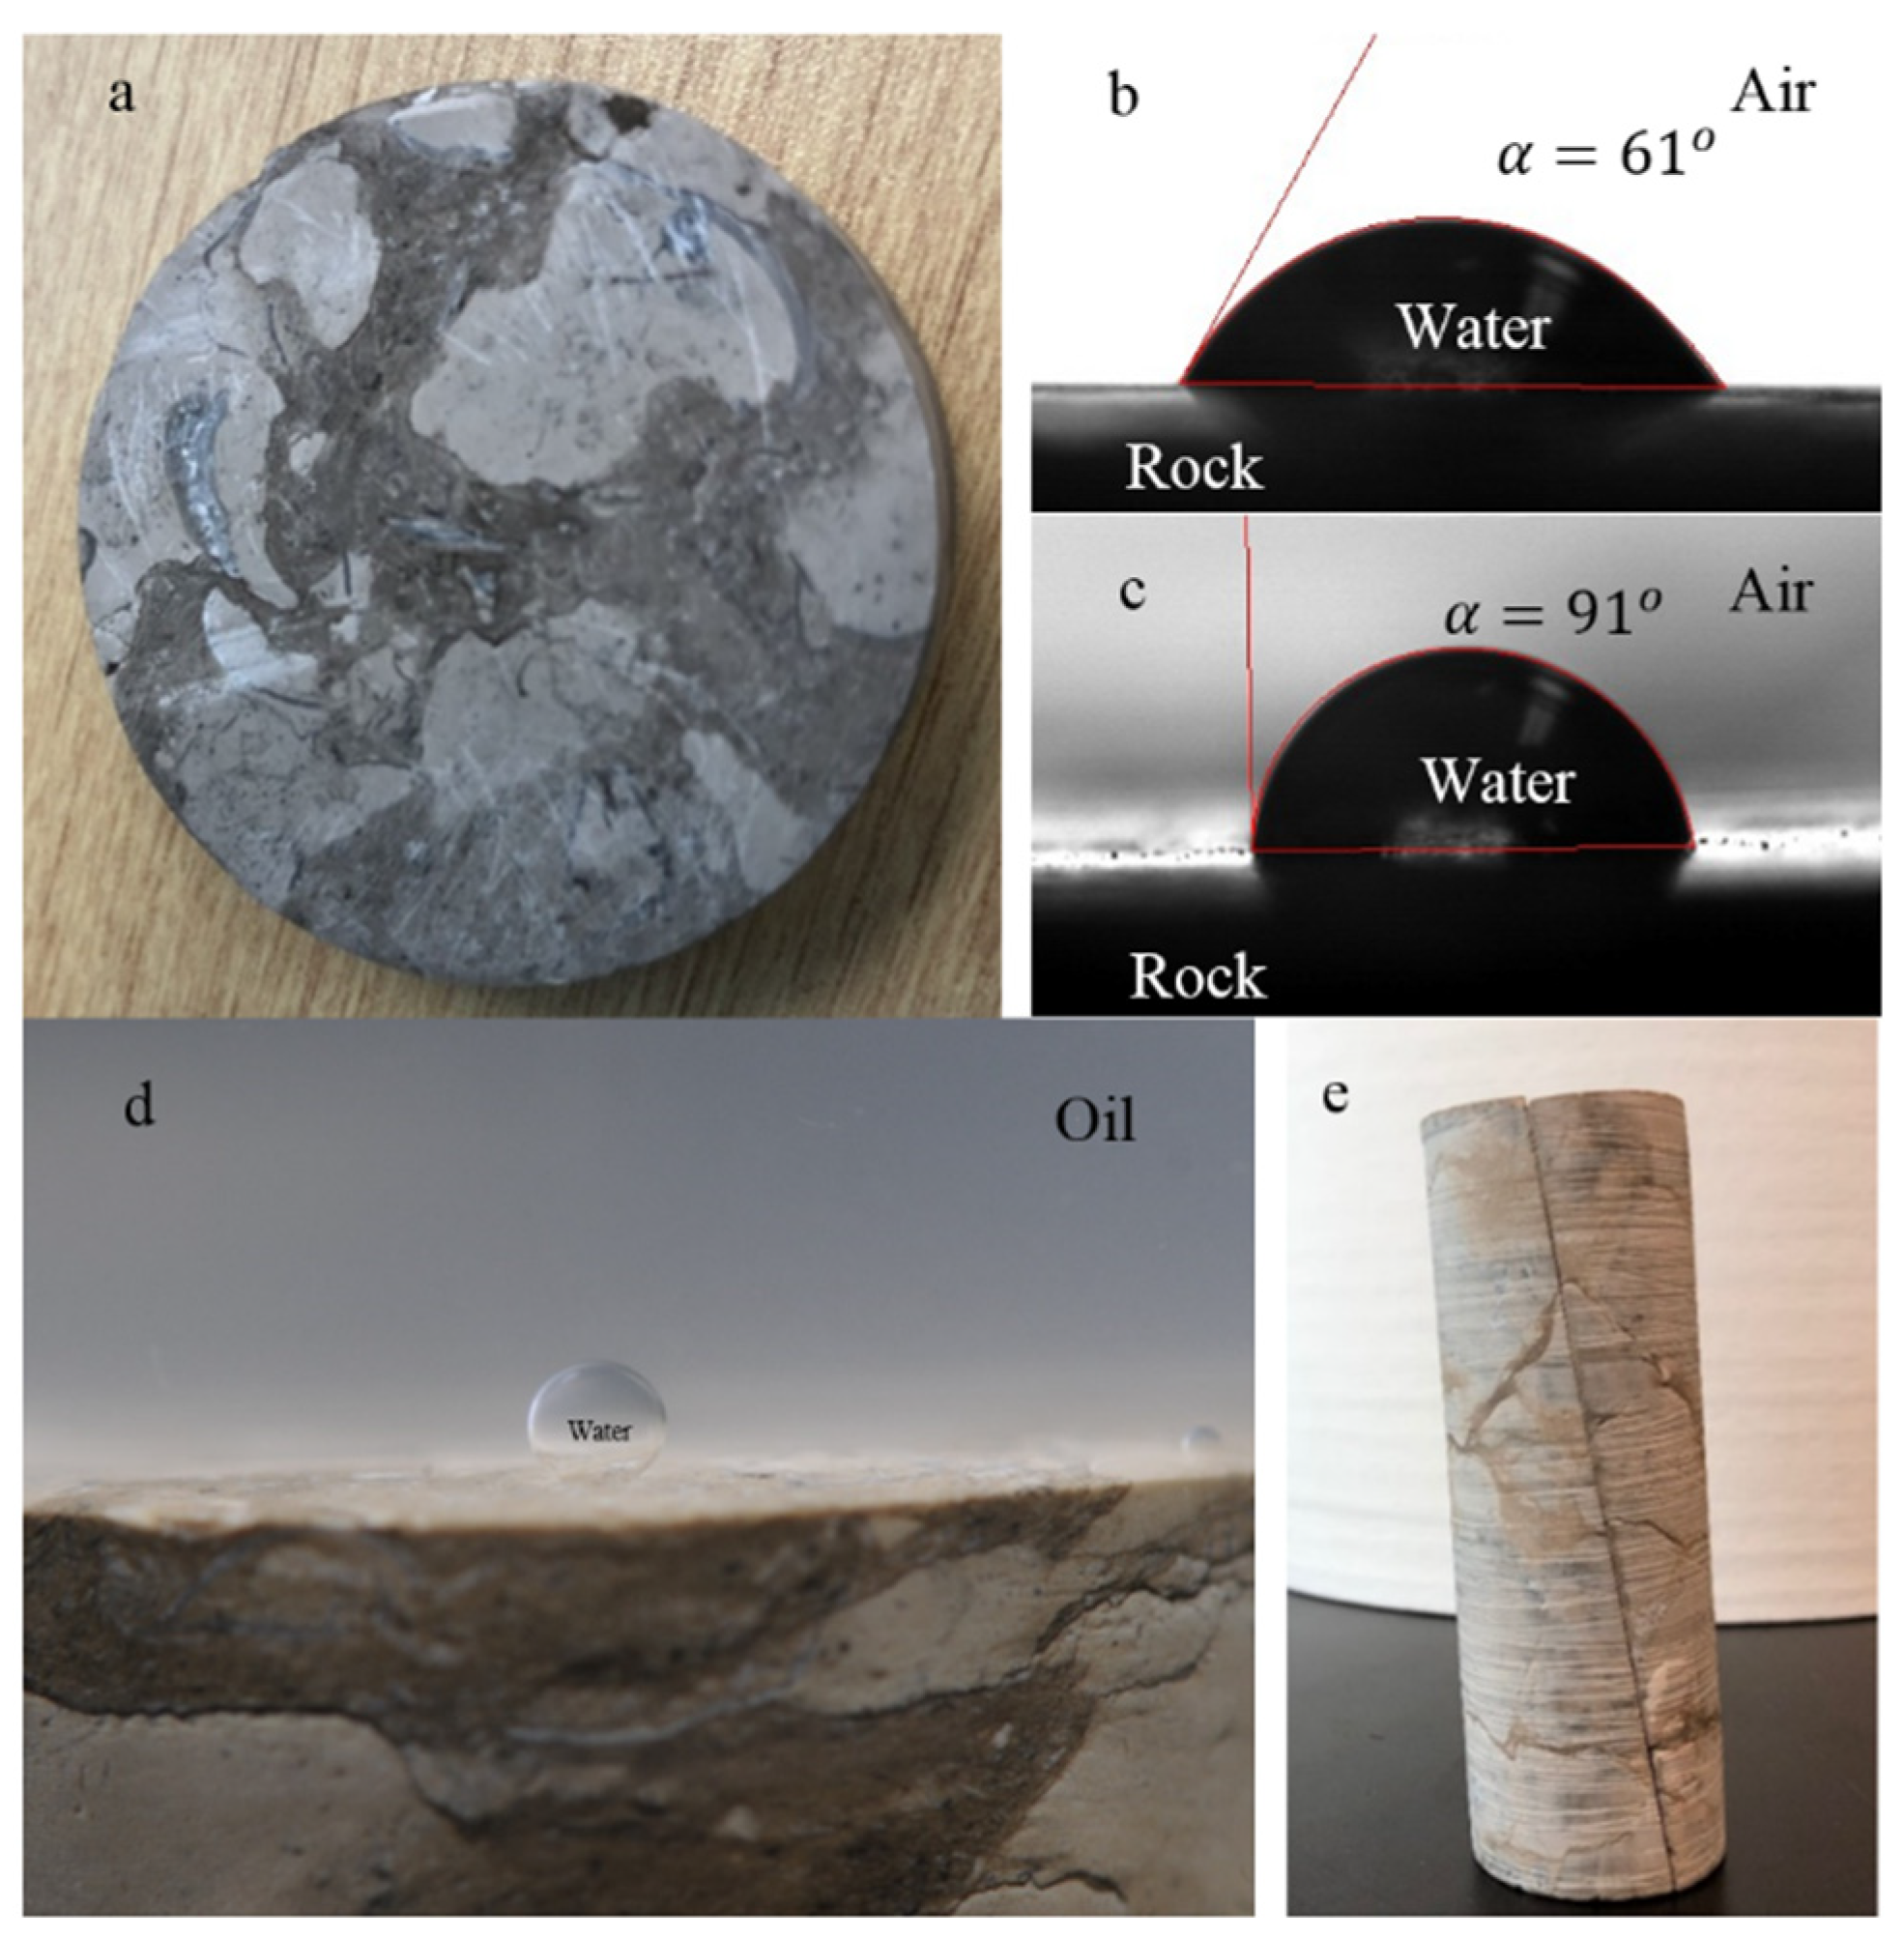
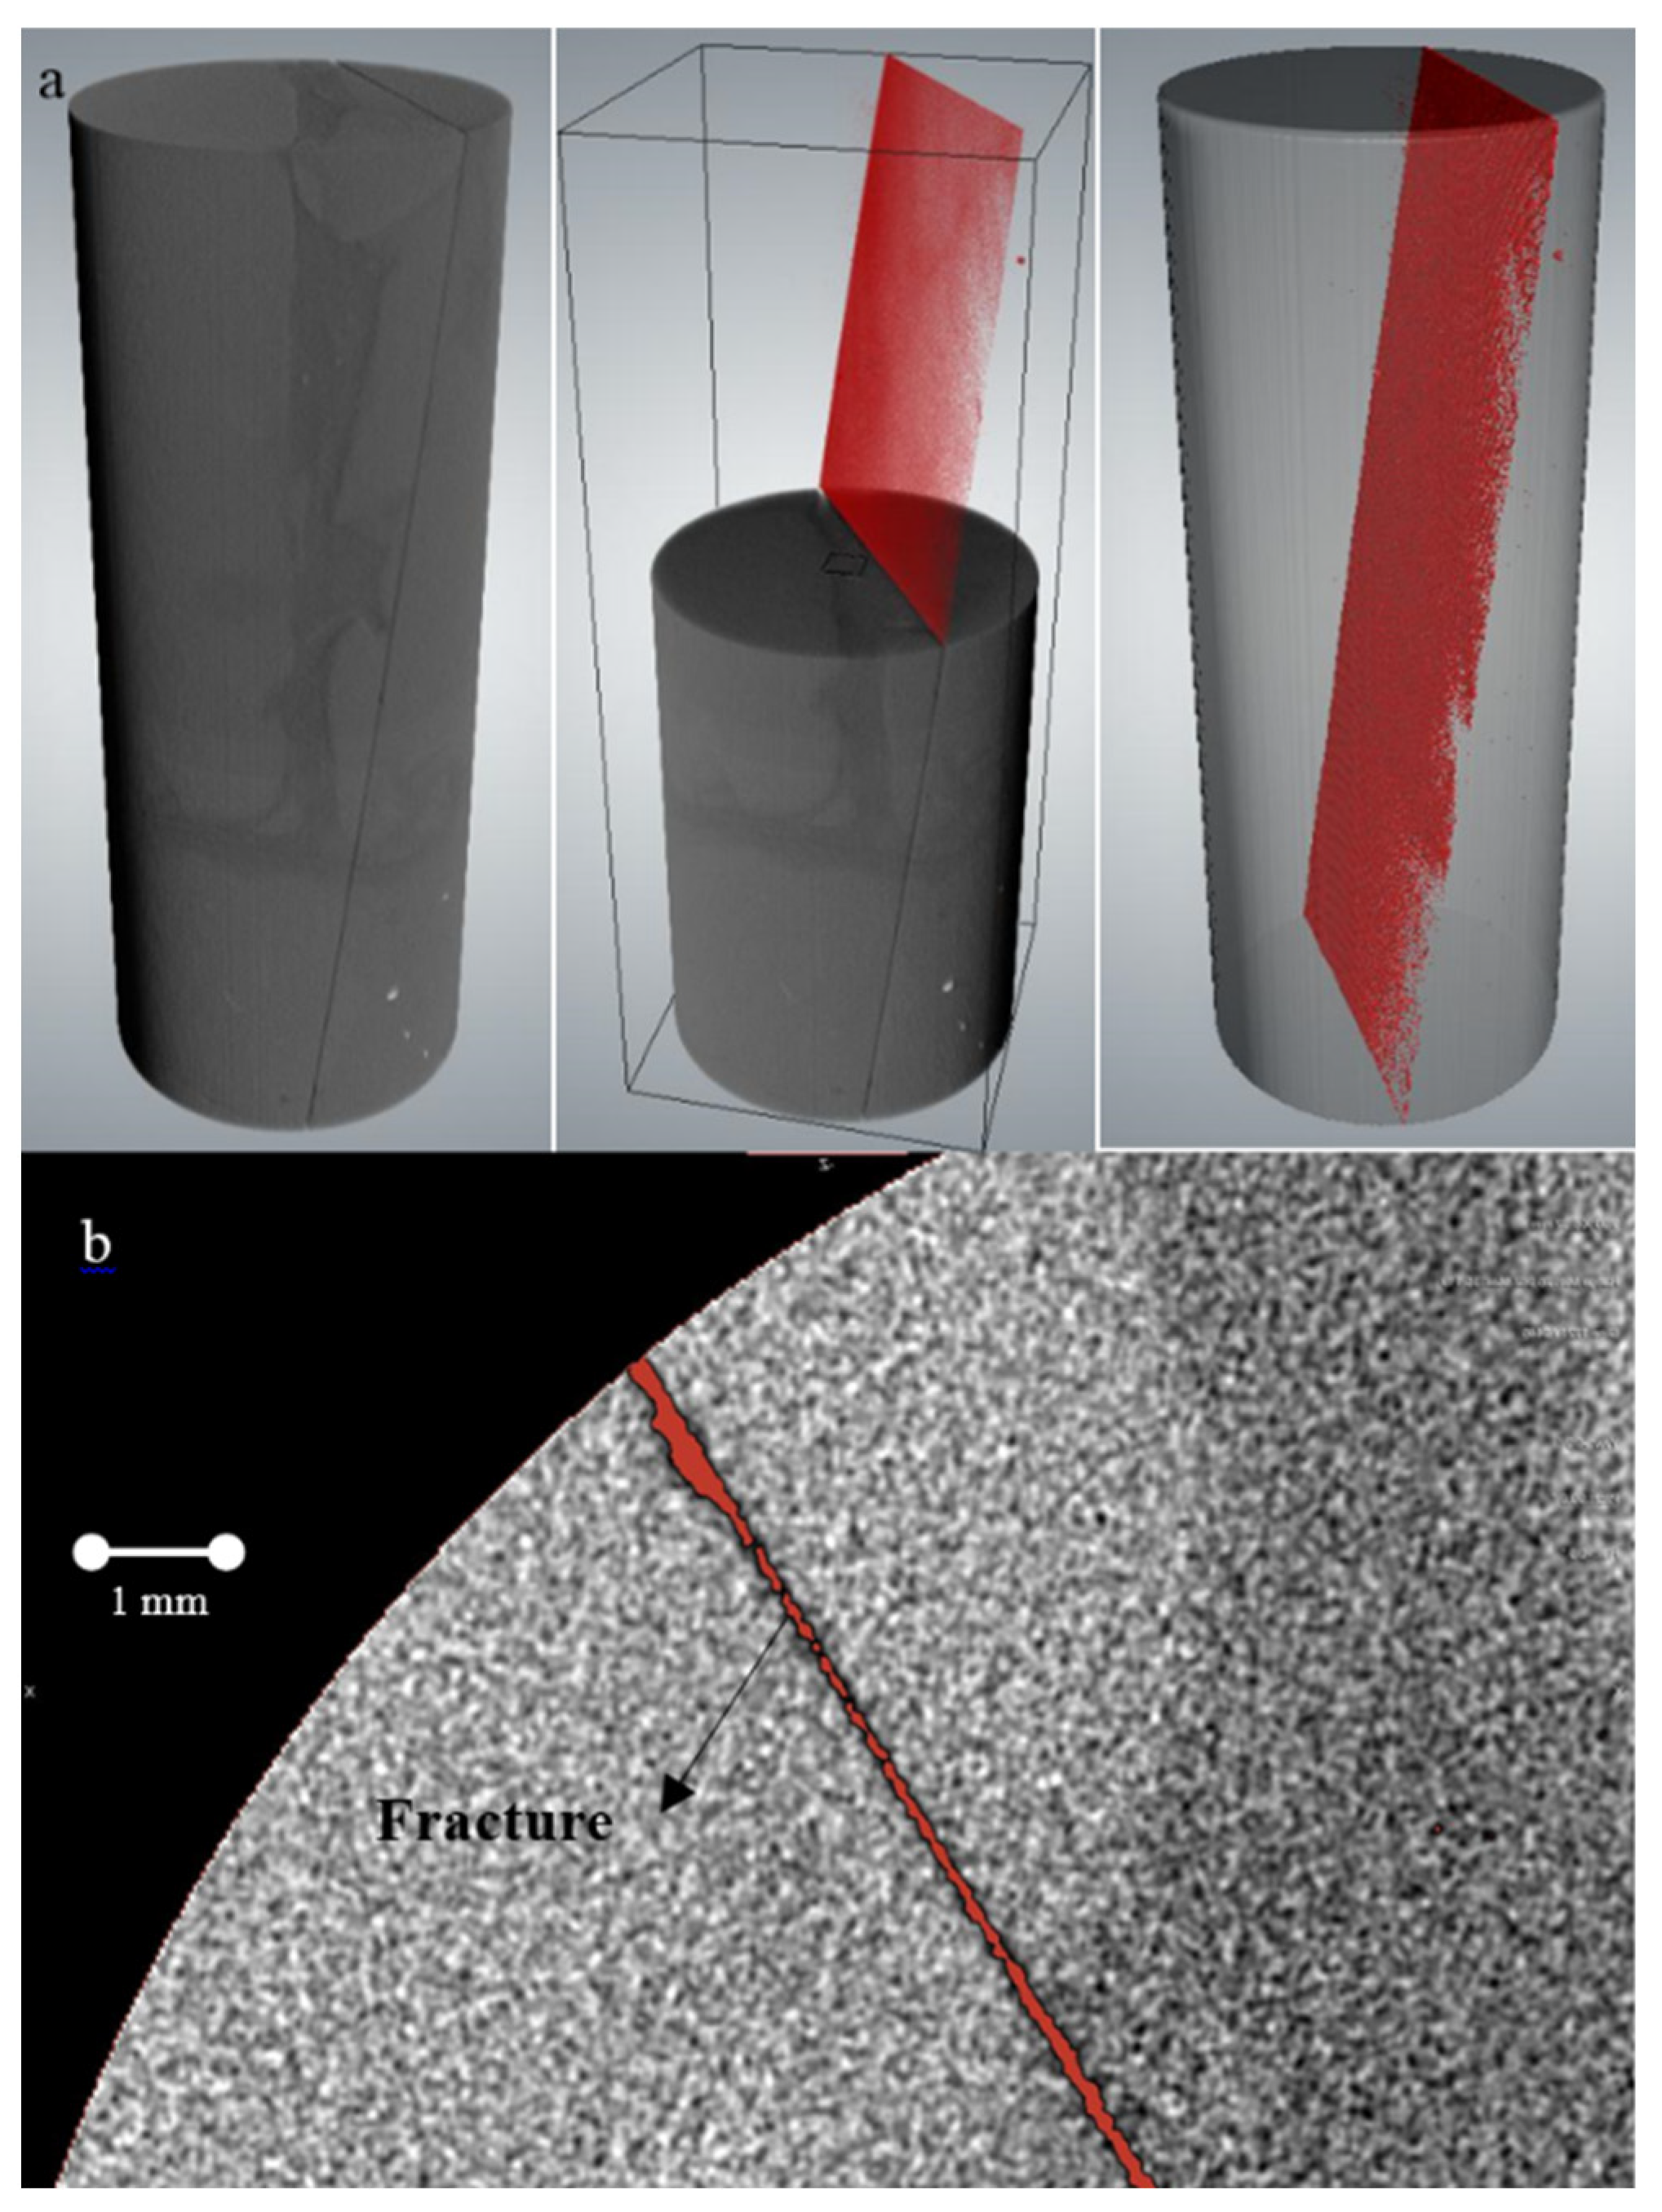
3.1. Rock Sample

We carried out all the test steps on heterogeneous carbonate cores (Calumet carbonate) from a 506–508 m depth of the middle Devonian Calumet member of the Waterways formation (McMurray reservoir underburden formation, Foster Creek North SAGD project, Alberta) with a diameter of 3.84 cm and length of 10.3 cm (Figure 1a). XRD data showed that the sample consisted of 98% calcite, 1% quartz, and 1% ankerite/ferroan-dolomite. The Drop Shape Analyzer (DSA) result proved a mixed wettability of the rock to the water phase with an air–water contact angle ( α ) ranging from 61° to 91° (Figure 1b,c). The sessile drop test result also elaborated an initial affinity of the rock to the oil phase when the rock sample was immersed in silicon oil and allowed to equilibrate (Figure 1d). We dried and stabilized the clean samples at 100 °C for 10 h and evacuated for 24 h. We determined the initial porosity, absolute permeability, and density of the intact rock under atmospheric conditions equal to 8.12%, 1.6 µD, and 2.564 gr/cm3, respectively. The excessively low permeability of the intact rock made the core a proper selection for fracture flow characterization without concerns about the matrix’s effective involvement in the flow test. Accordingly, we used the same core with a single saw-cut fracture (length, width, and average aperture size of 10.56 cm, 3.6 cm, and 0.046 cm, respectively) for the fracture characterization experiments (Figure 1e). To measure the initial fracture aperture, we scanned the fractured core using X-ray-computed micro-tomography (micro-CT) with a resolution of 19 μm and 140 KeV energy at the NanoFAB facility at the University of Alberta (Figure 2a). We developed a 3D image of the fracture through image post-processing steps (median filtering and Otsu thresholding method [49]) and calculated the fracture volume as 1.75 cm3 (Figure 2b,c). Then, we divided the fracture volume by the fracture plain surface to calculate the average aperture. Figure 2b provides a qualitative view of the surface micro-scale asperity on the opposite walls of the fracture. We measured the fracture’s initial porosity and absolute permeability as 1.5% and 19.8 D, respectively.
We used N2 gas adsorption data from the Autosorb Quantachrome 1 MP device to quantify the specific surface area (m2/g) and pore size distribution of the rock using the BET (after Brunauer–Emmett–Teller) and BJH (after Barrett–Joyner–Halenda) techniques, respectively [50,51]. The BET method measured the specific surface area using an interface monolayer gas capacity and a cross-sectional area of gas molecules at liquid nitrogen temperature (77 °K). Furthermore, the dependency of the gas capillary condensation pressure on the pore size provided quantitative information on the pore size distribution. Figure 3a shows the specific surface area (m2/g) and pore size distribution of the intact Calumet carbonate, which indicated that 88 percent of the pores had a diameter of less than 10 nm within the range of 1–131 nm. In addition, the uniaxial compressive strength and Young’s modulus of the intact rock have been measured as 36.04 MPa and 3 GPa, respectively (Figure 3b).

3.2. Fluids

We used the fluid pair of N2 and deionized water for the core-flooding experiments with a water viscosity of μ w = 0.6527 mPa.s, a gas viscosity of μ g = 0.0184 mPa.s, a gas density of ρ g = 0.01 g/cm3, and an interfacial tension of γ = 69.36 mN/m under the test conditions [52,53,54].

3.3. Core-Flooding Apparatus

In this study, we used the same core-flooding system described in detail in our previous publication [29]; its essential features are summarized in the following section. The equipment consisted of three main sections: (1) a pore pressure circuit, (2) a confining pressure circuit, and (3) a gas separation unit. The pore pressure circuit contained the sample, two inlet lines for separate injections of gas and water, one outlet line, three pressure transducers, and a thermocouple. We placed the specimen between two porous stones, covered it with a layer of flexible lead jacket (to prevent gas diffusion) and a second layer of Viton rubber sleeve, and mounted it in a triaxial isotropic HPHT cell. The system contained five highly sensitive pressure transducers to record the cell’s inlet and outlet gas/water pressure and confining pressure. In addition, the apparatus was equipped with four syringe ISCO pumps for independent water/gas injections and pore/confining pressure maintenance systems. We designed five high-pressure vertical cylinders for phase separation and accurate core-saturation calculations. We placed the whole system into a large Despatch oven with an accuracy of ±0.1 °C to control the temperature fluctuations during isothermal experiments.

3.4. Experimental Process

In this study, we first measured the intact carbonate rock porosity and permeability with an increase in effective confining stress from 0 MPa to 30 MPa. Then, we determined the induced fracture closure, porosity, absolute permeability, drainage relative permeability, and drainage capillary pressure consecutively in a similar carbonate rock during loading (0–10 MPa) and unloading (10–3 MPa) cycles. We initially placed the dried and cleaned specimen in the isotropic cell. The residual gas minimization (water saturation process) of the sample consisted of (1) injecting a 50-pore volume of high-pressure CO2 to displace the miscible N2 gas (initially air), (2) thoroughly purging and drying the core using a vacuum pump from the outlet line over a liquid nitrogen cold trap until the inlet and outlet pressures became equal, and (3) flushing the core with a 50-pore volume of high-pressure water to dissolve and displace the remaining CO2 in the pore-space. Then, we maintained a constant pore pressure of the fully saturated specimen and let the system temperature stabilize at 40 °C.
The effective stress-induced deformation pushed a certain volume of water out of the fracture ( Δ V ), which was applied to calculate the stress-dependent fracture aperture J = J i ( Δ V / l w ) , fracture closure Δ J = J i J , and fracture normal strain ε F = Δ J / J i [17]. Here, J i is the initial (unconfined) fracture aperture and l is the fracture length. Notably, the fracture in our experiments only deformed normally (i.e., no shear deformation was applied) due to the isotropic confining stress condition, and Δ V was corrected for the contribution of matrix deformation using the intact rock test results. Next, we flushed the core with water at five flow rates, Q w (1, 2, 3, 4, and 5 mL/min), at each effective stress condition to calculate absolute permeability using Darcy’s equation: k = Q w μ w l / w J Δ p , where Δ p is the pressure drop across the core under a steady-state condition [31]. We adapted the modified Hassler method (i.e., co-injecting water and gas directly into the specimen to reach a steady-state condition [55]) to calculate relative permeability at six water fractional flow rates ( f w = 1 ,   0.8 ,   0.6 ,   0.4 ,   0.2 ,   0 ) using Darcy’s law. Finally, we measured capillary pressure using the stationary liquid method [56], in which the core was flushed at six different gas flow rates ( Q g = 1 5   and   8   mL / min ) until a steady-state condition was achieved. Assuming an immobile wetting phase under steady-state conditions, we were able to calculate dynamic capillary pressure as P c = P g | i n l e t P | o u t l e t [57]. The same method was used to measure the fracture properties during the unloading of the specimen. A detailed explanation of the experimental process is provided in [29].

4. Results and Discussion

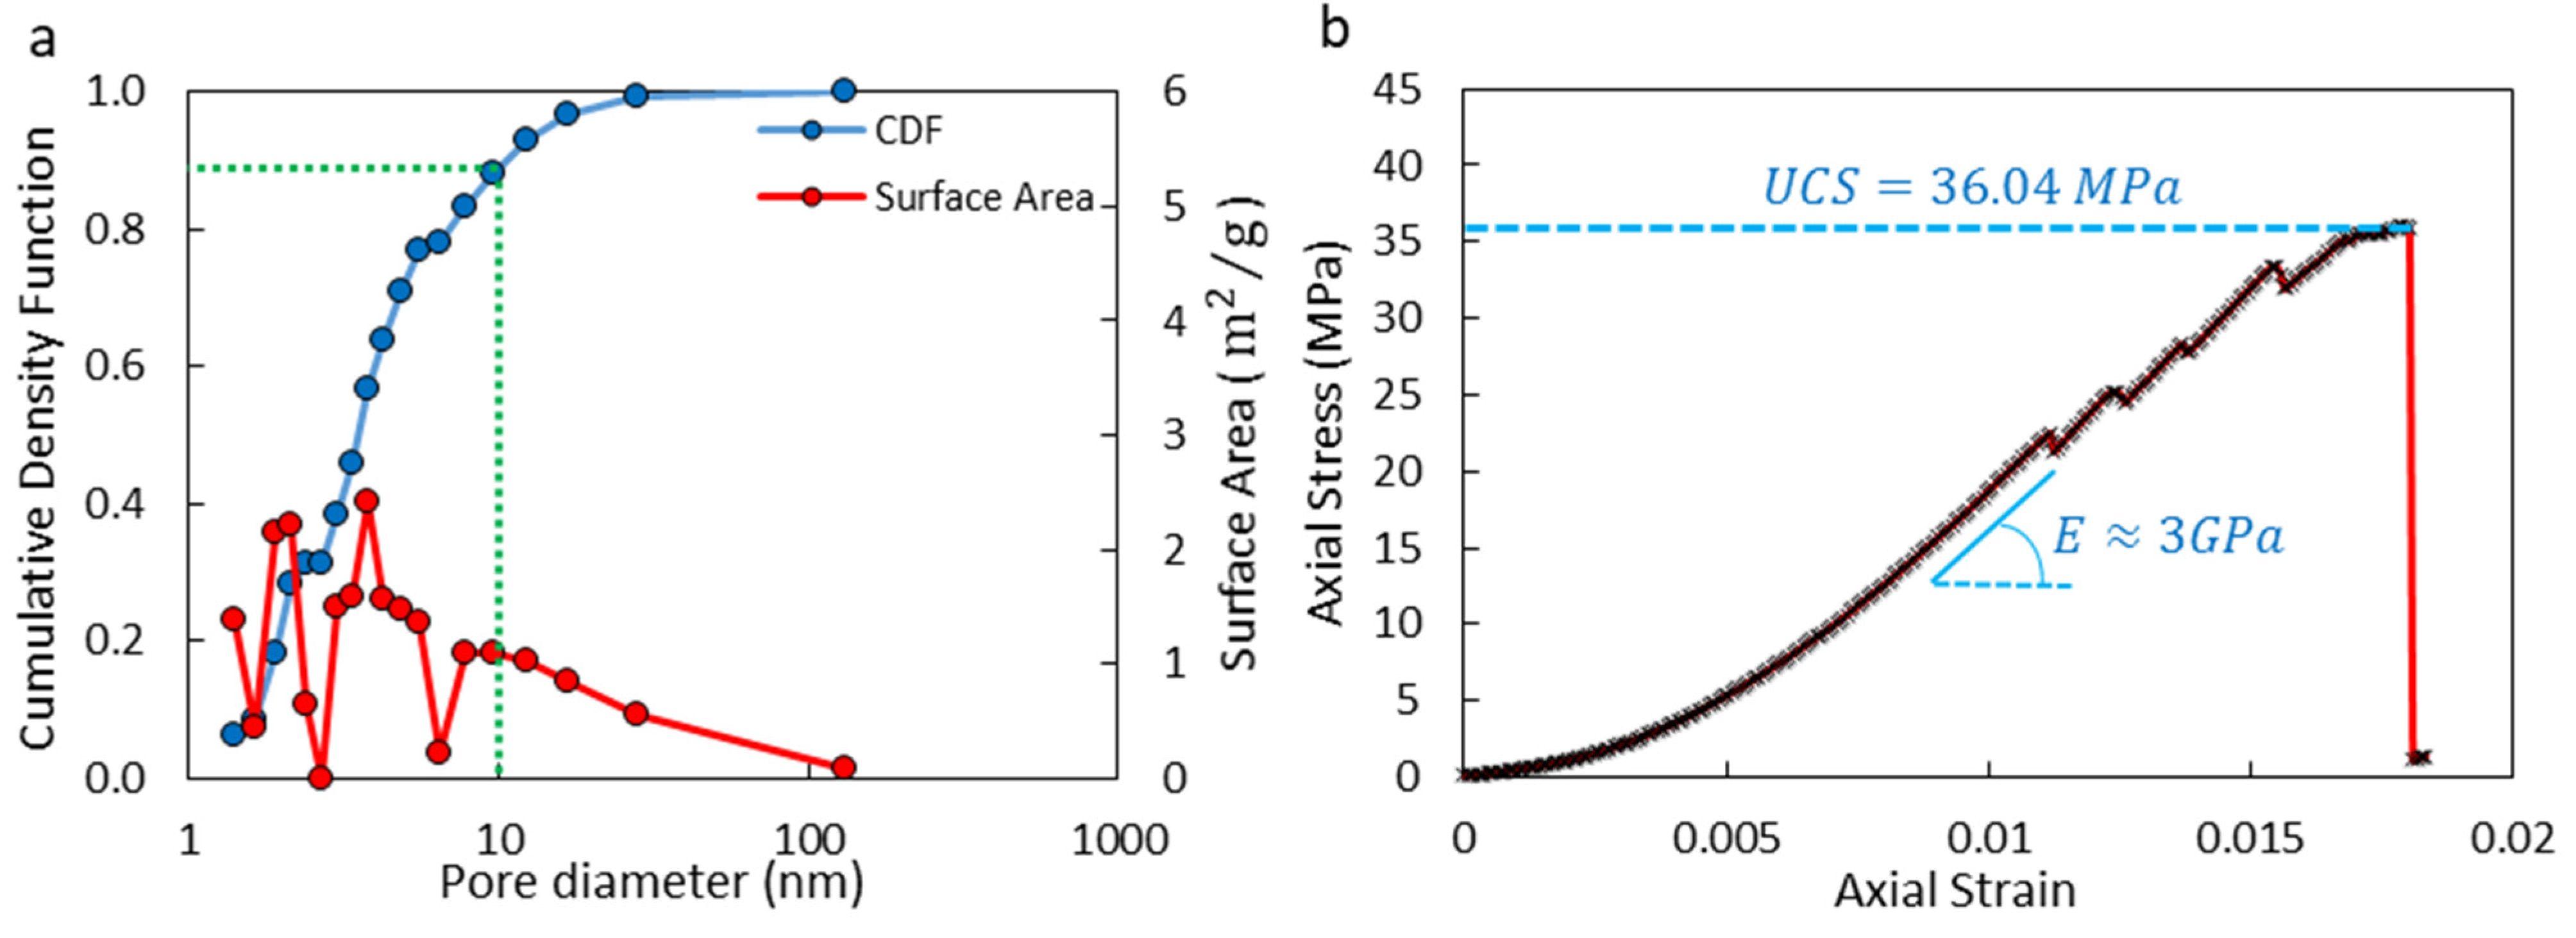
4.1. Intact Rock Porosity and Absolute Permeability with Stress

Figure 4 presents the experimental data of the hydro-mechanical properties of the intact Calumet carbonate and fitting models under variable effective stresses (0–30 MPa) and isothermal conditions (40 °C). Figure 4a shows effective confining stress with pore strain data (black dots) of the intact core, highlighting the rock’s non-linear deformation in response to an increase in effective stress. We applied the pore strain model from Equation (2) to fit the data in Figure 4a (red dotted line). Using the bisquare regression method, we calculated γ S = 0.01 , K H = 6.37 GPa, and K S = 18.04 MPa on seven ε p data points with R 2 = 0.94 . Figure 4b presents non-linear declines in porosity (black dots) and absolute permeability (black squares) of the intact core with an increase in effective confining stress from 0 to 30 MPa. We developed first-degree rational fitting functions to model porosity φ = ( 7.94 × σ + 325.4 ) / ( σ + 40.07 ) (red dotted line) and permeability k = ( 0.3125 × σ + 41.12 ) / ( σ + 26.14 ) (blue dotted line) using the bisquare regression method with R 2 = 0.99 . Figure 4c reveals an increase in the normalized flow path tortuosity τ n of the intact core from 1 to 2.75, with a decrease in the normalized absolute permeability k n from 1 to 0.35 in response to the effective stress-induced pore compaction. In Figure 4c, the black dots represent the experimental data, and the colours indicate various effective confining stress conditions. We used Equation (7) to calculate τ n at each effective stress, where k n and φ n were known. Based the non-liner equation for τ n in Section 2.2, we calculated a = 0.58 and m = 141.9 using the bisquare regression method with R 2 = 0.9941 (Figure 4c).
Figure 4 reveals a slight pore strain ( ε p = 1.02 % ) of the intact Calumet carbonate with 30 MPa of effective confining stress. The measured pore strain from the triaxial test agreed with the relatively high Young’s modulus and rock strength from the UCS test (Figure 3b), which makes the Calumet carbonate a moderately hard rock based on the US National Engineering Handbook [58]. In addition, Figure 4 shows that the intact rock’s initial permeability of 1.6 µD decreased to 0.56 nD with 30 MPa of effective confining stress. The range of permeability of the Calumet carbonate in micro- to nano-Darcy with almost 8% porosity highlights the poor connectivity of the pore space qualitatively. This minor pore strain and small permeability diminished the contribution of the intact rock to the determined strain and the conductivity of the fractured core tests.
Figure 5 shows the experimental data and fitting models for the isothermal single-phase core-flooding test during loading (0–10 MPa) and unloading (10–3 MPa) cycles. We chose the red and blue dotted lines to distinguish the loading and unloading paths, respectively. Figure 5a shows an increase in fracture closure to 0.1 mm with an increase in effective stress to 10 MPa. Afterward, a decrease in effective stress to 3 MPa during unloading opened the fracture a bit and stopped at a fracture closure value of 0.08 mm. By fitting Equation (5) to the experimental data using the bisquare regression method, we calculated the initial fracture stiffness k n i and maximum fracture closure Δ J m a x as 33.71 GPa/m and 0.15 mm, respectively, with R 2 = 0.9967 . Figure 5b presents a decline in the fracture porosity from 1.5% to 1.18% during loading and a slight increase from 1.18% to 1.24% during the unloading process. We used two distinct second-order polynomial functions to fit the experimental porosity data in Figure 5b. Figure 5c shows the sharp decline in absolute permeability of the fracture from 19.8 D at the initial condition to 0.22 D at 10 MPa of effective confining stress. However, the increase in absolute permeability during the unloading to 3 MPa was negligible. Figure 5d reveals the relationship between fracture permeability and aperture during loading and unloading. Following the derivation in Equation (12), we developed a second-order polynomial function to model fracture permeability based on the aperture during loading: k = 2123.9 × J 2 1529.4 × J + 275.7 , with R 2 = 0.9978 . As indicated earlier, absolute permeability showed minor sensitivity to the deformation during unloading.
The distinct loading and unloading paths in all plots of Figure 5 manifested the inelastic deformation of the fracture in response to applied effective stress and significant hysteresis effect in our experiments. Although the fracture was an artificial saw-cut plane, its walls had a roughness on the micro-scale (Figure 2). Previous studies have demonstrated the impact of cyclic loading on the transmissivity of fractures due to changes in fracture roughness and contact areas [22,59]. The first derivative of the Barton–Bandis hyperbolic joint model in Equation (5) yielded the following expression for normal stiffness [19]:
k n = k n i [ 1 σ n ( Δ J m a x k n i + σ n ) ] 2
where k n and σ n have a dimension of GPa/m and MPa, respectively. Based on Equation (17), we developed an equation for the fracture’s normal stiffness as k n = 1.31 σ n 2 + 13.28 σ n + 33.71 . This equation proved the high sensitivity of the fracture’s normal stiffness in this study to normal stress, which is the case for interlocked joints [19].

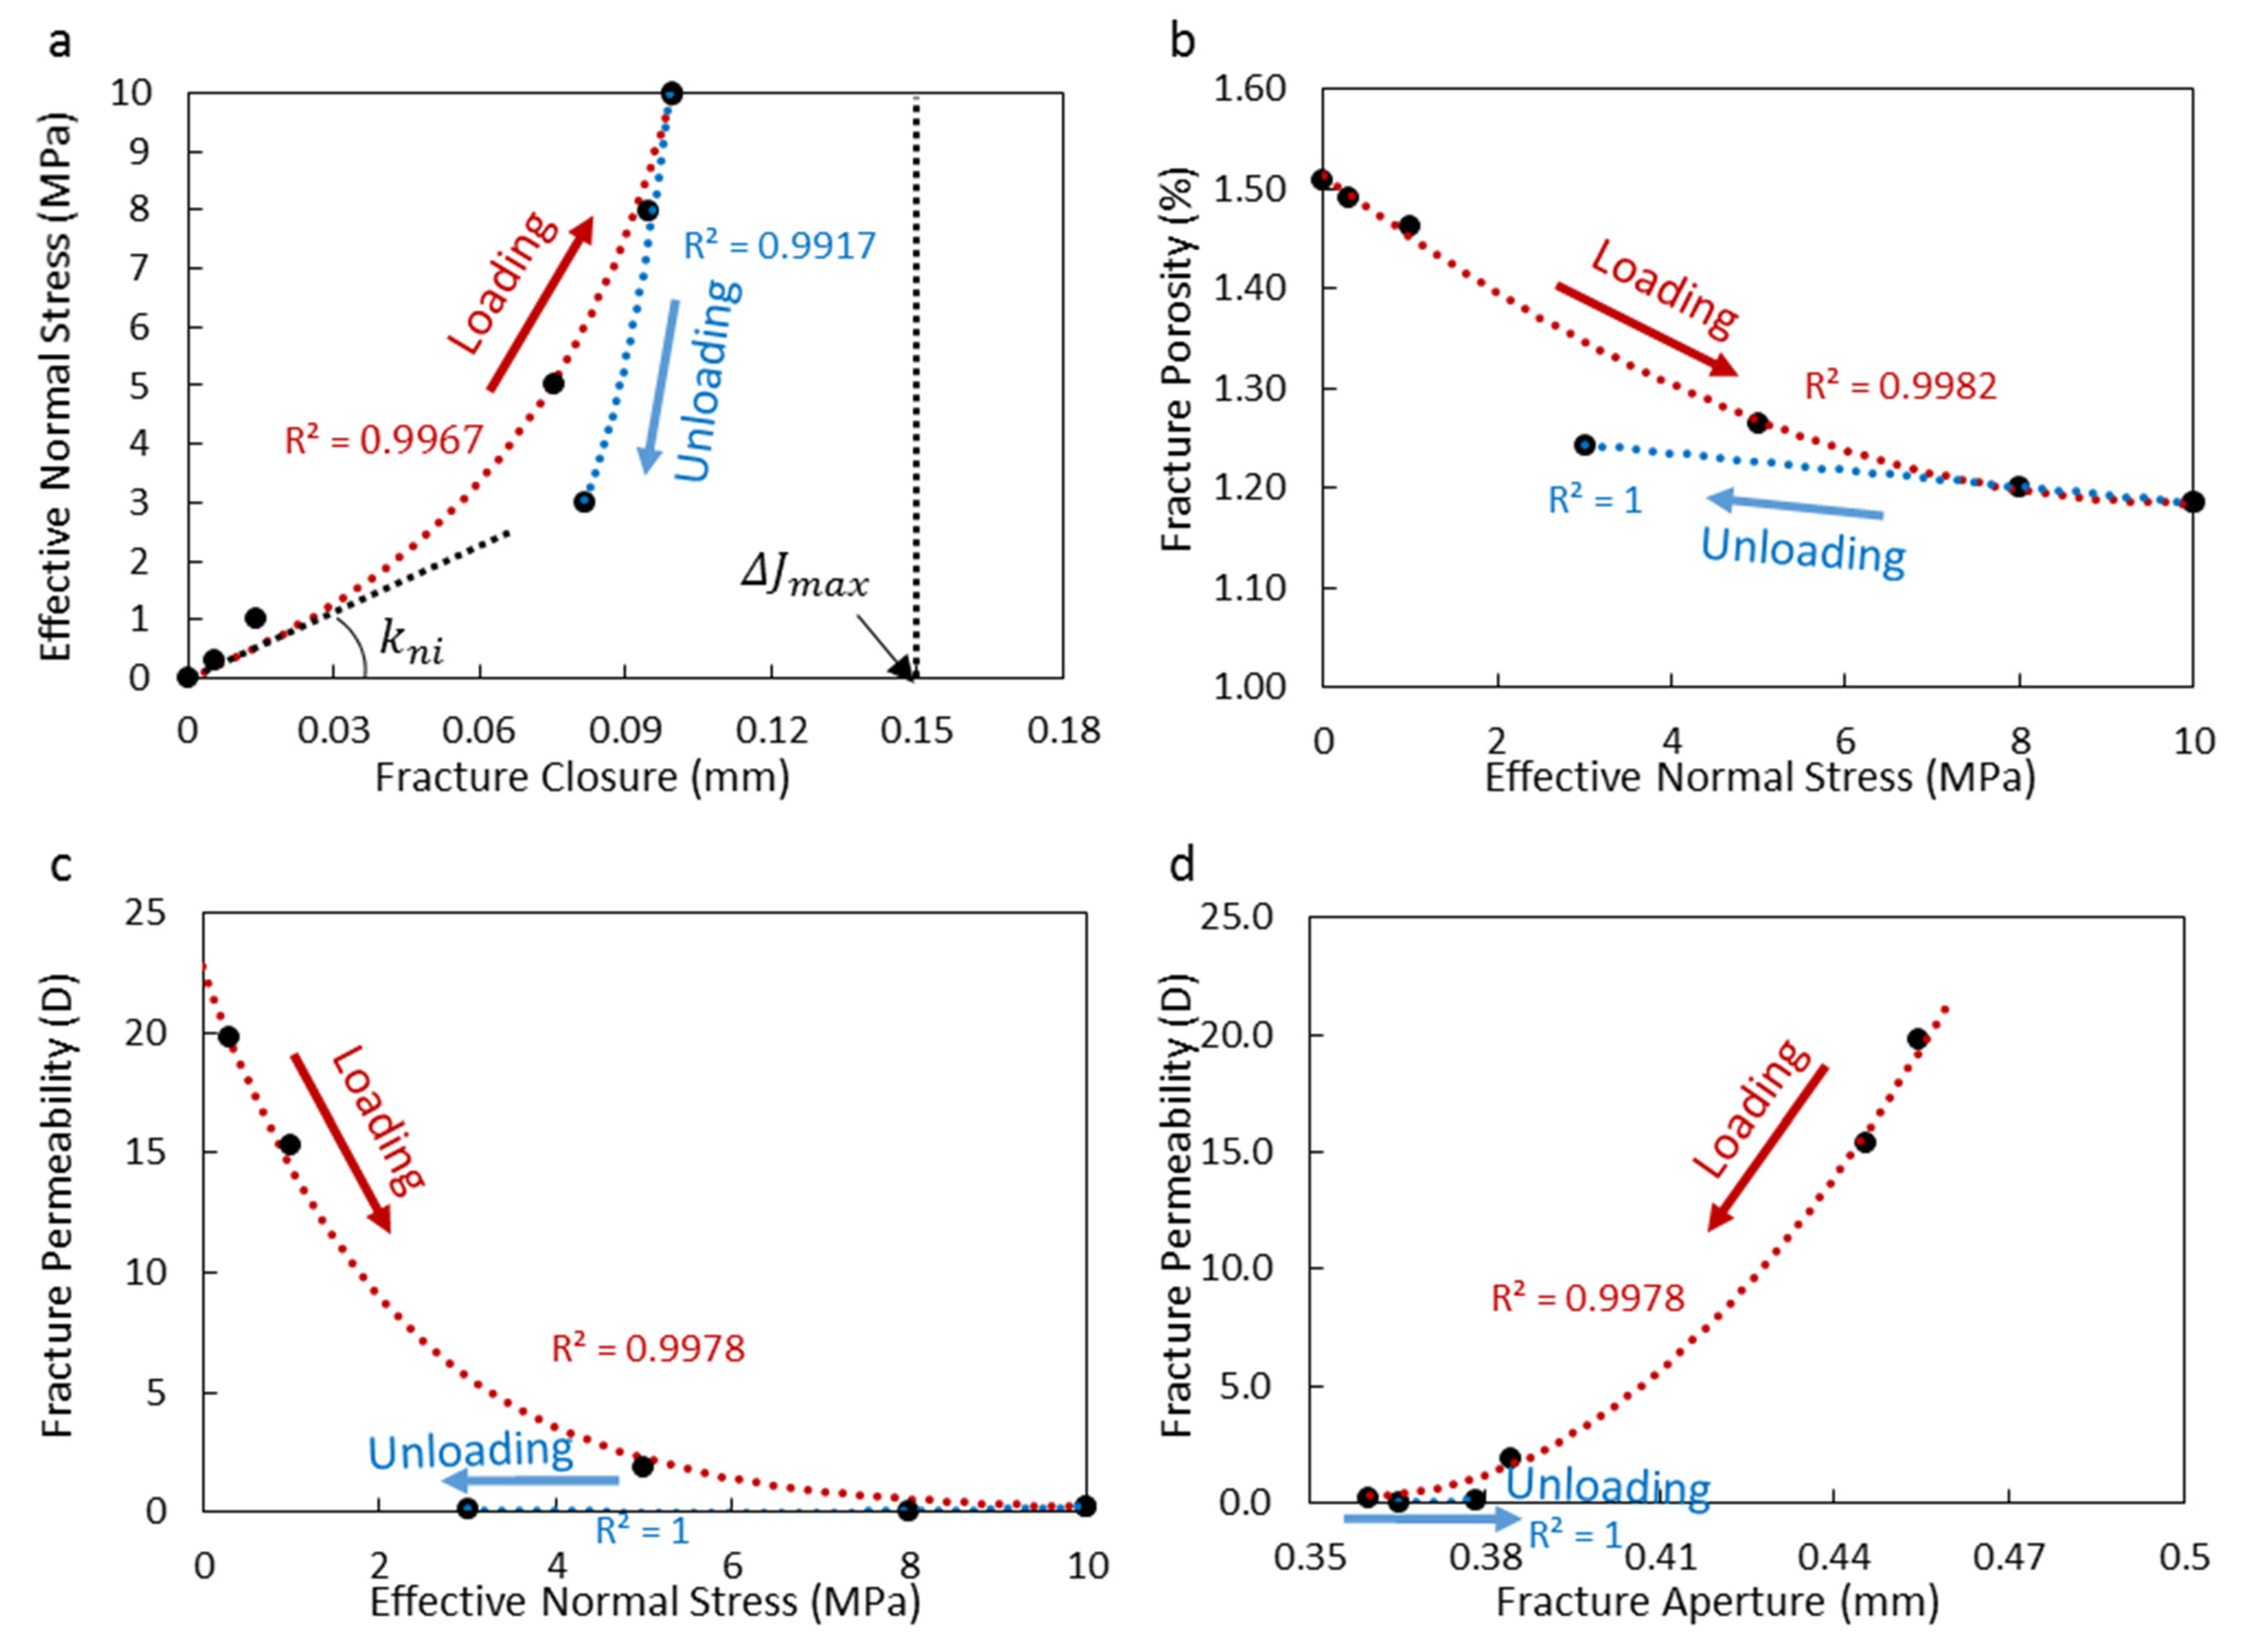
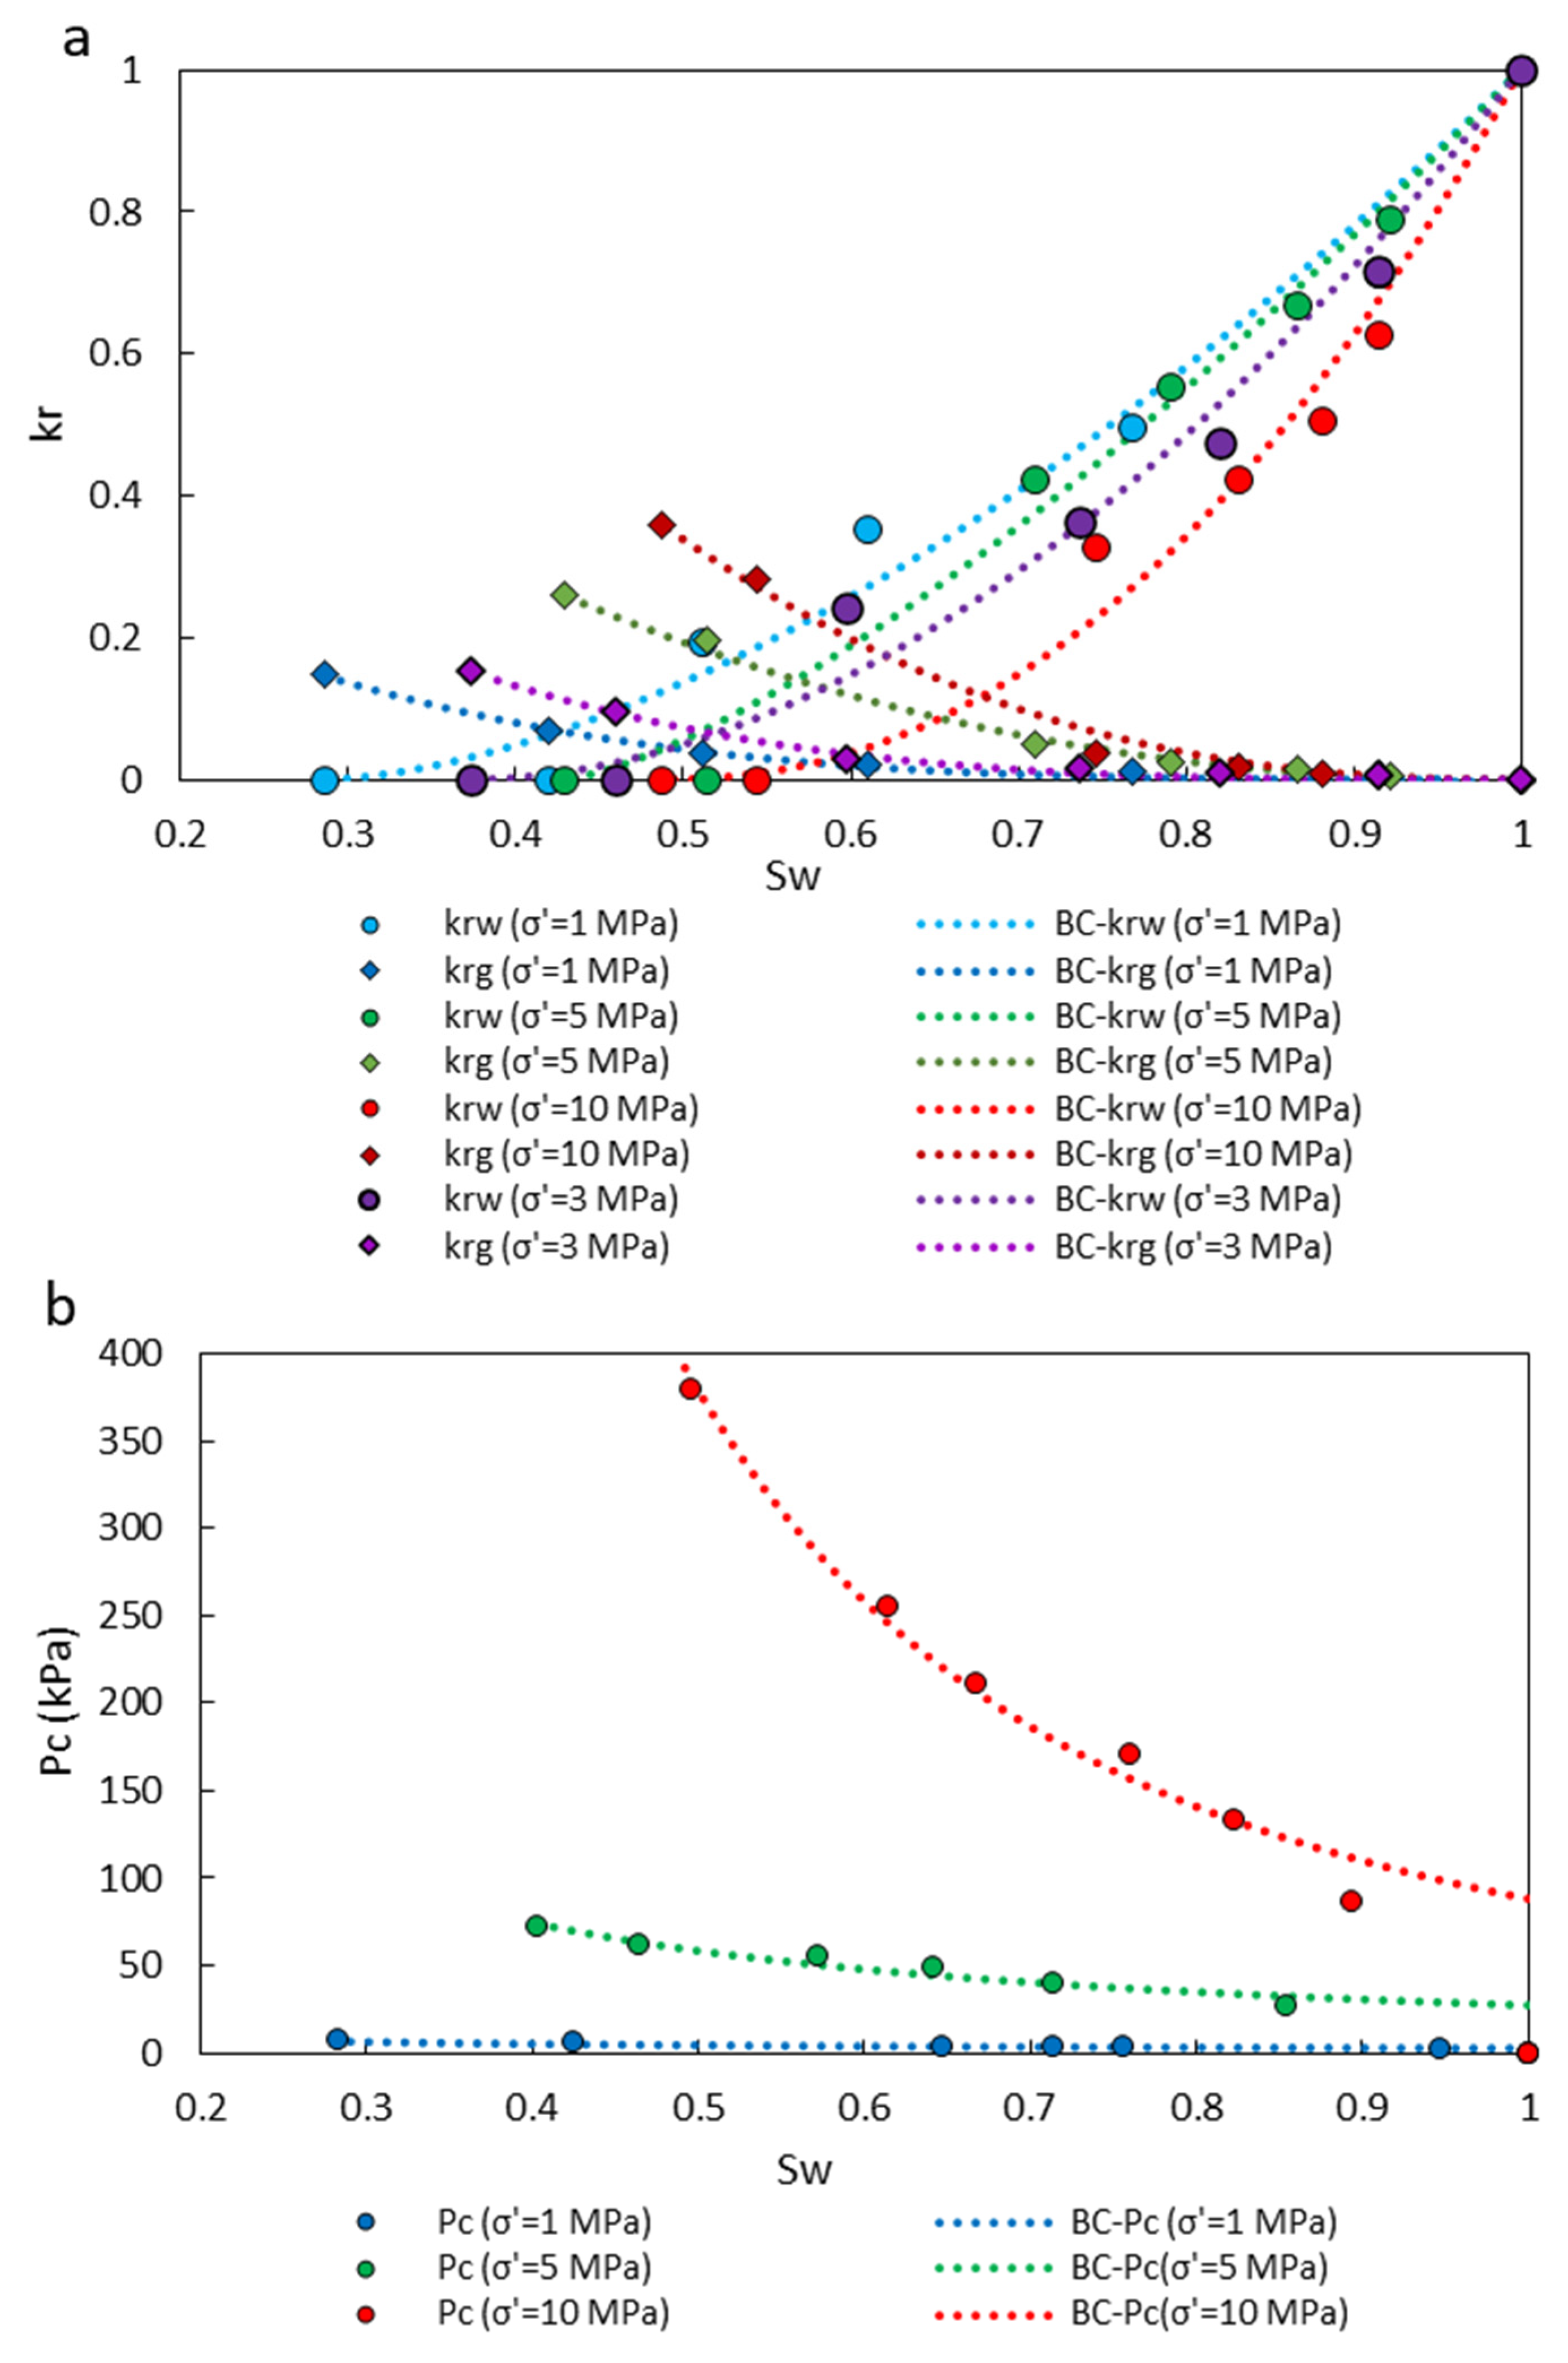
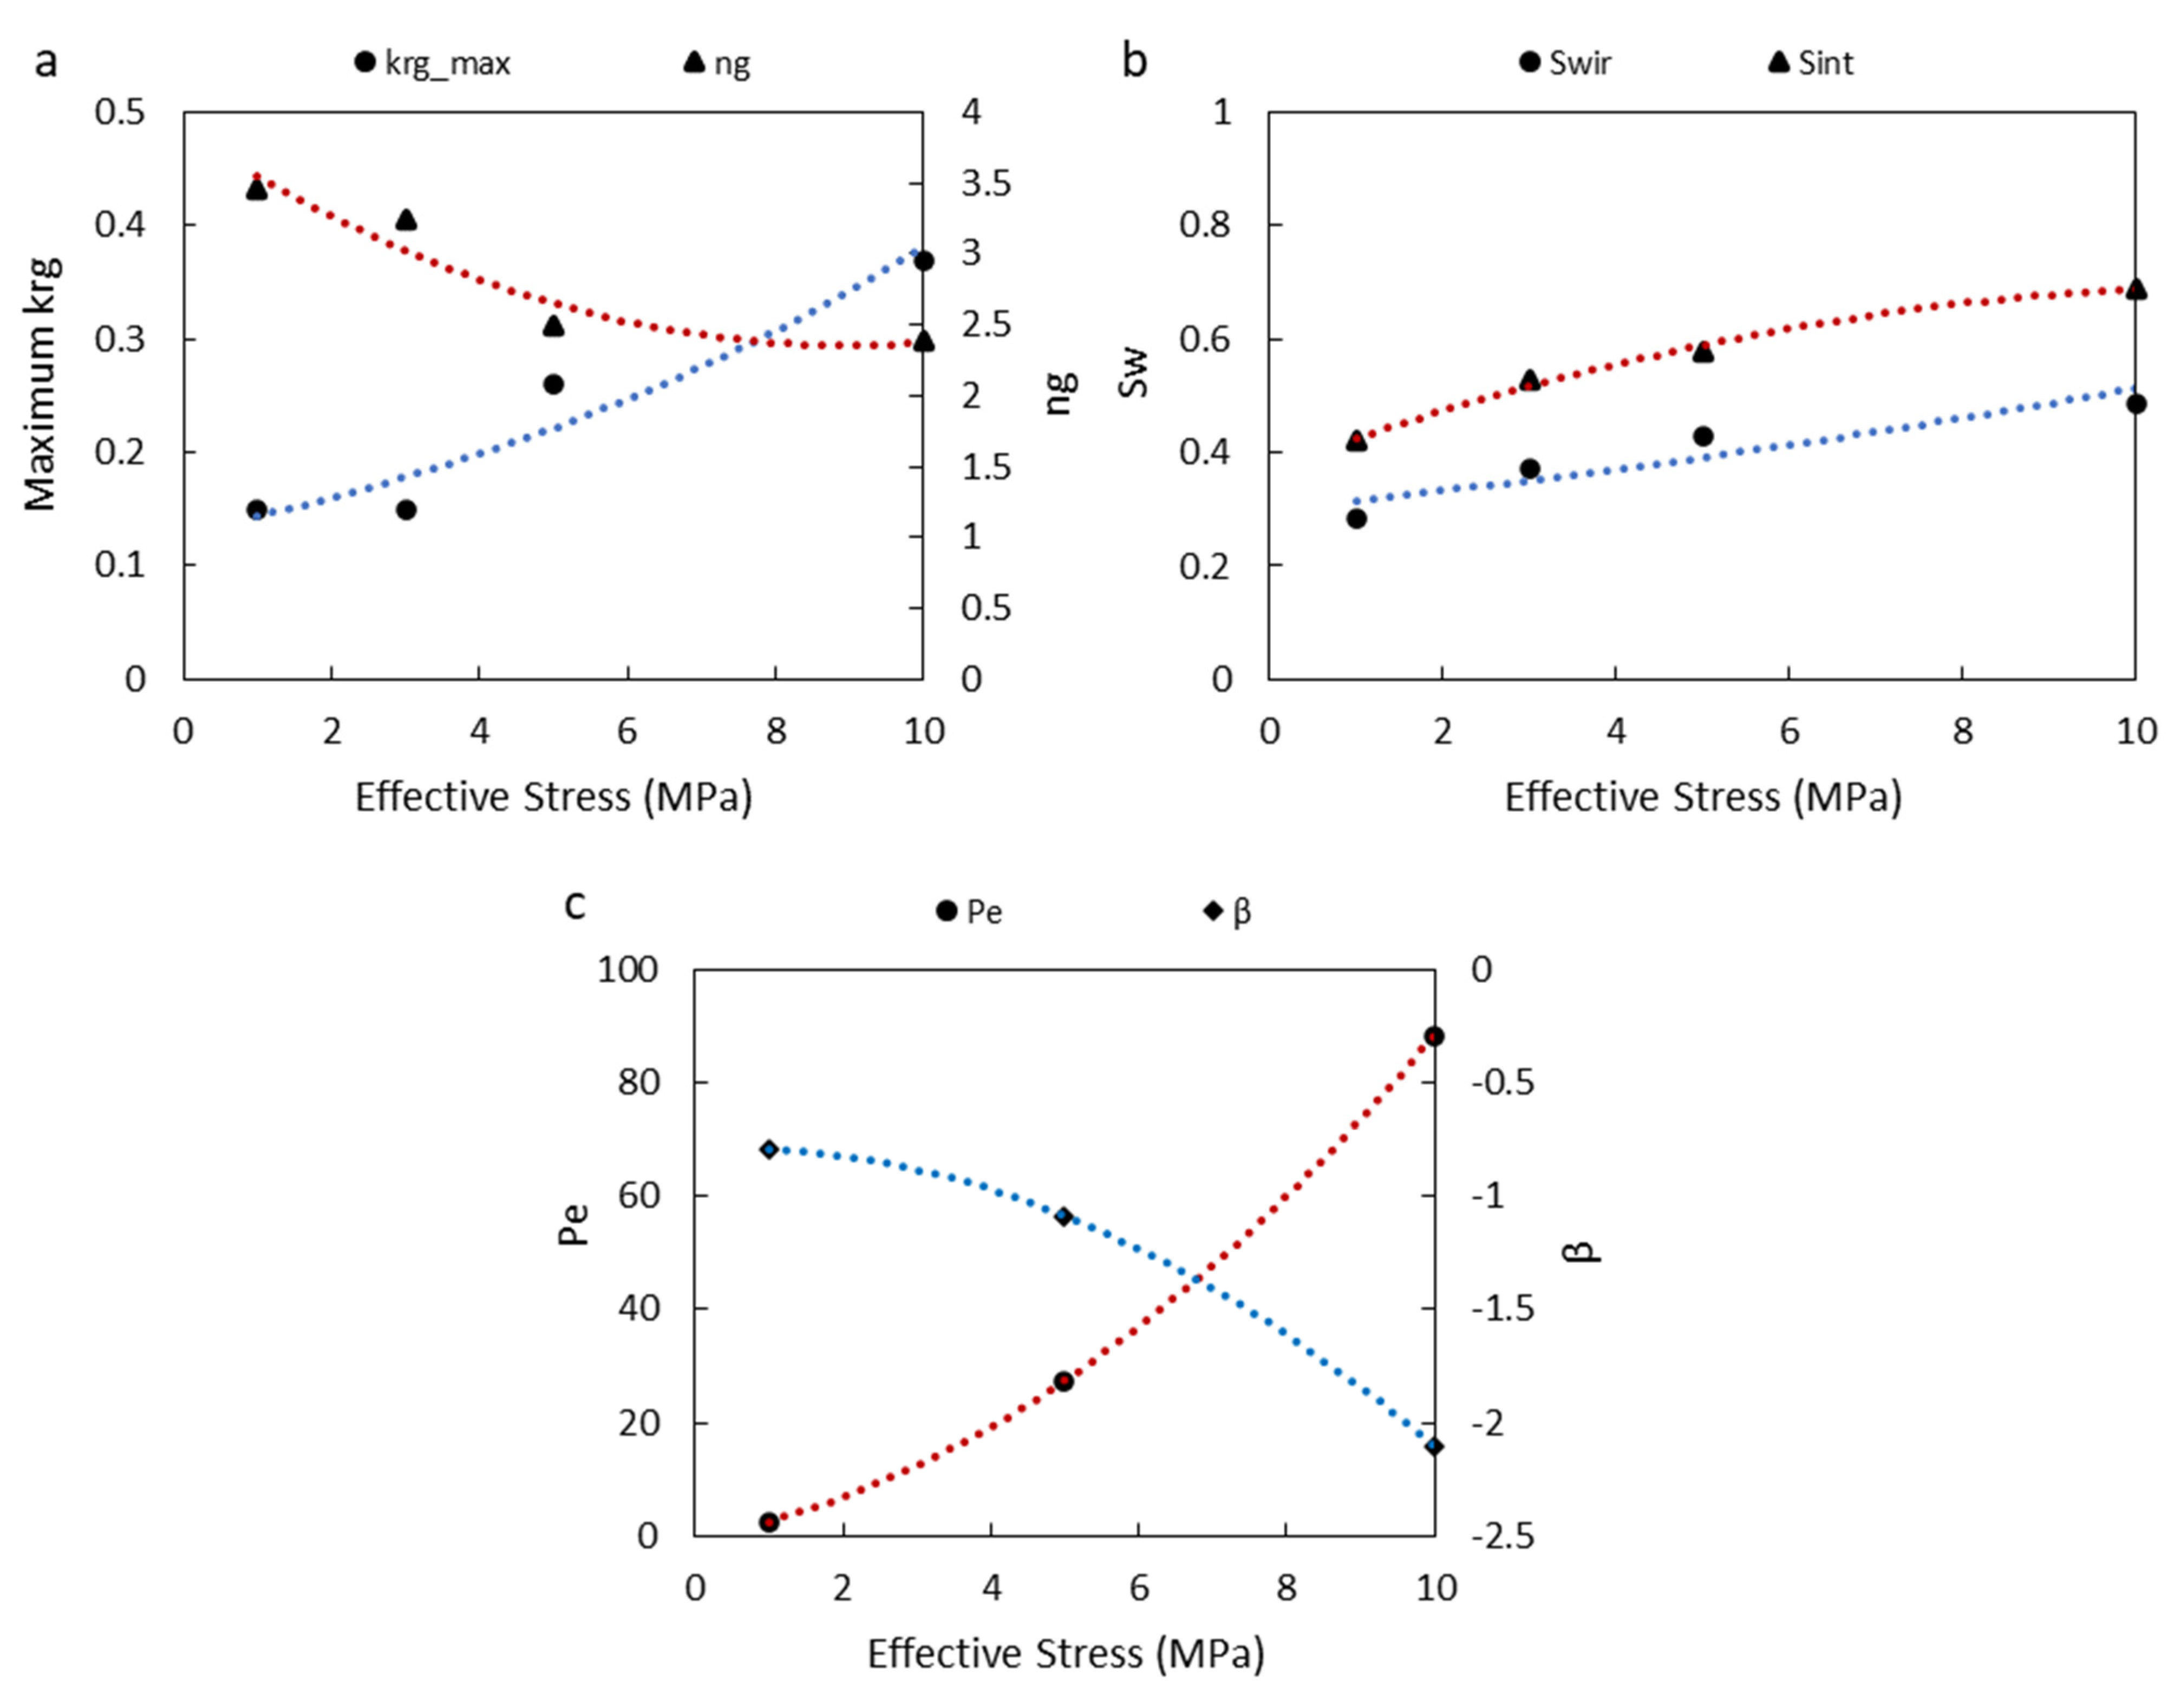
4.2. Stress-Dependent Drainage Relative Permeability and Capillary Pressure of Fracture

Figure 6 qualitatively shows the stress-dependent changes in the relative permeability and capillary pressure of the fractured Calumet carbonate. Figure 6a depicts the changes in the experimental relative permeability data of the fracture under increasing effective stress (1, 5, and 10 MPa) during loading and decreasing effective stress to 3 MPa during unloading. The mixed-wet fracture showed rightward shifts in the relative permeability curves in response to an increase in effective stress. Figure 6b illustrates the substantial upward shift in the dynamic capillary pressure curves at different effective stress conditions for the fractured specimen. In Figure 6, we used the modified Brooks–Corey (BC) type-curves and the least-squares regression method for fitting relative permeability and capillary pressure curves (Equations (13)–(15)).
The non-linear k r and P c curves with saturation in Figure 6 challenged the classical assumption of the linear flow model in a slit. We found that this nonlinearity was due to the impact of effective confining stress and the closure of the interlocked rough fracture, which made the fracture act comparably to a porous material. Additionally, based on the Young–Laplace equation for static capillary pressure [31] of parallel plates, P c = 2 γ cos ( α ) / J , we expected an increase in capillary pressure with a stress-dependent fracture closure (i.e., a decrease in J while the interfacial tension, γ , and contact angle, α , were fixed). However, the dynamic nature of P c (instead of static P c from the Young–Laplace equation) and the similarity of the stressed fracture to a stress-sensitive porous medium explain the excessive increase of P c at 10 MPa of effective confining stress in Figure 6b. These novel observations underscore the importance of accurately characterizing the fracture properties for flow simulation in stress-sensitive fractured formations.
Figure 7 quantifies the changes in the BC fitting parameters and end-points of the relative permeability and capillary pressure curves in Figure 6. Figure 7a presents an increase in the maximum (i.e., end-point) gas relative permeability and a decrease in n g (BC fitting parameter in Equation (15)) with stress of the fracture. Figure 7b shows an increase in the irreducible water saturation and water saturation at the intersection point between the gas and water relative permeability curves at each effective stress condition. These findings declare an increase in the trapped water with further deformation of the fracture during gas flooding (i.e., drainage process). Figure 7c highlights a significant increase in the entry capillary pressure P e and a decrease in β (BC fitting parameter in Equation (13)) with stress. Stress-dependent pore compaction increased the capillary pressure, assuming a deformable fracture as a porous medium, which supported our observed changes for P e and β in Figure 7c.
In this study, our experimental observation of the hydrodynamic properties of a low-permeable intact Calumet rock proved that a significant leak of hydrocarbon and steam through the McMurray reservoir underburden rock is unlikely, which is suitable for steam-assisted gravity drainage (SAGD) operations in the Waterways formation, Foster Creek North project, Alberta. Furthermore, our experimental results demonstrated that a decrease in effective stress due to a high-pressure steam injection decreased the gas (non-wetting phase) relative permeability of the fracture, which is partially favourable for preventing steam evasion through the random oil-saturated fractures in the McMurray’s underburden.

5. Summary and Conclusions

We have experimentally revealed the systematic control of stress-dependent fracture closure on the single-phase and multiphase fluid flow properties of an artificially fractured carbonate rock via a series of isothermal core-flooding experiments using the immiscible fluid pair of water/N2 during loading and unloading cycles. Our single-phase experiments have shown the inelastic deformation of the fracture and a hysterics effect during the loading and unloading cycles. Our two-phase experiments have shown rightward and upward shifts in the relative permeability and capillary pressure curves of the fracture, respectively, during loading and unloading, and have shown an increase in S w i r and k r g _ m a x under increasing effective stress conditions. We used several physical and experimental models to fit and interpret the experimental data in this study. We measured a 1% decrease in porosity (0.811 to 0.804) and a 64% decrease in F permeability (1.6 µD to 0.56 nD) of the intact rock in response to increasing effective stress from 0 to 30 MPa. Additionally, we developed empirical and semi-analytical models to quantify the hydro-mechanical properties of intact rock. These findings underscore the unprecedented control of effective stress on the multiphase flow properties of fractures and elaborate on the physics behind the changes, which challenges the classical assumption of zero capillary pressure and X-shaped relative permeability curves for fractures in geological formations.

Author Contributions

Conceptualization, A.H.H. and R.C.; methodology, A.H.H.; validation, A.H.H.; formal analysis, A.H.H.; investigation, A.H.H.; resources, A.H.H. and R.C.; writing—original draft preparation, A.H.H.; writing—review and editing, A.H.H. and R.C.; supervision, R.C.; project administration, A.H.H.; funding acquisition, R.C. All authors have read and agreed to the published version of the manuscript.

Funding

This research received no external funding.

Data Availability Statement

The data presented in this study are available upon request from the corresponding author.

Acknowledgments

The authors are grateful for the financial support of the NSERC/Energi Simulation Industrial Research Consortia on Reservoir Geomechanics. We also acknowledge Radu Buzea’s help from Cenovus Energy in providing the subsurface cores for the experiments. Finally, we thank ORS for providing the Dragonfly software to conduct the micro-CT image post-processing in this study.

Conflicts of Interest

The authors declare no conflict of interest relevant to this study.

References

  1. Ahmed, T.; McKinney, P. Advanced Reservoir Engineering; Elsevier/Gulf Professional Pub: Burlington, MA, USA, 2011. [Google Scholar]
  2. Rahman, M.J.; Jamilur, M.F.; Nazmul, H.M. 3D Field-Scale Geomechanical Modeling of Potential CO2 Storage Site Smeaheia, Offshore Norway. Energies 2022, 15, 1407. [Google Scholar] [CrossRef]
  3. Cueto-Felgueroso, L.; Juanes, R. Nonlocal interface dynamics and pattern formation in gravity-driven unsaturated flow through porous media. Phys. Rev. Lett. 2008, 101, 244504. [Google Scholar] [CrossRef] [PubMed]
  4. Berre, I.; Doster, F.; Keilegavlen, E. Flow in fractured porous media: A review of conceptual models and discretization approaches. Transp. Porous Media 2019, 130, 215–236. [Google Scholar] [CrossRef]
  5. Huo, D.; Benson, S.M. Experimental Investigation of Stress-Dependency of Relative Permeability in Rock Fractures. Transp. Porous Media 2016, 113, 567–590. [Google Scholar] [CrossRef]
  6. Lian, P.; Cheng, L.; Ma, C.Y. The characteristics of relative permeability curves in naturally fractured carbonate reservoirs. J. Can. Pet. Technol. 2012, 51, 137–142. [Google Scholar] [CrossRef]
  7. McDonald, A.E.; Beckner, B.L.; Chan, H.M.; Jones, T.A.; Wooten, S.O. Some important considerations in the simulation of naturally fractured reservoirs. In Low Permeability Reservoirs Symposium; Society of Petroleum Engineers: Richardson, TX, USA, 1991. [Google Scholar]
  8. Zoback, M.D. Reservoir Geomechanics; Cambridge University Press: Cambridge, MA, USA, 2010. [Google Scholar]
  9. Lund Snee, J.E.; Zoback, M.D. Multiscale variations of the crustal stress field throughout North America. Nat. Commun. 2020, 11, 1951. [Google Scholar] [CrossRef] [PubMed]
  10. Haghi, A.H.; Kharrat, R.; Asef, M.R.; Rezazadegan, H. Present-day stress of the central Persian Gulf: Implications for drilling and well performance. Tectonophysics 2013, 608, 1429–1441. [Google Scholar] [CrossRef]
  11. Haghi, A.H.; Chalaturnyk, R.; Ghobadi, H. The state of stress in SW Iran and implications for hydraulic fracturing of a naturally fractured carbonate reservoir. Int. J. Rock Mech. Min. Sci. 2018, 105, 28–43. [Google Scholar] [CrossRef]
  12. Heidbach, O.; Rajabi, M.; Cui, X.; Fuchs, K.; Müller, B.; Reinecker, J.; Ziegler, M.O. The World Stress Map database release 2016: Crustal stress pattern across scales. Tectonophysics 2018, 744, 484–498. [Google Scholar] [CrossRef]
  13. Haghi, A.H.; Kharrat, R.; Asef, M.R. A case study for HCL-based fracturing and stress determination: A Deformation/Diffusion/Thermal approach. J. Pet. Sci. Eng. 2013, 112, 105–116. [Google Scholar] [CrossRef]
  14. Kohli, A.; Zoback, M. Stratigraphically Controlled Stress Variations at the Hydraulic Fracture Test Site-1 in the Midland Basin, TX. Energies 2021, 14, 8328. [Google Scholar] [CrossRef]
  15. Zimmerman, R.W.; Somerton, W.H.; King, M.S. Compressibility of porous rocks. J. Geophys. Res. 1986, 91, 12765–12777. [Google Scholar] [CrossRef]
  16. Zhu, W.; Wong, T.F. The transition from brittle faulting to cataclastic flow: Permeability evolution. J. Geophys. Res. Solid Earth 1997, 102, 3027–3041. [Google Scholar] [CrossRef]
  17. Haghi, A.H.; Chalaturnyk, R.; Geiger, S. New semi-analytical insights into stress-dependent imbibition in naturally fractured carbonate reservoirs. Water Resour. Res. 2018, 54, 9605–9622. [Google Scholar] [CrossRef]
  18. Xu, D.; Chen, S.; Chen, J.; Xue, J.; Yang, H. Study on the Imbibition Damage Mechanisms of Fracturing Fluid for the Whole Fracturing Process in a Tight Sandstone Gas Reservoir. Energies 2022, 15, 4463. [Google Scholar] [CrossRef]
  19. Barton, N.; Bandis, S.; Bakhtar, K. Strength, deformation and conductivity coupling of rock joints. Int. J. Rock Mech. Min. Sci. Geomech. Abstr. 1985, 22, 121–140. [Google Scholar] [CrossRef]
  20. Stokes, G.G. On the theories of the internal friction of fluids in motion, and of the equilibrium and motion of elastic solids. Trans. Camb. Philos. Soc. 1845, 8, 287–305. [Google Scholar]
  21. Boussinesq, J. Mémoire sur l’influencedes frottments dans les mouvements reguliers des fluids (Thesis about the influence of friction within the steady flow of fluids). Louisville 1868, 13, 377–424. [Google Scholar]
  22. Witherspoon, P.A.; Wang, J.S.; Iwai, K.; Gale, J.E. Validity of cubic law for fluid flow in a deformable rock fracture. Water Resour. Res. 1980, 16, 1016–1024. [Google Scholar] [CrossRef]
  23. Zimmerman, R.W.; Bodvarsson, G.S. Hydraulic conductivity of rock fractures. Transp. Porous Media 1996, 23, 1–30. [Google Scholar] [CrossRef]
  24. Bisdom, K.; Bertotti, G.; Nick, H.M. The impact of different aperture distribution models and critical stress criteria on equivalent permeability in fractured rocks. J. Geophys. Res. Solid Earth 2016, 121, 4045–4063. [Google Scholar] [CrossRef]
  25. Babadagli, T.; Ren, X.; Develi, K. Effects of fractal surface roughness and lithology on single and multiphase flow in a single fracture: An experimental investigation. Int. J. Multiph. Flow 2015, 68, 40–58. [Google Scholar] [CrossRef]
  26. Martin, V.; Jaffré, J.; Roberts, J.E. Modeling fractures and barriers as interfaces for flow in porous media. SIAM J. Sci. Comput. 2005, 26, 1667–1691. [Google Scholar] [CrossRef]
  27. Moinfar, A.; Narr, W.; Hui, M.H.; Mallison, B.; Lee, S.H. Comparison of discrete-fracture and dual-permeability models for multiphase flow in naturally fractured reservoirs. In Proceedings of the SPE Reservoir Simulation Symposium, The Woodlands, TX, USA, 21–23 February 2011; OnePetro: Richardson, TX, USA, 2011. [Google Scholar]
  28. Haghi, A.H.; Chalaturnyk, R.; Talman, S. Stress-Dependent Pore Deformation Effects on Multiphase Flow Properties of Porous Media. Sci. Rep. 2019, 9, 15004. [Google Scholar] [CrossRef] [PubMed]
  29. Haghi, A.H.; Talman, S.; Chalaturnyk, R. Consecutive Experimental Determination of Stress-dependent Fluid Flow Properties of Berea Sandstone and Implications for Two-phase Flow Modelling. Water Resour. Res. 2020, 56, e2018WR024245. [Google Scholar] [CrossRef]
  30. Haghi, A.H.; Chalaturnyk, R.; Blunt, M.J.; Hodder, K.; Geiger, S. Poromechanical controls on spontaneous imbibition in earth materials. Sci. Rep. 2021, 11, 3328. [Google Scholar] [CrossRef]
  31. Peters, E.J. Advanced Petrophysics: Dispersion, Interfacial Phenomena; Greenleaf Book Group: Austin, TX, USA, 2012; Volume 2. [Google Scholar]
  32. Detournay, E.; Cheng, A.H.D. Comprehensive rock engineering: Principles, practice and projects. Analysis and design method. Fundam. Poroelasticity 1993, 2, 113–171. [Google Scholar]
  33. Liu, H.H.; Rutqvist, J.; Berryman, J.G. On the relationship between stress and elastic strain for porous and fractured rock. Int. J. Rock Mech. Min. Sci. 2009, 46, 289–296. [Google Scholar] [CrossRef]
  34. Bagheri, M.; Settari, A. Modeling Fluid Flow in Deformable Fractured Reservoirs using Full Tensor permeability. In Proceedings of the EAGE Annual Conference and Exhibition, Rome, Italy, 9–12 June 2008; pp. 9–12. [Google Scholar]
  35. Pariseau, W.G. Design Analysis in Rock Mechanics, 2nd ed.; CRC Press: Boca Raton, FL, USA, 2011. [Google Scholar]
  36. Hudson, J.A.; Harrison, J.P. Engineering Rock Mechanics: An Introduction to the Principles; Elsevier: Amsterdam, The Netherlands, 2000. [Google Scholar]
  37. Cundall, P.A.; Lemos, J.V. Numerical simulation of fault instabilities with a continuously-yielding joint model. In Rockbursts and Seismicity in Mines; Balkema, S., Ed.; CRC Press: Boca Raton, FL, USA, 1990; pp. 147–152. [Google Scholar]
  38. Bandis, S.C.; Lumsden, A.C.; Barton, N.R. Fundamentals of rock joint deformation. Int. J. Rock Mech. Min. Sci. Geomech. Abstr. 1983, 20, 249–268. [Google Scholar] [CrossRef]
  39. Kozeny, J. Uber kapillare leitung der wasser in boden. R. Acad. Sci. Vienna Proc. Cl. I 1927, 136, 271–306. [Google Scholar]
  40. Carman, P.C. Permeability of saturated sands, soils and clays. J. Agric. Sci. 1939, 29, 262–273. [Google Scholar] [CrossRef]
  41. Batchelor, G.K. An Introduction to Fluid Dynamics. Cambridge Mathematical Library; Cambridge University Press: Cambridge, UK, 1967. [Google Scholar]
  42. Elrod, H.G. A general theory for laminar lubrication with Reynolds roughness. J. Lubr. Technol. 1979, 101, 8–14. [Google Scholar] [CrossRef]
  43. Landau, L.D.; Lifshitz, E.M. Electrodynamics of Continuous Media; F’ergamon Press: New York, NY, USA, 1960. [Google Scholar]
  44. Zimmerman, R.W.; Kumar, S.; Bodvarsson, G.S. Lubrication theory analysis of the permeability of rough-walled fractures. Int. J. Rock Mech. Min. Sci. Geomech. Abstr. 1991, 28, 325–331. [Google Scholar] [CrossRef]
  45. Purcell, W.R. Capillary pressures-their measurement using mercury and the calculation of permeability therefrom. J. Pet. Technol. 1949, 1, 39–48. [Google Scholar] [CrossRef]
  46. Burdine, N. Relative permeability calculations from pore size distribution data. J. Pet. Technol. 1953, 5, 71–78. [Google Scholar] [CrossRef]
  47. Brooks, R.H.; Corey, A.T. Properties of porous media affecting fluid flow. J. Irrig. Drain. Div. 1966, 92, 61–90. [Google Scholar] [CrossRef]
  48. Van Genuchten, M.T. A closed-form equation for predicting the hydraulic conductivity of unsaturated soils 1. Soil Sci. Soc. Am. J. 1980, 44, 892–898. [Google Scholar] [CrossRef]
  49. Lawrence, M.; Jiang, Y. Porosity, pore size distribution, micro-structure. In Bio-Aggregates Based Building Materials; Springer: Dordrecht, The Netherlands, 2017; pp. 39–71. [Google Scholar]
  50. Niu, Y.; Mostaghimi, P.; Shabaninejad, M.; Swietojanski, P.; Armstrong, R.T. Digital rock segmentation for petrophysical analysis with reduced user bias using convolutional neural networks. Water Resour. Res. 2020, 56, e2019WR026597. [Google Scholar] [CrossRef]
  51. Rouquerol, J.; Llewellyn, P.; Rouquerol, F. Is the BET equation applicable to microporous adsorbents. Stud. Surf. Sci. Catal 2007, 160, 49–56. [Google Scholar]
  52. Cooper, J.R.; Dooley, R.B. Release of the IAPWS Formulation 2008 for the Viscosity of Ordinary Water Substance. The International Association for the Properties of Water and Steam. 2008. Available online: http://www.iapws.org (accessed on 17 January 2019).
  53. Lemmon, E.W.; Jacobsen, R.T. Viscosity and thermal conductivity equations for nitrogen, oxygen, argon, and air. Int. J. Thermophys. 2004, 25, 21–69. [Google Scholar] [CrossRef]
  54. Yan, W.; Zhao, G.Y.; Chen, G.J.; Guo, T.M. Interfacial tension of (methane+ nitrogen)+ water and (carbon dioxide+ nitrogen)+ water systems. J. Chem. Eng. Data 2001, 46, 1544–1548. [Google Scholar] [CrossRef]
  55. Richardson, J.G.; Kerver, J.K.; Hafford, J.A.; Osoba, J.S. Laboratory determination of relative permeability. J. Pet. Technol. 1952, 4, 187–196. [Google Scholar] [CrossRef]
  56. Leas, W.J.; Jenks, J.H.; Russell, C.D. Relative permeability to gas. J. Pet. Technol. 1950, 2, 65–72. [Google Scholar] [CrossRef]
  57. Pini, R.; Benson, S.M. Simultaneous determination of capillary pressure and relative permeability curves from core-flooding experiments with various fluid pairs. Water Resour. Res. 2013, 49, 3516–3530. [Google Scholar] [CrossRef]
  58. NRCS. Chapter 4—Engineering Classification of Rock Materials. In National Engineering Handbook (NEH), Part 631-Geology; 631.0401 Rock Material Properties, Section (c); NRCS: Washington, DC, USA, 2012. [Google Scholar]
  59. Pyrak-Nolte, L.J.; Morris, J.P. Single fractures under normal stress: The relation between fracture specific stiffness and fluid flow. Int. J. Rock Mech. Min. Sci. 2000, 37, 245–262. [Google Scholar] [CrossRef]
Figure 1. Pictures showing (a) intact Calumet carbonate, (b,c) measured contact angles of a water droplet at the dry surface of the rock revealing mixed wettability of the rock, (d) sessile drop test result showing the initial wettability of the carbonate rock to the oil phase, and (e) artificially fractured specimens.
Energies 15 06769 g001
Figure 2. Micro-CT images illustrating (a) carbonate core and the fracture inside it and (b) micro-scale asperity on the surface of the fracture.
Energies 15 06769 g002
Figure 3. Measurements of (a) cumulative pore size distribution and specific pore surface area using BJH and BET techniques, respectively, and (b) the uniaxial compressive strength test results for the intact Calumet carbonate specimen.
Energies 15 06769 g003
Figure 4. Core-scale experimental results representing the stress dependency of structural and single-phase flow properties of the intact rock: (a) effective stress versus pore strain plot, (b) stress-dependent porosity and absolute permeability, and (c) normalized permeability versus normalized tortuosity with effective stress.
Energies 15 06769 g004
Figure 5. Core-scale experimental results showing the stress dependency of structural and single-phase flow properties of the fractured rock during loading and unloading cycles: (a) effective normal stress versus fracture closure plot, (b) stress-dependent fracture porosity, (c) stress-dependent fracture absolute permeability, and (d) fracture permeability and aperture relation.
Energies 15 06769 g005
Figure 6. Experimental stress-dependent plots of: (a) relative permeability curves and (b) capillary pressure curves of the fractured Calumet carbonate specimen.
Energies 15 06769 g006
Figure 7. Changes in relative permeability and capillary pressure curves with effective confining stress using (a) maximum gas relative permeability and n g (B–C fitting parameter in Equation (15)), (b) irreducible water saturation and water saturation at the intersection point between gas and water relative permeability curves, and (c) entry capillary pressure P e and β (B–C fitting parameter in Equation (13)) of the fractured Calumet carbonate specimen.
Energies 15 06769 g007
Publisher’s Note: MDPI stays neutral with regard to jurisdictional claims in published maps and institutional affiliations.

