Abstract
Insular power systems are a special case of infrastructure for power production due to their particular land morphology with extensive hills and ridges. For a higher renewable energy share in the power production, a dedicated design according to local constraints is required. The high wind and solar resources of such cases can be utilized with offshore wind turbines and concentrating solar power, respectively. In addition, pumped-hydro storage is a mature and suitable technology for such terrain. A case study is presented in the island of Rhodes to obtain a renewable energy penetration higher than 70%. The technical and financial requirements for this implementation support the design of this system, while the introduction of concentrating solar power enables significant energy savings during the periods of peak demand of the island. An annual RES penetration close to 80% can be achieved with the combined operation of both plants. The economic viability of the required investment can be ensured with selling prices of the produced electricity in the range of 0.20 EUR/kWh.
1. Introduction
Islands not connected to the main grid are a sensitive area of electricity production, particularly with RES power plants. One reason for this sensitivity is the low availability in conventional energy resources for base-load electricity production. As a result, the electricity production is often based on imported fossil fuels, affecting the security of the energy supply to the insular system and contributing to increased electricity costs [1,2] At the same time, islands incorporate ecosystems of high environmental value that necessarily impose constraints on the employed technologies for electricity production. Fortunately, the widespread potential of renewable energy sources (RES), primarily wind and solar, in combination with the above insular features, in most cases favors the installation of RES technologies for electricity production [3,4]. Consequently, there has been an increased interest in the promotion of RES in insular systems around Europe [5].
Major technologies for renewable power plants convert wind and solar energy directly to electricity. Solar energy is absorbed and converted directly to electricity by solar cell materials with single [6,7] or multiple threshold materials in tandem [8] with a broader absorption of the solar spectrum. Alternatively, solar energy can be absorbed in concentrating solar power (CSP) power plants with the ability of low-cost thermal storage [9]. The increasing penetration of RES in insular systems urges secure electricity storage technologies from the plethora of hybrid renewable energy plants [10] to ensure a stable and secure supply of electricity.
1.1. Solar and Wind Resources
Solar and wind resources are complementary during day and night as well as summer and winter to offer a better load-matching, due to the different climatological factors responsible for solar and wind resources. A small-scale solar/wind hybrid of 20 MW capacity was optimized in Kuwait [11]. The resource assessment of solar and onshore wind over a 4 × 4 km2 cell and 100 generation sites in Italy exhibited local complementarity with correlation coefficient lower than −0.8 and large-scale complementarity between −0.65 and −0.6 [12]. The need of a reference metric and quality assurance was reported in [13] to allow the comparison of different analysis outputs for complementarity. A high seasonal comparison of the much-needed daily and inter-annual complementarity was reported at a regional scale, indicating that careful site selection should be studied in larger spatial scales and accompanied by storage systems [14].
An assessment of the global solar and wind resources highlighted a share of solar energy generation > 75% in tropical zones and a higher share of wind generators in Europe [15]. For a 100% RES power system in Europe, an optimal mix of 60/40% wind/solar generation was found for ideal round-trip storage [16]. High temporal synergies between solar and wind resources were reported along the western and southern coast, as well as between south-eastern and northern regions of Australia [17]. A 40% synergy was found at a distance of 93 km between regions, while 50% was reported at a distance of 465 km. The latter distance matches the proximity to transmission lines to cover 88% of the total land area of the continent. A large-scale geographical experiment over an area of 350,000 km2 in the Iberian peninsula showed that wind and solar resources are largely complementary and the advantages of power mixes compared to single-site installations [18]. The findings are in agreement with [19] where optimal solar and wind locations in the same region were found for a more balanced capacity factor compared to random locations, as well as more stable power production. It can be, consequently, understood that spatio-temporal assessments of power plants based on solar and wind energy require a large scale that, in many cases, is beyond the borders of several regions.
1.2. CSP and Wind Energy Hybrids
CSP scaling is riskier compared to photovoltaic and wind hybrids [20]. CSP–biomass and CSP–geothermal hybrids offer stronger than CSP–Wind hybrids due to the increased sharing of resources [21,22]. Due to the diversity between thermal and electrical power output in CSP–Wind hybrids, however, co-location is not required and suggests potential of integration at the grid level due to the reduced capital costs of the transmission lines [23].
If co-location of the CSP/Wind plants is granted, wind energy can be stored in thermal energy by using electric heaters. This may be more common during hours of low solar resource and can reduce curtailment of wind energy [21]. The cost of adding an electric heater to a hybrid CSP/Wind accounts for nearly 1% of the total capital cost of the system, resulting after optimization with evolutionary algorithms to a LCoE of 252 USD/MWh and 256 USD/MWh with and without heater, respectively [24]. At power plant capacities of the MW scales, however, a wind–thermal energy storage as proposed by Okazaki et al. can be more cost effective and a stronger hybrid [25].
An annual simulation of a CSP/Wind system based on mixed-integer programing with thermal energy storage and electric heater returned a reduced curtailment from 52.59% to 100% for clear and cloudy days, respectively, with 90% reduced curtailment for 151 days [26]. When CSP is added to an existing RES mix up to 60%, reduced cost and curtailment was reported [27]. The LCoE of standalone CSP plants is not currently favorable; however, LCoE of 176 EUR /MWh was reported for CSP/Wind generation at mid-latitude zones [28].
Several CSP/Wind configurations were reported by [29]. Their findings showed an optimal CSP/Wind ratio of 21.1/66.5% with added electric heating for storage with reduced curtailment to 12.2% and slightly higher NPV compared to a CSP/Wind without electric heating. An 80 MWe hybrid in Zhangbei, China reported 1.91 wind-to-solar capacity ratio with 13 h storage and a 6 MW electric heater [30]. The LCoE of the plant is 148.4 USD/MWh and 196.4 USD/MWh at 10% and 2% loss of power probability, without and with electric heater, respectively [31].
An 800 MWe wind farm with 705 MWe parabolic trough plant in Minnesota reported a LCoE of 123 USD/MWh with a 14% annual efficiency [32]. A 100 MWe CSP plant with 6 h of storage in northwestern Texas was better matching peak summer loads, a 67 MWe wind farm with a 33 MWe CSP plant with 6 h storage was best matching the utility electricity load with a 16% annual efficiency [33]. LCoE of 108–129 USD/MWh and 64 USD/MWh were found for CSP and wind farm plants, respectively. If the two plants are co-located, in addition to reduced transmission costs, increased capacity factors are possible, due to the negative correlation between real-time solar and wind resources, as well as the thermal storage [34].
A hybrid CSP/Wind power plant was designed to cover the energy demand of the island of Skyros. Reduced energy residuals were found; however, the capacity factor of the 10 MWe CSP and 6.6 MWe wind power plants were 16.1% and 34.2%, respectively [35]. The efficiency of the systems was 19.2% and annual of 22.9%, while the LCoE was 400 EUR /MWh. The overall efficiency of solar-driven systems can be improved by adding more components in hybrid solar-driven multi-generation systems [36]; however, an evaluation of cost is required in each hybrid case.
1.3. Pumped Hydro Storage Hybrids
A 20 MW Wind with 17 MW modular pump station and 60 MW PHS was reported for reliable electrification of the Canary islands with reduced curtailment [37]. The PHS system utilized an elevation of 281 m and a capacity of 5 × 10⁶ m3 of existing reservoirs available in the island.
While a PHS can increase the capacity factor of RES and the energy independence of an insular system, power security should in all cases be considered. Hydro turbines suffer rapid-response in positive spinning reserve, while loss of power consumption is possible in heavy-load hydro pumps during valley operation [38]. The use of fixed-speed pumps demonstrated a more secure system operation in a medium-sized island in the Atlantic Ocean with a 32 MW peak load supported by a reversible PHS system comprising of a 7 MW Pelton turbine with a synchronous generator, and hydraulic pumps summing a total of 7.5 MW [38]. A fast power injection at abrupt reduction in wind power was reported with no-water flow operation of Pelton turbines [39].
Wind energy availability and uncertainty of capital expenditure were identified as the inputs with the highest impact in Wind/PHS systems. Two pumps and one turbine were found as optimal in the majority of tested case studies in the island of Terceira, Portugal [40].
A comprehensive review on the trends and challenges over 100 PHS studies concluded that traditional strategies for reserve-driven operation may not be always valid [41]. In particular, the need for more accurate modeling of the possible usage in relation to the physical operation of the plant was identified. The joint operation of energy and reserve markets in relation to the stored and marginal water volume and market-oriented scheduling tools with pumping under variable speed or hydraulic short-circuit were further suggested by the authors for a more efficient operation of PHS systems.
Three hybrid stations of different size in Samos were shown to increase the capacity factor of the island, with a penetration of 39% [42]. The annual simulation of energy production in the island of Ikaria was reported with a Wind/PHS increasing the RES penetration by 50% [43]. Scenaria of Wind/PHS with or without interconnection to the mainland in the island of Lesbos demonstrated an LCoE as low to 140 EUR /MWh [44]. For the island of Crete, 14 wind generation sites with pumped hydro storage (PHS) storage were reported at 120 EUR /MWh [45,46], while for 100% energy independency of the island of Sifnos was reported based on wind, PV and PHS with 150 EUR /MWh with a payback of 15 years [47,48].
A stochastic optimization using mixed-integer programming of the daily operation of wind farm and PHS plant in China showed reduced curtailment from 20% down to 5% and increased profits by 25% [49]. A 5–20% increased revenue was reported for a Wind/PHS model using a heuristic algorithm in a day-ahead market, while the case of bilateral contracts exhibited reduced price volatility in a case study of the Iberian electricity sector [50].
Integrated transmission was shown to reduce the power forecast and hydraulic constraints of increasingly installed Wind/PHS systems in China [51], as well as in the Brazilian electrical network [52]. In the latter network, a CSP/Wind system with hydrothermal storage exhibited 37% reduced costs [53].
In the PHS-dominated electricity market of New Zealand, a 10% increase in wind penetration generated vast price volatility from 0.48 NZD/MWh in winter to 3.05 NZD/MWh in spring. The price volatility peaked in the summer at 5.24 and the authors suggested expansion of wind generation to sites complementary to hydro generation as a solution [54].
Two CSP systems were compared by [55] in two regions of northwestern China with, respectively, different shares of thermal and hydro power. A mixed-integer model was utilized. The LCoE of the thermal-producing region was 238 USD/MWh, while the region supported by hydro power had an LCoE of 177 USD/MWh with 20% CSP share in RES generation, clearly indicating the benefit of CSP storage in inflexible thermal-producing systems and the reduced LCoE in regions with flexible power sources.
To the best of the authors’ knowledge, modeling the operation of a hybrid CSP/Wind power plant with PHS in an insular system has not been reported before in the literature. In this contribution, we present simulations of a combined power plant consisting of offshore wind turbines with PHS and a CSP tower plant with a case study located in the island of Rhodes, Greece. The methodology of the simulation and algorithms for said systems is presented in Section 2, followed by the technical details of the case study in the island of Rhodes in Section 3, while the sizing and the siting specifications of the proposed hybrid system are presented in Section 4.
2. Methodology
The operation algorithm of the combined operation of the overall system is divided in two parts:
- The operation algorithm of the wind park–PHS system.
- The operation algorithm of the solar thermal power plant.
- The operation algorithm is analyzed below separately for the two distinct parts of the overall examined system, beginning with the wind park–pumped hydro storage system [10,48].
- 1
- The calculation data of the calculation process are the wind power production Pw and the power demand Pd. These data are introduced with annual time series of hourly average values. For every time step, the following calculations are executed.
- 2
- A maximum wind power instant penetration a percentage with regard to the power demand equal to 40% is adopted, in order to ensure the insular system’s dynamic security and stability. This practically means that the wind park’s direct penetration Pwp will be equal to:i if Pw > a·Pd, then Pwp = a·Pdii if Pw ≤ a·Pd, then Pwp = Pw.
- 3
- The remaining power demand Pdrem will be:Pdrem = Pd − Pwp.
- 4
- The wind power Pwav available for storage will be:
- 5
- The water volume VP required to be pumped in the PHS upper reservoir, so as the available power Pwav for a time step of duration t can be stored is given by the following relationship (γ the water specific weight, HP the total pumping head and ηP the pumps’ average efficiency) [56]:Vp = ηp·Pwav·t/γ·HP.
- 6
- The water volume VT required to be supplied from the upper reservoir, so as the remaining power demand Pd − Pwp for a time step of duration t can be covered by the hydro turbines, is given by the following relationship (Hh the total water falling head and ηh the hydro turbines’ average efficiency) [7]:VT = (Pd − Pwp)·t/ηh·γ·Hh.
- 7
- The remaining water volume Vst(j) in the PHS upper reservoir at the end of the current time calculation step j will be:Vst(j) = Vst(j − 1) + Vp − Vh.
- 8
- If the remaining water volume in the PHS upper reservoir exceeds the reservoir’s maximum capacity Vmax, then:
- 1.i
- If Vst(j) > Vmax, then (Pst the power storage, Psur the wind power production surplus, Ph the electricity power production from the hydro turbines and Psp the power demand remaining to be covered by the solar thermal power plant) [7]:Ph = Pd − PwpPsp = 0Pst = γ·Hp·(Vmax − Vst(j))/(t·ηp)Psur = Pwav − PstVst(j) = Vmax.
- 1.ii.
- If Vst(j) ≤ Vmax, then the remaining water volume in the upper reservoir is checked for whether it is lower than the minimum water volume, which is always contained in the reservoir, due to constructive limitations:
- 1.a
- If Vst(j) < Vmin, then the water volume contained in the upper reservoir is not enough to undertake the remaining power demand coverage. In this case [7]:Ph = ηh·γ·Hh·(Vst(j) − Vmin)/tPsp = Pd − Pwp − PhPst = PwavPsur = 0Vst(j) = Vmin.
- 1.b
- If Vst(j) ≥ Vmin, then the remaining power demand can be covered by the hydro turbines, hence:Ph = Pd − PwpPsp = 0Pst = PwavPsur = 0Vst(j) = Vst(j − 1) − Vh + Vp.
The operation algorithm presented above is given graphically in Figure 1.
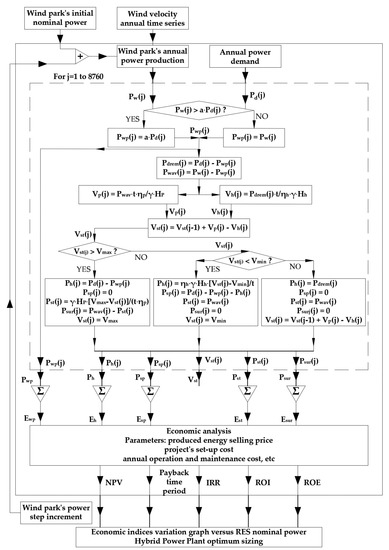
Figure 1.
Operation algorithm of the wind park–PHS plant.
The demand not satisfied by the wind park–PHS plant is covered by the CSP plant, which practically means that the CSP direct penetration Pcspp will be equal to:
i If Pcsp > Pdrem, then Pcspp = Pd
ii If Pcsp ≤ Pdrem, then Pcspp = Pcsp
Accordingly, the direct irradiance Ib of the location will be collected by solar collectors with optical efficiency ηopt at the respective incidence angle θi on the receiver of area Ac, to deliver heat input Qin, calculated as:
Qin = Ib cosθi ηopt Ac
The remaining net heat input Qnet after accounting for radiative and convective losses to the environment, Qrad and Qconv, respectively, is:
where α is the absorptivity of the receiver. Finally, the work W produced by the turbine was calculated as:
from the net heat input and the isentropic efficiency of the Rankine cycle and the efficiency ηG of the generator. All equations were developed in a publicly available code [57] that follows the flowchart presented in Figure 2.
Qnet = α Qin − Qrad − Qconv
Pcsp = Qnet (hi − ho/hi − hos) ηG
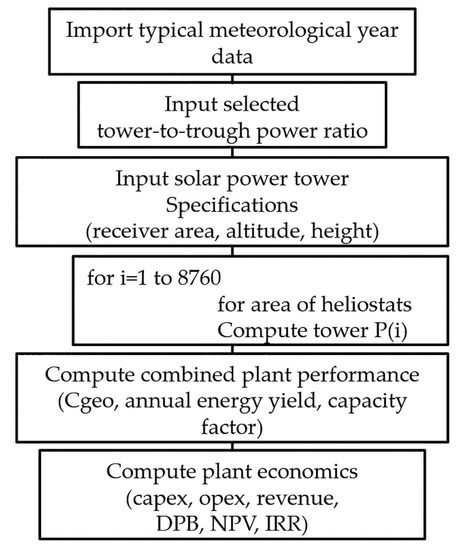
Figure 2.
Flow chart of the algorithm for combined concentrating solar power plant.
The followed approach may be sub-optimal compared to advanced algorithms. Nevertheless, a heuristic algorithm achieved very good agreement in revenue predictions [50] compared to perfect knowledge models at medium power plant capacities and approximately 50% agreement at low and high capacities. Analytical optimization often requires well defined data that are not available a priori, considering stochastic meteorological data. In the interest of speed and wider implementation, the heuristic approach was thus followed compared to alternative optimization tools. The above presented algorithm was executed for a new power demand time series developed to include both the current power demand and the anticipated additional demand due to the transition to e-mobility. It is analyzed in the following section.
3. Case Study
3.1. The Insular System of Rhodes
Rhodes is the fourth island in Greece, regarding its size (1401 km2), after Crete, Evia and Lesvos, and the third regarding its population (129,151 according to the 2021 national census), after Crete and Evia [58]. Rhodes, together with the nearby small island of Chalki, constitutes a non-interconnected insular grid, currently the largest in Greece, after the recent (June 2021) interconnection of Crete with the mainland grid. According to the official annual statistics report of the insular electrical system’s operation of Rhodes for the year 2021, delivered to the authors by the Hellenic Electricity Distribution Network Operator SA (HEDNO), following a relevant official authors’ request, the annual power demand time series is depicted in Figure 3, together with the annual power production from wind parks and photovoltaics.
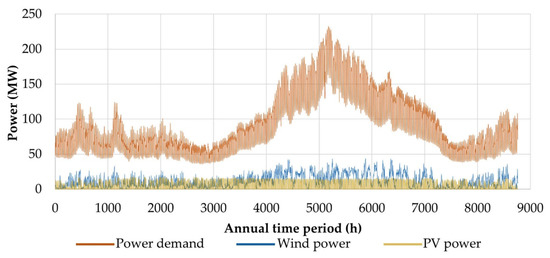
Figure 3.
Annual power demand fluctuation of the insular grid of Rhodes for the year 2021. The annual power production by wind and photovoltaic plants is also shown.
In Table 1, some essential power demand and production statistics are presented of the insular grid in Rhodes for the year 2021.

Table 1.
Essential power demand features of the insular grid in Rhodes for the year 2021.
The intensive seasonal power demand fluctuation between winter and summer is clearly revealed by both Figure 3 and Table 1. The average daily electricity consumption is more than twice higher during July and August than in the period from November to May. This is a direct consequence of the almost exclusive dependence of the insular economy on summer tourism. Finally, it is seen that the total annual production of the wind parks and photovoltaics corresponds to the 16.9% of the annual electricity demand.
Electricity production in the electrical system of Rhodes is fulfilled by the following plants:
- Two thermal power plants, with the installed thermal generators and the technical features presented in Table 2.
Table 2. Thermal power plants synthesis in Rhodes.
- Five wind parks with 49.15 MW total nominal power.
- A total of 216 photovoltaic plants, with 18.2 MW total nominal power.
The power production from photovoltaics is completely absorbed by the local grid, without any curtailments. On the contrary, the wind power instant penetration percentage is restricted at maximum 30% versus the current power demand.
The electricity production levelized cost is calculated at 218.48 EUR/MWh, configured by:
- The variable production cost (fuel and gas emission cost and unscheduled maintenance cost), equal to 130.51 EUR/MWh.
- The fixed production cost (scheduled maintenance, amortizations and other fixed costs), equal to 89.97 EUR/MWh.
3.2. The Wind Parks’ Installation Site and the Available Wind Potential
Rhodes, in general, is characterized with rather medium wind potential, unlike most Aegean Sea islands [59,60,61]. In the most favorable onshore sites, the executed wind potential measurements have annual average wind velocities of around 6 m/s, while in the Cyclades islands (central Aegean Sea), the same feature is in the range of above 8.5 m/s in almost all mountainous ridges [3,62,63]. Additionally, Rhodes, being one of the most popular tourism destinations in Greece and a major pylon of the Greek tourist industry, exhibits considerable peculiarities and sensitivities regarding the installation of onshore large scale RES projects, as far as the impacts on the natural landscape aesthetics are concerned [64].
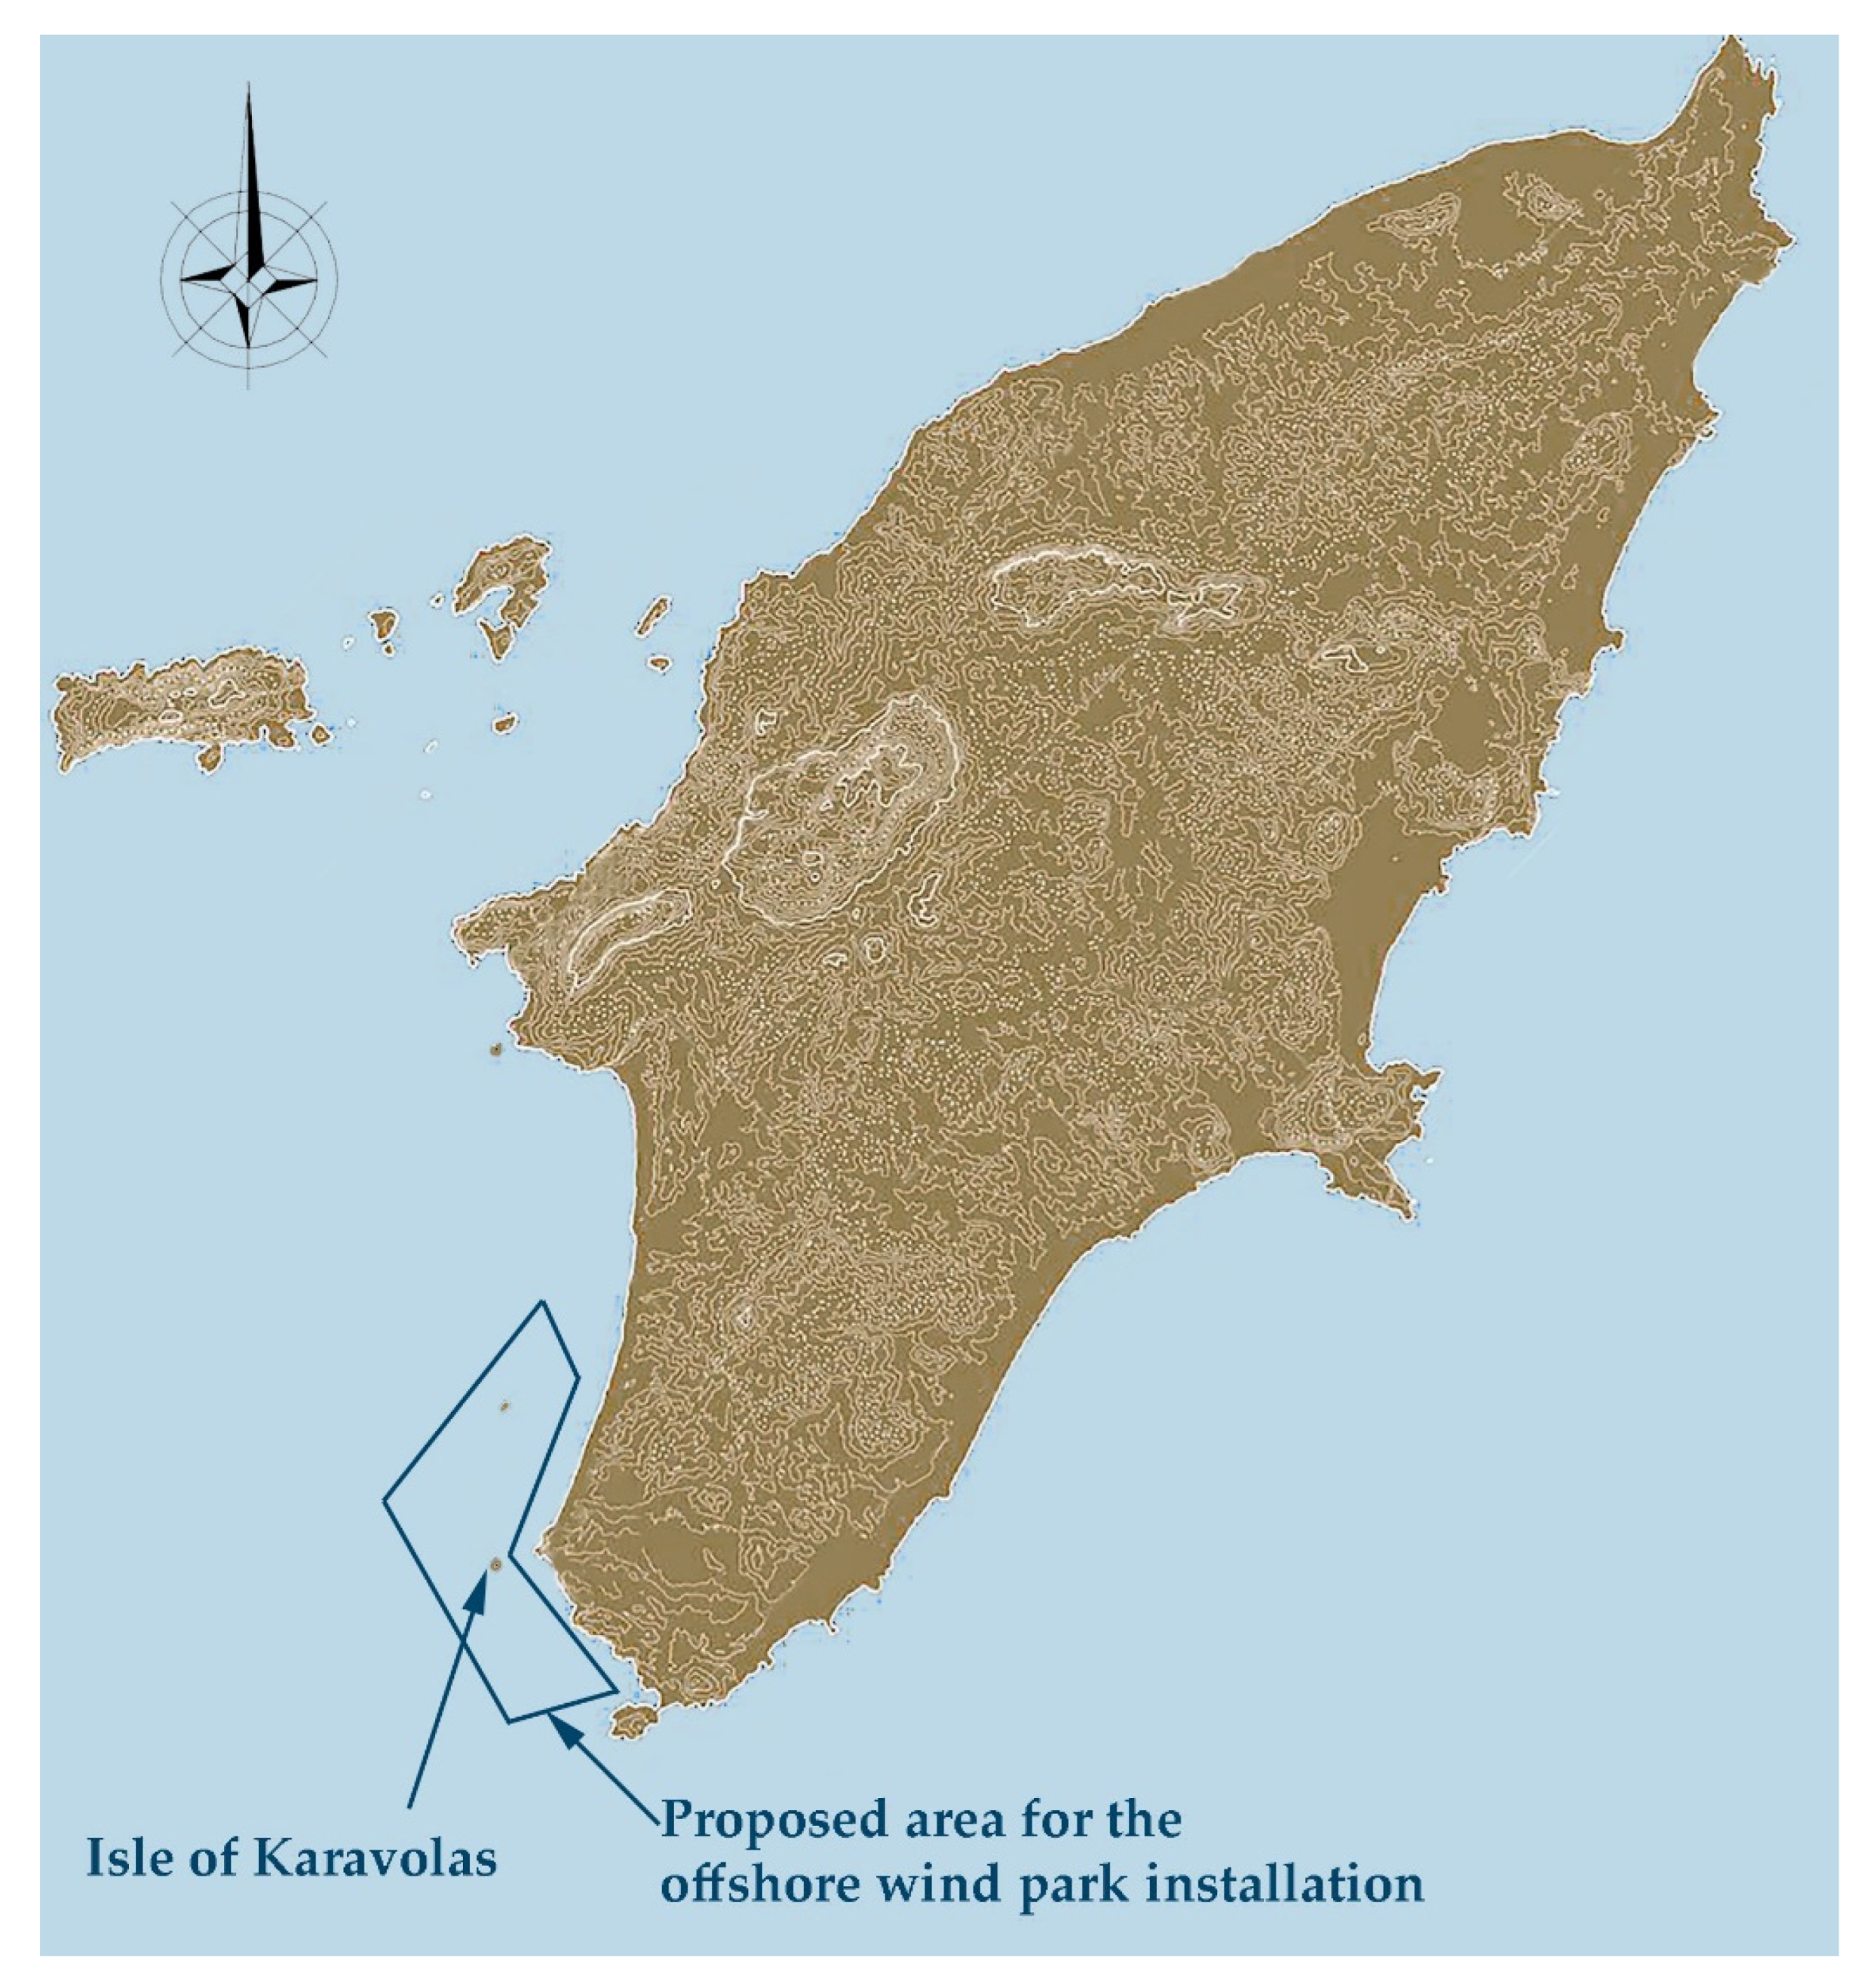
For the above two essential reasons, in the current case study, an offshore wind park is proposed, sited at the southwest coastline of Rhodes, which may be a unique area on and around the island with remarkable wind potential according to certified measurements and in a place with rather indifferent significance for tourism. The proposed area is depicted in Figure 4. In the same figure, the small isle of “Karavolas” is shown, where the available annual certified wind potential measurements were captured, with the installation of a 10 m height wind mast.

Figure 4.
Proposed area for the offshore wind park installation.
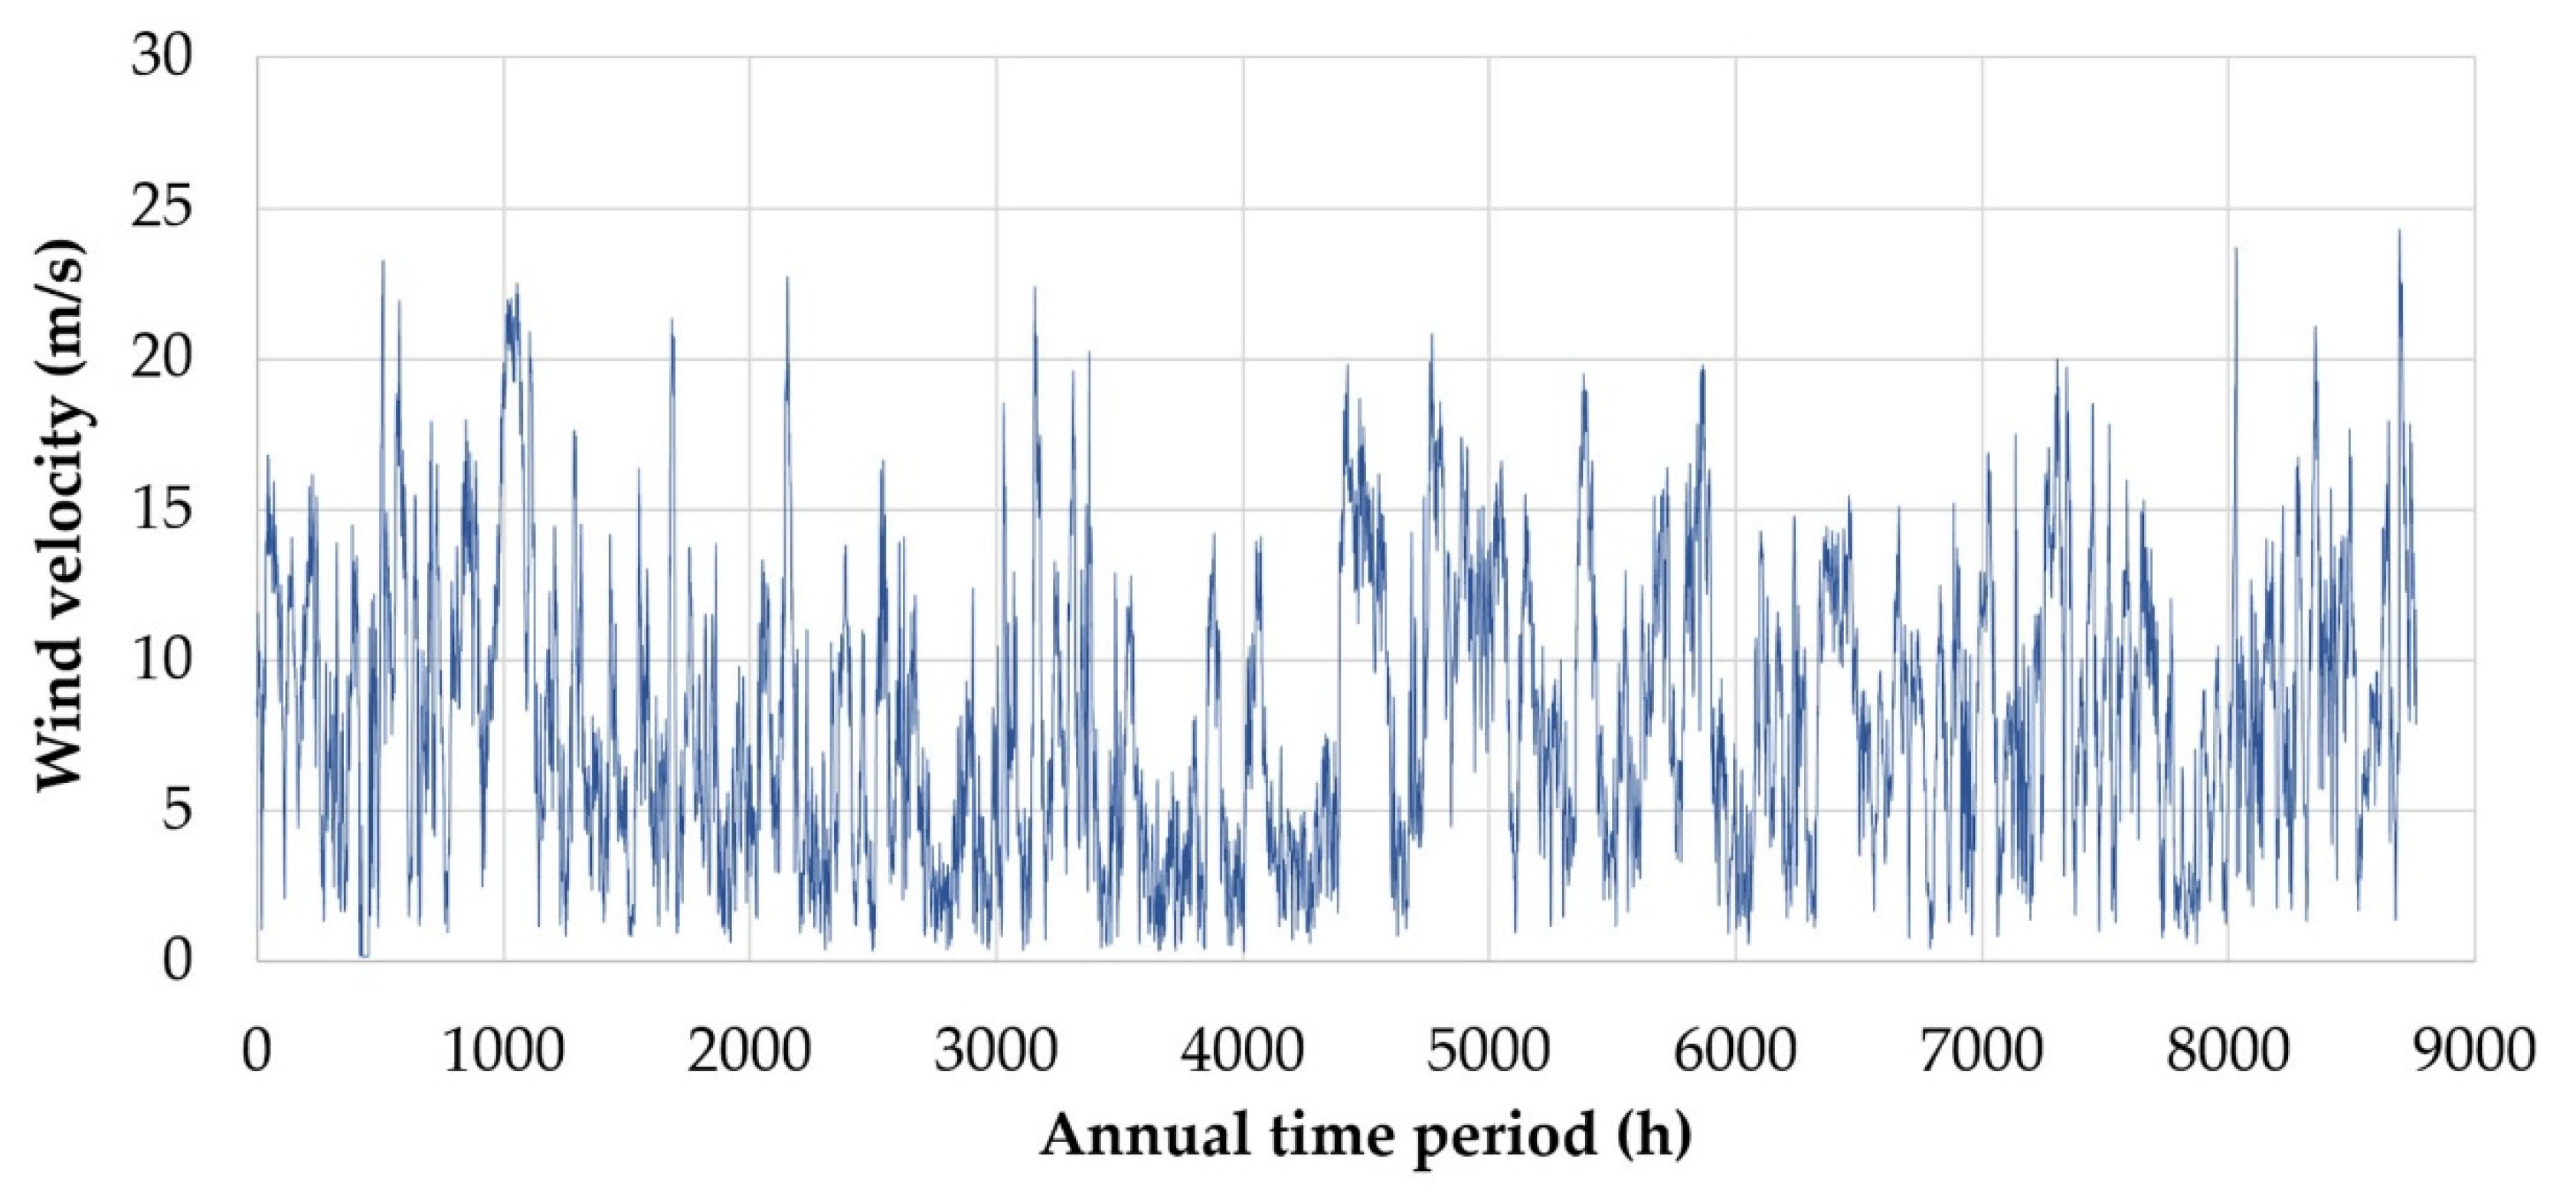
The annual fluctuation of the captured wind velocity time series is shown in Figure 5. The annual average wind velocity is calculated at 8.1 m/s, while the Weibull parameters are calculated at C = 8.8 m/s and k = 1.8. The above features reveal the availability of remarkable wind potential in the area under consideration.
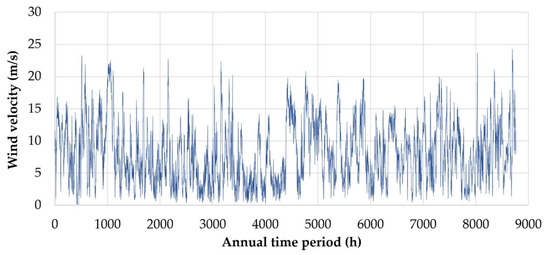
Figure 5.
Annual wind velocity time series.
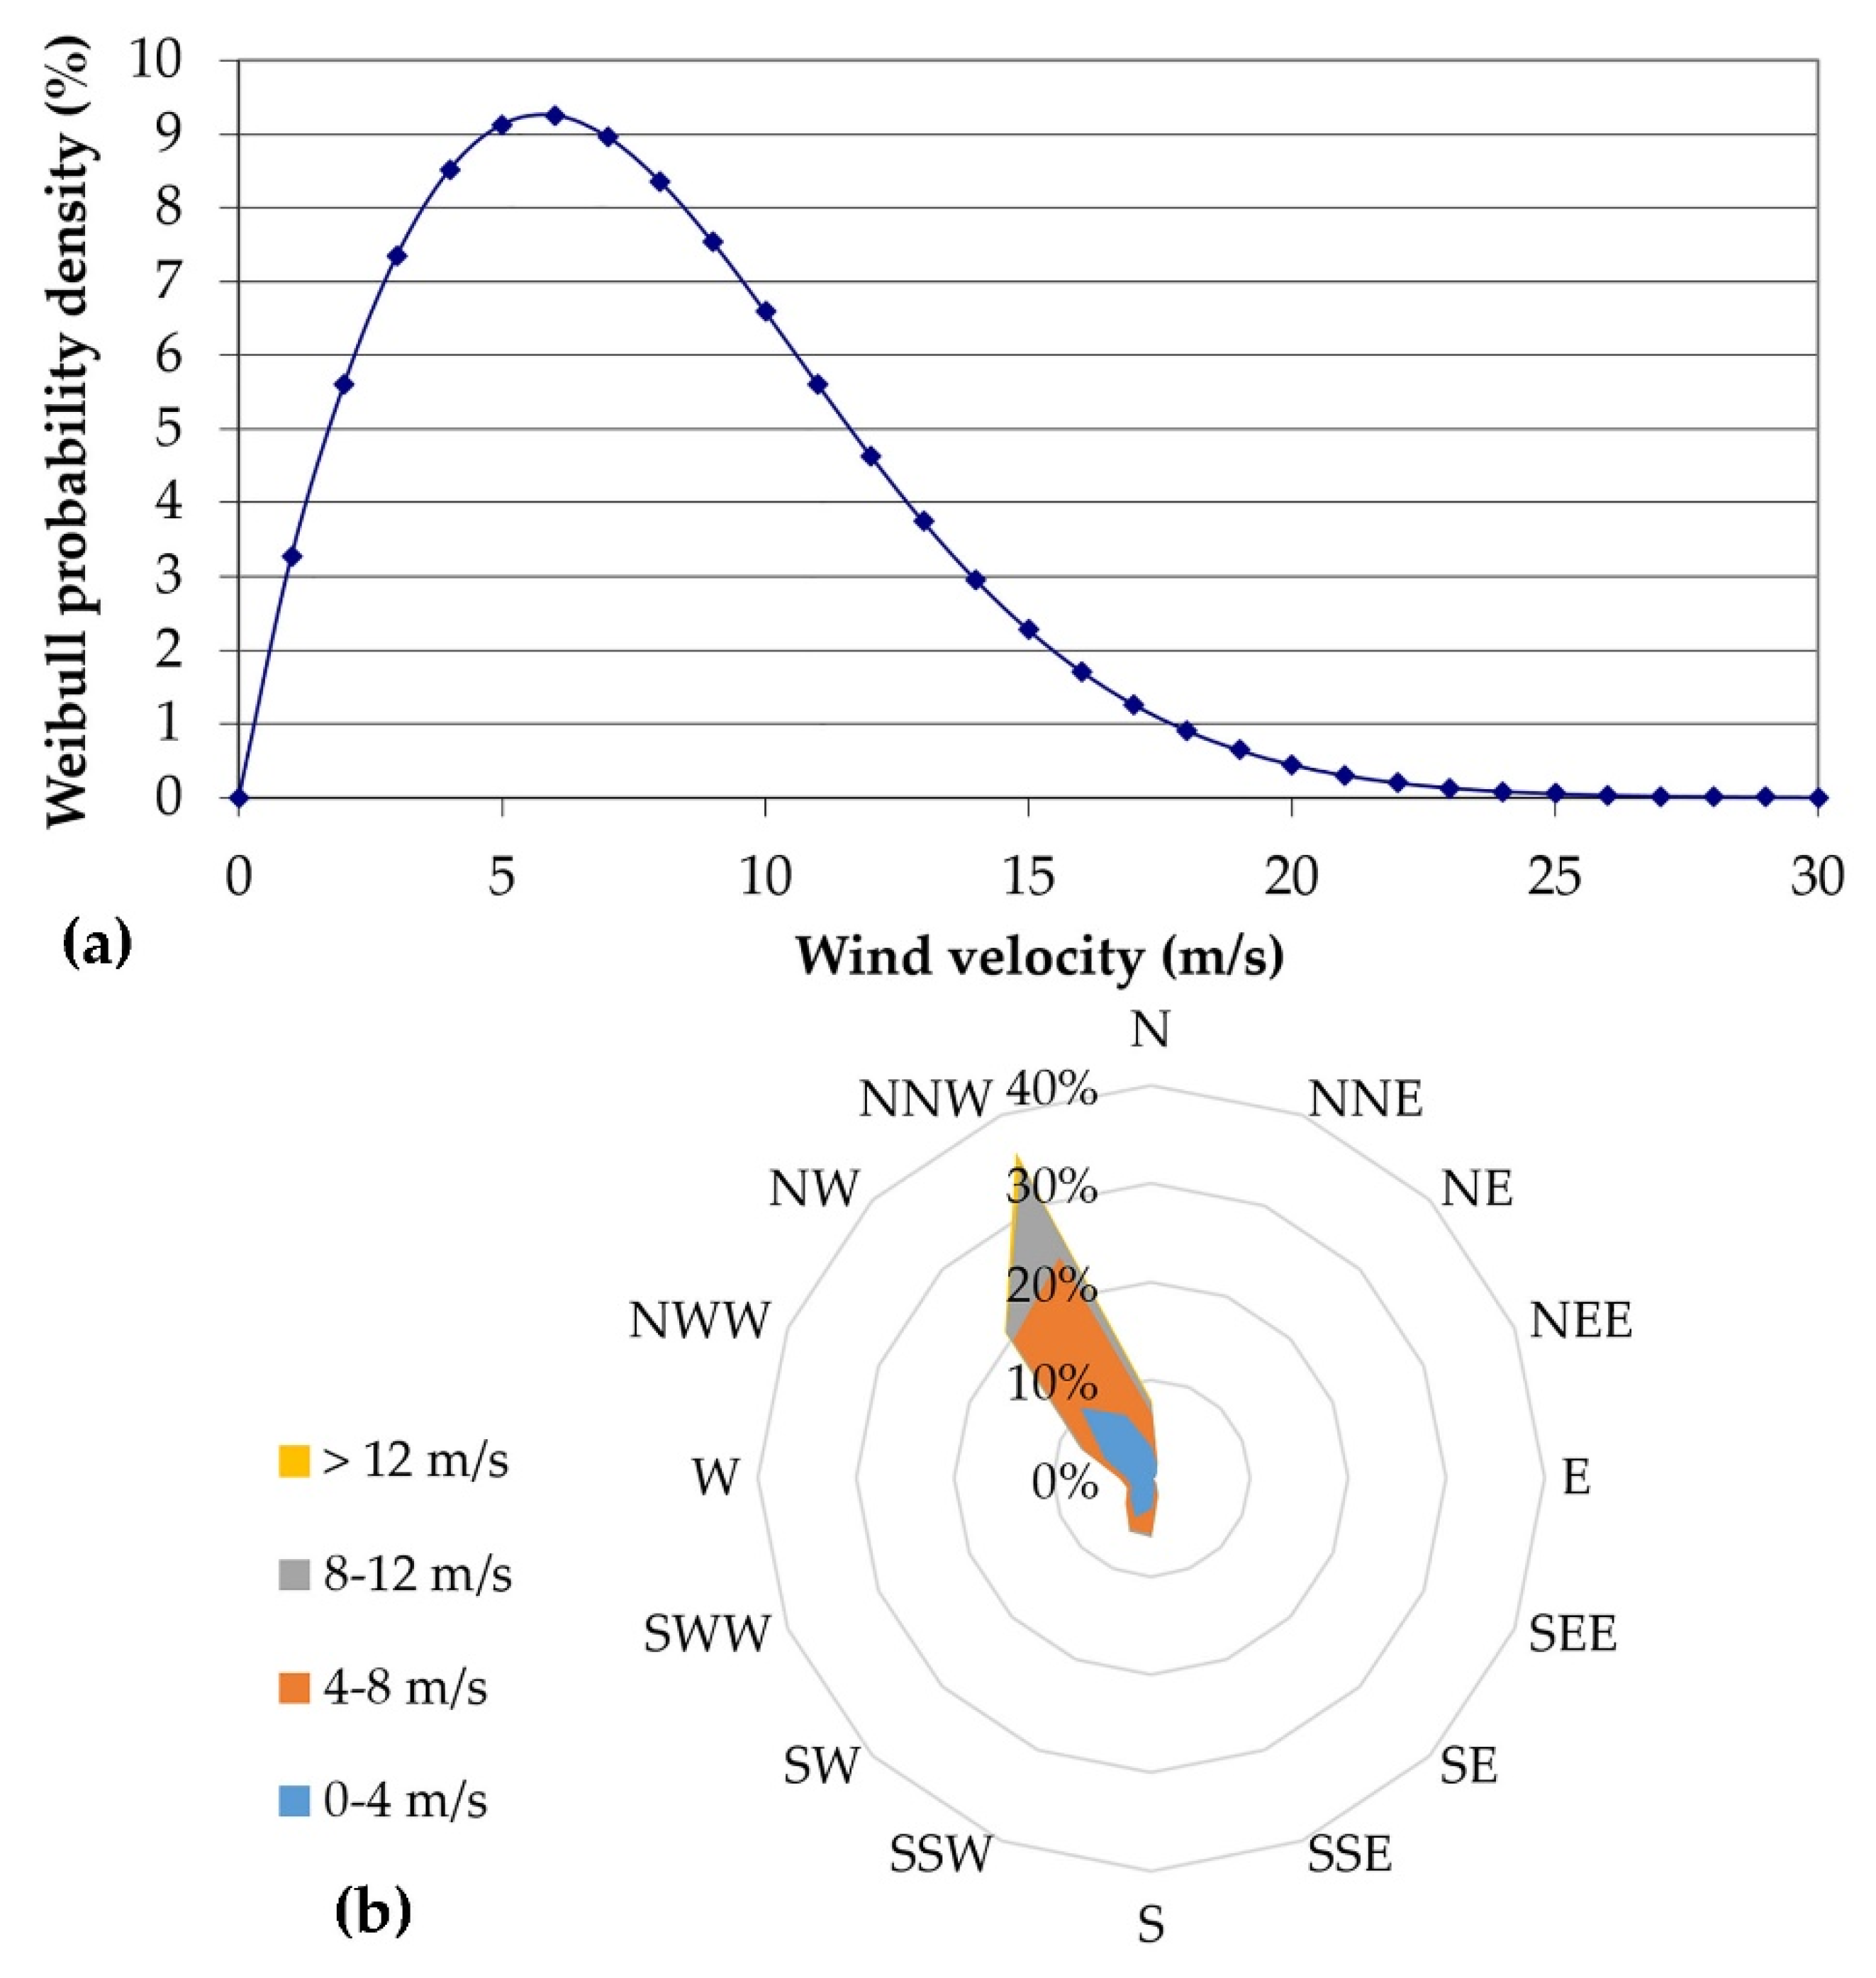
In Figure 6, the Weibull probability density distribution of the wind velocity and the wind rose graph are also presented. As shown in the wind rose graph, the prevailing wind blowing direction is north–northwest, maintained constant for almost the whole annual period, providing a highly qualitative feature to the available wind potential, crucial for the secure wind power penetration in the autonomous insular grid.
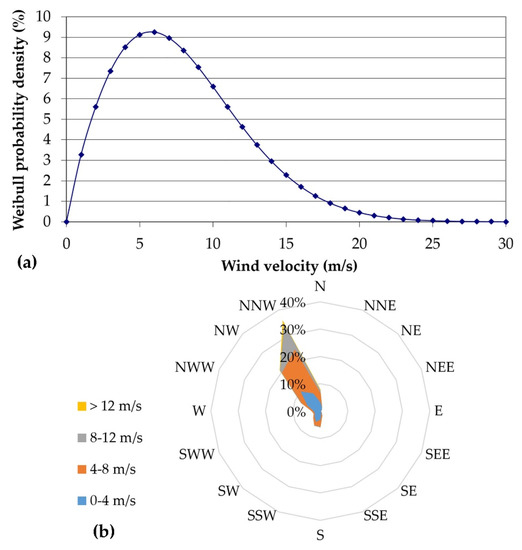
Figure 6.
(a) Weibull probability density distribution and (b) wind rose graph of the captured wind potential measurements.
3.3. The PHS Installation Site
The PHS is going to operate with seawater, due to the inadequate availability of potable water with regard to the needs of the storage plant. For this reason, the installation site should be next to the coastline. The selection of an appropriate site for the installation of the PHS system in Rhodes was not an easy task.
This was due to several parameters that considerably limited the available potential locations, such as:
- The extensive touristic activities spread along almost the total insular coastline.
- The coverage of considerable part of the mountainous terrain with forests.
- The relatively mild land morphology found in the western coastline, unsuitable for PHS installations.
- Several other restrictions and limitations relevant to cultural monuments, antiquities, traditional settlements and existing land uses.
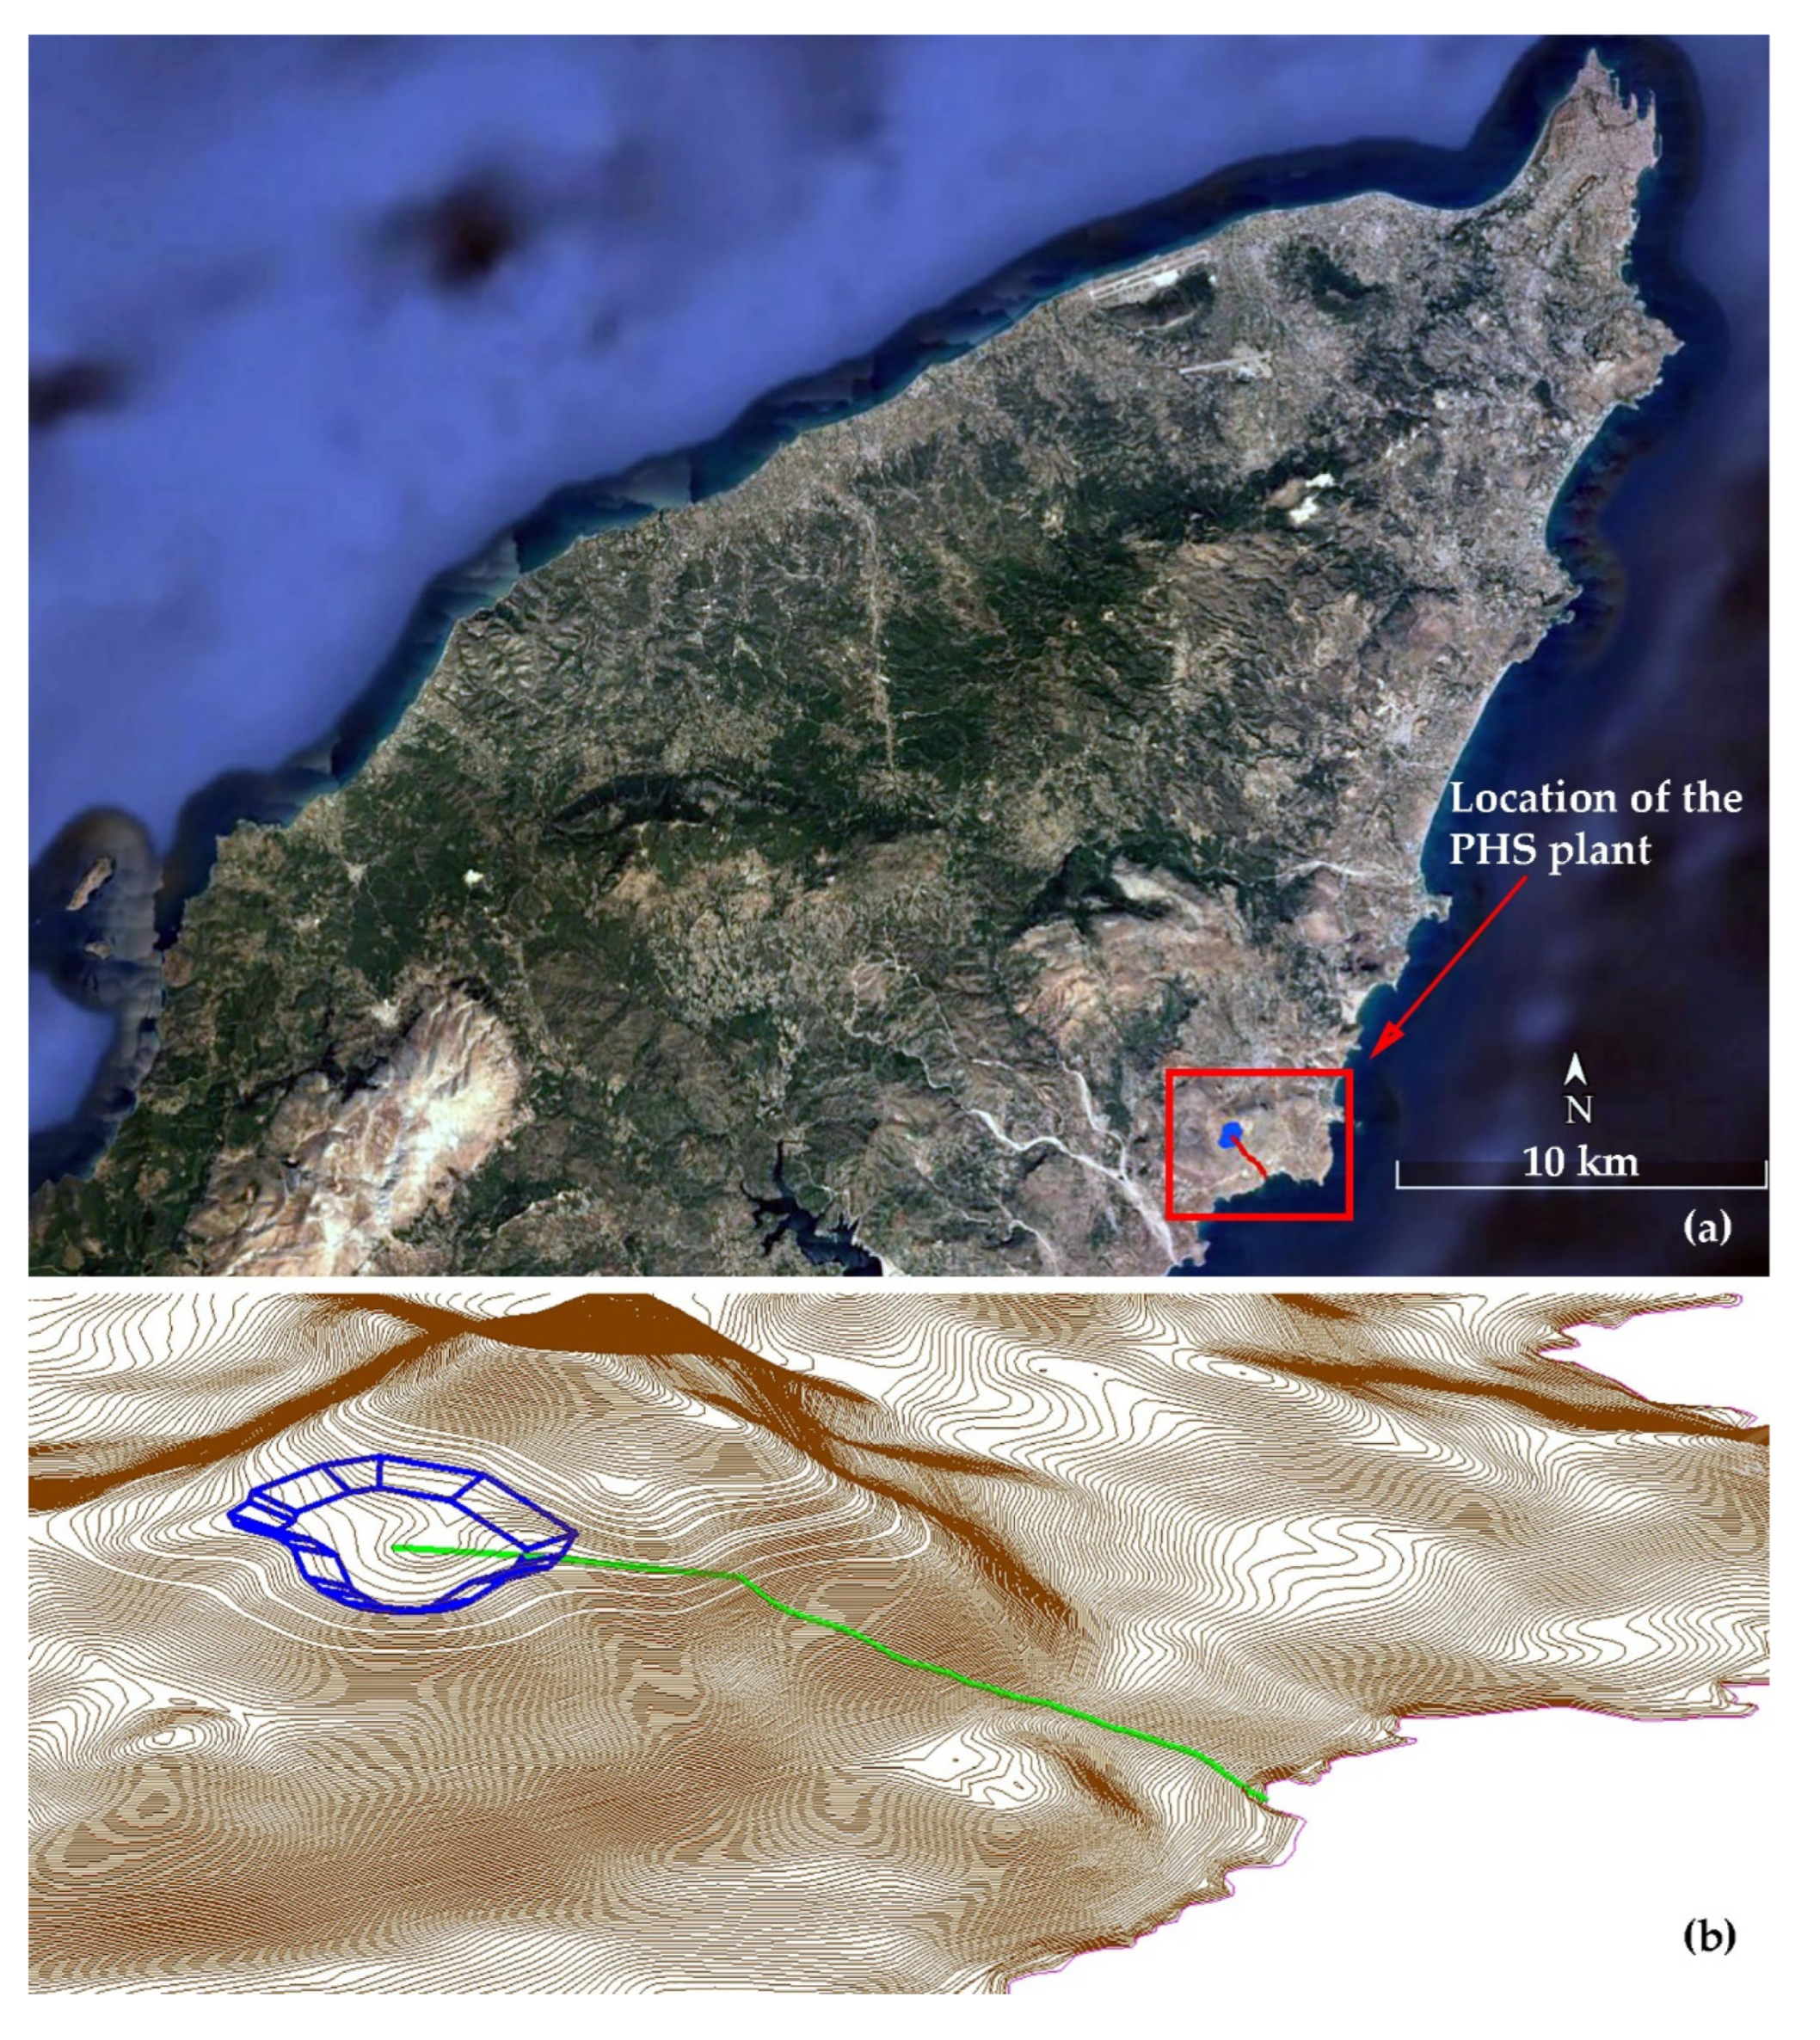
Eventually, after thorough searching, an appropriate site, most probably the only one, free of any restriction and limitations, was found at the north-western coastline of the island, as shown in Figure 7. The site combines all the essential features required for the installation of seawater PHS plants [65], i.e.,:
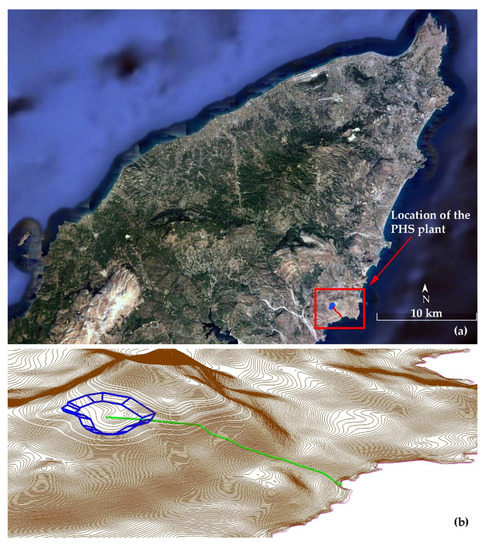
Figure 7.
(a) Installation position and (b) siting of the PHS system on the 3D digitized land terrain.
- A hill next to the coastline with a flat top and adequate area at absolute altitude between 250 m and 400 m for the installation of the upper reservoir with the minimum possible excavation works;
- Mild mountainous slope from the hill towards the coastline, which enable easy access and on-surface installation of the penstock (avoiding expensive underground tunnels);
- A mild coastline land morphology, with adequate area, for the installation of the hydro power plant and the pump station.
As seen in Figure 7, the installation site was digitized and the siting and the sizing of the PHS components (upper reservoir, pipelines) was executed in detail on this digitized terrain.
The results regarding the PHS features defined by the installation site are summarized in Table 3.
Table 3.
PHS features defined by the installation site.
3.4. Solar Energy Potential and Concentrating Solar Power Technology
The annual fluctuation of the direct normal irradiance (DNI) is shown in Figure 8. The annual average DNI is calculated at 248 W/m2, while the maximum at 1010 W/m2 revealing suitable solar potential in the area under consideration. Among CSP technologies, parabolic trough collectors (PTC) and solar power towers (SPT) have to date the highest efficiency and lowest LCoE. More than 90% of a total of 4 GW solar thermal power plants installed globally are based on PTC and SPT with some of them consisting of combined PTC and SPT technologies that exhibit complementary energy generation with higher capacity factors [66]. The major advantage of the SPT is a higher operating temperature, thus a higher heat-to-power conversion. SPT plants can be installed in inclined land surfaces, such as mountain slopes. Heliostats have a lower cost compared to parabolic collectors; however, each heliostat requires dedicated tracking of the sun in both azimuth and elevation.

Figure 8.
Annual direct normal irradiance in the island of Rhodes.
For the CSP plant, the independent parameter is the nominal electrical power defined by the number of heliostats and the surface of each heliostat. Heliostats of dimensions of 12 × 12 m were utilized. Each heliostat tracker requires 25 Wh for startup and has a nominal power of 55 W. For a nominal power of 120 MWe, the CSP plant requires a reflective surface area of 787,000 m2.
The atmospheric attenuation was modeled based on the polynomial [67,68]:
where S is the distance between heliostat and receiver in km and resulting in average attenuation loss of 7.4%.
0.67 + 10.46 S − 1.70 S2 + 0.2845 S3
3.5. Economic Parameters
The sizing of the proposed systems was optimized according to the economic indices of the investment, such as the payback period and the internal rate of return (IRR). The sizing optimization was performed separately for the wind park–PHS plant (the hybrid power plant, HPP) and the CSP plant. To this end, the essential economic features of the proposed systems, such as the set-up and the operation–maintenance cost and the annual revenues, should be approached. For both systems, this was performed based on the experience of the authors of the study and the development of similar systems, either at scientific research or technical consulting levels. In Table 4, the set-up cost parameters for both systems are summarized.
Table 4.
Examined power plants set-up cost approach.
For the needs of this research, the following funding scheme was adopted:
- Equities: 25%;
- Bank loan: 75%.
Regarding the operation and maintenance cost for both systems, the following assumptions were introduced:
- Public rates set by the Greek state: 3% of annual revenue;
- Wind turbine offshore maintenance: 0.020 EUR /kWh;
- PHS maintenance: 200,000 EUR;
- CSP maintenance: 9,000,000 EUR (5% of the capital expenditure);
- Loan payments, with a payback period of 10 years and 5.5% loan rate;
- Labor cost 500,000 EUR;
- Insurance: 0.4% of the project’s total set-up cost;
- Several other costs: 100,000 EUR;
- State taxes: 24% of net annual profits.
Finally, the produced electricity selling price was set equal to 0.25EUR /kWh for both systems.
3.6. Uncertainties of the Modeling
Uncertainties in the results are inherent in the predictability of the wind and solar resource used for the estimation of annual energy yields of the wind and CSP power plants. Spatial and temporal uncertainties are also inherent in the datasets of the weather data. An aspect not applicable in this case study, but affecting PHS plants that rely on rainwater, is the annual precipitation and detailed meteorological data exist to consider such predictions. The variability in the annual generation can be 10% as reported in reference [18], which in the year-to-year generation may drop to 20%. Uncertainties may occur due to variations in the profile of demand, which depends on factors such as economic development. For this kind of predictions, the models should additionally incorporate the relevant factors and scenarios of different demand levels.
4. Results
4.1. Sizing Optimization
The operation algorithm of both systems, presented in Section 3.2, was executed iteratively for both systems. For the HPP, the nominal power of the wind park was the main independent parameter, starting from 100 ΜW, with 20 wind turbines of 5 MW nominal power. The hydro power plant and the pumps station nominal power were calculated accordingly, given the maximum required power production and storage as calculated with the operation algorithm computational simulation. The PHS reservoir size and the penstock length remained constant and common for all iterations, since they depend on the land morphology.
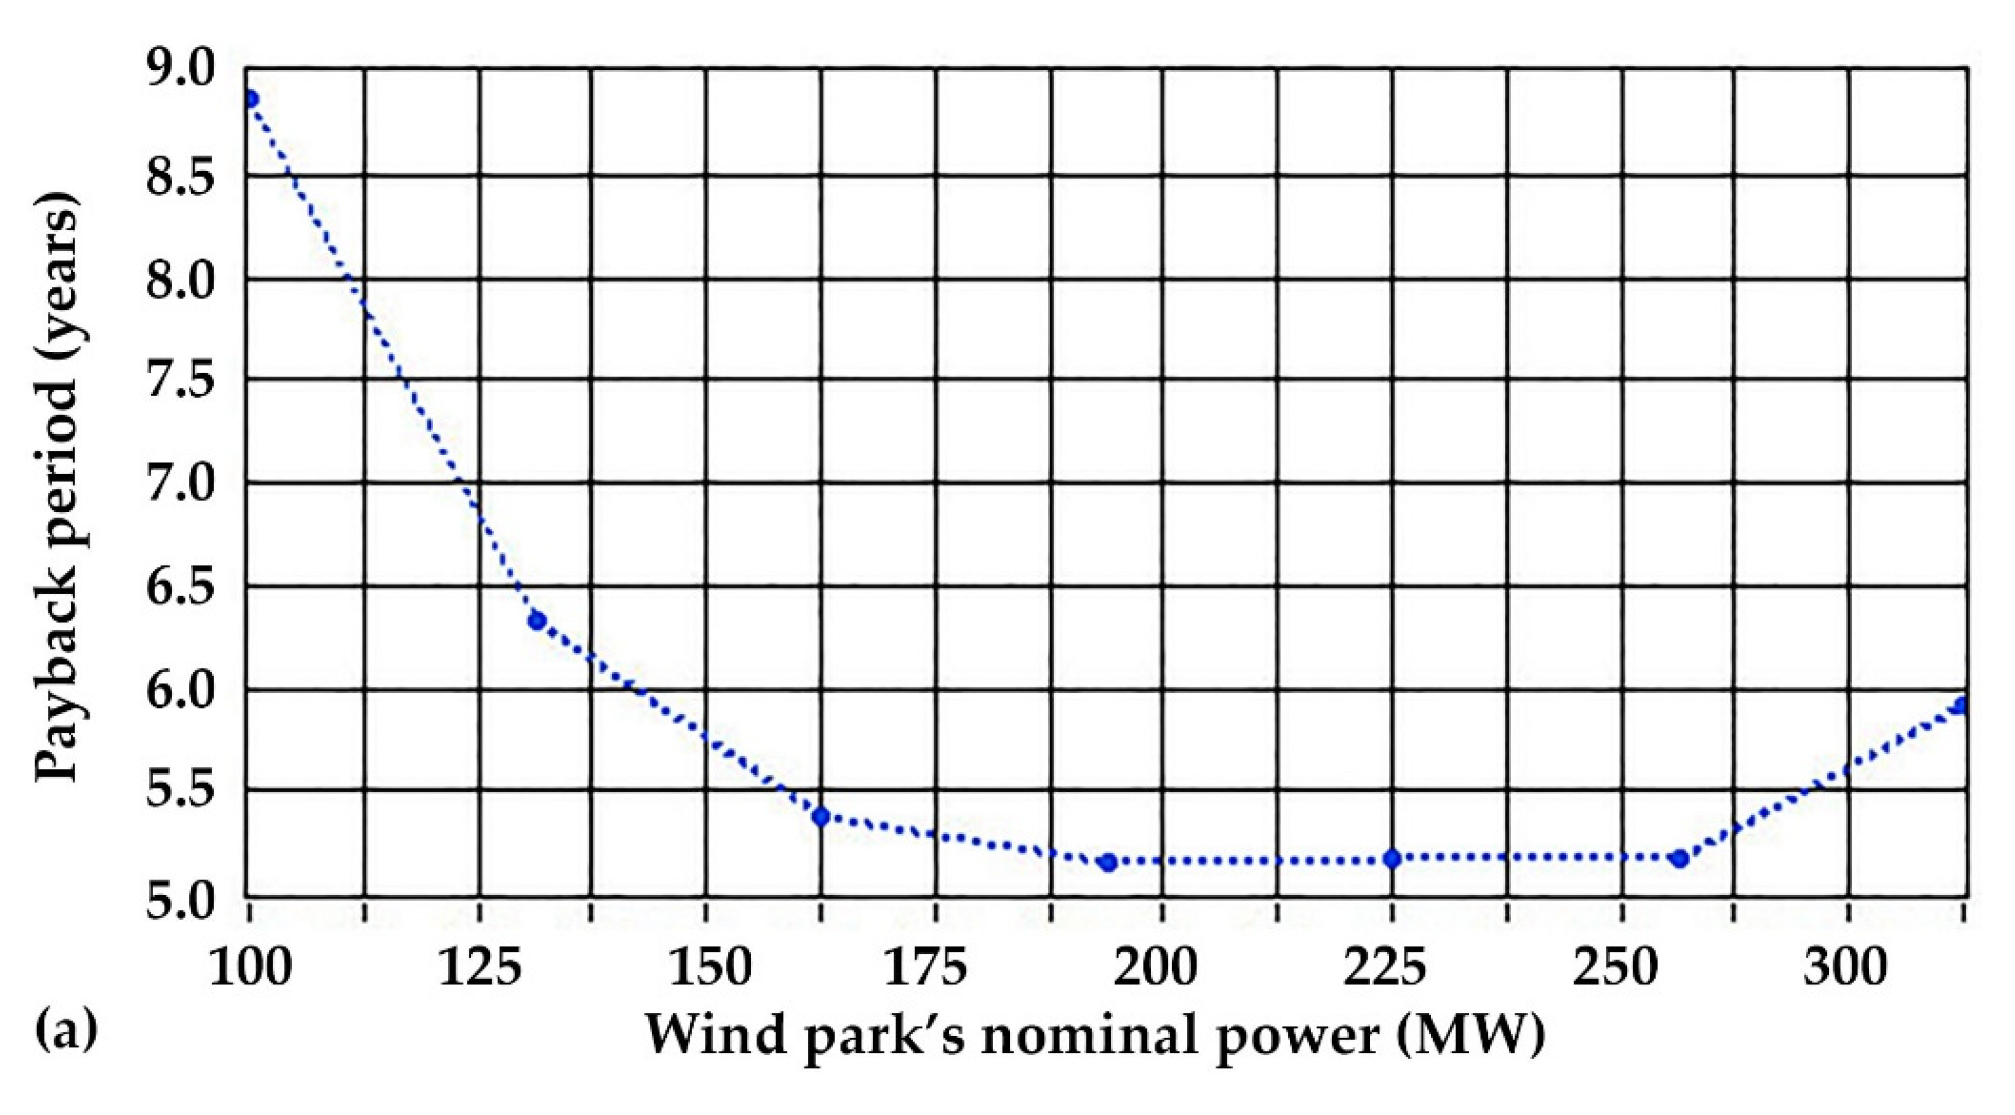
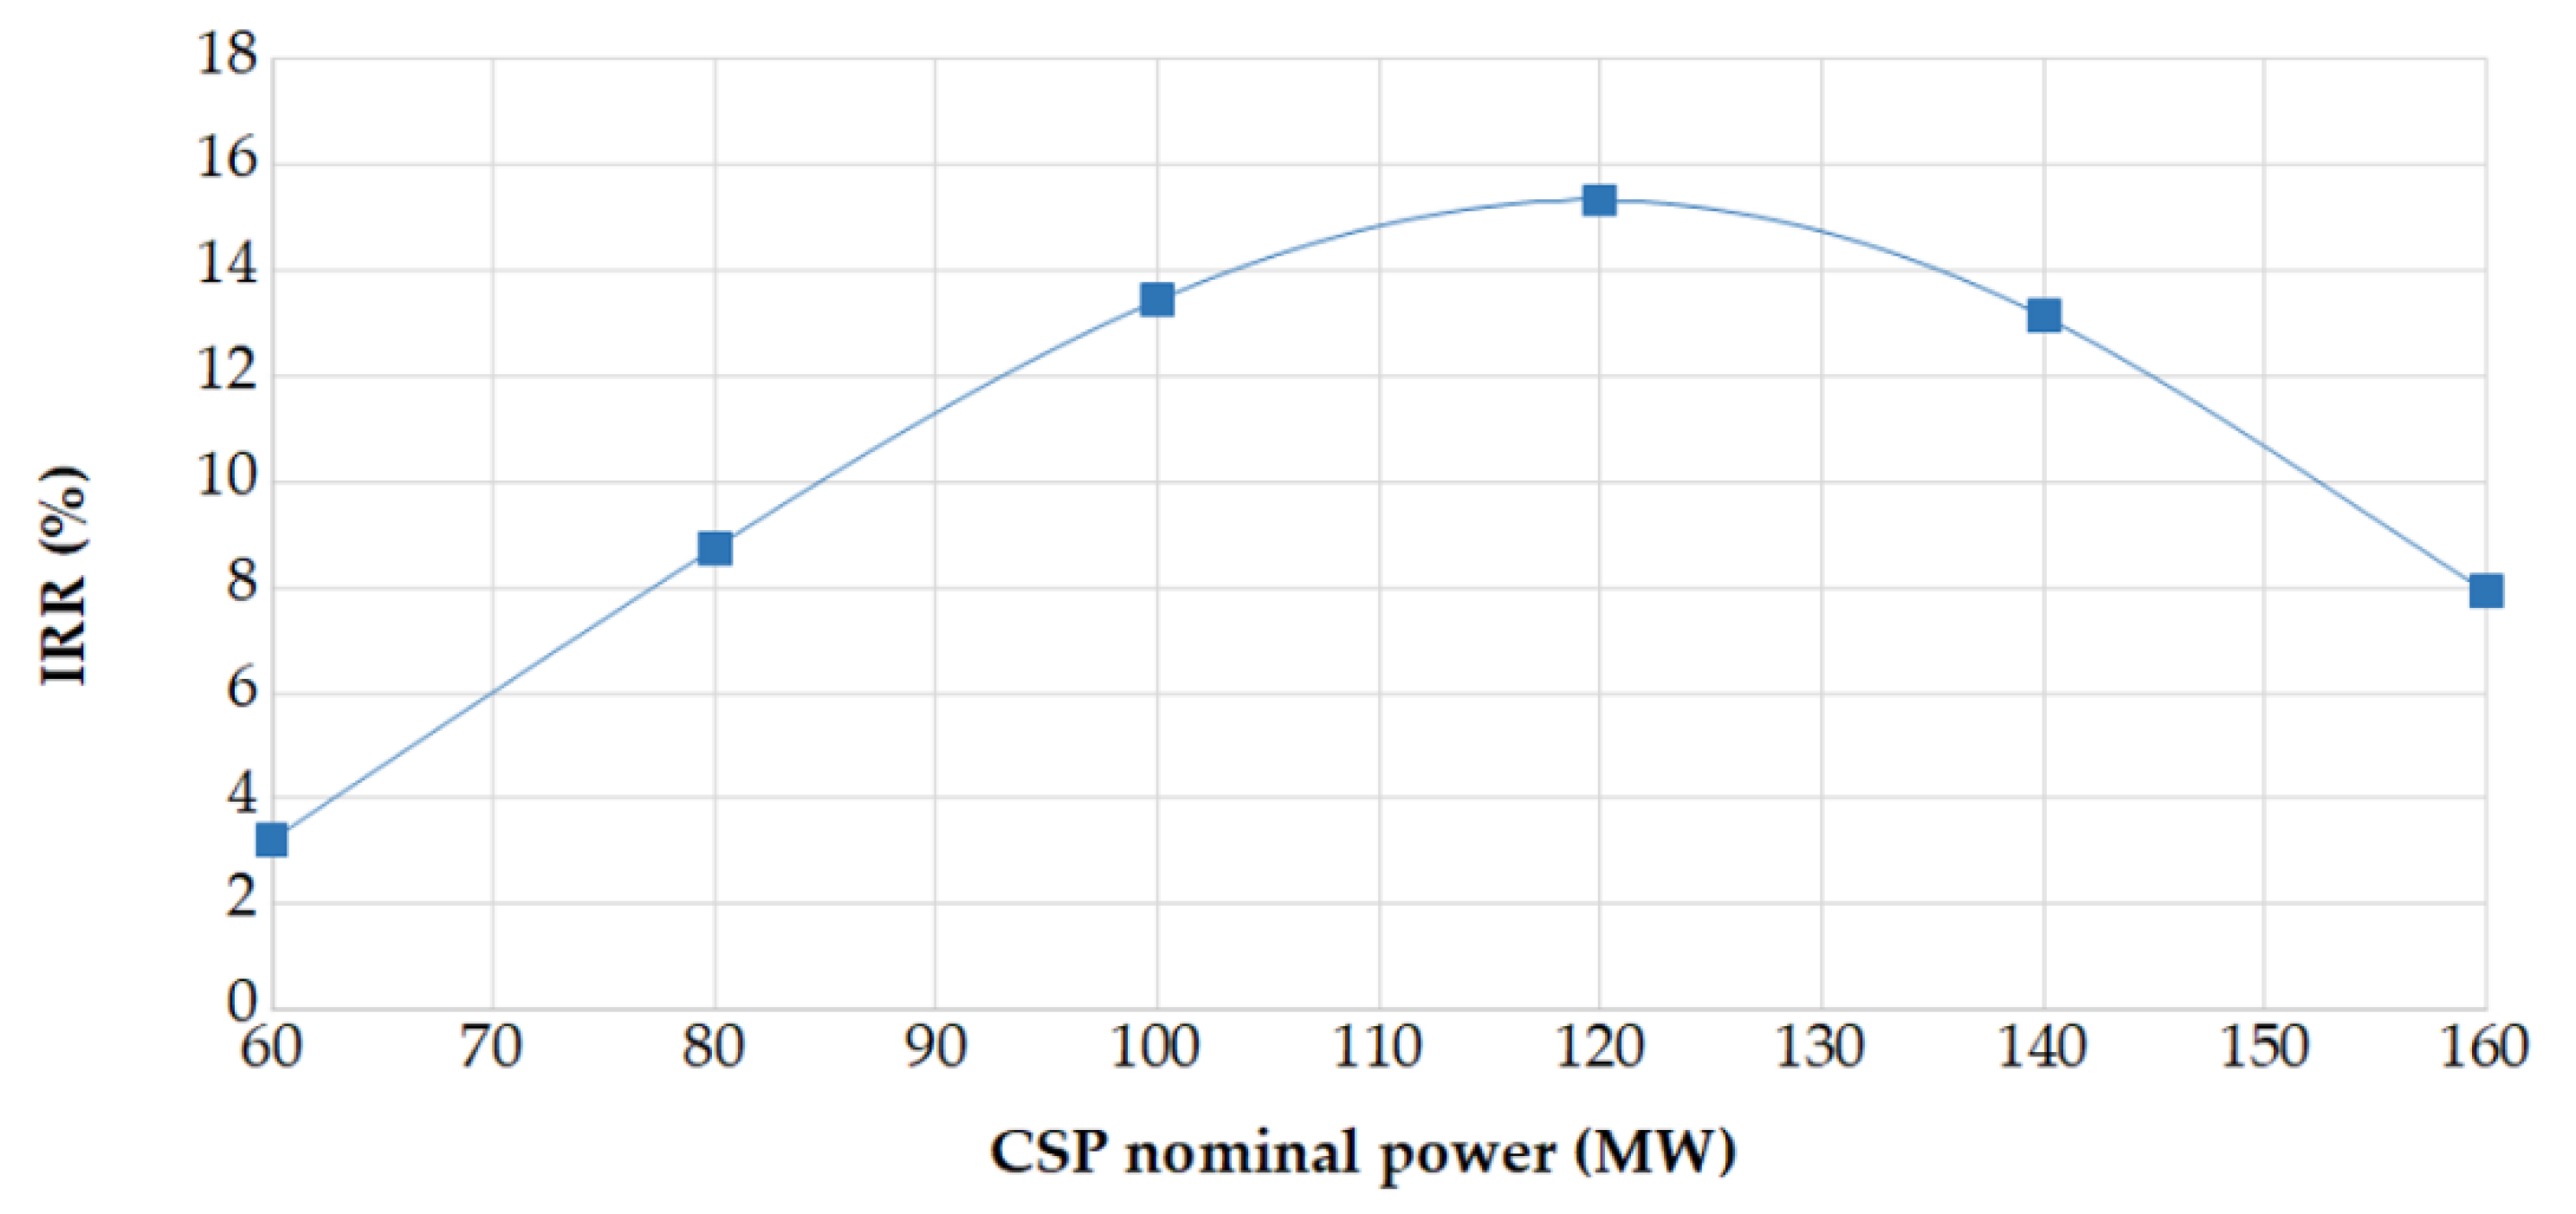
For each executed iteration, the investment’s economic indices were calculated, given the economic parameters and assumptions presented in Section 3.5. The sizing was optimized for the scenarios with the optimum economic indices. The process was performed separately for the HPP and the CSP plant. In Figure 9, the payback period and the IRR fluctuation are presented for the HPP versus the offshore wind park nominal power, while in Figure 10, the IRR of the CSP is presented as a function of its nominal power at a selling price of 0.16 EUR /kWh.
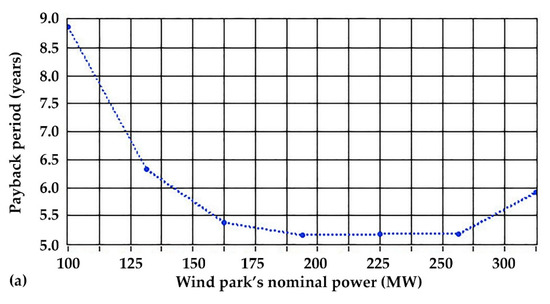
Figure 9.
Fluctuation of (a) the payback period and (b) the IRR, calculated on the investment’s equities, for the HPP.
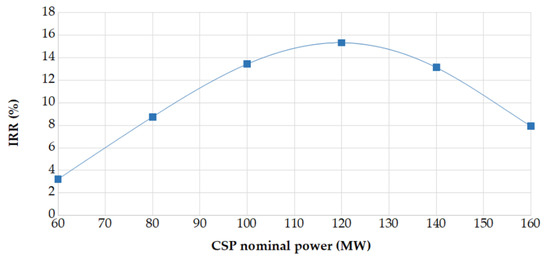
Figure 10.
Fluctuation of the IRR, calculated on the investment’s equities, for the CSP.
All the economic indices were calculated over the investment’s equities.
As seen in Figure 9, the HPP was optimized for a 200 MW offshore wind park nominal power, consisting of 40 wind turbines of 5 MW each. The payback period and the IRR of the CSP plant of nominal power 120 MW were calculated as 16 years and 15.3%, respectively.
In Table 5, the main sizing results of the introduced power production plants are summarized.
Table 5.
Main sizing results.
Corrosion-resistant materials were considered in the pumps, turbines, as well as the penstock and the upper reservoir, thereby limiting possible environmental impacts. The penstock will be made of X80 steel with an inner protective film of mixed phenol and epoxy resin, while the reservoir will be made of glass-reinforced polyester. More details on measures and techniques against the seawater corrosive impact can be found in [65].
In Table 6, the annual electricity production and storage results are presented. The PHS efficiency was calculated as the ratio of the annual hydro turbines’ electricity production over the annual electricity stored in the PHS (electricity absorbed by the pumps).
Table 6.
Annual electricity production and storage.
From the results presented in Table 6, it can be seen that both the annual RES penetration achieved with both the investigated systems is 79.1%
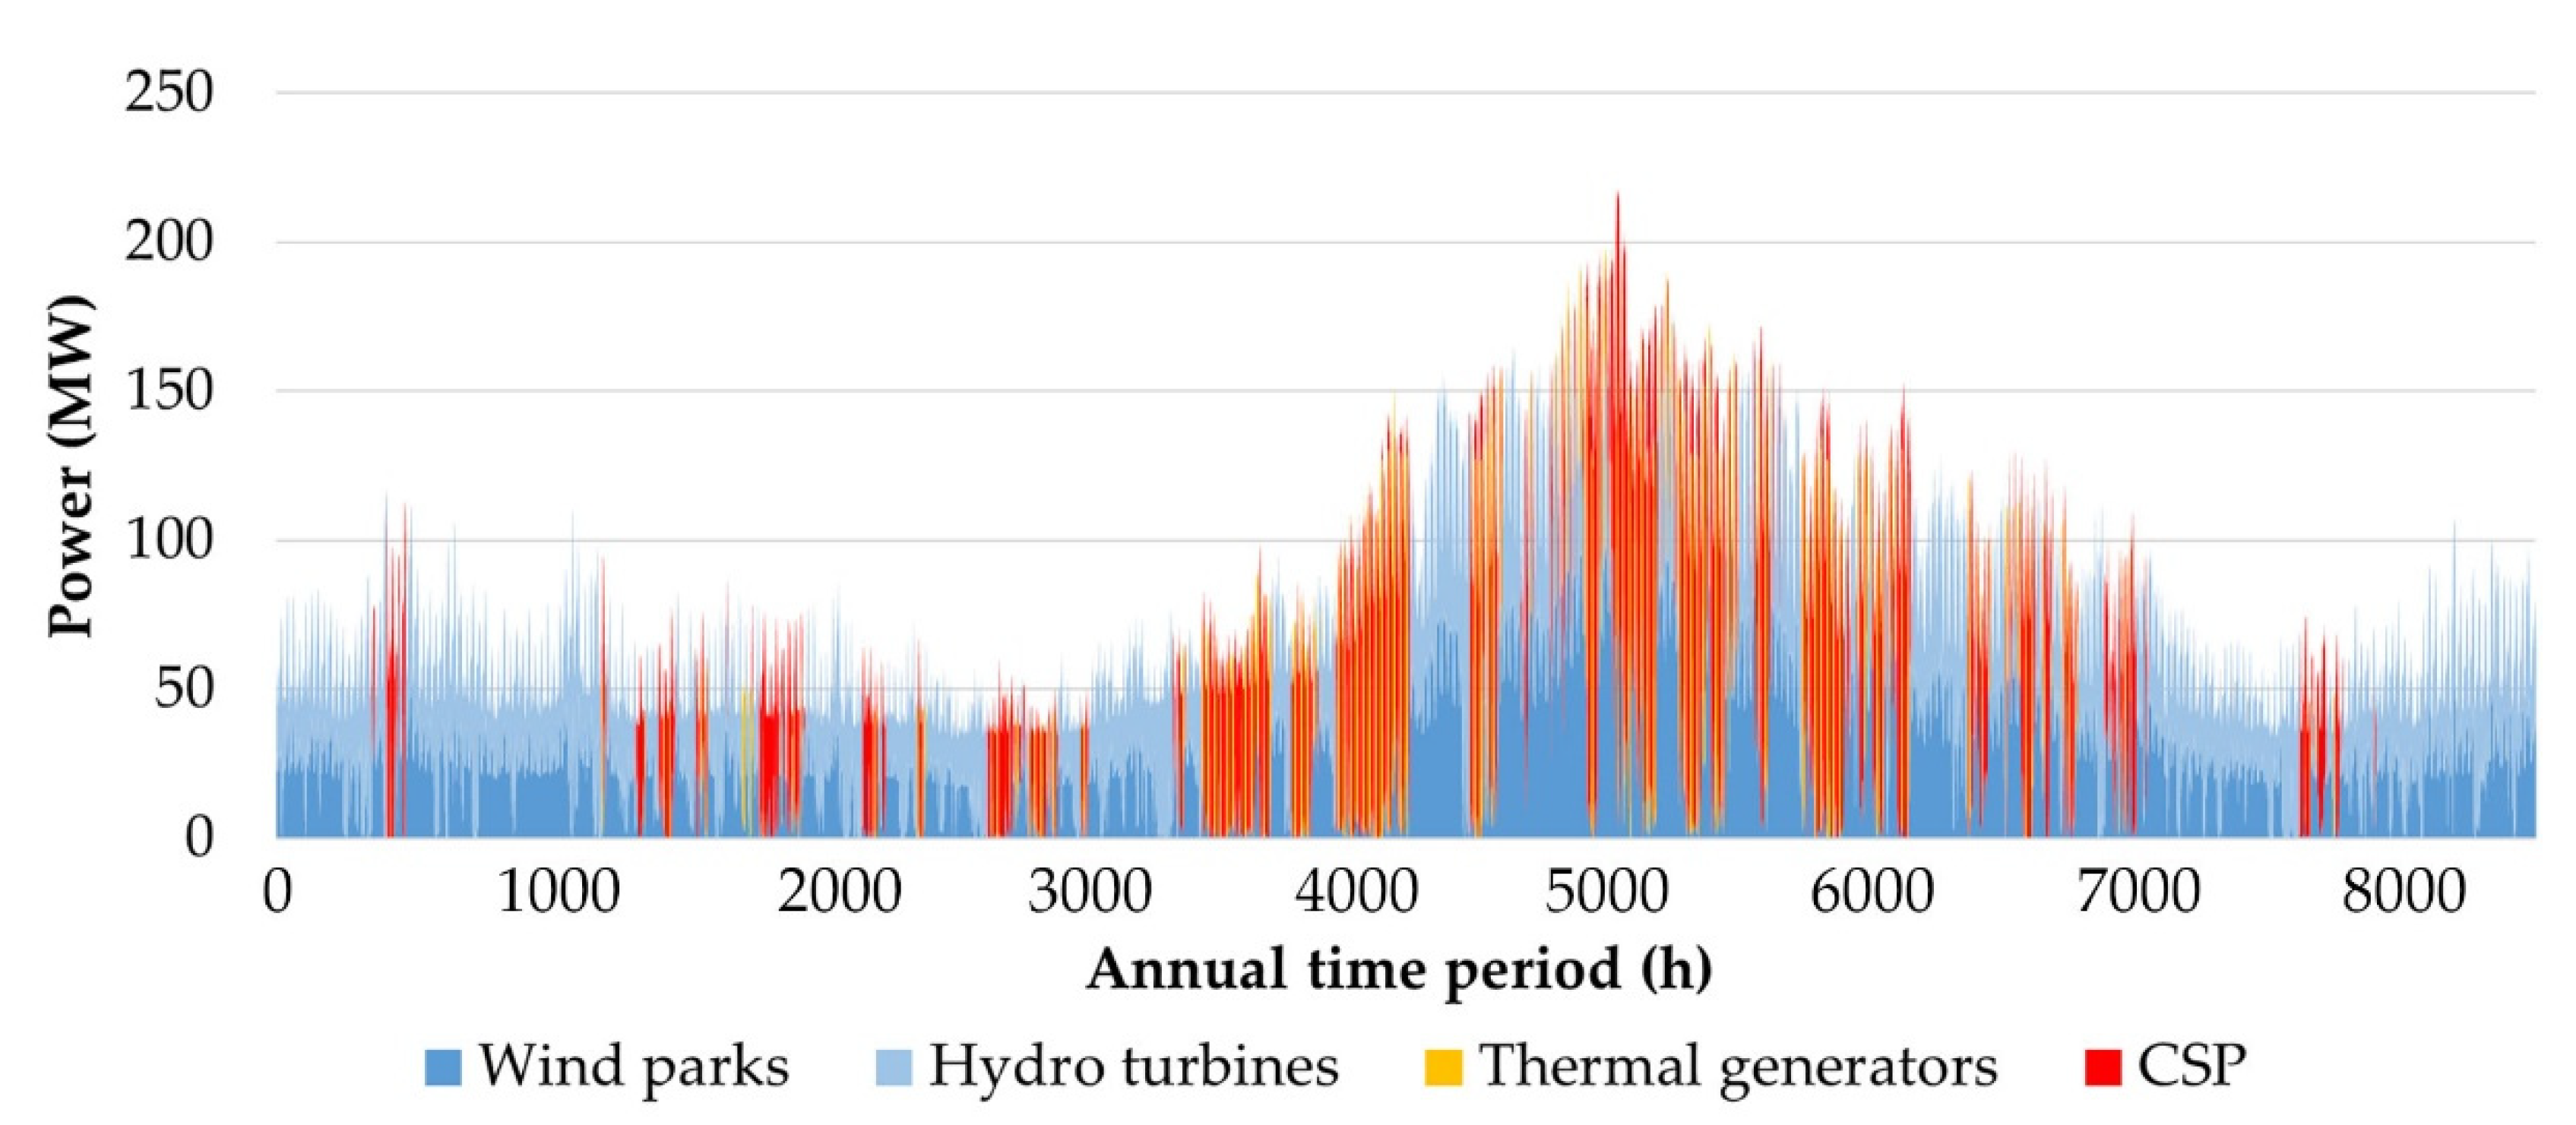
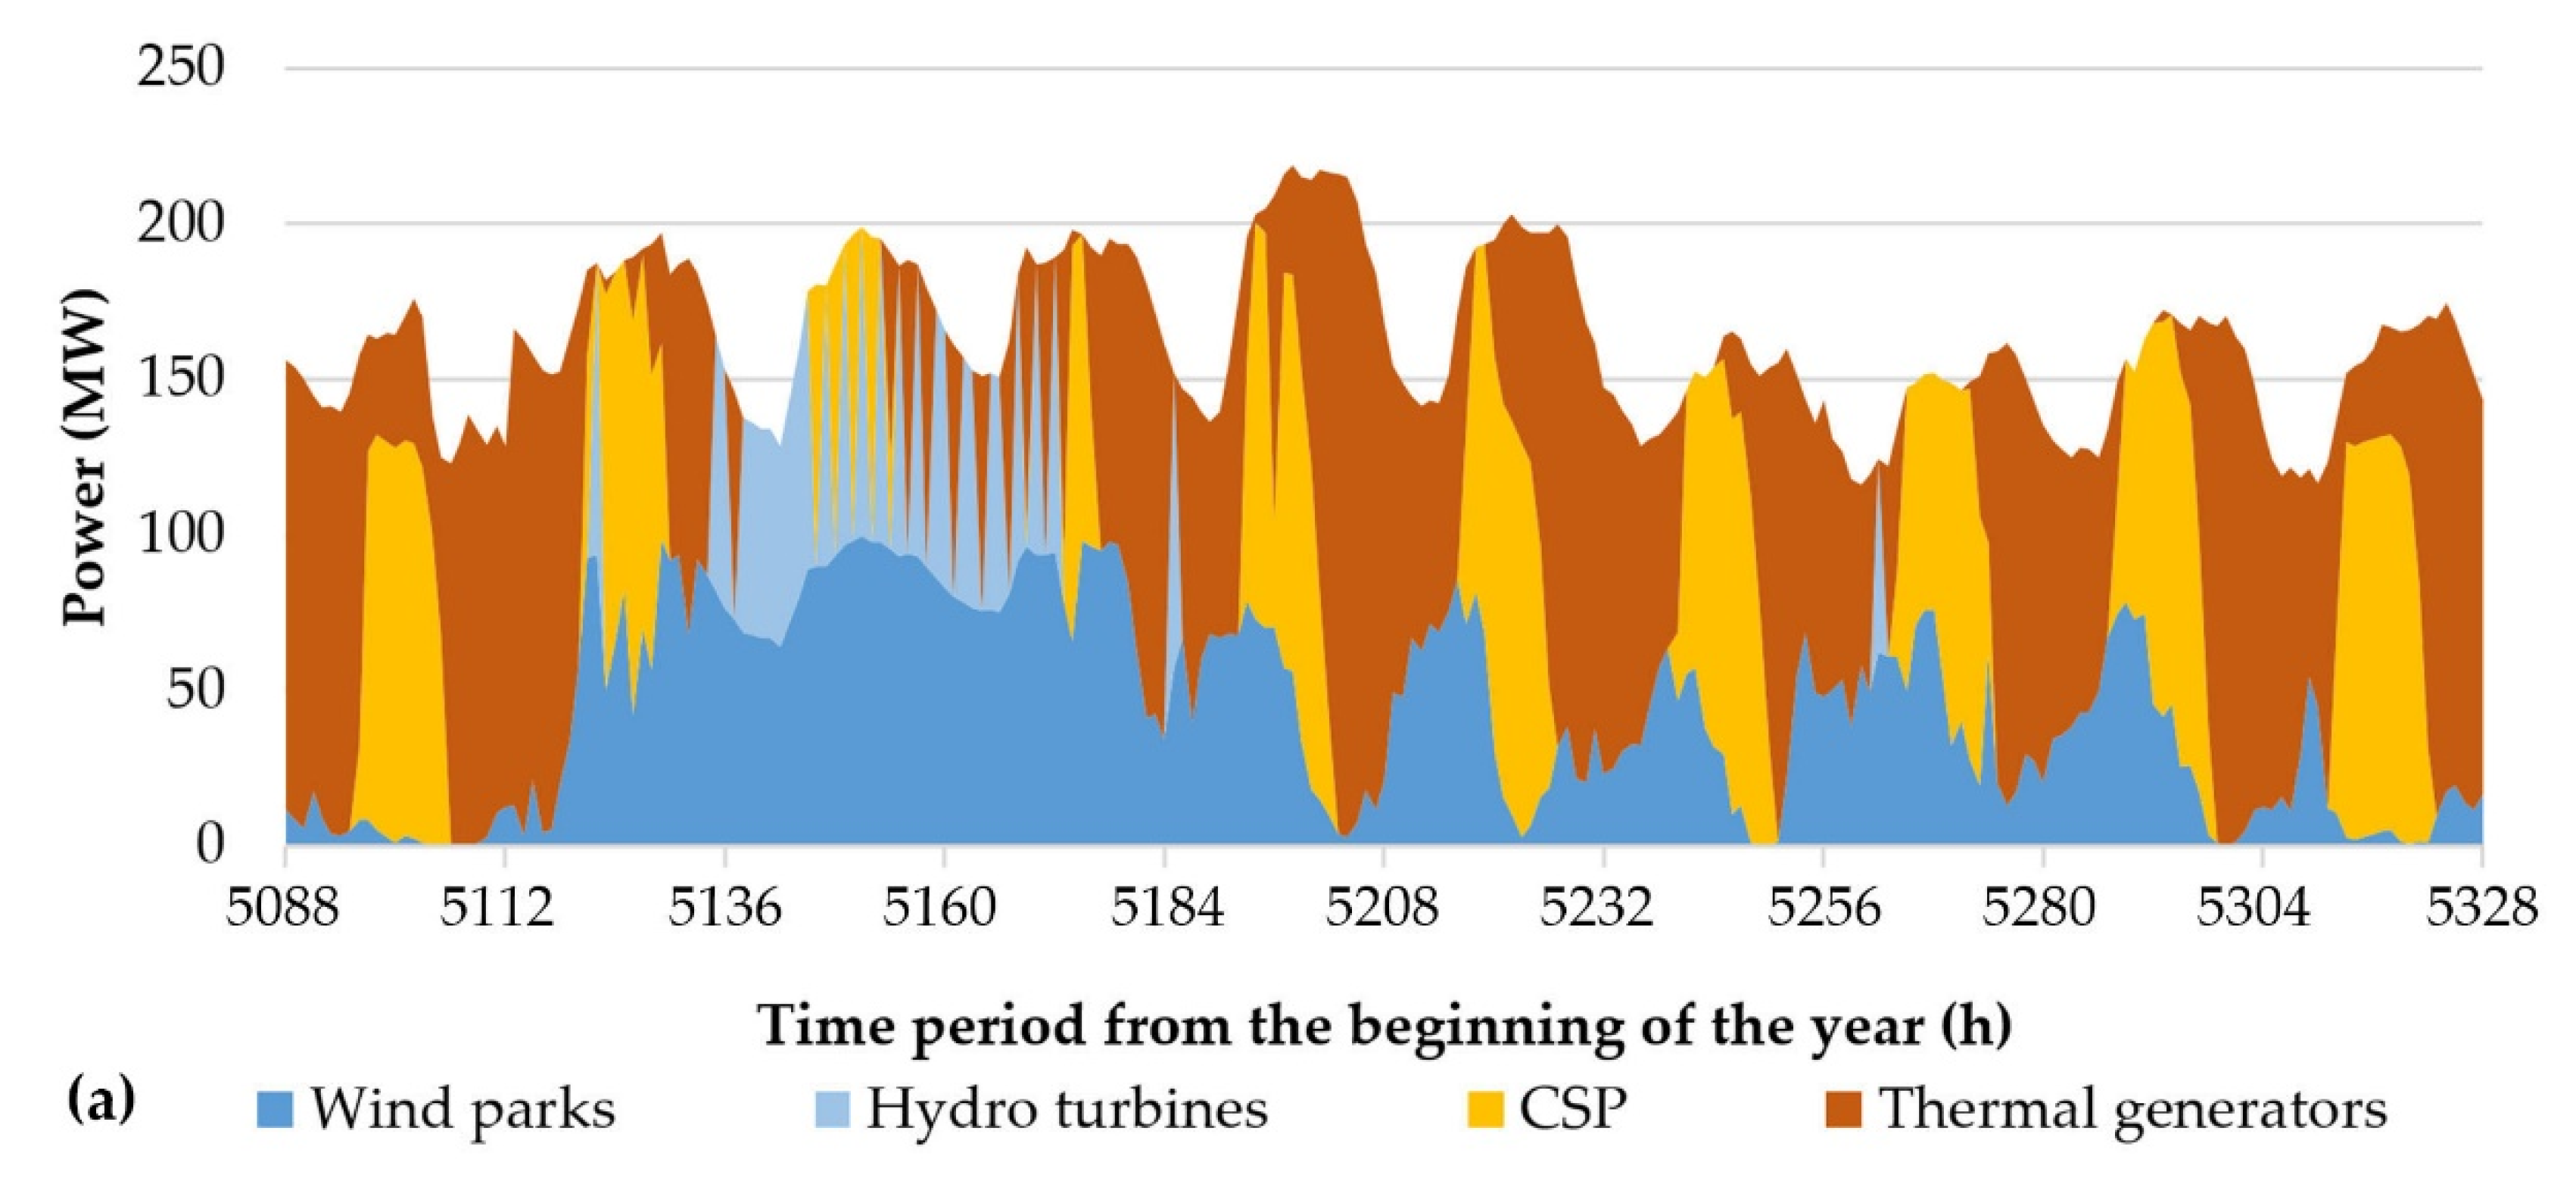
In Figure 11, the annual power production synthesis graph is presented. In Figure 12a, the power production synthesis from 1 to 10 August is presented, hich corresponds to a peak power demand period, while in Figure 12b, a low power demand period is shown from 1 to 10 November.

Figure 11.
Annual power production synthesis graph.

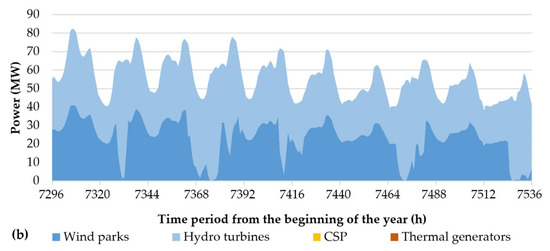
Figure 12.
Power production synthesis graph (a) from 1 to 10 August (peak power demand period) and (b) from 1 to 10 November (low power demand period).
As seen in Figure 12b, extensive time intervals during which the power demand will be fully undertaken by the wind park and the hydro turbines are expected. During these periods, the system’s frequency will be controlled and regulated by the hydro turbines; hence, their operation frequency should be equal to the system’s nominal frequency (50 Hz). Of course, hydro turbines will be synchronous generators. Implemented dynamic security assessment studies have indicated the adequacy of such systems to guarantee the dynamic security and the stability of the newly configured electrical systems [47]. The response of the PHS to the power demand fluctuations or any potential contingencies in the grid can be further improved with the introduction of variable speed pumps, roughly 25% of the total installed pump units.
The contribution of the CSP in generation is clearly seen especially during the much-needed summer season, where the demand peaks. The annual savings from the CSP generation equals 78,108 MWh.
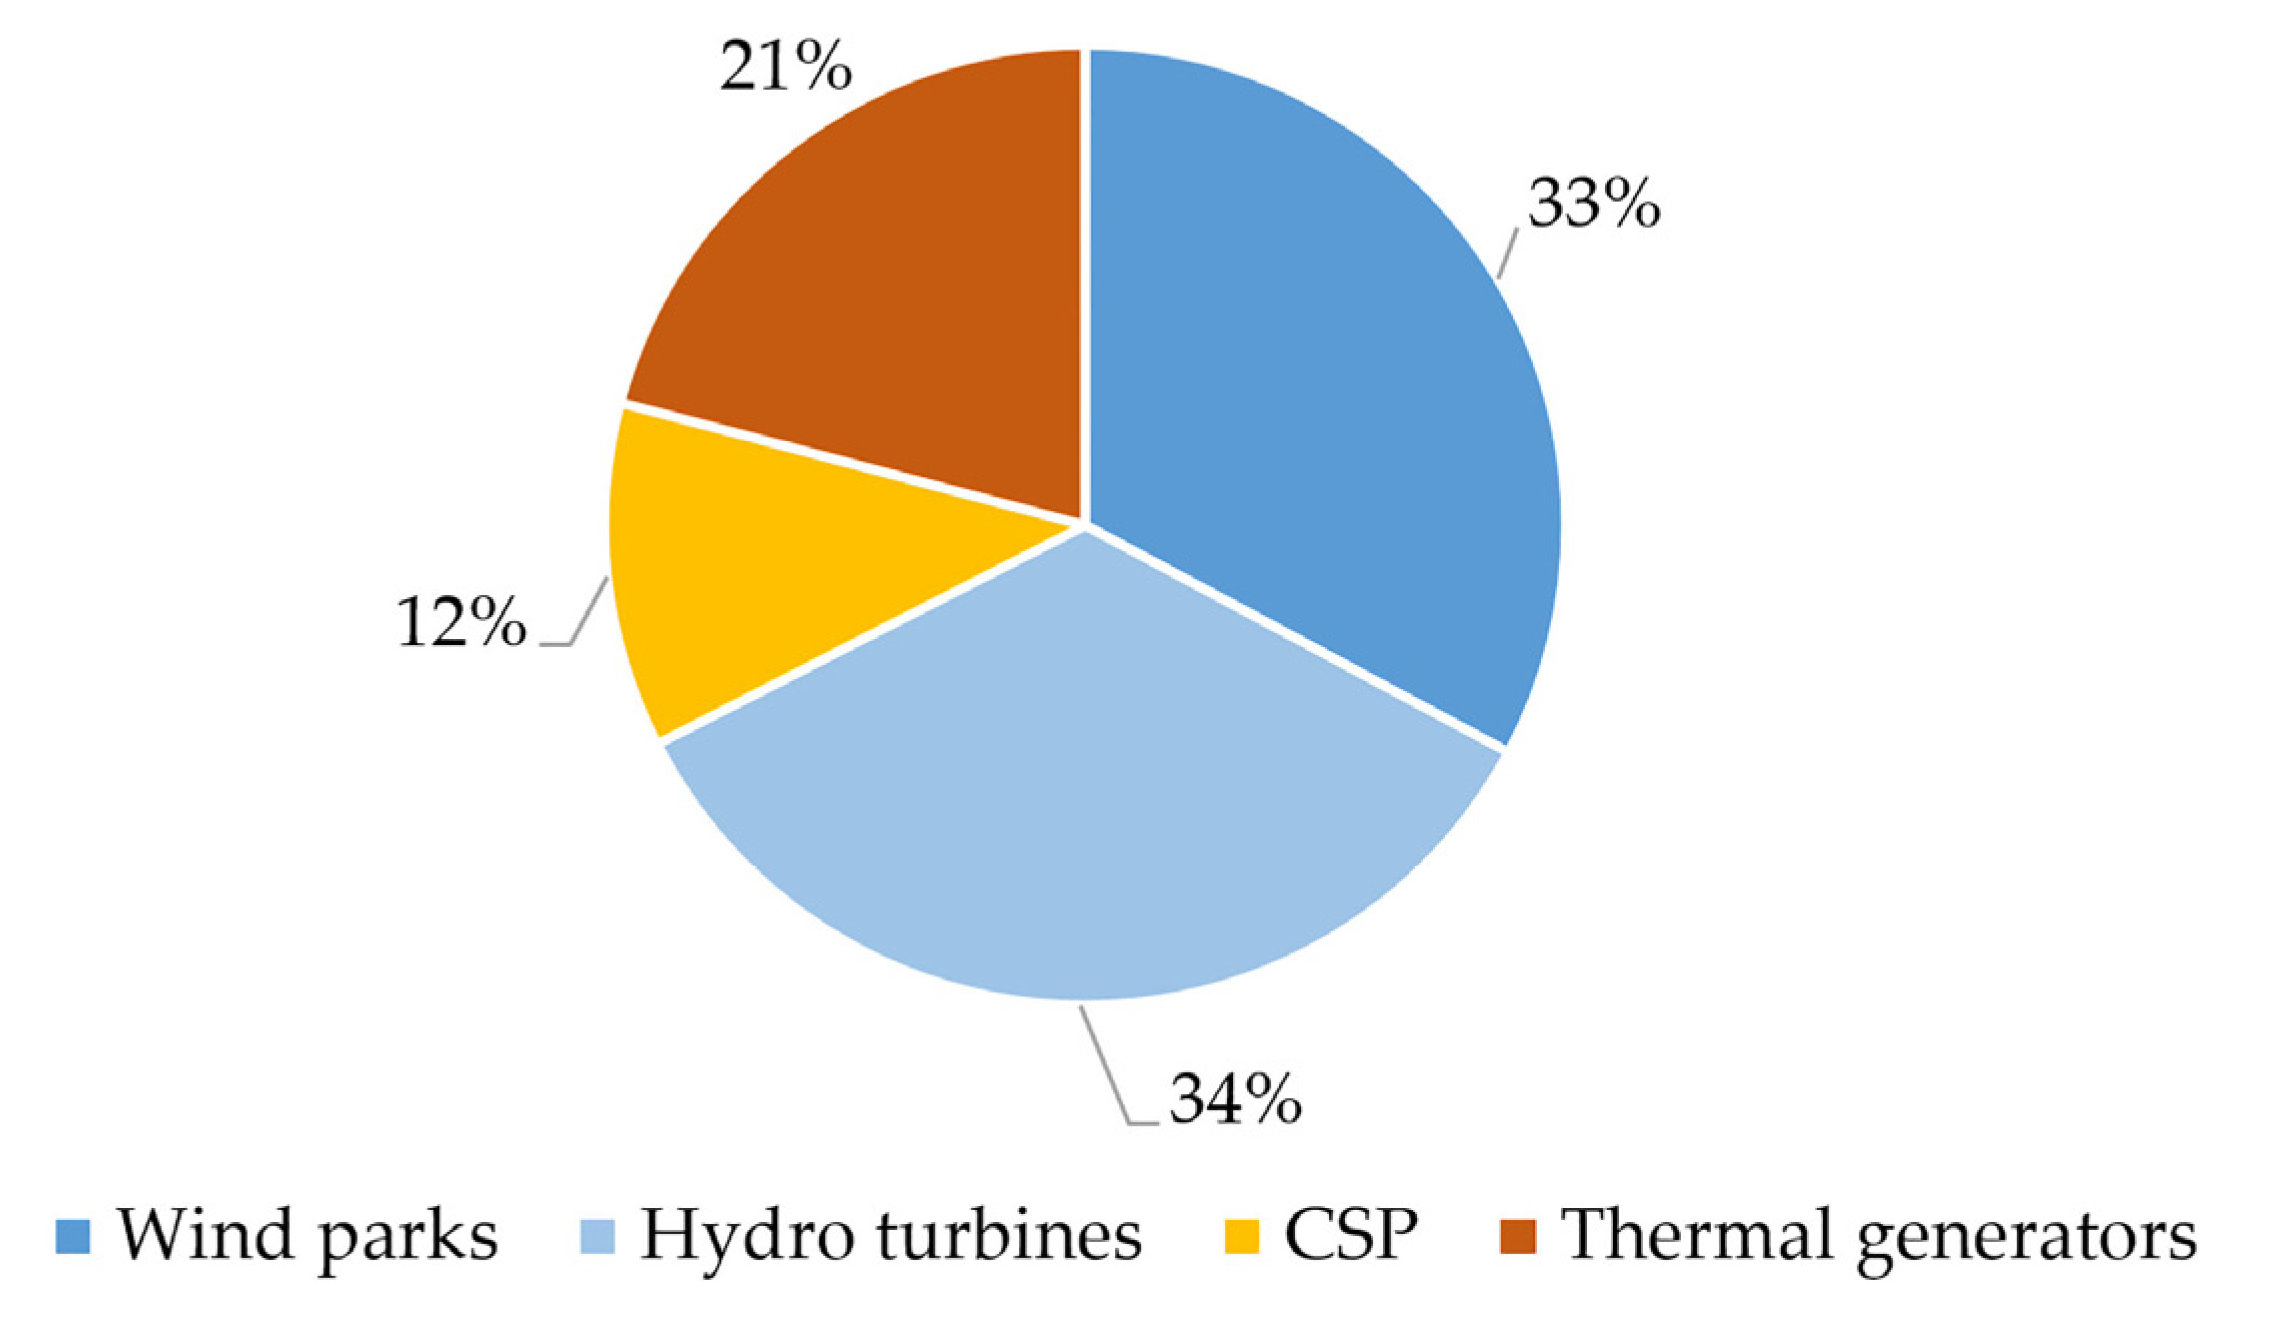
Finally, in Figure 13, the annual electricity production percentage share graph is provided for the different power production units of the examined plants.
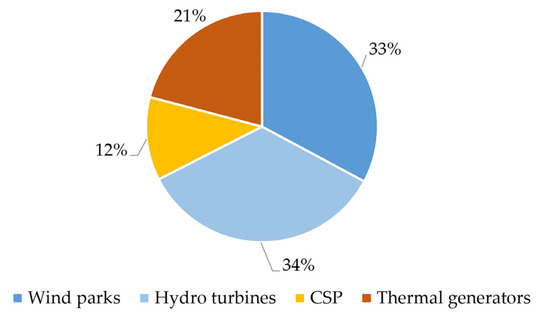
Figure 13.
Annual electricity production percentage share graph for wind park, PHS, thermal generators and CSP.
4.2. Siting of the Projects
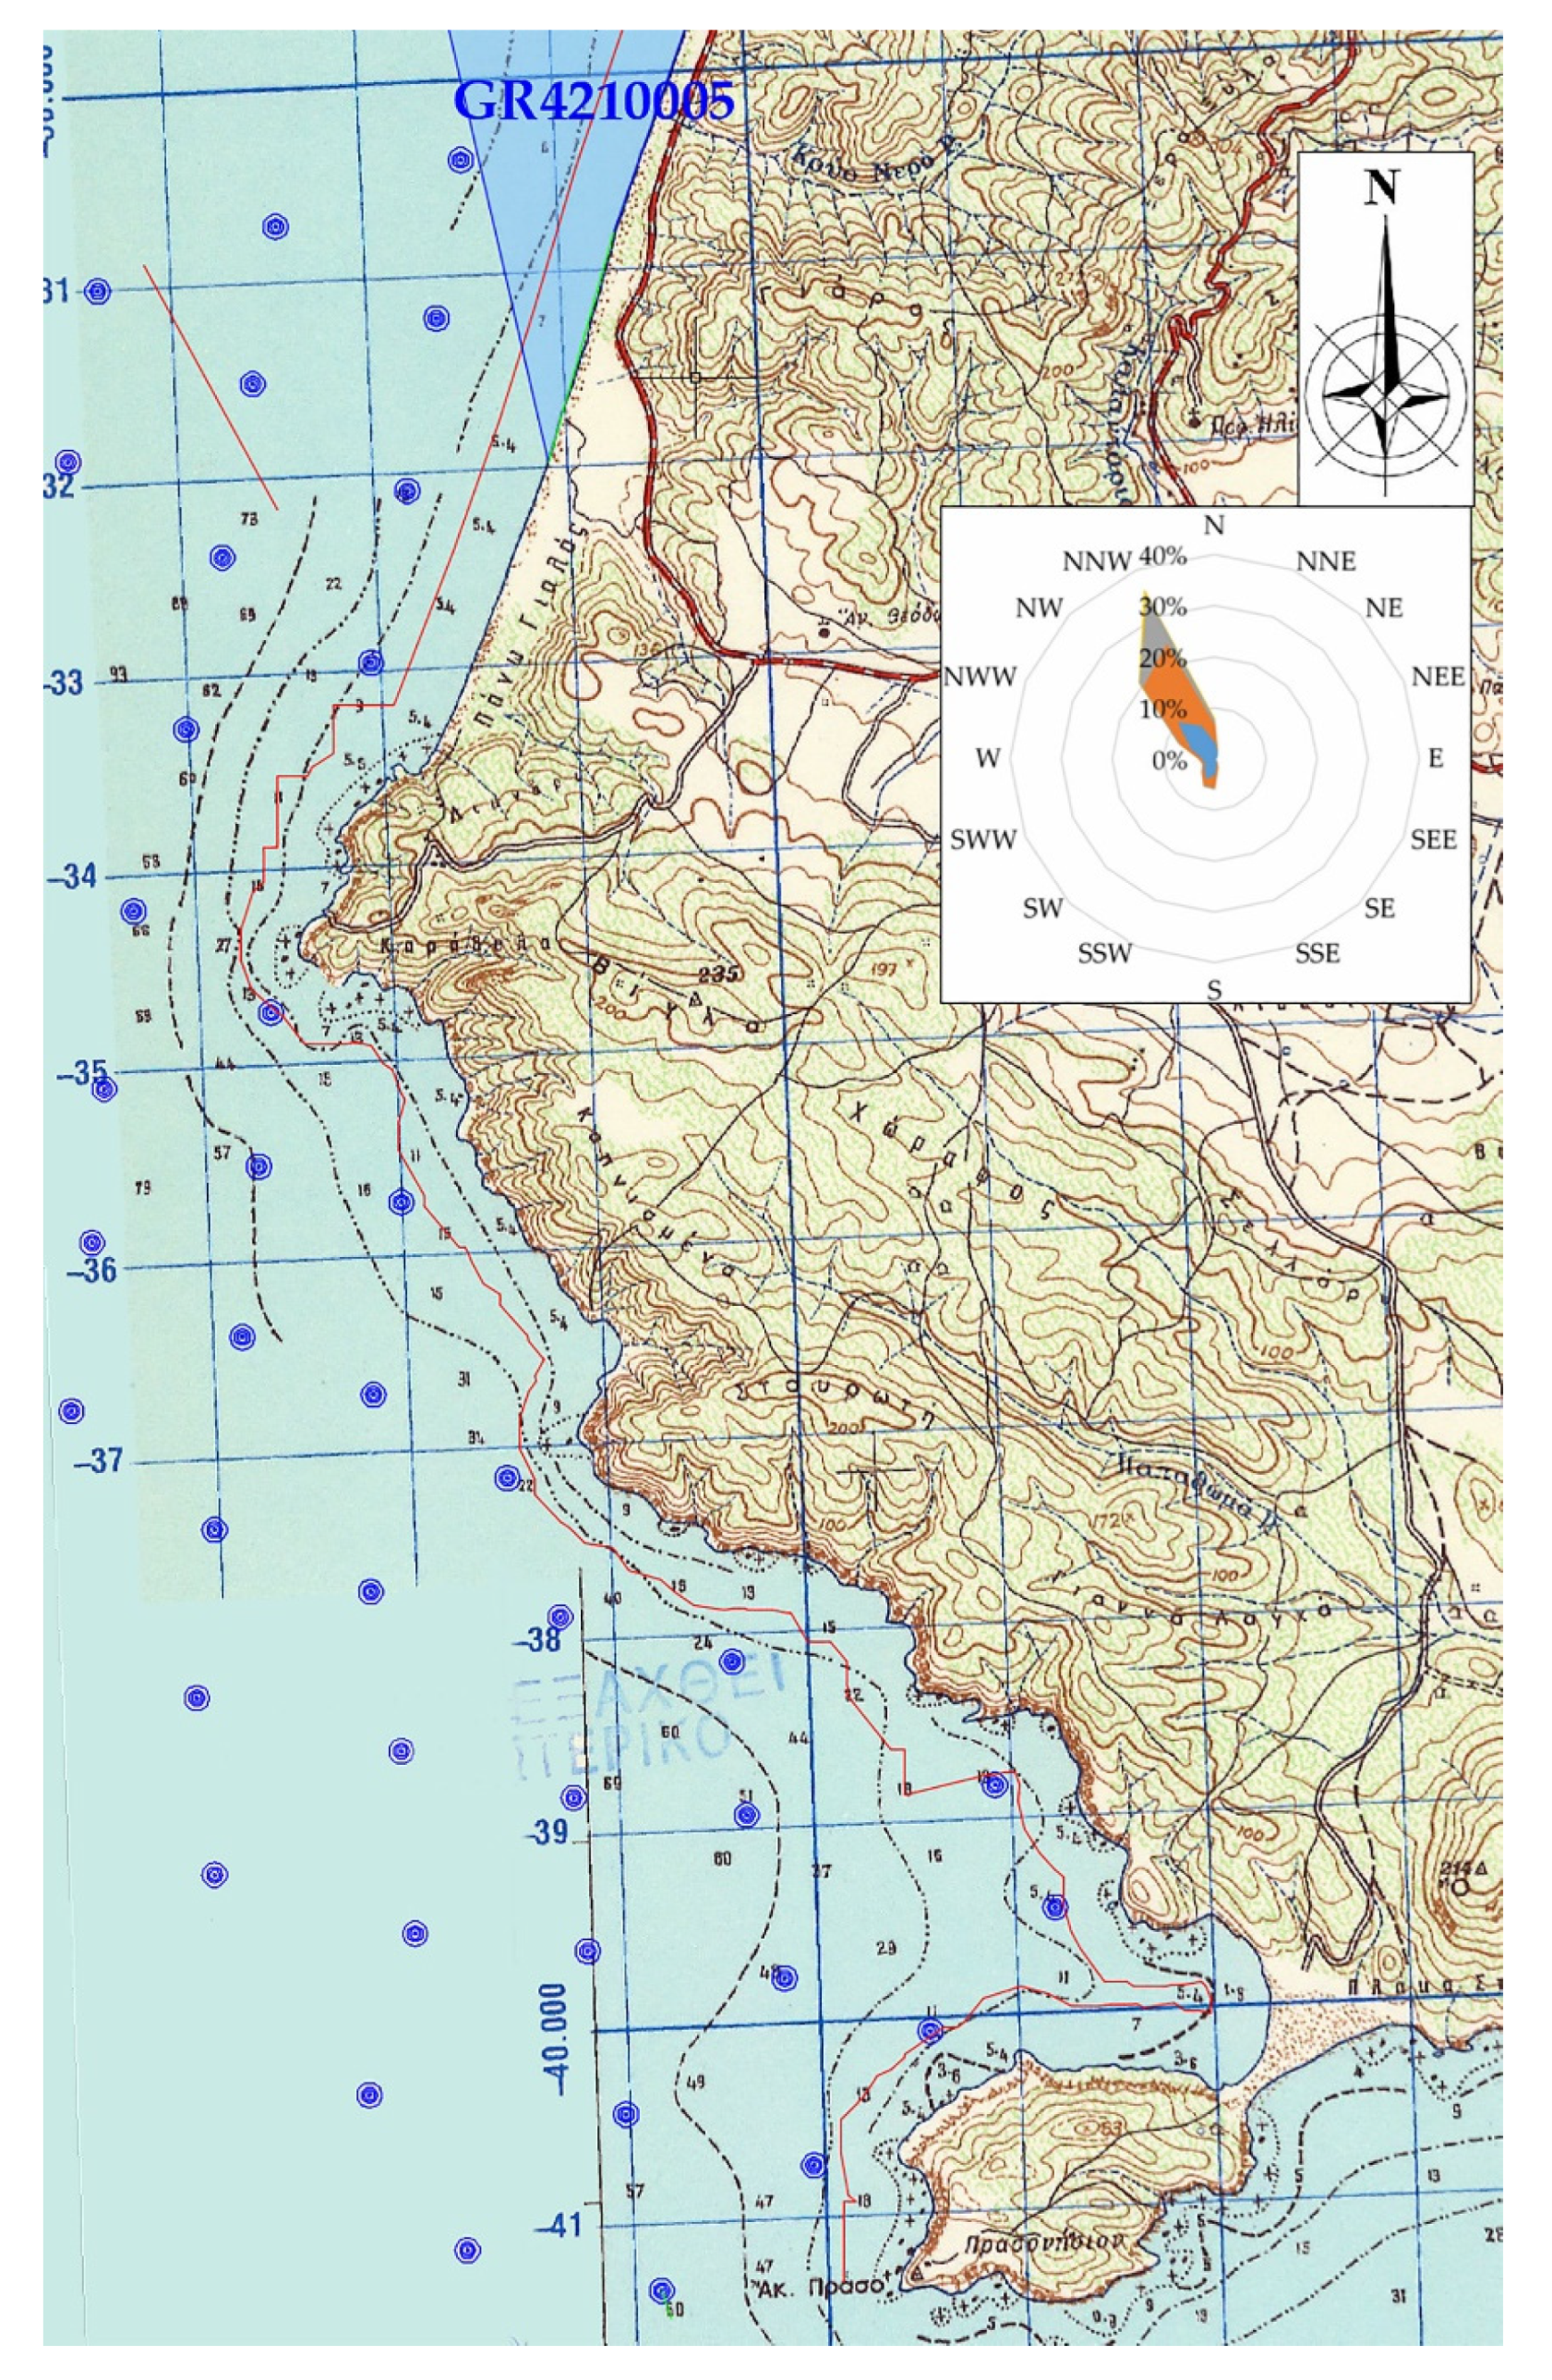
The siting of the PHS is presented in Section 3.3. In Figure 14, the offshore wind park siting is presented.

Figure 14.
Siting of the offshore wind park. Blue circles depict wind turbines, while the red line depicts the boundary of 300 m distance from the coastline. The wind rose graph is shown inset.
The siting was designed according to the following rules:
- Firstly, the wind turbines installation lines is formulated, perpendicular to the wind blowing prevailing direction;
- A minimum distance of 5∙D (D the wind turbine’s diameter) is kept for the wind turbines being at the same line;
- A minimum distance of 7∙D is kept between the wind turbines lines;
- Down-wind turbines are placed halfway between two wind turbines in front;
- A minimum distance of 300 m from the coast is kept;
- The maximum depth of installation is maintained at 60 m to avoid higher installation costs related to increasing foundation costs;
- The installation of the wind turbines inside the neighboring GR4210005 Natura region is avoided;
- The maximum and minimum heliostat-to-tower height ratio is 8.5 and 0.75, respectively, while the maximum and minimum distance from the CSP tower was 1315 m and 115 m, respectively;
- The installation of the CSP plant is outside the neighboring Natura site GR4210029.
4.3. Economic Evaluation
The total set-up cost of the proposed systems is analyzed in Table 7.
Table 7.
Total set-up cost analysis.
The economic feasibility of the introduced systems is highly affected by the electricity selling price. The sizing of the examined power plants was executed with the hypothesis of the selling price being 0.25 EUR/kWh.
Table 8 presents the economic indices of the investment versus different electricity selling prices. The sensitivity analysis was executed separately for the HPP and the CSP.
Table 8.
Sensitivity analysis of the required investment versus the electricity selling price.
5. Conclusions
The technical and financial requirements for a model hybrid power plant with Wind/CSP generation and PHS were investigated in this article with a case study in the island of Rhodes. The hybrid power plant consisted of 40 offshore 5 MW wind turbines and a concentrating solar tower of nominal power 120 MW with PHS in suitable locations of the island. The proposed system has a 79% RES penetration from the initial 16.9%. With a 25%/75% equities/bank loan, the payback period is 5.2 and 16 years for the Wind/PHS and the CSP systems, respectively. Moreover, it was demonstrated that the peak demand during the summer months of the island temporally overlaps with the generation of the CSP plant. The shared annual energy generation of the CSP plant is 11.6%, which was alternatively generated by thermal diesel engines.
The wind park–PHS plant exhibits a higher economic feasibility and capability to undertake the electricity demand. The economic indices of the CSP plant, as a more expensive system, are not very attractive. However, both plants are economically viable with reasonable electricity selling prices, considering also the currently configured procurement prices. The presented system design is supported by the suitable landscape of the island for the development of wind and CSP power production, as well as storage systems that can aid towards a wider utilization of the insular renewable resource, whilst offering savings in the cost of energy. Together, they can guarantee a secure RES penetration for the investigated island close to 80%.
Author Contributions
Conceptualization, methodology, writing—original draft preparation, writing—review and editing, G.E.A. and D.A.K.; data curation: G.K. and E.D. funding acquisition, G.E.A. and D.A.K. All authors have read and agreed to the published version of the manuscript.
Funding
This work was supported by an academic fellowship from the HMU Postdoctoral Research Program, 2021.
Institutional Review Board Statement
Not applicable.
Informed Consent Statement
Not applicable.
Data Availability Statement
Not applicable.
Conflicts of Interest
The authors declare no conflict of interest.
Abbreviations (Alphabetically)
| CSP | Concentrating Solar Power |
| HEDNO | Hellenic Electricity Distribution Network Operator |
| HPP | Hybrid Power Plant |
| IPTO | Independent Power Transmission Operator |
| IRR | Internal Rate of Return |
| PHS | Pumped Hydro Storage |
| PTC | Parabolic Trough Collectors |
| RES | Renewable Energy Sources |
| SPT | Solar Power Tower |
| Nomenclature (Alphabetically) | |
| a | Maximum RES power penetration percentage versus the current power demand |
| Hh | Total water falling head |
| HP | Total pumping head |
| j | Current time calculation step |
| Pcsp | Power produced by the concentrating solar power plant |
| Pcspp | Power penetration of the concentrating solar power plant |
| Pd | Power demand |
| Pdrem | Remaining power demand |
| Ph | Electricity power production from the hydro turbines |
| Pw | Power production from the wind park |
| Pwav | Available wind power for storage |
| Pwp | Wind power penetration for the power demand direct coverage |
| Pst | Power storage |
| Psur | Wind power production surplus |
| Psp | Power demand aimed to be covered by the solar thermal power plant |
| t | Duration of the time calculation step |
| Vmax | Upper reservoir’s maximum capacity |
| Vmin | Minimum water volume that is always contained in the reservoir, due to constructive limitations |
| Vst(j) | Remaining water volume the PHS upper reservoir at the end of the current time calculation step |
| Vst (j − 1) | Remaining water volume the PHS upper reservoir at the end of the previous time calculation step |
| VP | Water volume required to be pumped in the PHS upper reservoir, so that the available for storage power Pwav for a time step of duration t can be stored |
| VT | Water volume required to be supplied from the upper reservoir, so that the remaining power demand Pd − Pwp for a time step of duration t can be covered by the hydro turbines |
| α | Absorptivity of the solar receiver |
| γ | Water specific weight |
| ηh | Hydro turbines’ average efficiency |
| ηP | Pumps’ average efficiency |
References
- Lozano, L.; Querikiol, E.M.; Taboada, E.B. The Viability of Providing 24-Hour Electricity Access to Off-Grid Island Communities in the Philippines. Energies 2021, 14, 6797. [Google Scholar] [CrossRef]
- Fauzy, A.; Yue, C.-D.; Tu, C.-C.; Lin, T.-H. Understanding the Potential of Wind Farm Exploitation in Tropical Island Countries: A Case for Indonesia. Energies 2021, 14, 2652. [Google Scholar] [CrossRef]
- Canbulat, S.; Balci, K.; Canbulat, O.; Bayram, I.S. Techno-Economic Analysis of On-Site Energy Storage Units to Mitigate Wind Energy Curtailment: A Case Study in Scotland. Energies 2021, 14, 1691. [Google Scholar] [CrossRef]
- Benalcazar, P.; Suski, A.; Kamiński, J. Optimal Sizing and Scheduling of Hybrid Energy Systems: The Cases of Morona Santiago and the Galapagos Islands. Energies 2020, 13, 3933. [Google Scholar] [CrossRef]
- European Commission. Clean Energy for EU Islands. Available online: https://energy.ec.europa.eu/topics/markets-and-consumers/clean-energy-eu-islands_en (accessed on 29 August 2022).
- Guo, R.; Khenkin, M.V.; Arnaoutakis, G.E.; Samoylova, N.A.; Barbé, J.; Lee, H.K.H.; Tsoi, W.C.; Katz, E.A. Initial Stages of Photodegradation of MAPbI3 Perovskite: Accelerated Aging with Concentrated Sunlight. Sol. RRL 2019, 4, 1900270. [Google Scholar] [CrossRef]
- Mahon, N.S.; Korolik, O.V.; Khenkin, M.V.; Arnaoutakis, G.E.; Galagan, Y.; Soriūtė, V.; Litvinas, D.; Ščajev, P.; Katz, E.A.; Mazanik, A.V. Photoluminescence Kinetics for Monitoring Photoinduced Processes in Perovskite Solar Cells. Sol. Energy 2020, 195, 114–120. [Google Scholar] [CrossRef]
- Arnaoutakis, G.E.; Favilla, E.; Tonelli, M.; Richards, B.S. Single Crystal Monolithic Upconverter Solar Cell Device Tandems with Integrated Optics. J. Opt. Soc. Am. B JOSAB 2022, 39, 239–247. [Google Scholar] [CrossRef]
- Arnaoutakis, G.E.; Katsaprakakis, D.A. Concentrating Solar Power Advances in Geometric Optics, Materials and System Integration. Energies 2021, 14, 6229. [Google Scholar] [CrossRef]
- Katsaprakakis, D.A.; Dakanali, I.; Condaxakis, C.; Christakis, D.G. Comparing Electricity Storage Technologies for Small Insular Grids. Appl. Energy 2019, 251, 113332. [Google Scholar] [CrossRef]
- Alessandrini, S.; McCandless, T. The Schaake Shuffle Technique to Combine Solar and Wind Power Probabilistic Forecasting. Energies 2020, 13, 2503. [Google Scholar] [CrossRef]
- Monforti, F.; Huld, T.; Bódis, K.; Vitali, L.; D’Isidoro, M.; Lacal-Arántegui, R. Assessing Complementarity of Wind and Solar Resources for Energy Production in Italy. A Monte Carlo Approach. Renew. Energy 2014, 63, 576–586. [Google Scholar] [CrossRef]
- Weschenfelder, F.; de Novaes Pires Leite, G.; Araújo da Costa, A.C.; de Castro Vilela, O.; Ribeiro, C.M.; Villa Ochoa, A.A.; Araújo, A.M. A Review on the Complementarity between Grid-Connected Solar and Wind Power Systems. J. Clean. Prod. 2020, 257, 120617. [Google Scholar] [CrossRef]
- Schindler, D.; Behr, H.D.; Jung, C. On the Spatiotemporal Variability and Potential of Complementarity of Wind and Solar Resources. Energy Convers. Manag. 2020, 218, 113016. [Google Scholar] [CrossRef]
- Kapica, J.; Canales, F.A.; Jurasz, J. Global Atlas of Solar and Wind Resources Temporal Complementarity. Energy Convers. Manag. 2021, 246, 114692. [Google Scholar] [CrossRef]
- Heide, D.; Greiner, M.; von Bremen, L.; Hoffmann, C. Reduced Storage and Balancing Needs in a Fully Renewable European Power System with Excess Wind and Solar Power Generation. Renew. Energy 2011, 36, 2515–2523. [Google Scholar] [CrossRef]
- Prasad, A.A.; Taylor, R.A.; Kay, M. Assessment of Solar and Wind Resource Synergy in Australia. Appl. Energy 2017, 190, 354–367. [Google Scholar] [CrossRef]
- Thomaidis, N.S.; Santos-Alamillos, F.J.; Pozo-Vázquez, D.; Usaola-García, J. Optimal Management of Wind and Solar Energy Resources. Comput. Oper. Res. 2016, 66, 284–291. [Google Scholar] [CrossRef]
- Santos-Alamillos, F.J.; Pozo-Vázquez, D.; Ruiz-Arias, J.A.; Von Bremen, L.; Tovar-Pescador, J. Combining Wind Farms with Concentrating Solar Plants to Provide Stable Renewable Power. Renew. Energy 2015, 76, 539–550. [Google Scholar] [CrossRef]
- Peterseim, J.H.; White, S.; Tadros, A.; Hellwig, U. Concentrated Solar Power Hybrid Plants, Which Technologies Are Best Suited for Hybridisation? Renew. Energy 2013, 57, 520–532. [Google Scholar] [CrossRef]
- Peterseim, J.H.; White, S.; Tadros, A.; Hellwig, U. Concentrating Solar Power Hybrid Plants—Enabling Cost Effective Synergies. Renew. Energy 2014, 67, 178–185. [Google Scholar] [CrossRef]
- Pramanik, S.; Ravikrishna, R.V. A Review of Concentrated Solar Power Hybrid Technologies. Appl. Therm. Eng. 2017, 127, 602–637. [Google Scholar] [CrossRef]
- Powell, K.M.; Rashid, K.; Ellingwood, K.; Tuttle, J.; Iverson, B.D. Hybrid Concentrated Solar Thermal Power Systems: A Review. Renew. Sustain. Energy Rev. 2017, 80, 215–237. [Google Scholar] [CrossRef]
- Li, R.; Guo, S.; Yang, Y.; Liu, D. Optimal Sizing of Wind/ Concentrated Solar Plant/ Electric Heater Hybrid Renewable Energy System Based on Two-Stage Stochastic Programming. Energy 2020, 209, 118472. [Google Scholar] [CrossRef]
- Okazaki, T.; Shirai, Y.; Nakamura, T. Concept Study of Wind Power Utilizing Direct Thermal Energy Conversion and Thermal Energy Storage. Renew. Energy 2015, 83, 332–338. [Google Scholar] [CrossRef]
- Yang, Y.; Guo, S.; Liu, D.; Li, R.; Chu, Y. Operation Optimization Strategy for Wind-Concentrated Solar Power Hybrid Power Generation System. Energy Convers. Manag. 2018, 160, 243–250. [Google Scholar] [CrossRef]
- Du, E.; Zhang, N.; Hodge, B.-M.; Wang, Q.; Kang, C.; Kroposki, B.; Xia, Q. The Role of Concentrating Solar Power Toward High Renewable Energy Penetrated Power Systems. IEEE Trans. Power Syst. 2018, 33, 6630–6641. [Google Scholar] [CrossRef]
- Kost, C.; Pfluger, B.; Eichhammer, W.; Ragwitz, M. Fruitful Symbiosis: Why an Export Bundled with Wind Energy Is the Most Feasible Option for North African Concentrated Solar Power. Energy Policy 2011, 39, 7136–7145. [Google Scholar] [CrossRef]
- Keyif, E.; Hornung, M.; Zhu, W. Optimal Configurations and Operations of Concentrating Solar Power Plants under New Market Trends. Appl. Energy 2020, 270, 115080. [Google Scholar] [CrossRef]
- Ding, Z.; Hou, H.; Yu, G.; Hu, E.; Duan, L.; Zhao, J. Performance Analysis of a Wind-Solar Hybrid Power Generation System. Energy Convers. Manag. 2019, 181, 223–234. [Google Scholar] [CrossRef]
- Yang, J.; Yang, Z.; Duan, Y. Optimal Capacity and Operation Strategy of a Solar-Wind Hybrid Renewable Energy System. Energy Convers. Manag. 2021, 244, 114519. [Google Scholar] [CrossRef]
- Reichling, J.P.; Kulacki, F.A. Utility Scale Hybrid Wind–Solar Thermal Electrical Generation: A Case Study for Minnesota. Energy 2008, 33, 626–638. [Google Scholar] [CrossRef]
- Vick, B.D.; Moss, T.A. Adding Concentrated Solar Power Plants to Wind Farms to Achieve a Good Utility Electrical Load Match. Sol. Energy 2013, 92, 298–312. [Google Scholar] [CrossRef]
- Sioshansi, R.; Denholm, P. Benefits of Colocating Concentrating Solar Power and Wind. IEEE Trans. Sustain. Energy 2013, 4, 877–885. [Google Scholar] [CrossRef]
- Petrakopoulou, F.; Robinson, A.; Loizidou, M. Simulation and Evaluation of a Hybrid Concentrating-Solar and Wind Power Plant for Energy Autonomy on Islands. Renew. Energy 2016, 96, 863–871. [Google Scholar] [CrossRef]
- Mohammadi, K.; Khanmohammadi, S.; Khorasanizadeh, H.; Powell, K. A Comprehensive Review of Solar Only and Hybrid Solar Driven Multigeneration Systems: Classifications, Benefits, Design and Prospective. Appl. Energy 2020, 268, 114940. [Google Scholar] [CrossRef]
- Bueno, C.; Carta, J.A. Wind Powered Pumped Hydro Storage Systems, a Means of Increasing the Penetration of Renewable Energy in the Canary Islands. Renew. Sustain. Energy Rev. 2006, 10, 312–340. [Google Scholar] [CrossRef]
- Beires, P.; Vasconcelos, M.H.; Moreira, C.L.; Peças Lopes, J.A. Stability of Autonomous Power Systems with Reversible Hydro Power Plants: A Study Case for Large Scale Renewables Integration. Electr. Power Syst. Res. 2018, 158, 1–14. [Google Scholar] [CrossRef]
- Platero, C.A.; Nicolet, C.; Sánchez, J.A.; Kawkabani, B. Increasing Wind Power Penetration in Autonomous Power Systems through No-Flow Operation of Pelton Turbines. Renew. Energy 2014, 68, 515–523. [Google Scholar] [CrossRef]
- Setas Lopes, A.; Castro, R.; Silva, C.S. Design of Water Pumped Storage Systems: A Sensitivity and Scenario Analysis for Island Microgrids. Sustain. Energy Technol. Assess. 2020, 42, 100847. [Google Scholar] [CrossRef]
- Pérez-Díaz, J.I.; Chazarra, M.; García-González, J.; Cavazzini, G.; Stoppato, A. Trends and Challenges in the Operation of Pumped-Storage Hydropower Plants. Renew. Sustain. Energy Rev. 2015, 44, 767–784. [Google Scholar] [CrossRef]
- Bouzounierakis, N.; Katsigiannis, Y.; Fiorentzis, K.; Karapidakis, E. Effect of Hybrid Power Station Installation in the Operation of Insular Power Systems. Inventions 2019, 4, 38. [Google Scholar] [CrossRef]
- Papaefthymiou, S.V.; Karamanou, E.G.; Papathanassiou, S.A.; Papadopoulos, M.P. A Wind-Hydro-Pumped Storage Station Leading to High RES Penetration in the Autonomous Island System of Ikaria. IEEE Trans. Sustain. Energy 2010, 1, 163–172. [Google Scholar] [CrossRef]
- Kapsali, M.; Anagnostopoulos, J.S. Investigating the Role of Local Pumped-Hydro Energy Storage in Interconnected Island Grids with High Wind Power Generation. Renew. Energy 2017, 114, 614–628. [Google Scholar] [CrossRef]
- Katsaprakakis, D.A.; Michopoulos, A.; Skoulou, V.; Dakanali, E.; Maragkaki, A.; Pappa, S.; Antonakakis, I.; Christakis, D.; Condaxakis, C. A Multidisciplinary Approach for an Effective and Rational Energy Transition in Crete Island, Greece. Energies 2022, 15, 3010. [Google Scholar] [CrossRef]
- Katsaprakakis, D.A.; Proka, A.; Zafirakis, D.; Damasiotis, M.; Kotsampopoulos, P.; Hatziargyriou, N.; Dakanali, E.; Arnaoutakis, G.; Xevgenos, D. Greek Islands’ Energy Transition: From Lighthouse Projects to the Emergence of Energy Communities. Energies 2022, 15, 5996. [Google Scholar] [CrossRef]
- Katsaprakakis, D.A.; Voumvoulakis, M. A Hybrid Power Plant towards 100% Energy Autonomy for the Island of Sifnos, Greece. Perspectives Created from Energy Cooperatives. Energy 2018, 161, 680–698. [Google Scholar] [CrossRef]
- Katsaprakakis, D.A.; Dakanali, E.; Dimopoulos, A.; Gyllis, Y. Energy Transition on Sifnos: An Approach to Economic and Social Transition and Development. Appl. Sci. 2022, 12, 2680. [Google Scholar] [CrossRef]
- Ding, H.; Hu, Z.; Song, Y. Stochastic Optimization of the Daily Operation of Wind Farm and Pumped-Hydro-Storage Plant. Renew. Energy 2012, 48, 571–578. [Google Scholar] [CrossRef]
- Graça Gomes, J.; Telhada, J.; Xu, H.; Sá da Costa, A.; Zhao, C. Optimal Operation Scheduling of a Pump Hydro Storage System Coupled with a Wind Farm. IET Renew. Power Gener. 2021, 15, 173–192. [Google Scholar] [CrossRef]
- Su, C.; Cheng, C.; Wang, P.; Shen, J.; Wu, X. Optimization Model for Long-Distance Integrated Transmission of Wind Farms and Pumped-Storage Hydropower Plants. Appl. Energy 2019, 242, 285–293. [Google Scholar] [CrossRef]
- Libanori, G.H.D.; Pinheiro, V.d.C.N.; Francato, A.L. Hybrid Power Plants as an Alternative to Fit Pumped-Storage Hydro in Brazilian Electricity Sector Regulatory Framework. Int. J. Energy Res. 2018, 42, 4898–4908. [Google Scholar] [CrossRef]
- Trama, C.P.; Pereira Júnior, A.O.; Guimarães, A.P.C.; Diniz, A.L.; dos Vieira, L.S.R. Cost–Benefit Analysis of Solar Thermal Plants with Storage in a Hydrothermal System. Energies 2021, 14, 5662. [Google Scholar] [CrossRef]
- Wen, L.; Suomalainen, K.; Sharp, B.; Yi, M.; Sheng, M.S. Impact of Wind-Hydro Dynamics on Electricity Price: A Seasonal Spatial Econometric Analysis. Energy 2022, 238, 122076. [Google Scholar] [CrossRef]
- Du, E.; Zhang, N.; Hodge, B.-M.; Kang, C.; Kroposki, B.; Xia, Q. Economic Justification of Concentrating Solar Power in High Renewable Energy Penetrated Power Systems. Appl. Energy 2018, 222, 649–661. [Google Scholar] [CrossRef]
- Papantonis, D. Hydrodynamic Machines: Pumps & Hydro Turbines; Symeon Editions: Athens, Greece, 1995. [Google Scholar]
- Arnaoutakis, G.E.; Papadakis, N.; Katsaprakakis, D. CombiCSP: A Python Routine for Dynamic Modeling of Concentrating Solar Power Plants. Softw. Impacts 2022, 13, 100367. [Google Scholar] [CrossRef]
- Hellenic Statistical Authority. 2021 Population-Housing Census—ELSTAT. Available online: https://www.statistics.gr/en/2021-census-pop-hous (accessed on 29 August 2022).
- Oikonomou, E.K.; Kilias, V.; Goumas, A.; Rigopoulos, A.; Karakatsani, E.; Damasiotis, M.; Papastefanakis, D.; Marini, N. Renewable Energy Sources (RES) Projects and Their Barriers on a Regional Scale: The Case Study of Wind Parks in the Dodecanese Islands, Greece. Energy Policy 2009, 37, 4874–4883. [Google Scholar] [CrossRef]
- Lalas, D.P.; Tselepidaki, H.; Theoharatos, G. An Analysis of Wind Power Potential in Greece. Sol. Energy 1983, 30, 497–505. [Google Scholar] [CrossRef]
- Kanellpoulos, D. National Wind Resources Validation in Greece. J. Wind Eng. Ind. Aerodyn. 1992, 39, 367–372. [Google Scholar] [CrossRef]
- Katsaprakakis, D.A.; Christakis, D.G. Maximisation of RES Penetration in Greek Insular Isolated Power Systems with the Introduction of Pumped Storage Systems. In Proceedings of the European Wind Energy Conference and Exhibition 2009, Marseille, France, 16–19 March 2009; p. 13. [Google Scholar]
- Katsaprakakis, D.A.; Papadakis, N.; Christakis, D.G.; Zervos, A. On the Wind Power Rejection in the Islands of Crete and Rhodes. Wind Energy 2007, 10, 415–434. [Google Scholar] [CrossRef]
- Kaldellis, J.K.; Boulogiorgou, D. 2.19—Social Acceptability of Wind Power Projects. In Comprehensive Renewable Energy, 2nd ed.; Letcher, T.M., Ed.; Elsevier: Oxford, UK, 2022; pp. 628–643. ISBN 978-0-12-819734-9. [Google Scholar]
- Katsaprakakis, D.A.; Christakis, D.G.; Stefanakis, I.; Spanos, P.; Stefanakis, N. Technical Details Regarding the Design, the Construction and the Operation of Seawater Pumped Storage Systems. Energy 2013, 55, 619–630. [Google Scholar] [CrossRef]
- Arnaoutakis, G.E.; Katsaprakakis, D.A.; Christakis, D.G. Dynamic Modeling of Combined Concentrating Solar Tower and Parabolic Trough for Increased Day-to-Day Performance. Appl. Energy 2022, 323, 119450. [Google Scholar] [CrossRef]
- Ballestrín, J.; Marzo, A. Solar Radiation Attenuation in Solar Tower Plants. Sol. Energy 2012, 86, 388–392. [Google Scholar] [CrossRef]
- Christian, A. Gueymard Visibility, Aerosol Conditions, and Irradiance Attenuation Close to the Ground—Comments on “Solar Radiation Attenuation in Solar Tower Plants” by J. Ballestrin and A. Marzo, Solar Energy (2012). Sol. Energy 2012, 86, 1667–1668. [Google Scholar] [CrossRef]


Publisher’s Note: MDPI stays neutral with regard to jurisdictional claims in published maps and institutional affiliations. |
© 2022 by the authors. Licensee MDPI, Basel, Switzerland. This article is an open access article distributed under the terms and conditions of the Creative Commons Attribution (CC BY) license (https://creativecommons.org/licenses/by/4.0/).