Article

Effect of Obstacles Gradient Arrangement on Non-Uniformly Distributed LPG–Air Premixed Gas Deflagration

1
National & Local Joint Engineering Research Center of Harbor Oil & Gas Storage and Transportation Technology, Zhoushan 316022, China
2
Zhejiang Key Laboratory of Petrochemical Environmental Pollution Control, Zhejiang Ocean University, Zhoushan 316022, China
3
School of Petrochemical Engineering & Environment, Zhejiang Ocean University, Zhoushan 316022, China
4
School of Naval Architecture & Maritime, Zhejiang Ocean University, Zhoushan 316022, China
5
Department of Oil, Army Logistical University, Chongqing 401331, China
*
Authors to whom correspondence should be addressed.
Energies 2022, 15(19), 6872; https://doi.org/10.3390/en15196872
Submission received: 18 August 2022 / Revised: 17 September 2022 / Accepted: 18 September 2022 / Published: 20 September 2022

Abstract

:
The arrangement of obstacles can significantly impact the deflagration behavior of combustible gases. In the actual pipeline accident site, liquefied petroleum gas (LPG) and other gases often show non-uniform distribution after leakage owing to diffusion and gravity, and the deflagration mechanism is also more complex. In this paper, based on the non-uniform distribution of combustible gases, the flame behavior and overpressure characteristics of LPG–air combustible gas deflagration are carried out by a combination of experiments and numerical simulations with obstacles arranged in increasing and decreasing blockage height. The results show that in the increasing blockage height arrangement, the flame forms a “straw hat” cavity, finally forming an elliptical region. In the decreasing blockage height arrangement, the flame appears as a “ribbon-shaped” narrow, blank area, which gradually becomes longer with time. By observing the overpressure and the structure of flame propagation in the coupled state, it is found that the explosion overpressure is maximum when the height of the obstacle is consistent, and the moment of the maximum area of flame appears slightly earlier than the appearance of the maximum overpressure peak. At the same time, without considering the change in height of the obstacle, the three arrangements all have an accelerating effect on the flame of deflagration. And the decreasing blockage height arrangement condition has the most obvious effect on the flame acceleration, which makes the peak of area of flame and the overpressure peak appear at first, and finally leads to the formation of a positive feedback mechanism among the speed of flame propagation, the area of flame and overpressure. In addition, in the case of the non-uniform distribution of combustible gases, the acceleration obtained by the flame at the initial stage is very important for the overall acceleration of the flame. The results of this paper can provide a reference for the placement of equipment and facilities in long and narrow spaces such as various pipe galleries, and to make predictions about the impact of the shape of some objects on the explosion and provide a theoretical basis for the prevention and management of gas explosions.

1. Introduction

In the process of transporting flammable gases, accidents occur from time to time, with pipe transport explosions accounting for the majority of them [1,2,3,4]. Accident investigation shows that the occurrence and development of oil and gas deflagration are closely related to the geometric structure of space, such as various types of equipment and facilities, and cross-sectional abrupt reduction structure [5,6,7]. Therefore, from the perspective of safety production, it is important to study the combustion and explosion of combustible gases in confined spaces with obstacles.
The impact of premixed combustible gases in confined spaces disturbed by obstacles after deflagration is mainly reflected in the following points. First, the obstacles cause the smooth boundary conditions of the original flow field to become complex. Second, the obstacles cause the flow field to produce an oblique gradient, which intensifies the flame state change and instability. Third, the influence of the obstacles on the flow field is finally reflected in the significant changes of parameters such as overpressure, the speed of flame propagation, and the overpressure rise rate (dp/dt). In order to study this problem clearly, a large number of scholars have focused on the shapes [8,9,10], numbers [11,12], locations [13,14], and blockage ratios (BRs) [15,16,17], etc., and some results have been obtained experimentally. It has been found that the spatial structure formed by the obstacles and the walls of the tube can significantly affect the mechanical characteristics of the flame of the deflagration. The presence of the obstacle itself causes significant changes in the area of the deflagration flame and turbulence, which significantly affects the local transient overpressure in upstream and downstream of the obstacle.
For example, rectangular obstacles disturb the flow field more strongly than spherical and trapezoidal obstacles [18]. Moreover, the horizontal stretching strength of the front tip of the flame during flame propagation is mainly influenced by the ratio of width to height of the obstacle, while vertical stretching is more limited by the height of the obstacle [19]. Not only the shape of the obstacle, but also the blockage rate (BR), can affect the deflagration characteristics of the premixed gas. It is found that a flat plate obstacle with a rounded hole causes three peaks in the deflagration overpressure curve of gasoline–air fuel, i.e., “overpressure relief peak”, “maximum overpressure peak”, and “negative overpressure peak” [20]. The BRs can also affect the speed of flame propagation of the liquefied petroleum gas (LPG) deflagration flame. Different BR values make the flame acceleration or deceleration trend different. As BR increases, the speed of flame propagation can first increase and then decrease. The key to increasing the speed of flame propagation and explosion pressure is the effect of flame surge on the unburned gas [21]. Similarly, studies have also found that obstacles have different effects on the deflagration of premixed hydrogen with different concentrations at different distances from the ignition site. After the flame passes through the gap formed between the obstacle and the tube inner wall, the maximum overpressure occurs at the moment when the flame merges in the area downstream of the obstacle. It can be found that when the equivalent ratio is less than 1.0, the overpressure peak increases with the distance of the position where the obstacle is located. Furthermore, the overpressure peak reaches the maximum stoichiometrically when the obstacle is at the middle position rather than at the farthest position [22]. In addition, changing the arrangement of the obstacles can likewise affect the flame behavior of the deflagration as well as the overpressure characteristics. Compared with the arrangement on one side of the tube or in the middle position, the alternate arrangement of obstacles on both sides of the tube can make the overpressure peak and the speed of flame propagation significantly higher, and the flame speed at the opening of the tube also can be correspondingly higher. This arrangement should be avoided in practice [23]. Further, obstacles of different shapes are symmetrically arranged on the upper and lower sides of the walls of the tube, and the tip structure of the triangular obstacles can cause a shear layer to appear in the flame. It then sheds into vortices, while compressing the laminar flow region, so that the flame boundary is compressed to the greatest extent [24], which is caused by the special structure of the triangle. Meanwhile, under lean fuel conditions, the propagation structure of the flame can directly reflect the influence of the obstacle on the explosion flow field and the rate of pressure rise can directly reflect the influence of the obstacle on the explosion intensity [25].
The above reviews are all experimental studies. With the rapid development of CFD technology, numerical simulation is also widely used in the explosion research of combustible gas. Some scholars have adopted a method combining experiments and numerical simulations, which is beneficial to study some details that cannot be observed due to hardware limitations. For example, Li et al. [26] used numerical simulation to analyze the influence of the layout of cylindrical obstacles on the flame acceleration of the hydrogen–air mixture and the DDT mechanism. It is found that the growth rate of the area of flame surface significantly increases the flame acceleration and reduces the initiation time. Obstacles should be set on the side walls of the tube under practical working conditions to avoid setting in the center of the area, and an effective way to prevent DDT is proposed. Li et al. [27] conducted LES simulation and experimental study of gasoline-air mixture explosion in the presence of obstacles, using the Zimont premixed combustion model. And compared the simulation results with the experimental results, which proved that the simulation model was good and effective. Qin et al. [28,29] proposed that R-T instability and K-H instability coexist and interact simultaneously when a flame passes through an obstacle to form a twisted flame so that the degree of flame folds and instability increases with the increasing number of obstacles. The proof was made using a fractal dimension calculation [30]. Further, it is found that the R-T instability accompanies the entire flame propagation process and it dominates at each stage of flame acceleration. The K-H instability only significantly affects the acceleration of tip flame propagation. Others have used numerical simulations to analyze parameters that are not well measured or not well changed in experiments. For example, Hao et al. [31] investigated the effect of U-shaped obstacles on the explosion of methane-air premixed gases. It is proposed that the backflow structure of the flame caused by the unburned gas is the result of the coupling of overpressure and inter-plate vortices. Zhou et al. [32,33] studied the effect of the location of the tube pressure relief opening in the hydrogen–air premixed gas explosion and elbow-type tube pressure changes during the explosion.
However, the above studies were all carried out under the premise of uniform concentration at actual accident sites, such as in narrow and long spaces in underground trenches, tunnels, oil/gas pipelines, storage tank ventilation pipes, and other facilities. LPG and other gases are often non-uniformly distributed due to diffusion and gravity after leakage. The deflagration mechanism is also more complex.
Therefore, the explosion under non-uniform gas concentration has received the attention of scholars. In 1965, H. PHILLIPS [34] experimentally studied the propagation structure of flames formed by the combustion of methane and air under inhomogeneous mixing and observed the presence of a triple flame, which is divided into three parts: fuel-rich premixed flame, fuel-lean premixed flame, and diffusion flame [35]. On this basis, Han et al. [36] considered the flame stretching structure of non-uniformly mixed methane-air and developed a computational model. The non-uniform gas concentration not only affects the combustion flame structure, but also influences the gas deflagration flame behavior and overpressure characteristics in a narrow space under obstacle perturbation. Huang et al. [37] considered the effect of flat plate type obstacles with different opening shapes on methane–air explosion characteristics at vertical concentration gradients. The combined effect of obstacle shapes and concentration gradients is found to disrupt the mechanism between the flow of combustible gases and the combustion process as the concentration gradient increases. It is proposed that the effect of obstacles on flame propagation is more significant than concentration gradients. Similarly, Zheng et al. [38] investigated the effect of fence-type obstacles with different blockage ratios on the explosion of inhomogeneous methane–air mixtures. It is found that the homogeneity of the gas mixture made a significant difference in the evolutionary structure of the flame, speed of the flame, and overpressure.
In summary, the flame structure, flame propagation processes, and overpressure characteristics of explosions under non-uniform gas mixtures are of increasing interest to a growing number of scholars. However, the characteristics of the explosion behavior of non-uniformly distributed gas mixtures are still unclear, and the literature in this area is still relatively small, especially the study of explosions under obstacle interference.
Therefore, the purpose of this study is to investigate the effect of non-uniformly distributed LPG–air premixed combustible gas deflagration for the characteristic of gradient arrangement of obstacles of different heights. After the leakage of LPG, the gas can spread to the surrounding area. Due to the confinement of confined spaces, the gas can diffuse in narrow spaces such as pipe corridors. This paper focuses on the effect of a non-uniform concentration field on the explosion in this case. This paper uses a combination of experiments and numerical simulations. First, the effect of obstacles arranged at the same height on the explosion of non-uniformly distributed propane–air was studied experimentally. Afterwards, the flames propagation mechanism and overpressure characteristics of LPG–air premixed gas deflagration under obstacles arranged in increasing and decreasing blockage height were analyzed by model calculation and comparison. The results of this paper can provide a reference for the placement of equipment and facilities in long and narrow spaces such as various pipe galleries. Furthermore, they can make predictions about the impact of the shape of some objects on the explosion and provide a theoretical basis for the prevention and management of gas explosions.

2. Experimental Setup

2.1. Experimental Device and Duct Dimensions

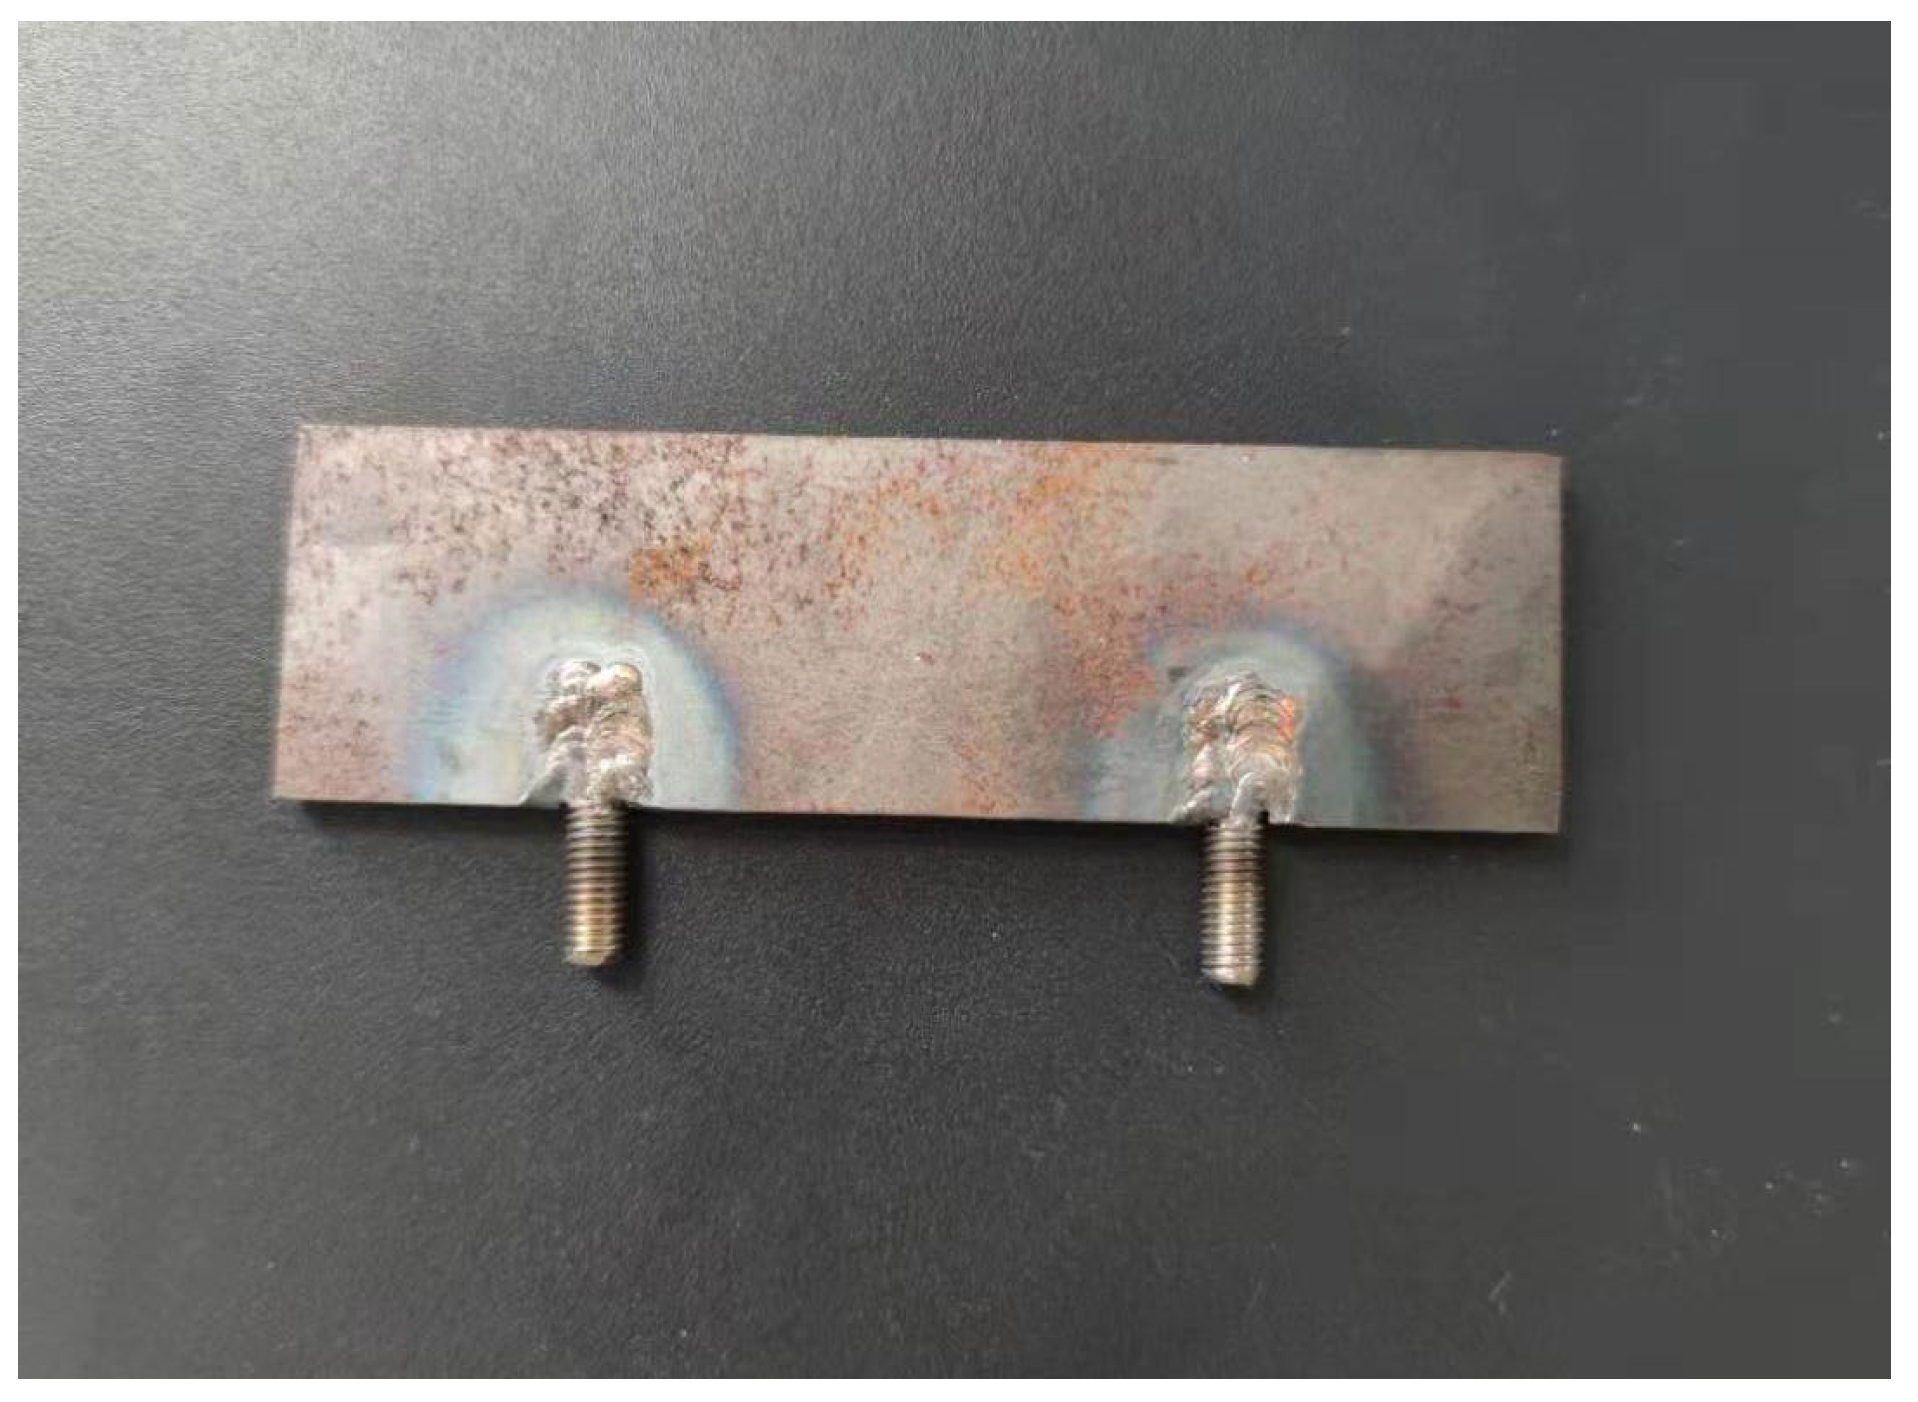
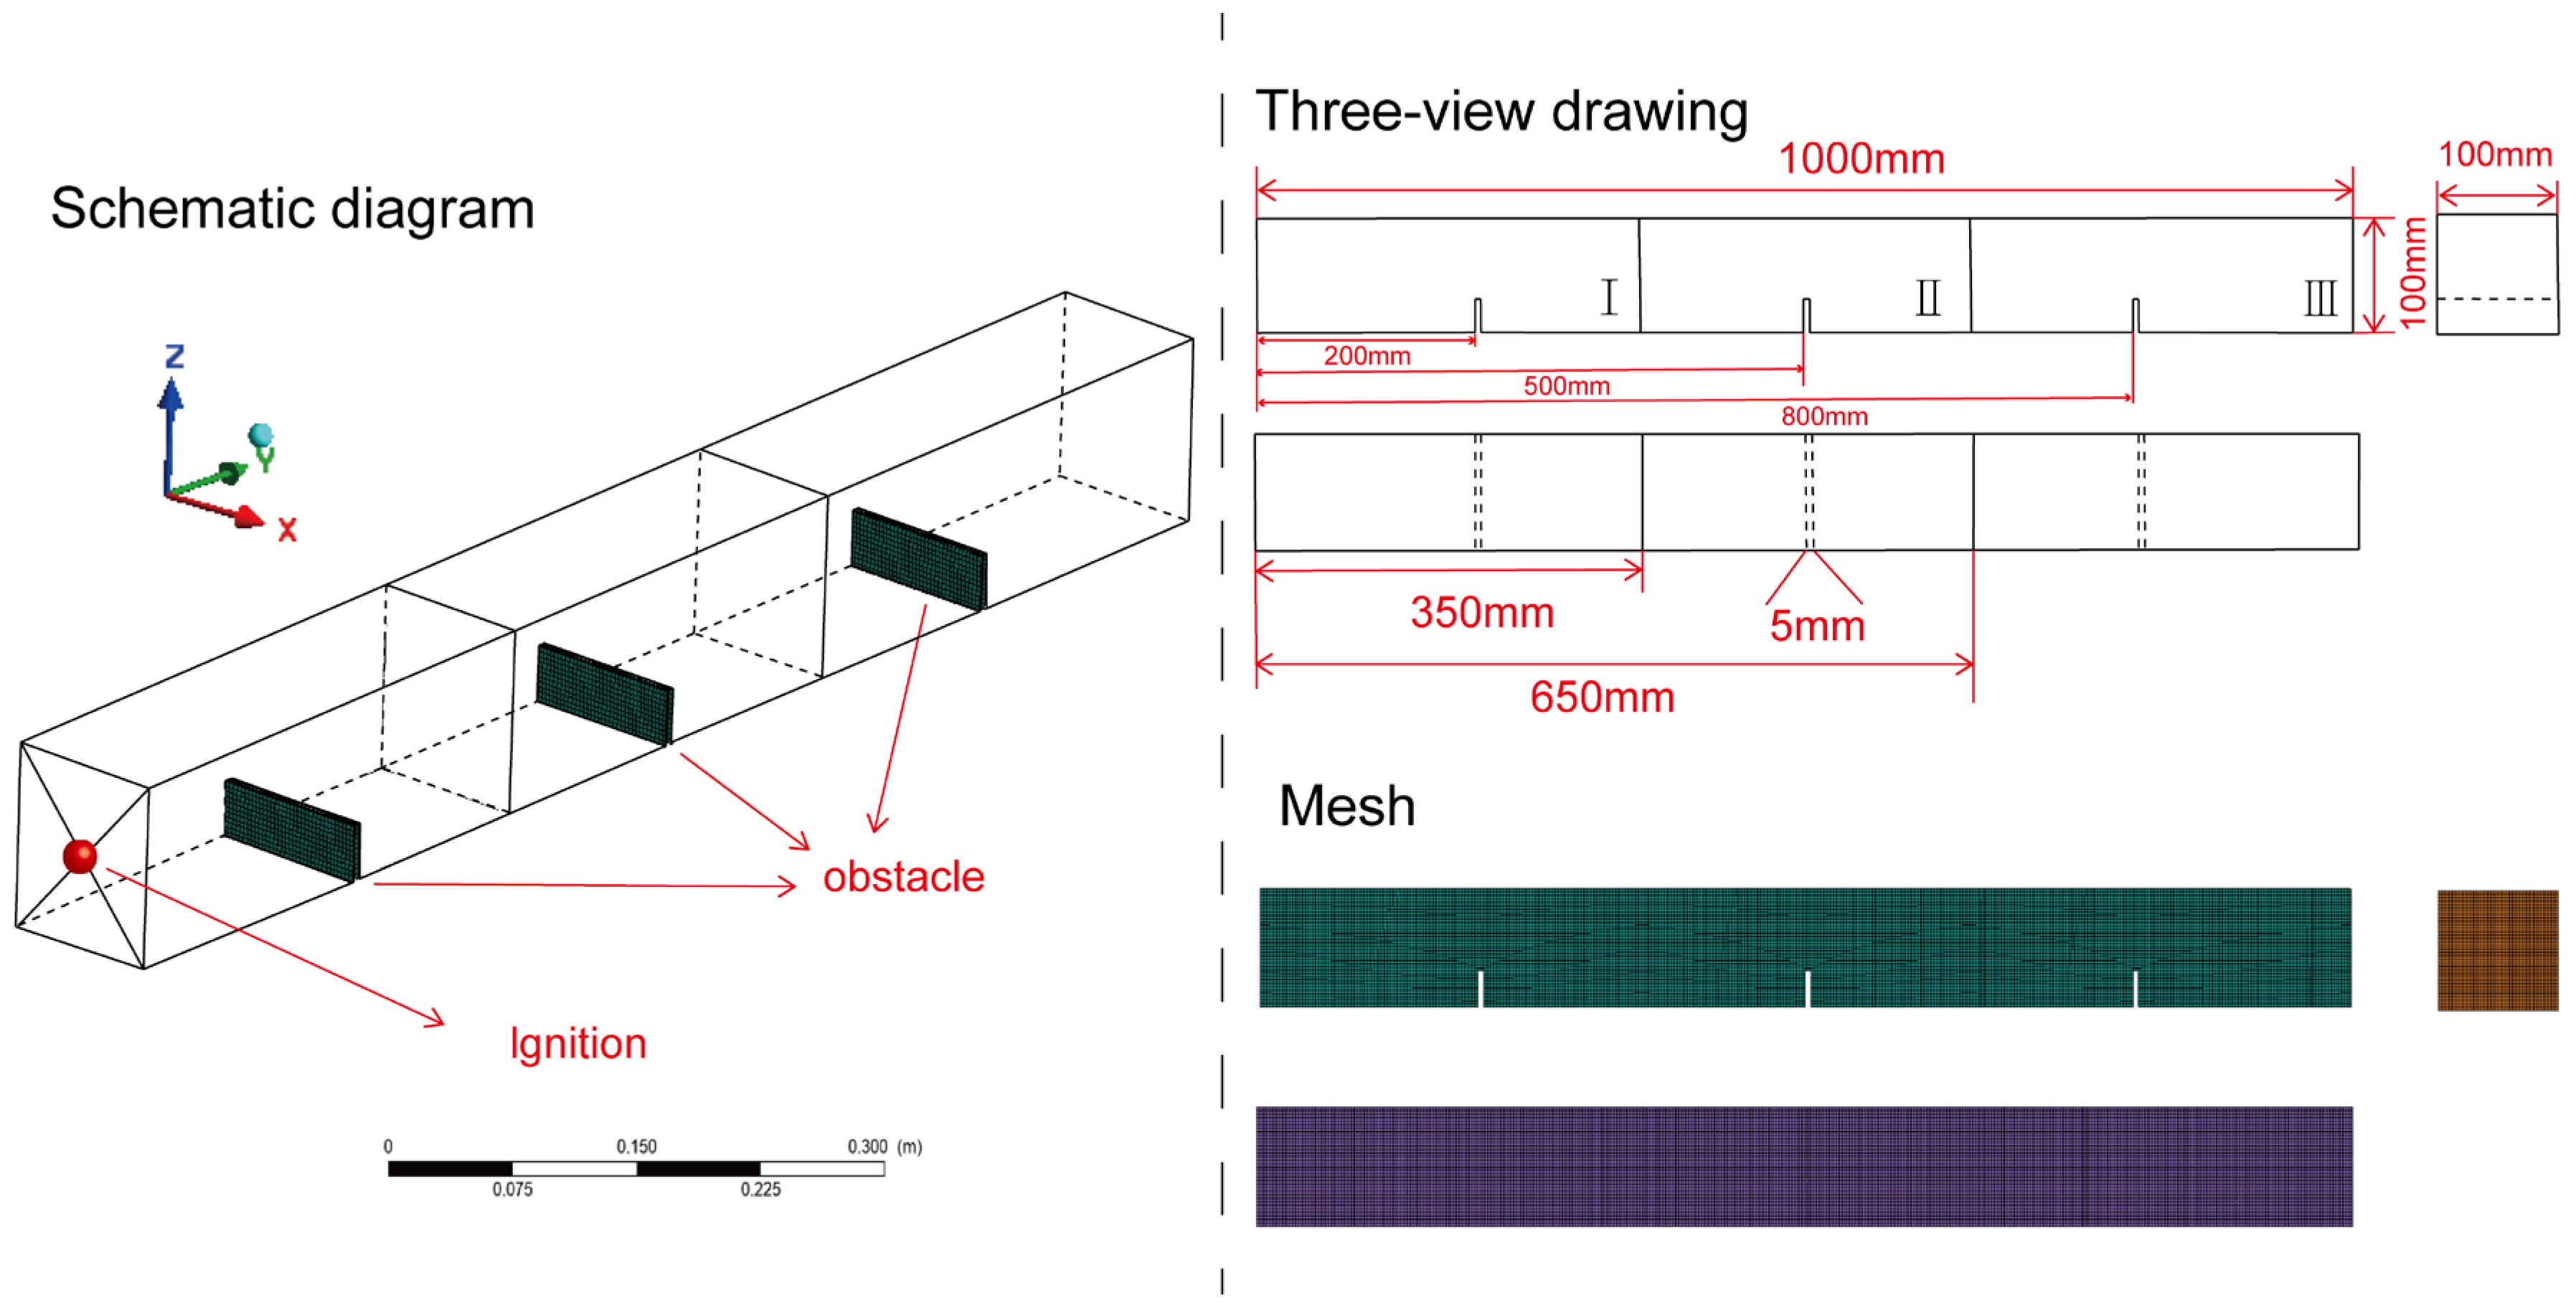
Figure 1 shows the schematic diagram of the experiment. The whole experiment consisted of a duct body, a high-speed camera, a CY200 digital pressure sensor, a dynamic data acquisition system, a KTGD-B type adjustable igniter, LPG cylinders with a propane ratio of no less than 95%, an LZB-6WBF flowmeter, and valves. The main body of the duct was made of 5 mm thick steel plate. In order to obtain a clear image of the flame, a transparent plexiglass with a thickness of 20 mm was installed on the front side of the duct. The length of the duct was 1000 mm and the cross section is a 100 mm × 100 mm square. The left side of the duct was sealed with a steel plate with an ignition end at the center of the plate. The steel plate was reserved with openings for other experimental apparatus. The right end of the duct as sealed with a PVC film to prevent gas spillage. The obstacles were 100 mm × 30 mm × 5 mm flat type obstacles, as shown in Figure 2, placed at 200 mm, 500 mm, and 800 mm from the ignition point, respectively. The pressure sensor was placed 30 mm to the right of the ignition point. Isolation devices made of PVC film were placed at 350 mm and 650 mm from the ignition point. In order to achieve a non-uniform distribution of gas in the duct, the whole duct was divided into three regions, which were region I, region II, and region III. The high-speed camera was placed on the centerline of the duct, 2 m away from the duct.

2.2. Experimental Methods

After the duct, obstacles, data acquisition equipment, and other equipment were installed, the high-speed camera, pressure sensor, and data acquisition system were turned on and left in standby mode. Then, the LPG cylinder with a propane percentage of no less than 95% and Valve_4 were opened. After waiting for the gas to fill the hose, Valve_1 was turned on. The flow meter was then observed, and the flow meter was 0.3 L/min. The flow was controlled through the flow meter, and Valve_1 was closed after 41 s of filling in Area I. Afterwards, area II was inflated for 29 s and area III was inflated for 28 s by the same method. The equivalent ratios of the three regions were 1.5, 1.2, and 1, respectively. After the end of the filling, the igniter and high-speed camera synchronously were turned on, controlled by the computer, and the ignition energy was 20 J. To ensure the validity of the experimental data, the explosion experiment repeated at least three groups.

3. Numerical Model

In this paper, numerical simulations are performed using the LES model and premixed combustion model, which are mostly described in the relevant literature [39,40] and the combustion model can be obtained in the Ref. [27]. Filtered by Favre, only the large-scale turbulence is solved and calculated by coupling mass conservation, momentum conservation, energy conservation, and species conservation equations to the constitutive and state equations to obtain the LES control equations, which are not repeated in this paper. The component transport equation is reconstructed to obtain the transport equation for the reaction process c with the mixture unburned c = 0 and the mixture burned c = 1 .
c = k α k ( Y k Y k u ) k α k ( Y k e q Y k u ) = Y c Y c e q ,
where Y k denotes the k t h species mass fraction, superscript u denotes the unburnt reactant, while e q implies chemical equilibrium. α k are constants that are typically zero for reactants and unity for a few product species. In addition, in order to obtain more accurate calculation results, the front face of the flame needs to be thickened in premixed combustion. Therefore, in this paper, the Zimont combustion model [41] is used to thicken the flame, and its turbulent flame calculation equation is:
U t = A ( u ) 3 4 U l 1 2 α 1 4 l t 1 4 ,
where A is the model constant, and is equal to 0.5, u is mean square velocity, U l is the laminar flame velocity, α is the molar heat transfer coefficient of the unburned mixture, l t is the turbulence length scale.

3.1. Mesh Generation

Figure 3 shows the mesh model and dimensional details obtained by ANSYS ICEM software. Based on the mesh-independence, the calculated area is divided by a hexahedral structure mesh with a global element scale factor is 3 mm. The number of grids after local encryption is 427,245.

3.2. Boundary Conditions and Initial Conditions

The wall of the model shown in Figure 3 is set to no slip. Because the explosion time is very short, the effect on the temperature change of the tube wall is negligible, so the wall is set to adiabatic at the same time. At the same time, the PVC film has less influence on the pressure inside the tube, so a simplified treatment is done. In order to avoid pressure decay due to the reflection of pressure waves, the outlet is set to no reflection. The initial temperature is set to 300 k, and other parameters such as initial pressure, initial velocity, and reaction process variables are set to zero. A spherical ignition region with a radius of 5 mm was captured at the ignition end of the model [42], and the reaction process variable c in this region was assigned a value of 1 to simulate the ignition function.

3.3. Numerical Details

The LPG for the deflagration experiment is a C3-based hydrocarbon mixture, so propane is used instead of LPG in the simulation [31]. The simulated propane gas is considered to be the ideal gas. As in Figure 3, the tube is divided into three regions I, II, and III, so the whole fluid domain of the tube is divided into three parts in the simulation. The gas concentrations in the three regions are different, which are 4.8%, 4.03%, and 3.84%. The specific heat is fitted by piecewise polynomial and the viscosity is calculated by Sutherland’s law. The formula for the laminar flame velocity at different concentrations of propane can be obtained in the Ref. [43]. Table 1 shows the specific parameter settings, as the calculation is performed by ANSYS Fluent 2021 R2 platform. The time step is set to 1 × 10⁻⁶ s in the solution to ensure the convergence of the calculation results, and 40 iterations are required within each time step. All the equations are less than 2 × 10⁻⁵ except for the energy equation and the progress variable equation whose convergence criteria are less than 1 × 10⁻⁶ and 1 × 10⁻³, respectively.

4. Results and Discussion

4.1. Numerical Verification

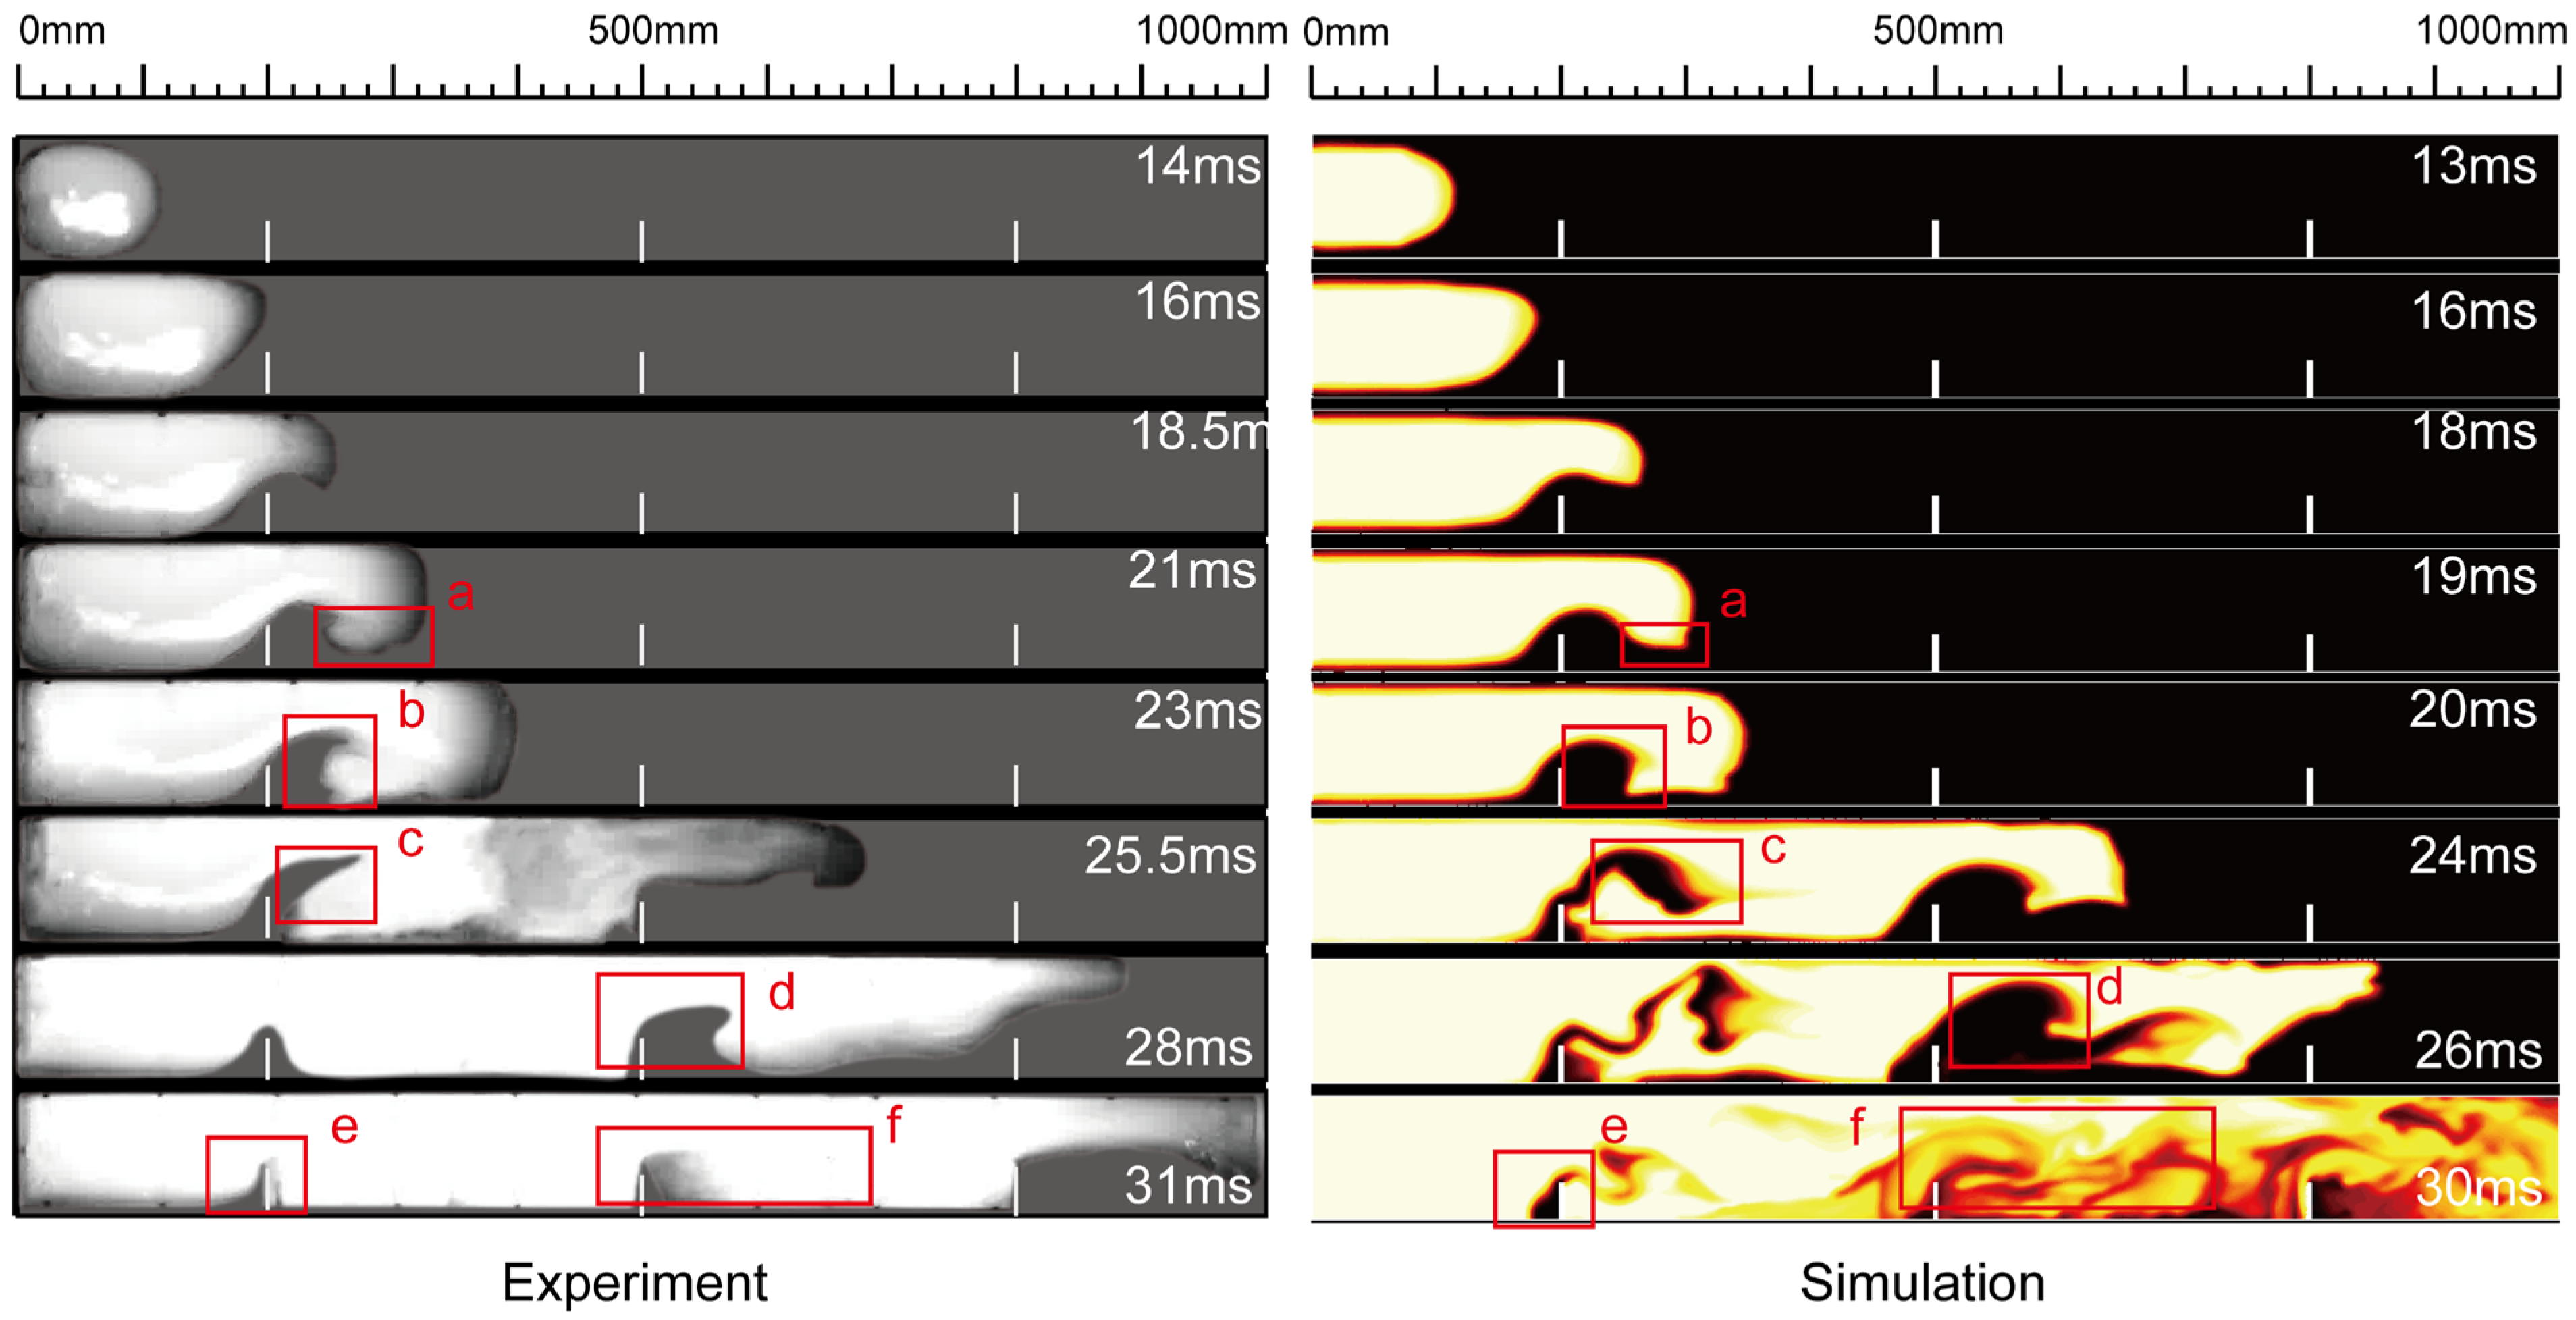
Figure 4 shows the flame comparison of the experimental and simulated. It can be seen that the simulated flame propagation process and structure have a high similarity with the experiment. The flame propagation process has similar characteristics to Figure 3 in the Ref. [25] and Figure 10a in the Ref. [23], and the flame is slightly distorted by gravity [23]. After the gas is ignited, the flame first propagates forward as a sphere and transitions to a finger-shaped flame when it encounters an obstacle. The flame can start to deform after passing through the obstacle. The above flame characteristics at the beginning of combustion are consistent with those in the Ref. [25], and both also show the two reflux phenomena after the flame has passed through the obstacle. The same flame reflow structure as the experiment also appears at the 20 ms in the simulation, as shown in the red rectangular box b in Figure 4. Similarly, flame cavities similar to those in the actual experiment appear at both 24 ms and 26 ms, as shown in red rectangular box c and red rectangular box d in Figure 4. Due to the relatively short explosion time and the limitation of the hardware used in the experiment, some flame structure details cannot be captured, and the numerical simulation can better solve this problem. For example, at the 26 ms and the 30 ms in Figure 4, the simulation results both show the flame reflow structure and broken flame fragments better.
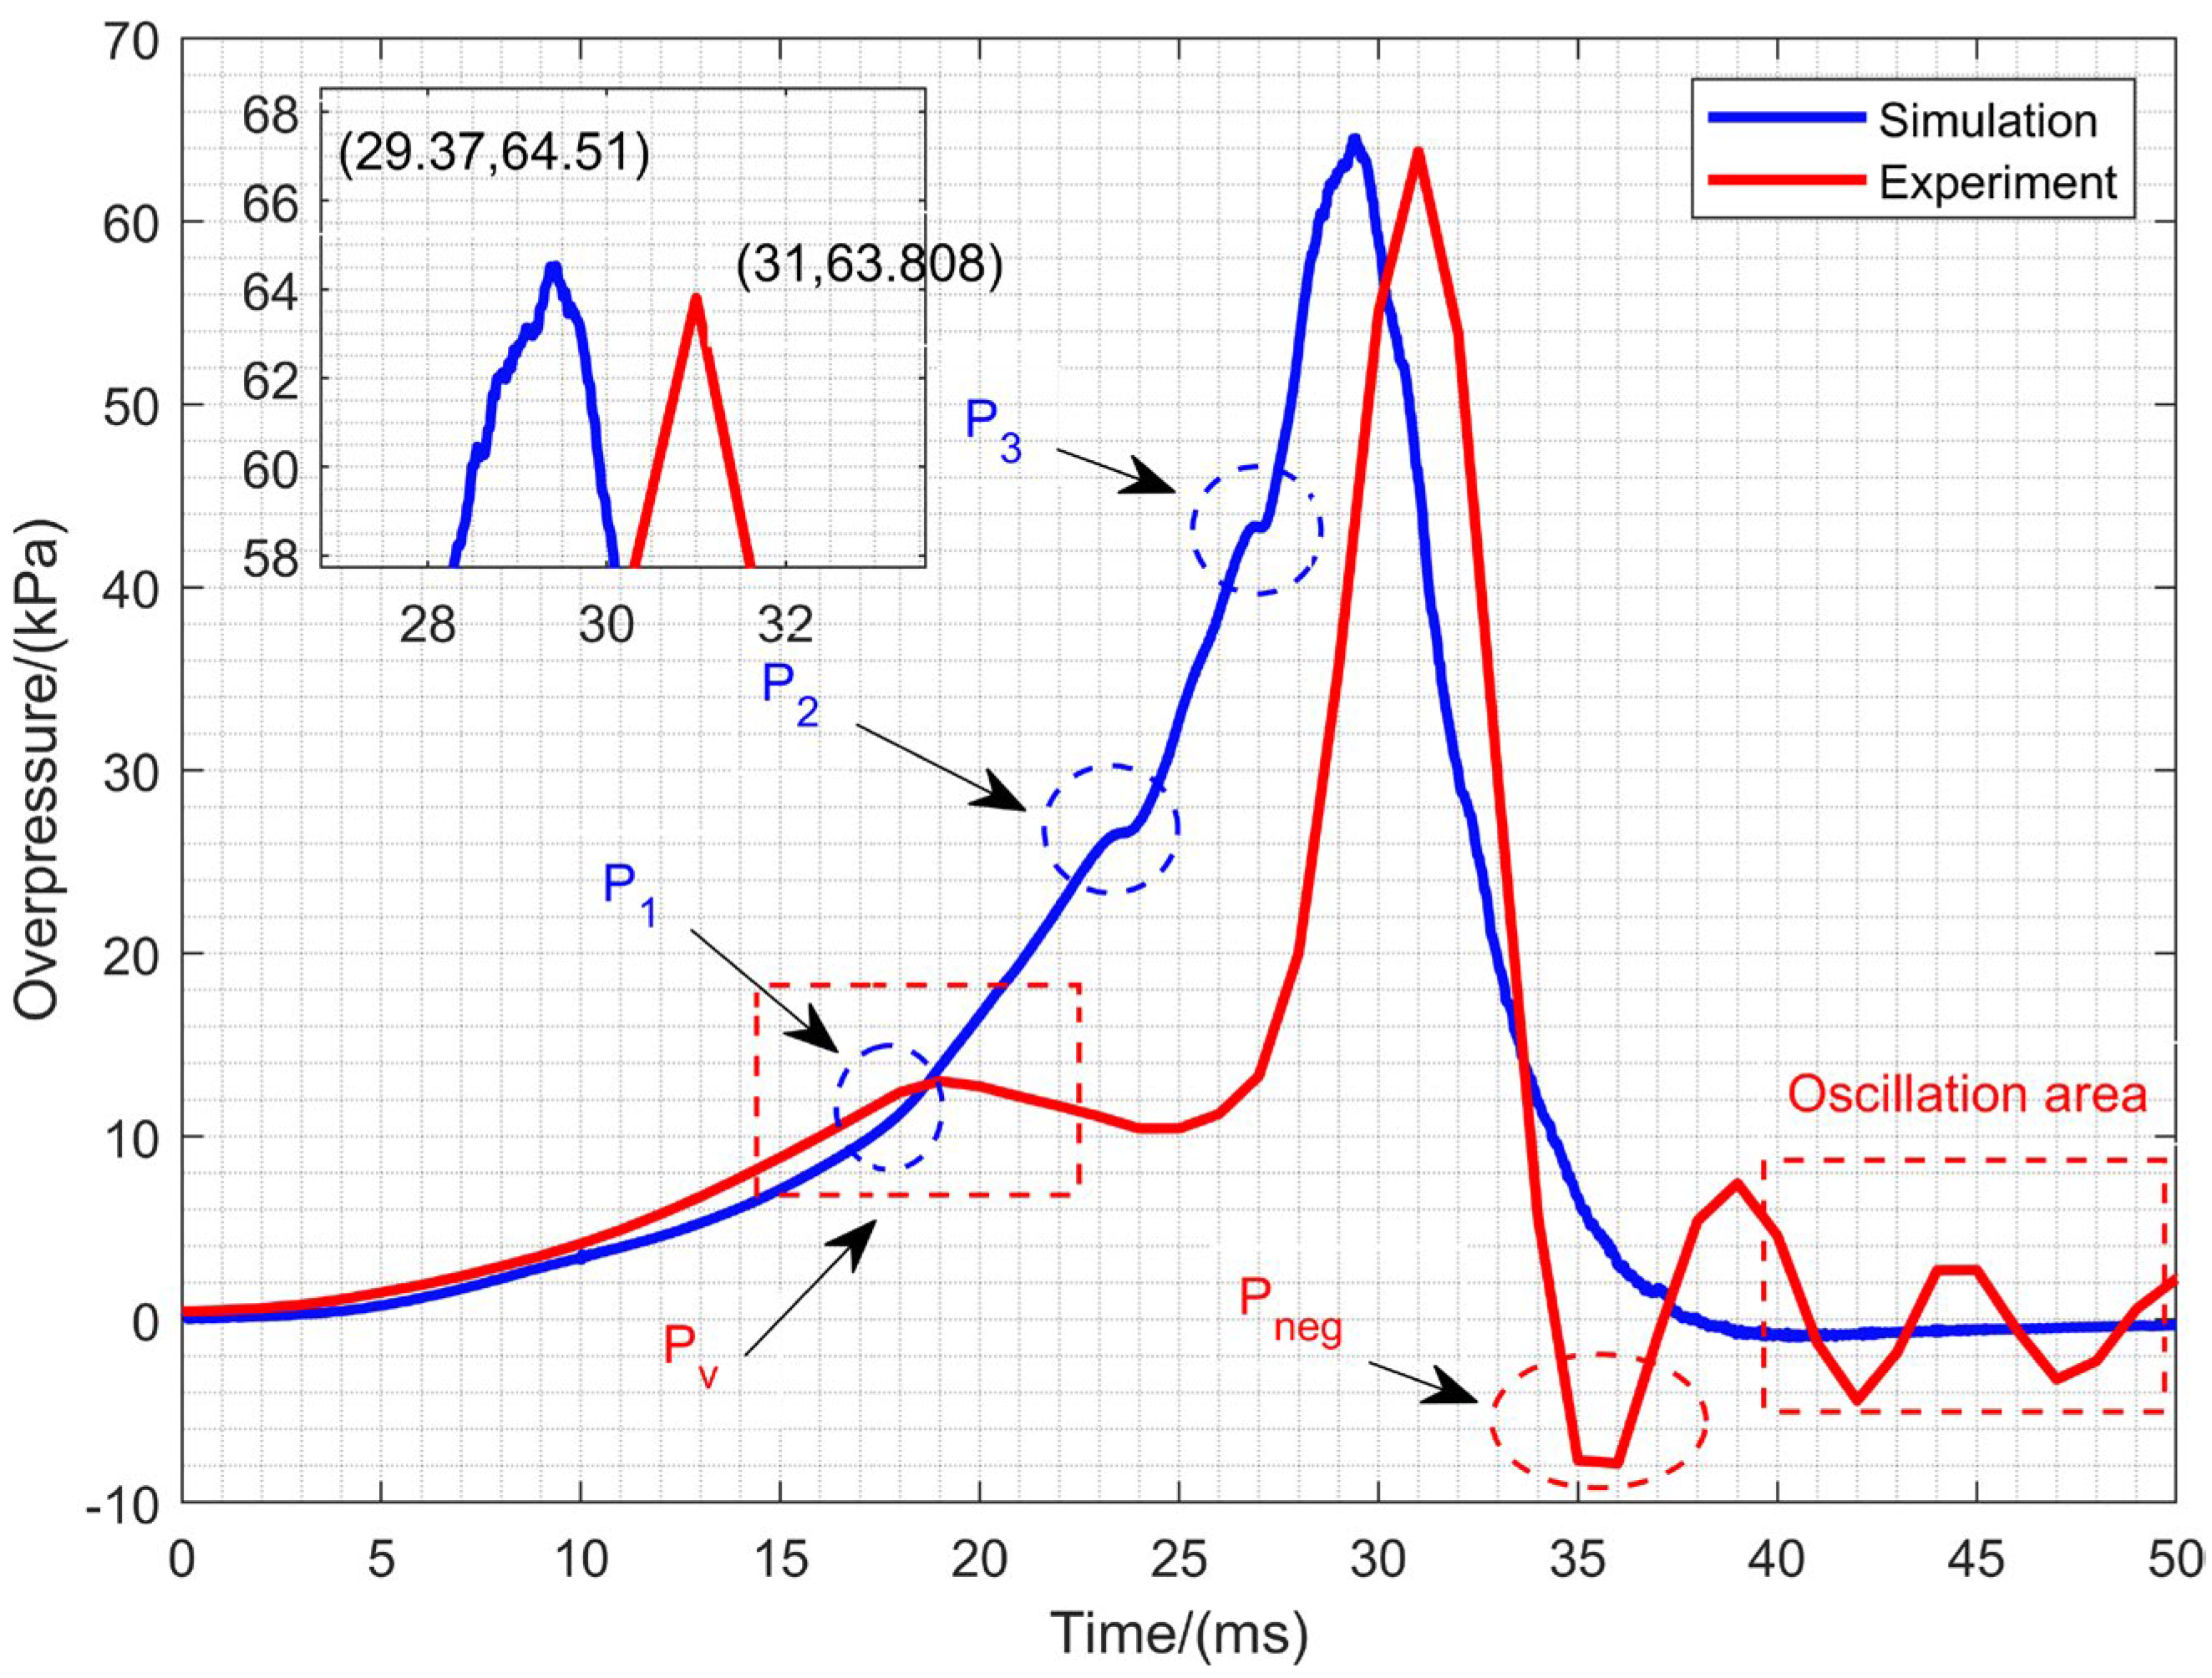
Figure 5 shows the pressure comparison between the experiment and the simulation. It can be seen that on the pressure curve of the experiment, the rupture pressure Pv caused by the rupture of the PVC film when the flame rushes out of the pipeline appears [20]. The pressure then peaks at 63 kPa at 31 ms and starts to drop, with a negative pressure peak of Pneg at 35 ms. The negative pressure Pneg is generated because the gas inside the tube is significantly reduced after the flame is flushed out of the tube. The outside air is replenished, and this process is repeated so that the pressure oscillation region at the last 36 ms-50 ms of the experiment occurs. In comparison with the simulated curve, the simulated maximum overpressure peak is very close to the experimentally obtained pressure peak. In terms of time, the simulated overpressure peak appears slightly earlier than the experimental one, because the heat dissipation is neglected in the simulation after the tube wall is set to be adiabatic. Additionally, for this reason, the pressure drop process is smoother than the experimentally obtained waveform. In addition, the simulated waveform shows three small peaks P1, P2, and P3 during the rise, which are generated when the pressure wave contacts obstacles during propagation [31]. While this detail is not captured in the experiment. It is worth mentioning that the simulated pressure profile does not show the first wave peak of the experiment and the oscillation after the pressure drop, which are within the acceptable error range. It is because the pressure fluctuations generated during the PVC film rupture and the outlet are set to be reflection free in the simulation.
In summary, after the comparison with the experimental flame and pressure, it is found that the model has good reproducibility. So, it can be considered that the model proposed in this paper is good and effective. Therefore, on the basis of this model, the propagation mechanism and overpressure study of the explosion flame under the obstacles with increasing and decreasing blockage height arrangement is carried out. Figure 6 shows the four working conditions to be studied, in order to provide a reference for comparison, the first working condition is the obstacle-free working condition.

4.2. Flame Propagation Process

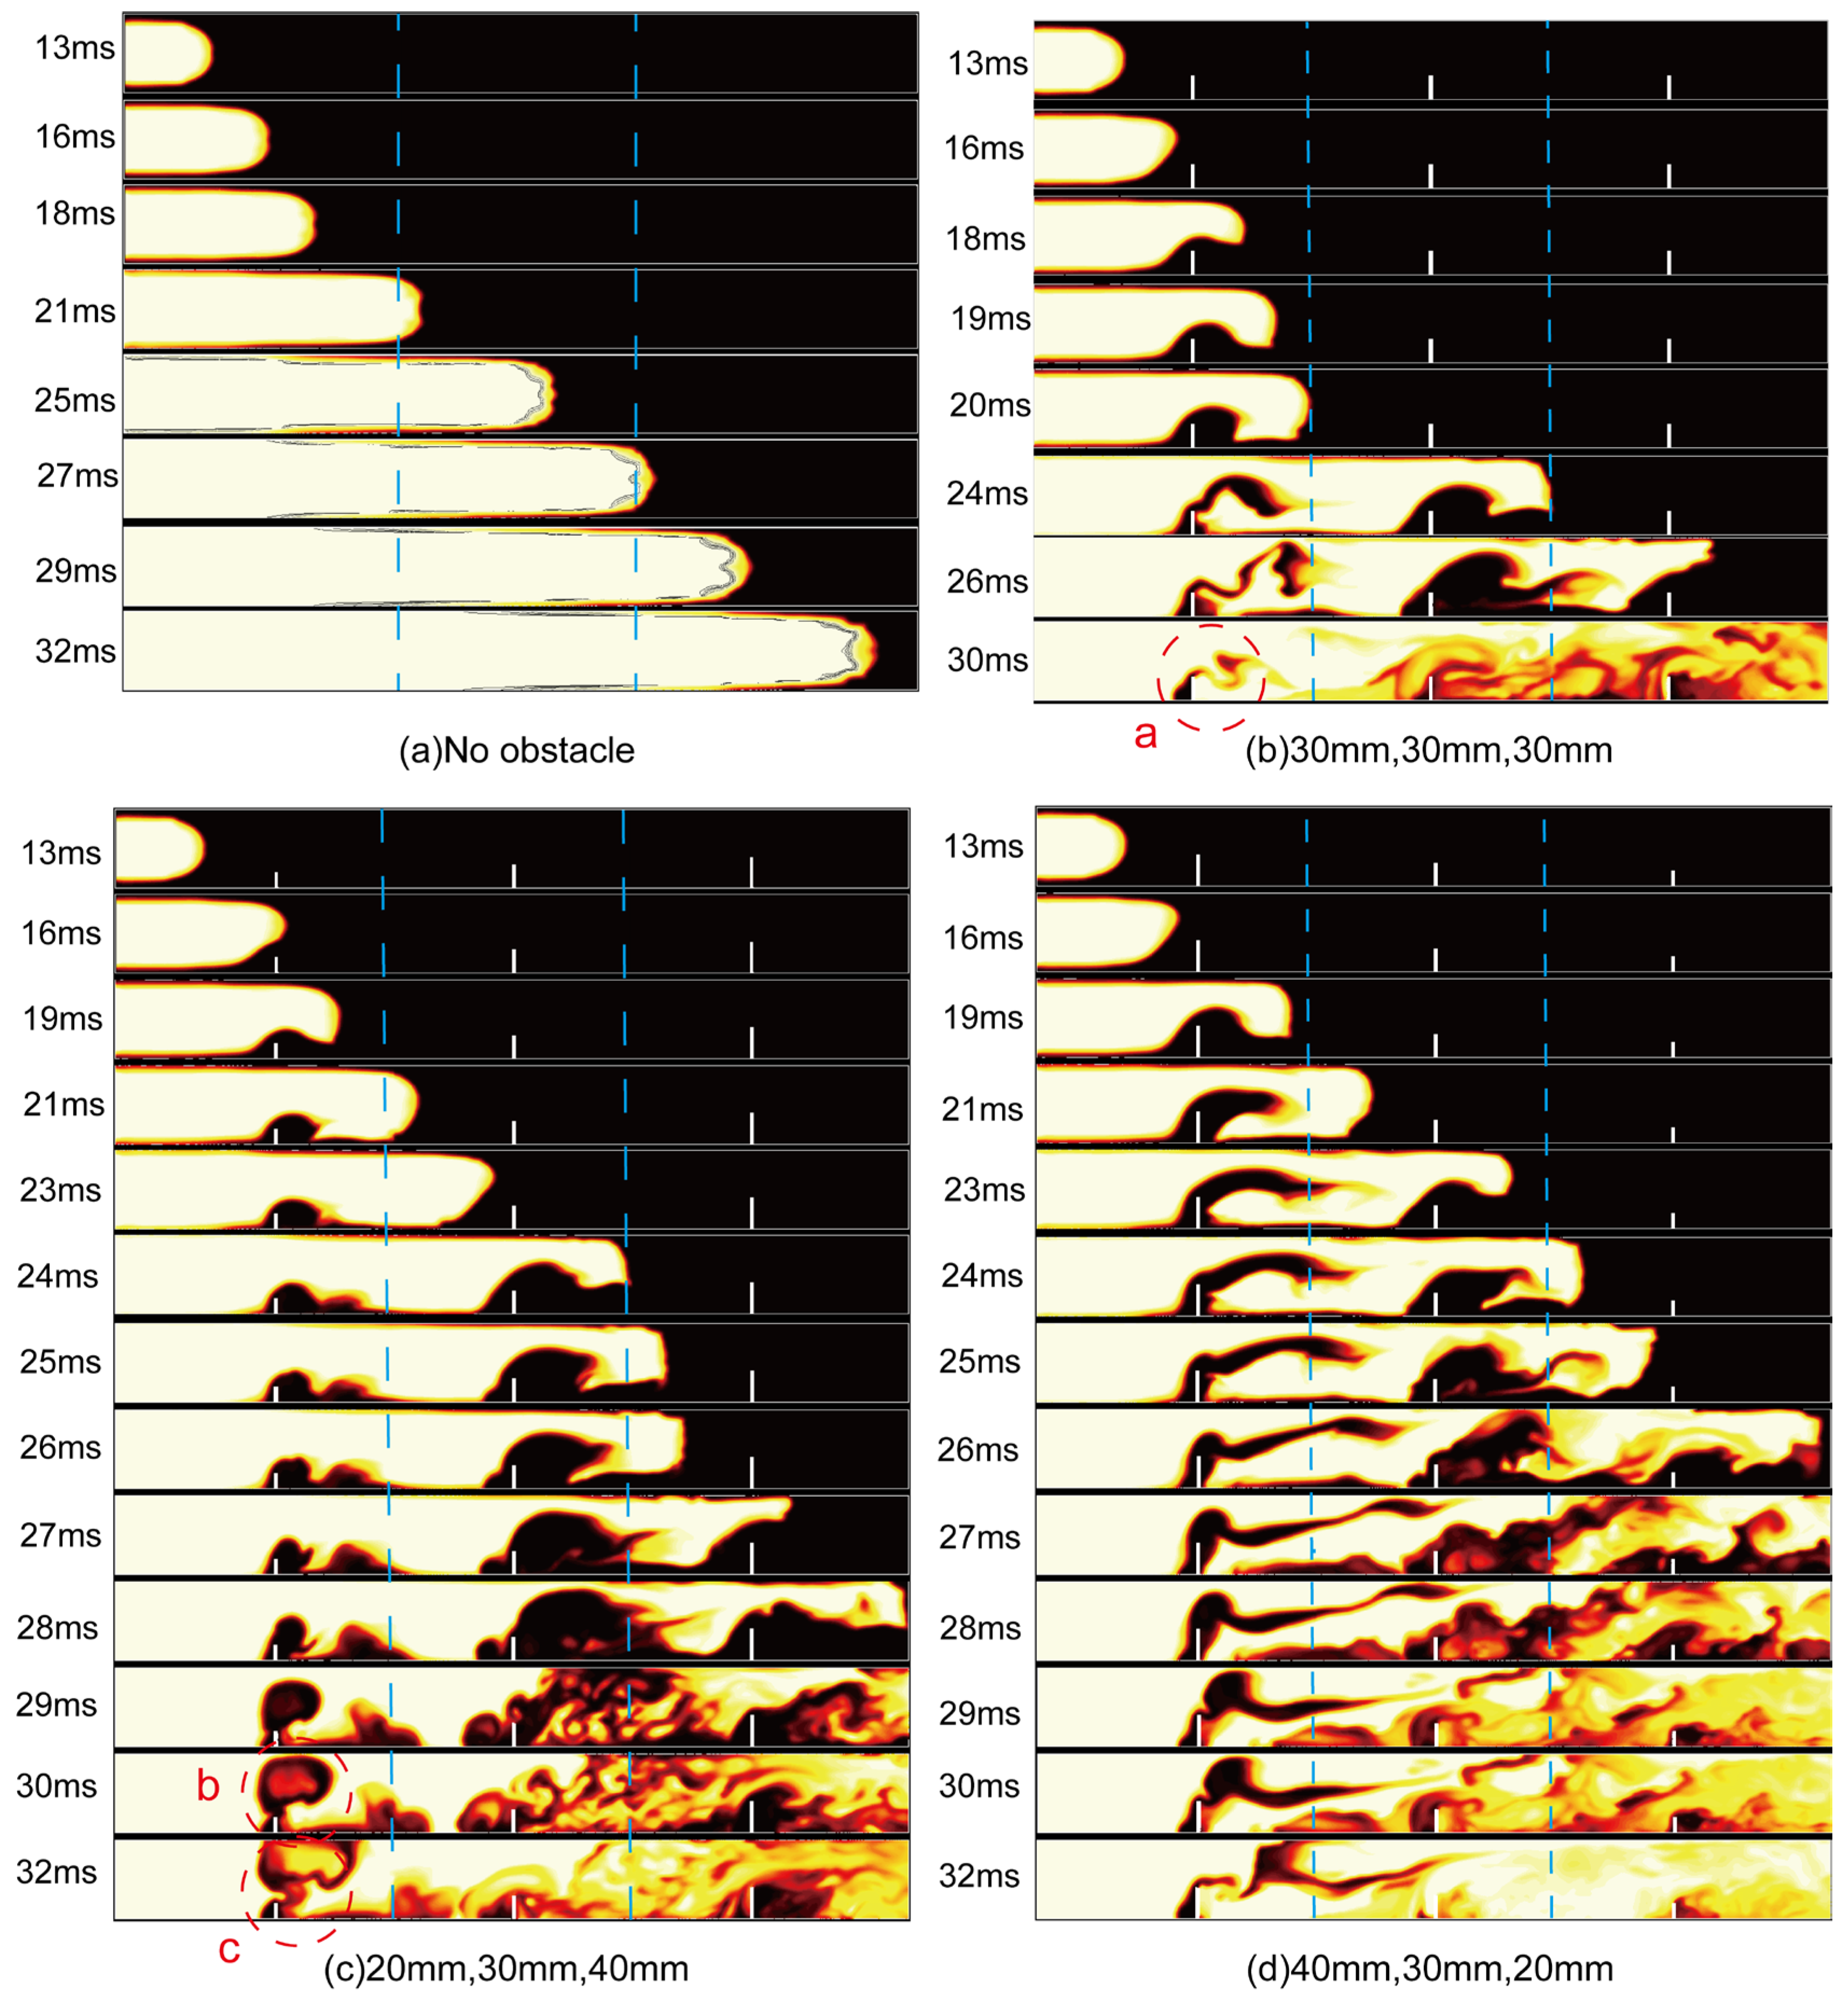
Figure 7 shows the simulated flames for the four conditions. It can be seen that the initial flames in all four conditions have not yet touched the tube walls and propagate forward as spherical flames. The working condition in Figure 7a is without obstacles, and the flame front surface shows a slight deformation at the 16 ms, when the flame at the tube wall gradually accelerates and the thickness of the flame front surface gradually increases. After the flame enters into region II, the flame front surface tends to flatten at the 21 ms [44]. At the 25 ms, the flame starts to appear as a reflow structure and shows the prototype of a tulip flame. The flame face can be seen more clearly at the 32 ms from bending toward the unburned region to bending in the opposite direction of the flame propagation. However, due to the limitation of the length of the experimental tube, only smaller tulip flames could be observed.
In Figure 7b–d conditions, when the flame reaches the first obstacle, not only the area of flame front surface is stretched due to the effect of turbulence, but also the overall increase in the reaction intensity of deflagration, which leads to flame acceleration. Also influenced by the height of the obstacle, the flame gradually begins to be stretched vertically to varying degrees [19]. When the flame passes through the first obstacle, the downstream direction of the obstacle all show different degrees of reflux structure.
Compared to Figure 7a for no obstacles, the obstacles in Figure 7b are of the same height. Since the flame is less affected by the height of the obstacles, a stable reflux structure appears in the downstream direction of the first obstacle. This reflux flame structure is squeezed by pressure and gradually squeezed into the incoming flame on the left side. This eventually leads to a special result of flame fusion. After that, in the red marked circle a in Figure 7b, the flames merge with each other so that the reflux structure inside the tube disappears completely. In the 24 ms, the vertical stretch height when passing the second obstacle is almost the same as that when passing the first obstacle.
Figure 7b is different from Figure 7c. At the 21 ms in Figure 7c, due to the low height of the 20 mm obstacle, the reflux flame forms a “straw hat” flame cavity here. At the same time, influenced by the higher height of obstacles in the flame propagation direction, not only does the diameter of the straw hat cavity gradually expands but also its position moves gradually upward. Finally, an elliptical area with a long axis of approximately 10 mm and a short axis of approximately 6 mm is formed at the red marker circle b in Figure 7c. The oval area is filled with flame at the red marked circle c in Figure 7c. At 24 ms, the flame is vertically stretched by the sudden increase of the obstacle height, and the stretched height is also the highest among the four working conditions. At 28 ms, the flame is even squeezed to the top plate of the tube. Obvious flame vortex is also formed after the flame passes through the third obstacle, which is because the height of the obstacle makes the passing flame thinner and makes the backflow structure of the flame obvious.
In Figure 7d, after the flame passes through the first obstacle, the flame is accelerated again due to the reduction in height of the second obstacle, which gives the flame a larger, and more extensive area of propagation. At this time, the backflow structure of the flame has not stabilized, and the front face has already rushed to the second obstacle. This causes the flame cavity formed by the reflow structure to be elongated, creating a narrow, “ribbon-shaped” void that gradually grows longer over time.
As the height of the obstacle in the direction of flame propagation gradually decreases, the “ribbon-shaped” area formed through the second obstacle becomes extremely unstable. Thereafter, a “ribbon-shaped” area with an increased area is formed at 27 ms, which disappears after 2 ms. At 27 ms, the flame forms a clockwise vortex structure downstream of the third obstacle. However, this vortex is significantly thicker than the flame vortex at the same position at 29 ms in Figure 7c. This is because of the influence of the height of the third obstacle. The lower height makes the passing flame thicker, so the flame vortex formed is also thicker.

4.3. Coupling Relationship between Overpressure and Propagating Flame

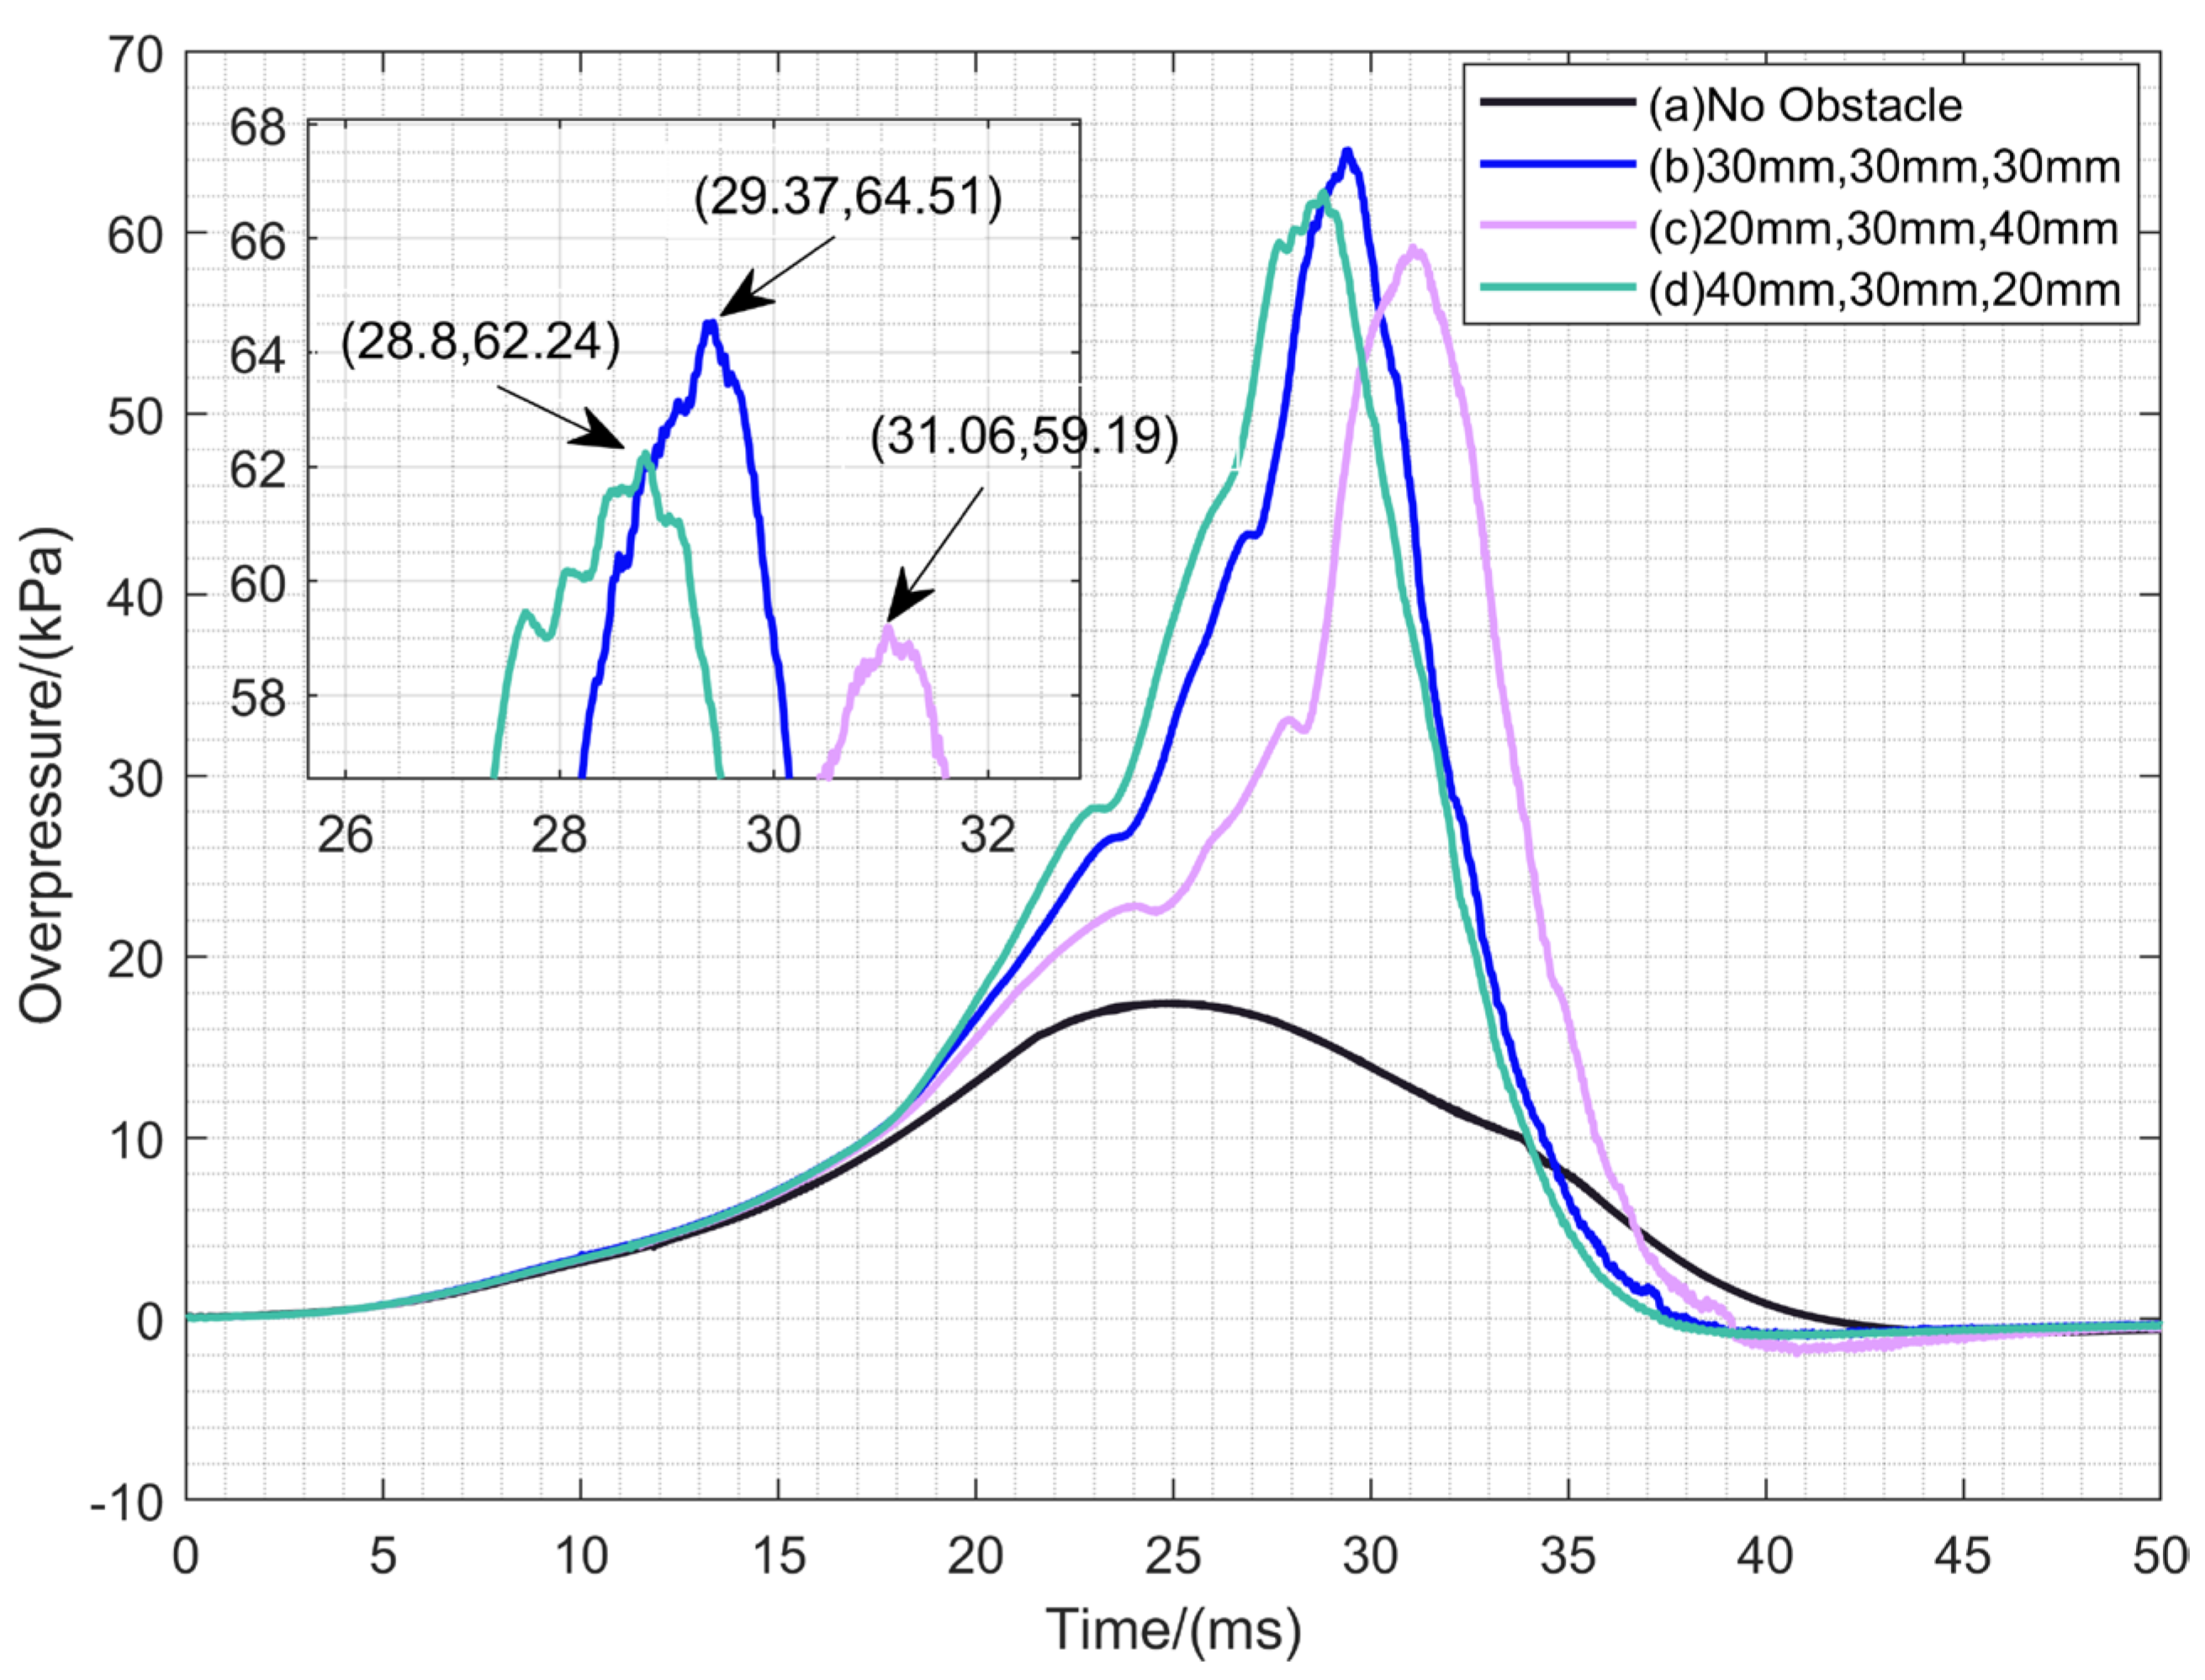
Figure 8 shows the comparison of the overpressure under four different working conditions. It can be seen that the overpressure peak is the largest in working condition (b), which is arranged by 30 mm, 30 mm, 30 mm. The second peak is in working condition (d), which is arranged by 40 mm, 30 mm, 20 mm. The third peak is in working condition (c), which is arranged by 20 mm, 30 mm, 40 mm. Furthermore, the smallest peak is in working condition (a), which is the case without obstacles. Figure 8 demonstrates that the explosion overpressure is maximum at the same obstacle height. It is probably because a straight tube parallel to the flame propagation direction is more conducive to producing a strong surge [26]. The weakening of the pressure after passing through each obstacle in the case of gradient arrangement is avoided.
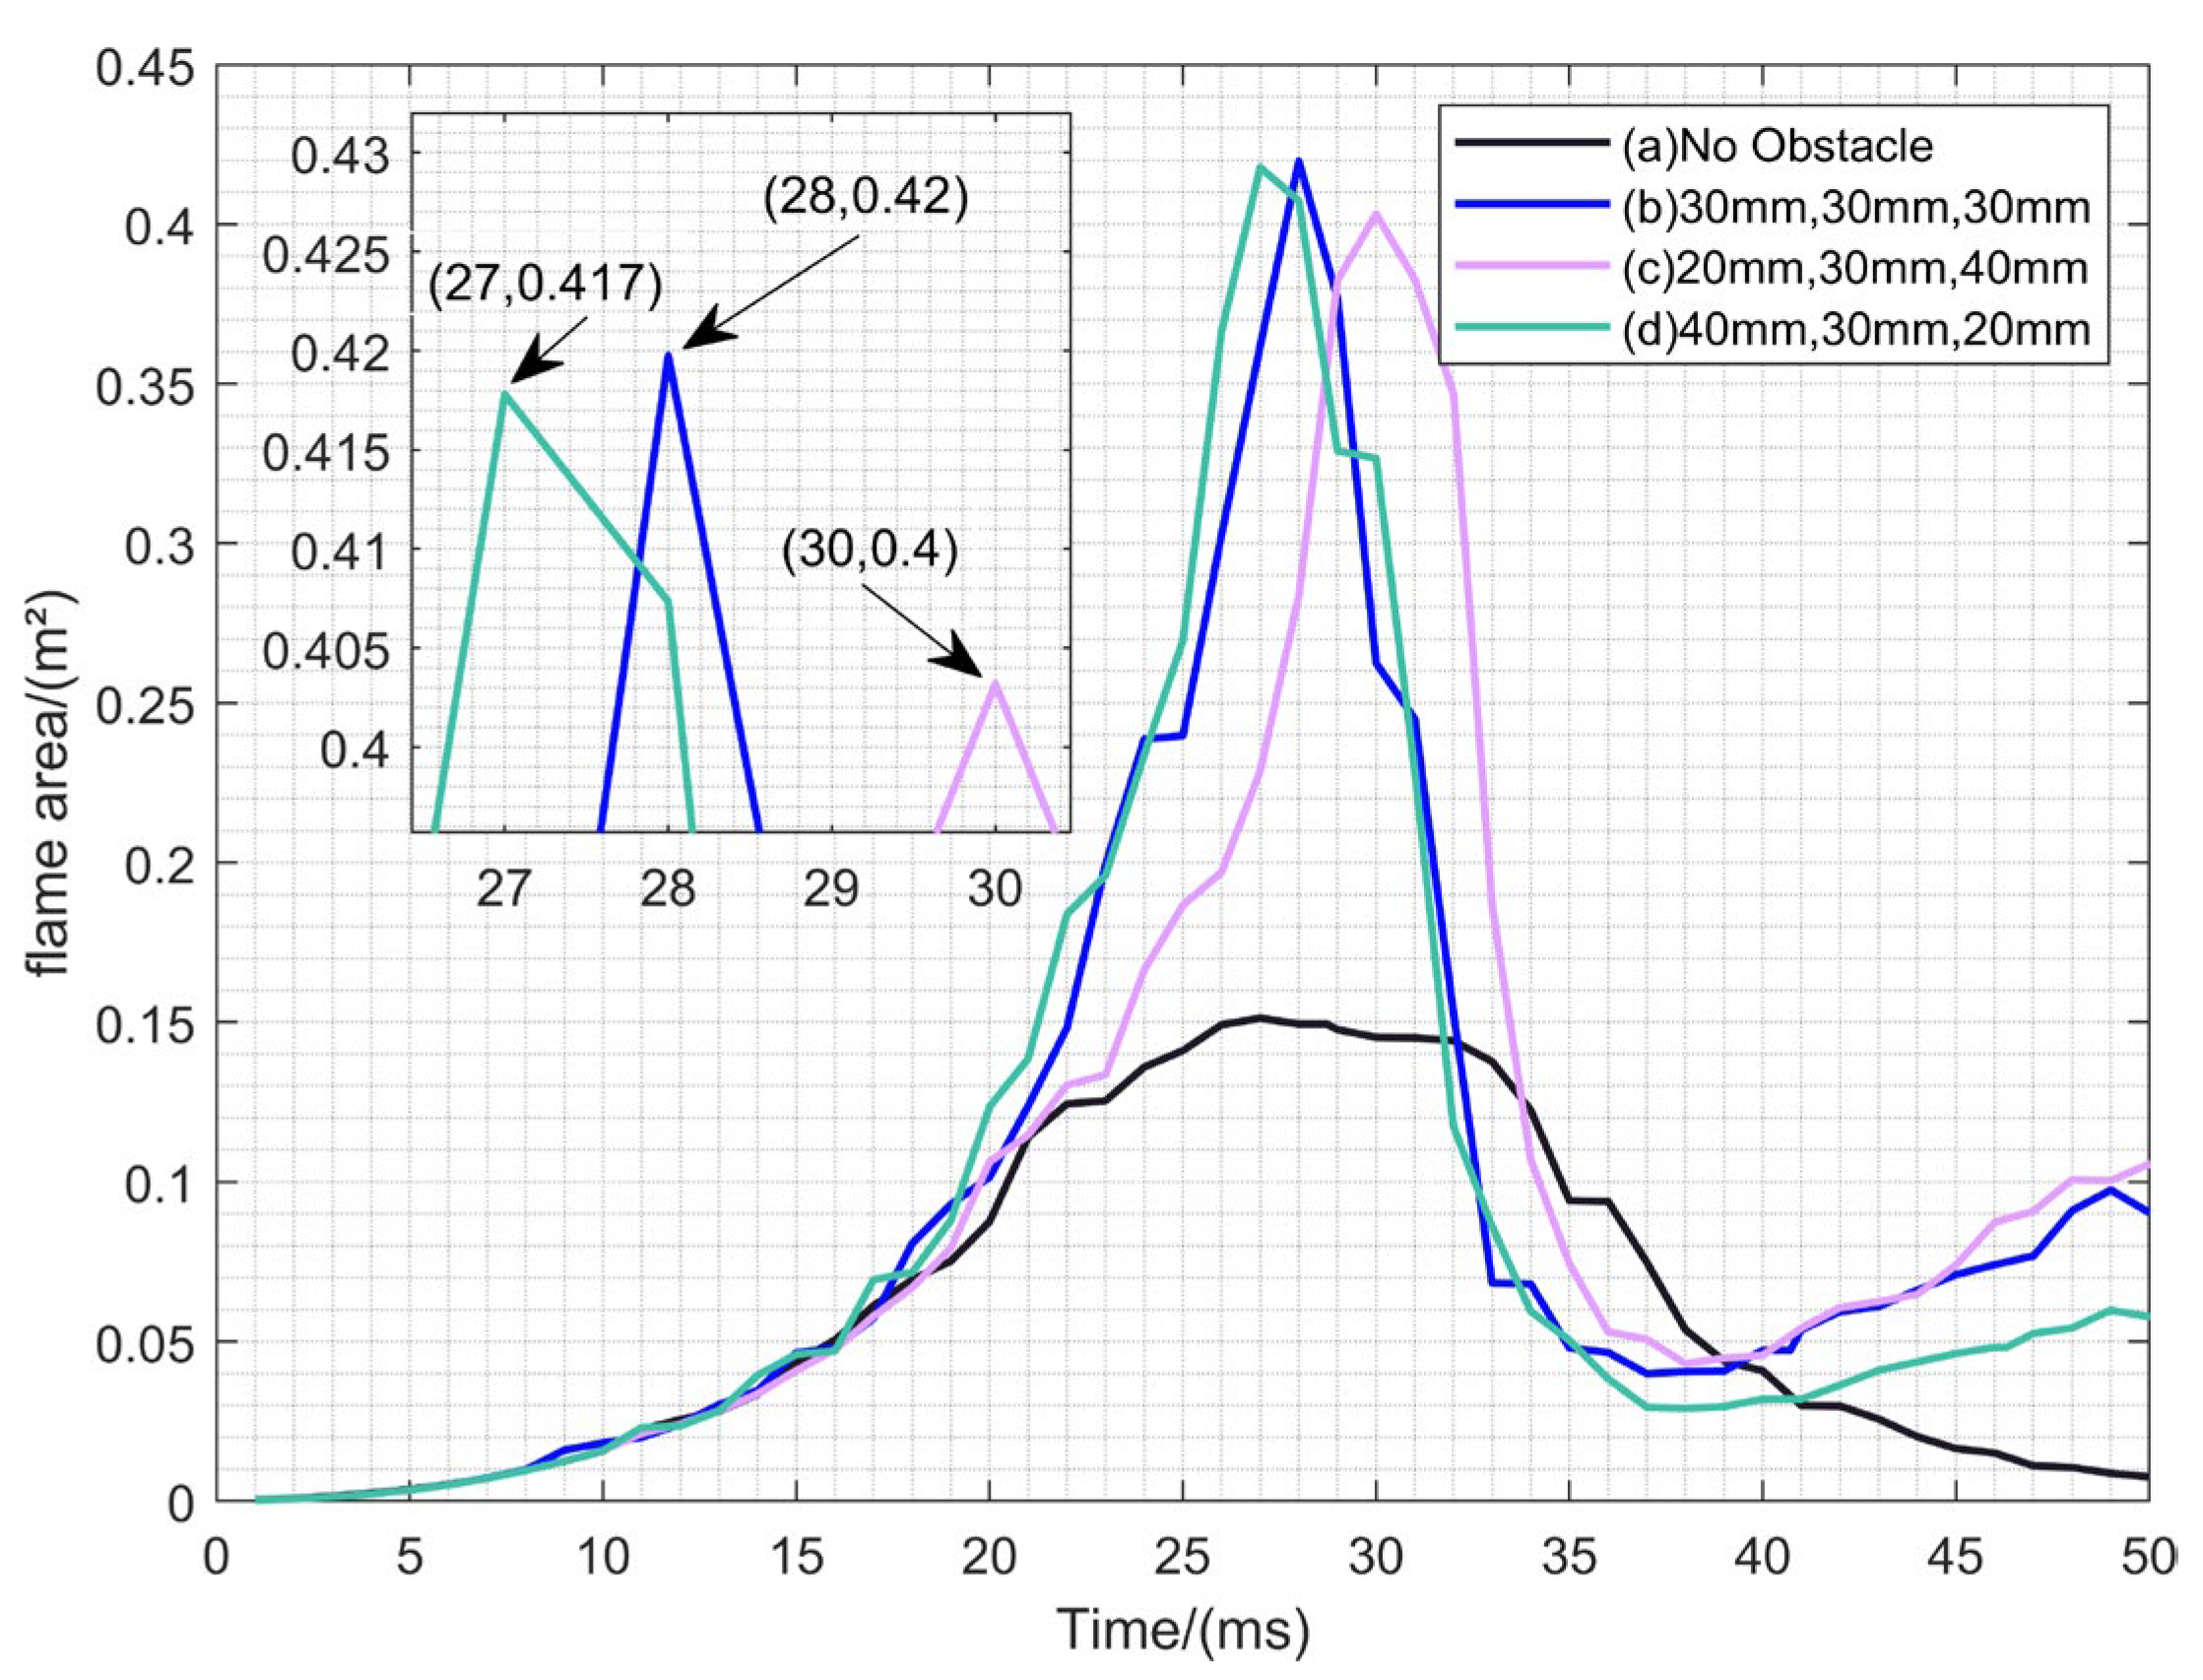
Figure 9 shows a comparison of the area of the flame. From Figure 9, it can be seen that there is a coupling relationship between the area of the flame and the overpressure peak. The waveform change is similar to the overpressure curve. The working condition (b) produces the largest area of flame and the overpressure peak is also the largest. The time when the flame area is the largest is approximately the time when the overpressure peak is the largest, which is consistent with the conclusion described in the Ref. [22]. It is also found in this paper that the moment of maximum area of flame occurred slightly earlier than the moment of maximum overpressure peak, which could be due to the non-uniform distribution of LPG gas in the tube. Combined with the analysis in Figure 7, the overpressure peaks all appear at the moment when the flame is about to break out of the tube or has already broken out of the tube. This is due to the non-uniform distribution of combustible gases in the tube. The flame can be somewhat obstructed when passing through the PVC film used for partitioning, while the change of concentration can also affect the flame propagation.
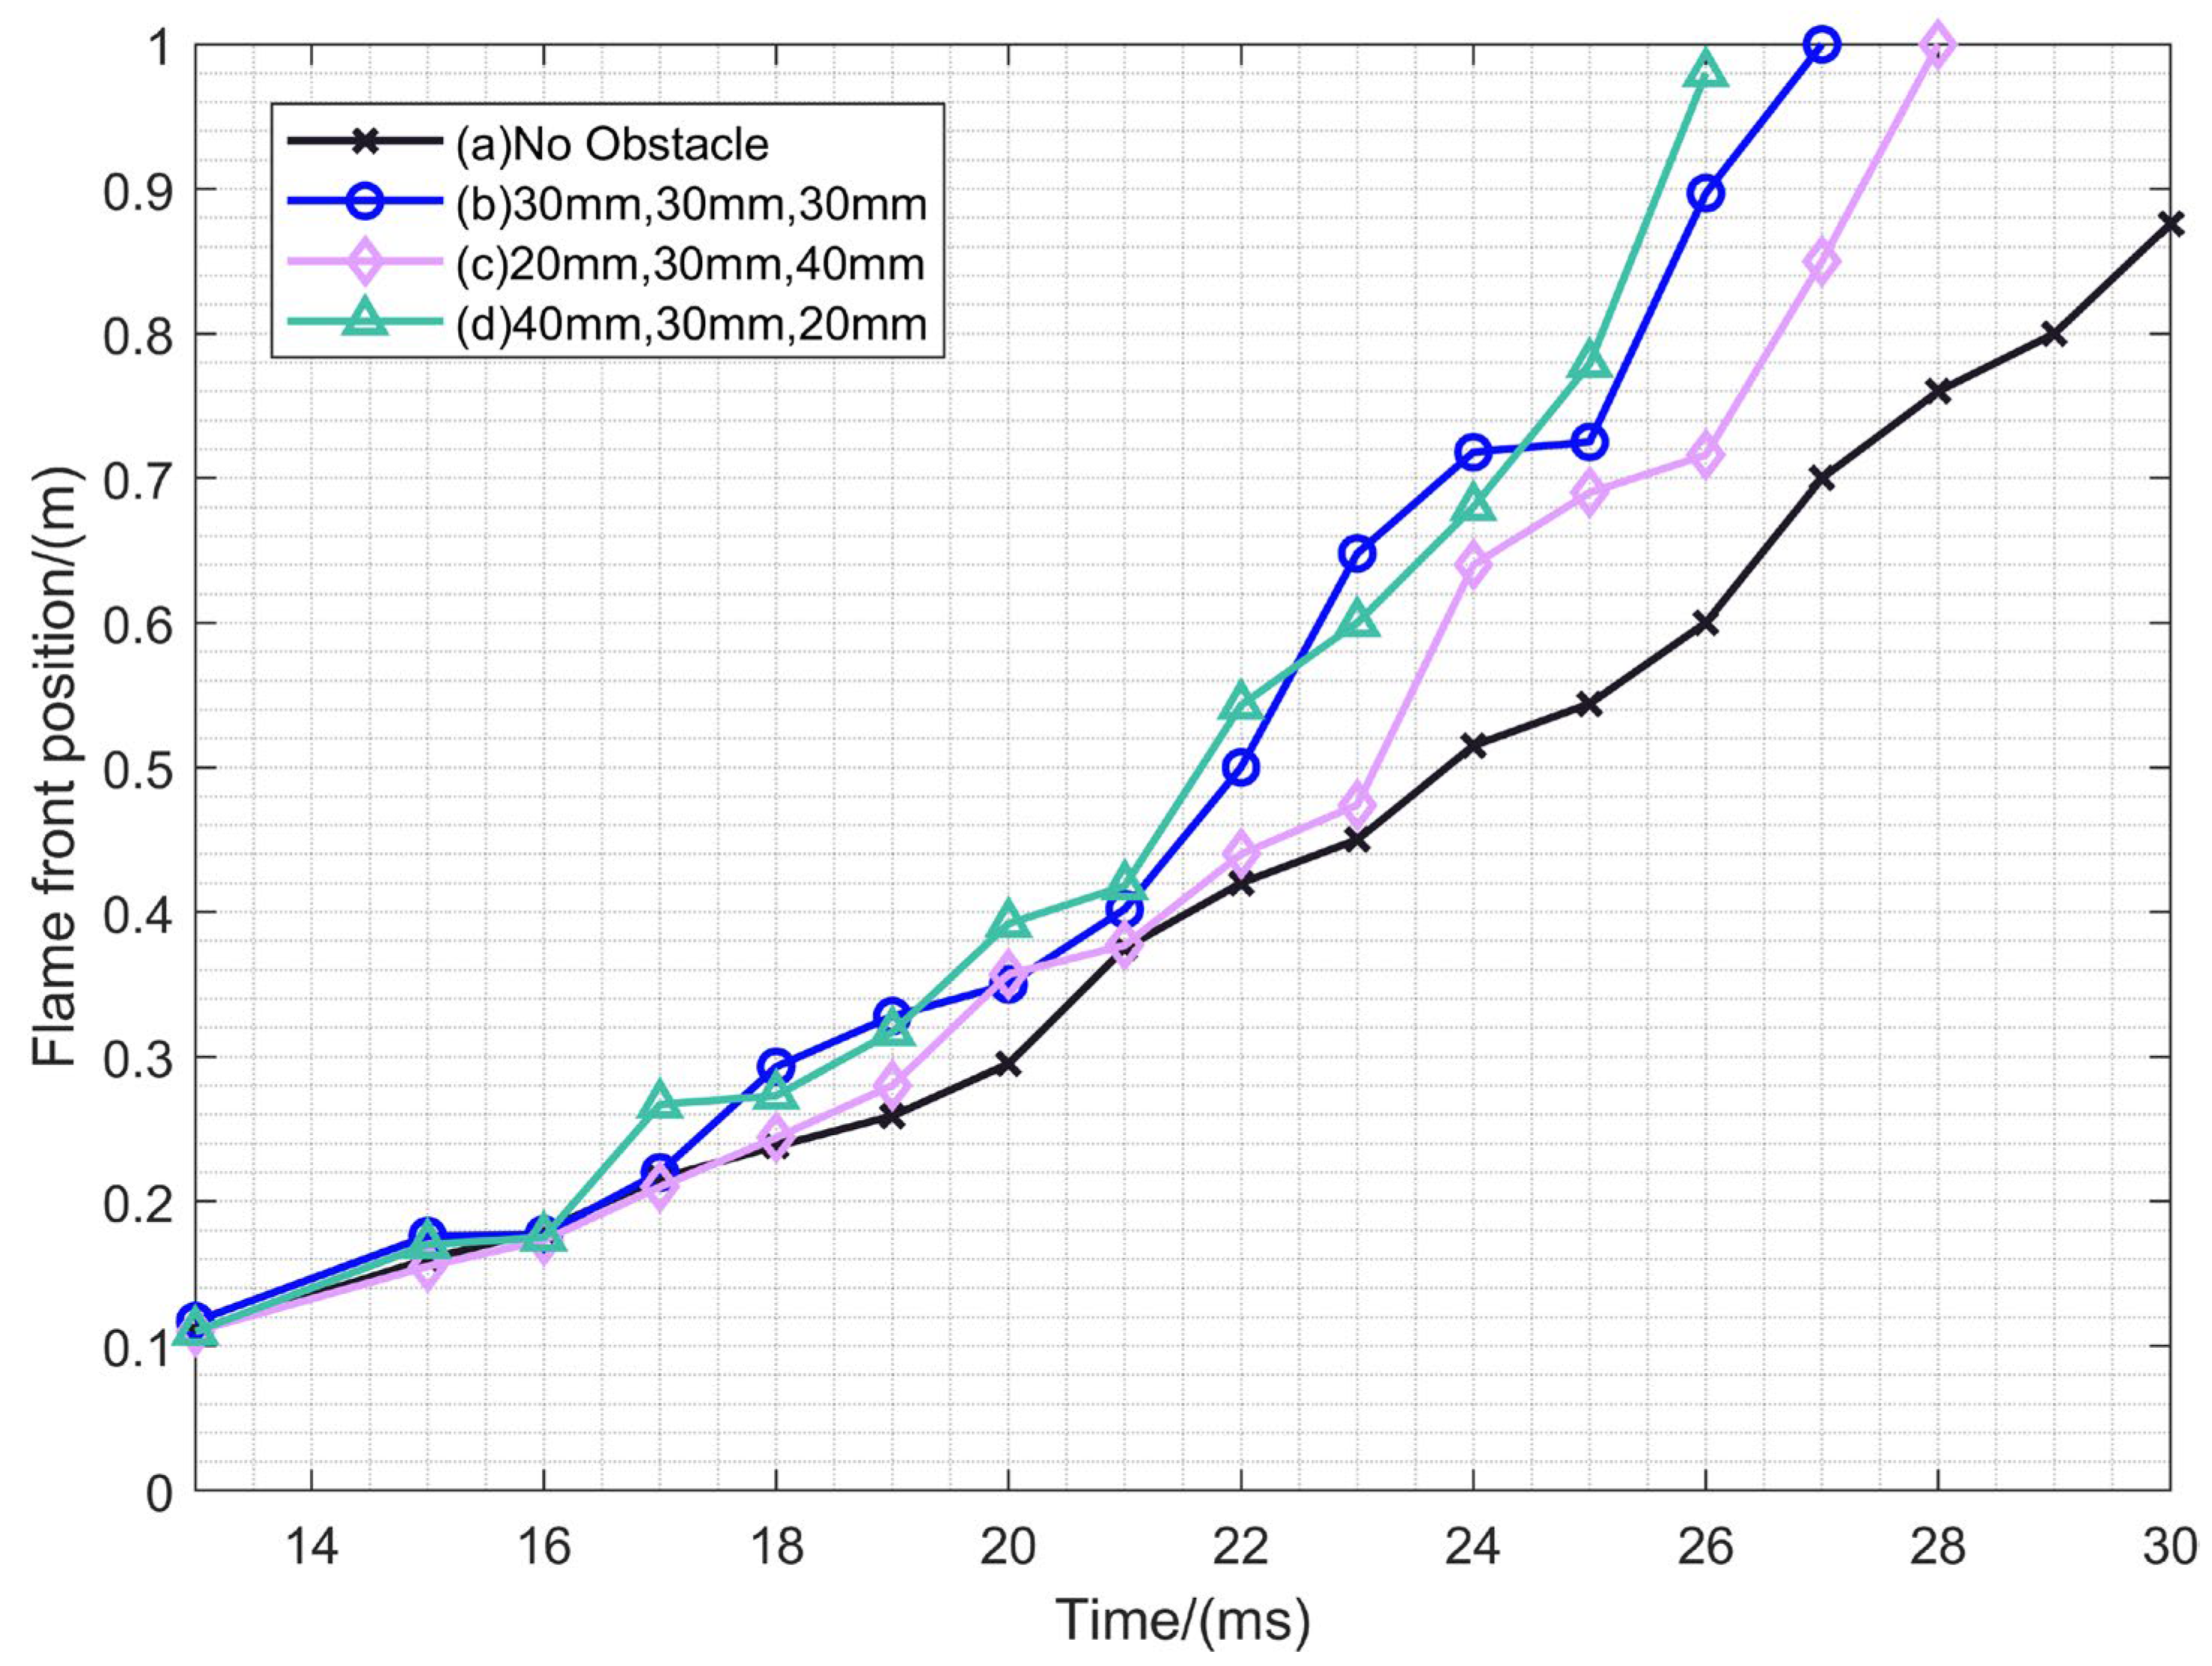
Figure 10 shows the comparison of the change in the position of the flame front surface. The speed of flame propagation is the slowest for the case without obstacles, and the speed increases for working conditions (b), (c), and (d), where the flame acceleration effect is the most obvious for working condition (d). Combining Figure 8 and Figure 9, it can be proved that all three arrangements have an accelerating effect on the flame. Moreover, the acceleration is most obvious when the height of the obstacle is arranged in decreasing blockage height in working condition (d), which makes the peak of the flame area and the overpressure peak appear first. The speed of flame propagation, the area of flame and overpressure peak form a positive feedback mechanism.
At the 16 ms in Figure 10, the first 40 mm obstacle in the working condition (d) has a significant stretching effect on the flame propagation. After entering the area II, the height of the obstacles is 30 mm, and the acceleration effect is not obvious at this time. After the flame spreads to the area III, the flame accelerated in the upstream encounters an open propagation channel, which allows the flame to have enough time and space to fully burn, and again causes the flame to accelerate significantly.
The flame of working condition (c) accelerated violently at the 23 ms, and the flame position quickly reaches 0.64 m from 0.48 m. This is because the flame is gradually increased by the obstacle, and the flame is squeezed by the wall to the top plate of the tube. It finally passes through a narrower passage, so lets the flame spread faster, and finally rushes out of the tube.
Combining the two curves of (c) 20 mm, 30 mm, 40 mm and (d) 40 mm, 30 mm, 20 mm in Figure 10, the speed of the two is similar in the early stage. However, the velocity changes significantly after the first obstacle is encountered. In the 16 ms, the pressure, the area of flame, and propagation velocity gains in case (d) are the largest of the four cases. Although acceleration occurs in the middle and late stages of combustion in case (c), there is no longer enough distance available for flame acceleration due to the tube length limitation. This shows that the speed acquired by the flame at the initial stage has a very important influence on the overall the speed of flame propagation. This is also the manifestation of the positive feedback mechanism mentioned earlier, making the working condition (d) become the one with the most pronounced acceleration effect.

5. Conclusions

In this paper, an experimental study and a mathematical model of the radially aligned obstacles of the same height were first developed, and then the validity of the model was verified. On the basis of this model, the flame behavior and overpressure characteristics of LPG–air premixed gas deflagration in the case of increasing and decreasing blockage height arrangement were studied by numerical simulation and compared with the case of no obstacle. As a result of the study, the following conclusions were reached:
(1)
In the increasing blockage height arrangement, the reflow flame formed a “straw hat” flame cavity, which eventually formed an elliptical region with a long axis of approximately 10 mm and a short axis of approximately 6 mm. In the decreasing blockage height arrangement, a narrow blank area similar to “ribbon-shaped“, appears and becomes longer with time.
(2)
The explosion overpressure was at its maximum when the height of the obstacles was the same. It is probably because a straight tube parallel to the flame propagation direction is more conducive to producing a strong surge. The weakening of the pressure after passing through each obstacle in the case of gradient arrangement was avoided.
(3)
The moment of maximum area of flame occurred slightly earlier than the moment of maximum overpressure peak, which may be due to the non-uniform distribution of LPG gas in the tube. The overpressure peak occurred at the moment when the flame was about to break out of the tube or had already broken out of the tube.
(4)
All three arrangements had an accelerating effect on the flame when the change in the height of the obstacle was not considered. In addition, the acceleration effect was most obvious when the obstacle height was arranged in decreasing. The speed of flame propagation, the area of the flame, and the overpressure peak formed a positive feedback mechanism.
(5)
In the case of a non-uniform distribution of combustible gases, the speed acquired by the flame at the initial stage had a very important influence on the overall speed of flame propagation.

Author Contributions

Conceptualization, B.A. and J.G.; methodology, B.A.; software, X.J.; validation, B.A.; formal analysis, B.A., B.H. (Bin Hao) and B.G.; writing—original draft preparation, B.A.; writing—review and editing, B.A., B.H. (Bin Hao), B.G., B.H. (Bingyuan Hong) and J.G.; supervision, J.G.; funding acquisition, J.G. All authors have read and agreed to the published version of the manuscript.

Funding

This research was funded by the Basic Public Welfare Research Project of Zhejiang Province, grant number LGF22E040002.

Institutional Review Board Statement

Not applicable.

Informed Consent Statement

Not applicable.

Data Availability Statement

Not applicable.

Conflicts of Interest

The authors declare no conflict of interest.

References

  1. Ji, T.; Qian, X.; Yuan, M.; Wang, D.; He, J.; Xu, W.; You, Q. Case study of a natural gas explosion in Beijing, China. J. Loss Prev. Process Ind. 2017, 49, 401–410. [Google Scholar] [CrossRef]
  2. Wang, K.; Shi, T.; He, Y.; Li, M.; Qian, X. Case analysis and CFD numerical study on gas explosion and damage processing caused by aging urban subsurface pipeline failures. Eng. Fail. Anal. 2019, 97, 201–219. [Google Scholar] [CrossRef]
  3. Gong, Y.; Li, Y. STAMP-based causal analysis of China-Donghuang oil transportation pipeline leakage and explosion accident. J. Loss Prev. Process Ind. 2018, 56, 402–413. [Google Scholar] [CrossRef]
  4. Li, X.; Chen, G.; Zhu, H.; Xu, C. Gas dispersion and deflagration above sea from subsea release and its impact on offshore platform. Ocean. Eng. 2018, 163, 157–168. [Google Scholar] [CrossRef]
  5. Feng, L.A.; Ww, B.; Jiang, X.A.; Sd, C.; Fk, D.; Jy, A. A CAST-based causal analysis of the catastrophic underground pipeline gas explosion in Taiwan-ScienceDirect. Eng. Fail. Anal. 2020, 108, 104343. [Google Scholar]
  6. Biezma, M.V.; Andrés, M.; Agudo, D.; Briz, E. Most fatal oil & gas pipeline accidents through history: A lessons learned approach. Eng. Fail. Anal. 2020, 110, 104446. [Google Scholar]
  7. Xl, A.; Jw, A.; Ra, B.; Gc, C. A risk assessment framework considering uncertainty for corrosion-induced natural gas pipeline accidents. J. Loss Prev. Process Ind. 2022, 75, 104718. [Google Scholar]
  8. Yu, M.; Zheng, K.; Chu, T. Gas explosion flame propagation over various hollow-square obstacles. J. Nat. Gas Sci. Eng. 2016, 30, 221–227. [Google Scholar] [CrossRef]
  9. Luo, G.; Tu, J.Q.; Qian, Y.L.; Jin, K.K.; Ye, T.J.; Bai, Y.; Gao, S. Impacts of Rectangular Obstacle Lengths on Premixed Methane–Air Flame Propagation in a Closed Tube. Combust. Explos. Shock. Waves 2022, 58, 10–21. [Google Scholar] [CrossRef]
  10. Wang, L.Q.; Ma, H.H. Explosion dynamics of hydrogen-air mixtures in a flat vessel filled with annular obstacles. Fuel 2021, 298. [Google Scholar] [CrossRef]
  11. Alharbi, A.; Masri, A.R.; Ibrahim, S.S. Turbulent premixed flames of CNG, LPG, and H-2 propagating past repeated obstacles. Exp. Therm. Fluid Sci. 2014, 56, 2–8. [Google Scholar] [CrossRef]
  12. Elshimy, M.; Ibrahim, S.; Malalasekera, W. Numerical studies of premixed hydrogen/air flames in a small-scale combustion chamber with varied area blockage ratio. Int. J. Hydrogen Energy 2020, 45, 14979–14990. [Google Scholar] [CrossRef]
  13. Na'inna, A.M.; Somuano, G.B.; Phylaktou, H.N.; Andrews, G.E. Flame acceleration in tube explosions with up to three flat-bar obstacles with variable obstacle separation distance. J. Loss Prev. Process Ind. 2015, 38, 119–124. [Google Scholar] [CrossRef]
  14. Wang, C.; Cui, Y.Y.; Mebarki, A.; Cai, Y. Effect of a Tilted Obstacle on the Flame Propagation of Gas Explosion in Case of Low Initial Pressure. Combust. Sci. Technol. 2021, 193, 2405–2422. [Google Scholar] [CrossRef]
  15. Li, G.Q.; Du, Y.; Liang, J.J.; Wang, S.M.; Wang, B.; Qi, S. Characteristics of gasoline-air mixture explosions with different obstacle configurations. J. Energy Inst. 2018, 91, 194–202. [Google Scholar] [CrossRef]
  16. Wang, Q.; Luo, X.J.; Li, Q.; Rui, S.C.; Wang, C.J.; Zhang, A.F. Explosion venting of hydrogen-air mixture in an obstructed rectangular tube. Fuel 2022, 310, 122473. [Google Scholar] [CrossRef]
  17. Zhang, K.; Wang, Z.R.; Ni, L.; Cui, Y.Y.; Zhen, Y.Y.; Cui, Y.Q. Effect of one obstacle on methane-air explosion in linked vessels. Process Saf. Environ. Prot. 2017, 105, 217–223. [Google Scholar] [CrossRef]
  18. Wang, L.; Si, R.J.; Li, R.Z.; Huo, Y. Experimental investigation of the propagation of deflagration flames in a horizontal underground channel containing obstacles. Tunn. Undergr. Space Technol. 2018, 78, 201–214. [Google Scholar] [CrossRef]
  19. Chen, C.-k.; Zhang, Y.-l.; Zhao, X.-l.; Lei, P.; Nie, Y. Experimental study on the influence of obstacle aspect ratio on ethanol liquid vapor deflagration in a narrow channel. Int. J. Therm. Sci. 2020, 153, 106354. [Google Scholar] [CrossRef]
  20. Li, G.Q.; Wu, J.; Wang, S.M.; Bai, J.; Wu, D.J.; Qi, S. Effects of gas concentration and obstacle location on overpressure and flame propagation characteristics of hydrocarbon fuel-air explosion in a semi-confined pipe. Fuel 2021, 285, 119268. [Google Scholar] [CrossRef]
  21. Luo, Z.M.; Kang, X.F.; Wang, T.; Su, B.; Cheng, F.M.; Deng, J. Effects of an obstacle on the deflagration behavior of premixed liquefied petroleum gas-air mixtures in a closed duct. Energy 2021, 234, 121291. [Google Scholar] [CrossRef]
  22. Lv, X.; Zheng, L.; Zhang, Y.; Yu, M.; Su, Y. Combined effects of obstacle position and equivalence ratio on overpressure of premixed hydrogen–air explosion. Int. J. Hydrogen Energy 2016, 41, 17740–17749. [Google Scholar] [CrossRef]
  23. Wen, X.; Yu, M.; Ji, W.; Yue, M.; Chen, J. Methane–air explosion characteristics with different obstacle configurations. Int. J. Min. Sci. Technol. 2015, 25, 213–218. [Google Scholar] [CrossRef]
  24. Xiao, G.Q.; Wang, S.; Mi, H.F.; Khan, F. Analysis of obstacle shape on gas explosion characteristics. Process Saf. Environ. Prot. 2022, 161, 78–87. [Google Scholar] [CrossRef]
  25. Cao, X.; Wei, H.; Wang, Z.; Wang, Y.; Fan, L.; Lu, Y. Effect of obstacle on the H2/CO/Air explosion characteristics under lean-fuel conditions. Fuel 2022, 319, 123834. [Google Scholar] [CrossRef]
  26. Li, M.; Liu, D.; Shen, T.; Sun, J.; Xiao, H. Effects of obstacle layout and blockage ratio on flame acceleration and DDT in hydrogen-air mixture in a channel with an array of obstacles. Int. J. Hydrogen Energy 2022, 47, 5650–5662. [Google Scholar] [CrossRef]
  27. Li, G.Q.; Du, Y.; Wang, S.M.; Qi, S.; Zhang, P.L.; Chen, W.Z. Large eddy simulation and experimental study on vented gasoline-air mixture explosions in a semi-confined obstructed pipe. J. Hazard. Mater. 2017, 339, 131–142. [Google Scholar] [CrossRef]
  28. Qin, Y.; Chen, X. Flame propagation of premixed hydrogen-air explosion in a closed duct with obstacles. Int. J. Hydrogen Energy 2021, 46, 2684–2701. [Google Scholar] [CrossRef]
  29. Qin, Y.; Chen, X. Study on the dynamic process of in-duct hydrogen-air explosion flame propagation under different blocking rates. Int. J. Hydrogen Energy 2022, 47, 18857–18876. [Google Scholar] [CrossRef]
  30. Takeno, T.; Murayama, M.; Tanida, Y. Fractal analysis of turbulent premixed flame surface. Exp. Fluids 1990, 10, 61–70. [Google Scholar] [CrossRef]
  31. Hao, B.; Gao, J.; Guo, B.; Ai, B.; Hong, B.; Jiang, X. Numerical Simulation of Premixed Methane–Air Explosion in a Closed Tube with U-Type Obstacles. Energies 2022, 15, 4909. [Google Scholar] [CrossRef]
  32. Zhou, N.; Ni, P.-F.; Li, X.; Li, X.-W.; Yuan, X.-J.; Zhao, H.-J. Experimental study and numerical simulation of the influence of vent conditions on hydrogen explosion characteristics. Energy Sources Part A: Recovery Util. Environ. Eff. 2021, 11, 1–16. [Google Scholar] [CrossRef]
  33. Zhou, N.; Wang, T.; Li, X.; Ni, P.; Zhao, H. Experimental study on hydrogen-air premixed gas explosion in confined space. Energy Sources Part A: Recovery Util. Environ. Eff. 2020, 1–12. [Google Scholar] [CrossRef]
  34. Phillips, H. Flame in a buoyant methane layer. Symp. (Int.) Combust. 1965, 10, 1277–1283. [Google Scholar] [CrossRef]
  35. Kioni, P.N.; Rogg, B.; Bray, K.N.C.; Liñán, A. Flame spread in laminar mixing layers: The triple flame. Combust. Flame 1993, 95, 276–290. [Google Scholar] [CrossRef]
  36. Han, B.; Ibarreta, A.F.; Sung, C.-J.; T'Ien, J.S. Structure of low-stretch methane nonpremixed flames. Combust. Flame 2007, 149, 173–190. [Google Scholar] [CrossRef]
  37. Huang, C.; Chen, X.; Liu, L.; Zhang, H.; Yuan, B.; Li, Y. The influence of opening shape of obstacles on explosion characteristics of premixed methane-air with concentration gradients. Process Saf. Environ. Prot. 2021, 150, 305–313. [Google Scholar] [CrossRef]
  38. Zheng, K.; Wu, Q.; Chen, C.; Xing, Z.; Hao, Y.; Yu, M. Explosion behavior of non-uniform methane/air mixture in an obstructed duct with different blockage ratios. Energy 2022, 255, 124603. [Google Scholar] [CrossRef]
  39. Pan, C.; Wang, X.; Sun, H.; Zhu, X.; Zhao, J.; Fan, H.; Liu, Y. Large-eddy simulation and experimental study on effects of single-dual sparks positions on vented explosions in a channel. Fuel 2022, 322, 124282. [Google Scholar] [CrossRef]
  40. Liu, J.; Wang, H. Machine learning assisted modeling of mixing timescale for LES/PDF of high-Karlovitz turbulent premixed combustion. Combust. Flame 2022, 238, 111895. [Google Scholar] [CrossRef]
  41. Zimont, V.L.; Battaglia, V. Joint RANS/LES approach to premixed flames modelling in the context of the TFC combustion model. Eng. Turbul. Model. Exp. 6 2005, 77, 905–914. [Google Scholar]
  42. Charlette, F.; Meneveau, C.; Veynante, D. A power-law flame wrinkling model for LES of premixed turbulent combustion Part I: Non-dynamic formulation and initial tests. Combust. Flame 2002, 131, 159–180. [Google Scholar] [CrossRef]
  43. Metghalchi, M.; Keck, J.C. Laminar burning velocity of propane-air mixtures at high temperature and pressure. Combust. Flame 1980, 38, 143–154. [Google Scholar] [CrossRef]
  44. Xiao, H.; Wang, Q.; Shen, X.; Guo, S.; Sun, J. An experimental study of distorted tulip flame formation in a closed duct. Combust. Flame 2013, 160, 1725–1728. [Google Scholar] [CrossRef]
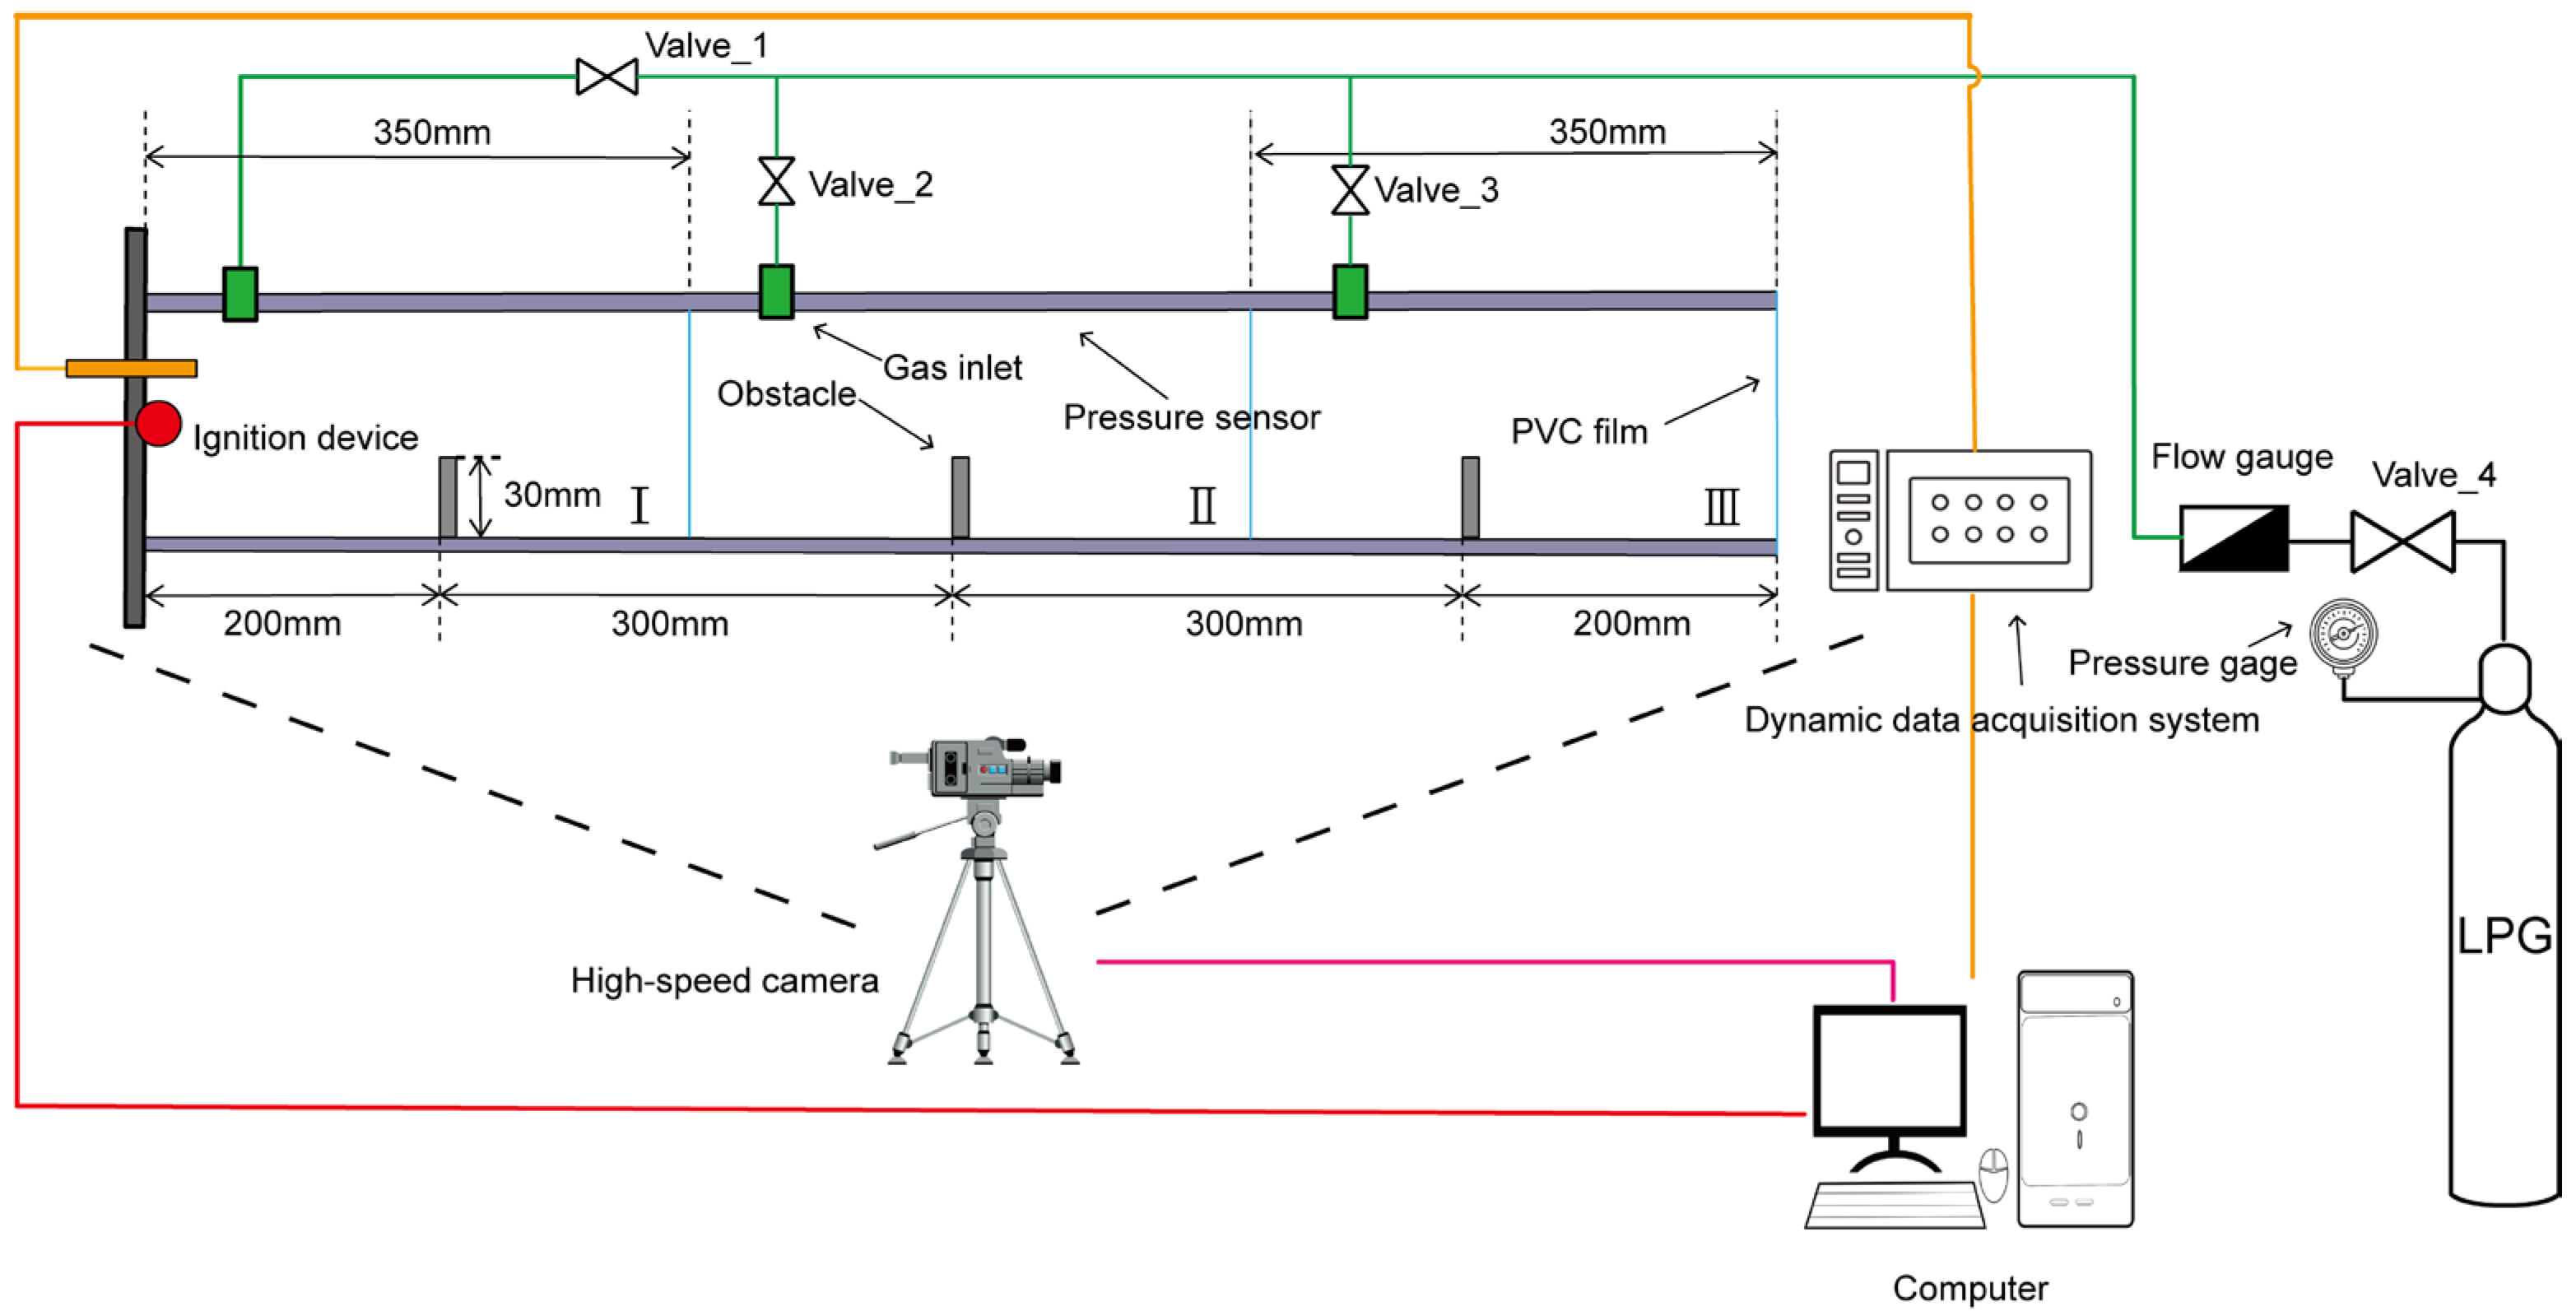
Figure 1. Experimental schematic.
Energies 15 06872 g001
Figure 2. Obstacle.
Figure 2. Obstacle.
Energies 15 06872 g002
Figure 3. Three-dimensional mesh model and details.
Energies 15 06872 g003
Figure 4. Flame comparison: Some feature comparisons were marked with red boxes a, b, c, d, e, f.
Energies 15 06872 g004
Figure 5. Pressure comparison at 30 mm to the right of the ignition point.
Energies 15 06872 g005
Figure 6. Simulated working conditions.
Energies 15 06872 g006
Figure 7. Simulated flame: Some details were marked with red boxes a, b, c. (a) Control experiment. (b) No change in blockage height 30 mm, 30 mm, 30 mm. (c) Increasing blockage height: 20 mm, 30 mm, 40 mm. (d) Decreasing blockage height: 40 mm, 30 mm, 20 mm.
Energies 15 06872 g007
Figure 8. Pressure comparison of the four working conditions.
Energies 15 06872 g008
Figure 9. Comparison of area of flame for four working conditions.
Energies 15 06872 g009
Figure 10. Comparison of flame position for four working conditions.
Energies 15 06872 g010
Table 1. Parameter Settings.
ParametersValueParametersValue
Thermal Conductivity
(W/(m K))
0.024Molecular Weight
(kg/kmol)
29.568
Laminar Flame Speed (m/s)0.3716Heat of Combustion(J/kg)6.0485 × 107
Unburnt Fuel Mass Fraction0.0845
Thermal Conductivity
(W/(m K))
0.024Molecular Weight
(kg/kmol)
29.4513
Laminar Flame Speed (m/s)0.3831Heat of Combustion (J/kg)5.0375 × 107
Unburnt Fuel Mass Fraction0.0602
Thermal Conductivity
(W/(m K))
0.024Molecular Weight
(kg/kmol)
29.4276
Laminar Flame Speed (m/s)0.3669Heat of Combustion(J/kg)4.788 × 107
Unburnt Fuel Mass Fraction0.0547
Publisher’s Note: MDPI stays neutral with regard to jurisdictional claims in published maps and institutional affiliations.