1. Introduction
The rise of energy prices has become a crucial problem in most national economies during the last months. The increased energy costs have an immediate adverse effect on a household’s energy expenditure. Moreover, they affect the other industries of the economy that are using energy as an intermediate input in their production process. Thus, it is important to study the intersectoral relationships of the energy sector in order to assess the impact of the increased energy prices on individual industries and the total economic system.
By and large, the price of a product can be decomposed to the cost of the factors of production that have been used in the production process. For instance, if we assume the existence of two primary inputs in the production process, i.e., labor and capital, then the price of a product can be decomposed into the cost of labor and the cost of capital involved in its production. Furthermore, in the more realistic case of multisectoral economic systems and produced means of production, the reduction of prices to the costs of primary inputs should take into account two types of requirements. First, the cost of the direct requirements in the production process and, second, the indirect requirements, i.e., the cost of those primary inputs that are used for the production of intermediate inputs in the production process. The present research problem refers to the proper quantification of the contribution of both direct and indirect cost requirements to energy prices. The contribution of the energy sector to the price formation of the other industries of the economy is also considered in the current analytical framework. The main objective of this study is to demonstrate the use of a novel approach for more updated analysis and concise estimation of the contribution of the various costs to the formation of energy prices in a national economy. For this purpose, we adopt appropriate methods of input-output analysis, by constructing a supply and use model and employing data originating from the Supply and Use Tables (SUT’s). The suggested approach is indicatively implemented here for the case of the Greek economy.
Input-output analysis is an analytical tool originally developed by the Nobel Prize winner in economics Wassily Leontief, which analyzed the interdependencies between the different sectors/industries of the economic system (see, e.g., [
1,
2]); this kind of analysis has been used in the past to estimate the contribution of primary inputs costs to prices by making use of data from the Symmetric Input-Output Tables (SIOT) (see, e.g., [
3,
4] for the case of the Greek economy). Input-output tables are extensive data matrices that depict the linkages among economic sectors, households and the government, and, hence, the structure of domestic production. In the current context, they are used to analyze the intersectoral flows, from one economic entity to the others, and, hence, the interdependencies within and among the energy sector and all the other sectors of the economy. In turn, they can manifest the role of energy in the current structure of production and the assessment of the potential effects of structural changes across the economy and energy-related activities over a medium to long-term time horizon [
5,
6,
7,
8,
9].
However, the SIOT is derived from the SUT’s on the basis of some restrictive and debatable assumptions (see, e.g., [
10,
11,
12,
13]). Specifically, in the SUT’s, which constitute the core of the modern systems of national accounts, there are industries that produce more than one commodity and commodities that are produced by more than one industry. The SUT’s consist of a pair of tables, the Supply Table, and the Use Table. The Supply Table provides intersectoral information on the production of the products by the various industries of the economy as well as information about the imported goods and services. The part of the Supply Table that describes domestic production is called the Make Matrix of the economy. The Use Table provides information about the usage of intermediate inputs by the various industries as well as the value-added per industry and final demand. The part of the Use Table that describes the intermediate inputs of the various industries is called the Use Matrix of the economy. Therefore, the SUT’s allow, by construction, the consideration of joint production of commodities; it has long been argued that joint production activities constitute the rule in the real world (see, e.g., [
14,
15]). The joint production phenomenon and its importance were also known to classical and early neoclassical economists (see, e.g., [
16]).
In this study, we depart from previous works in the field, since the use of SUT’s allows us to adopt and implement a supply and use model. Based on this model and the economic structure described by SUT’s, for the first time −to the best of our knowledge− we decompose energy prices to the costs for primary inputs. Thus, the proposed analytical framework offers a more realistic picture of the actual economic system and of the formation and impact of energy prices, compared to the traditional approach and the limitations related to the SIOT. Another novelty of the paper is that, in a similar way, using the supply and use model, we decompose the contribution of the energy sector in the price formation of the products of the other industries of the economy.
In this paper, we make use of the supply and use model and exploit data from the SUT’s of the Greek economy for the year 2018 (the latest data available during the conduct of this research), instead of using the traditional input-output model and employing older (as they are published every 5 years) data from the SIOT for the year 2015. Therefore, the present model provides more timely and concise information about the sectoral origin of each particular cost that forms energy prices. Based on the relationships underlying the SUT’s, we implement the supply and use model to decompose the energy prices into the costs of the primary inputs used both directly and indirectly in energy production in the Greek economy.
It is stressed here that the intersectoral input-output analysis focuses on and relies on the current structure of production and assesses the potential effects of structural changes incurred on and resulting from energy prices during the medium and the long term. In turn, the findings of the analysis can be incorporated into a strategic development plan and formulate policy recommendations. In particular, the knowledge about the sectoral origin of each particular cost shaping energy prices enables the economic policy makers to implement more comprehensive and well-targeted strategies in their effort to contain energy prices; these strategies can harness the key role of energy in changing cost requirements and supporting the sustainable growth of individual sectors and the total economy. Nevertheless, in addition to the commodity attribute of energy, wherein the pricing mechanism depends on cost pricing, the energy price also has a financial attribute.
In terms of the energy financial attribute, the pricing mechanism depends on capitalization pricing. According to this financial attribute, energy prices are shaped by a multitude of factors involved in processes that are dynamic and take place over short periods of time. For this reason, the investigation of these factors falls out of the scope of the current research; it is mentioned that these factors may encompass the behavior of the energy market subjects [
17,
18,
19,
20], the energy market and the overall economic environment [
21,
22,
23,
24], and the pricing mechanism of the energy itself [
25].
The remainder of the paper is structured as follows:
Section 2 describes the materials and methods used in the analysis.
Section 3 presents the results of the empirical analysis. Finally,
Section 4 discusses the findings of the paper and concludes, including how the limitations of this study can be addressed in future research.
2. Materials and Methods
The price side of typical SUT’s can be described by the following Equation (see, e.g., [
11,
12])
where
is the
Make Matrix of the economy,
denotes the amount (in money terms) of product
produced by industry
,
is the Use Matrix of the economy,
denotes the amount (in money terms) of product
used as intermediate consumption by industry
,
is the
vector of valued added (or, equivalently, costs for primary inputs),
denotes the value added generated in industry
,
denotes the summation vector, and
is the sign of the transpose of matrix entity. The Make and Use Matrices can be written as
and
, respectively, where
is the vector of market prices,
denotes the market price of product
,
is the output matrix of the economy,
denotes the amount (in physical terms) of product
produced by industry
per unit of activity level,
is the input matrix of the economy,
denotes the amount (in physical terms) of product
used as an intermediate input by industry
per unit of activity level,
is the vector of activity levels,
denotes the activity level of industry
, and
is a diagonal matrix that is formed by the elements of the vector
.
Thus, Equation (1) can be re-written as
or
where
and
are the Make and Use Matrices, respectively, of the economy expressed in physical terms. Now, if we assume that the physical unit of measurement of each product is worth of a monetary unit (see, e.g., [
26]), i.e., it holds
, then Equation (2) becomes
Provided that the matrix
is nonsingular, the solution of Equation (3) is given by
The right-hand side of Equation (4) gives the direct and indirect requirements in primary inputs necessary to produce the net output of each industry. The matrix
is the so-called “generalized inverse Leontief matrix” (see, e.g., [
27]), as opposed to the well-known “inverse Leontief matrix” derived from the usual input-output tables. Thus, Equation (4) reduces the price of the net product of each industry to the costs for primary inputs (wages, profits, taxes, consumption of fixed capital, etc.) involved in its production process. Moreover, Equation (4) captures not only the direct costs of primary inputs of an industry, but also the indirect costs. The latter refers to the costs of primary inputs necessary to produce the products of the other industries that are used as intermediate inputs in the production of each product.
Now, we define the matrix , where is the number of the different categories of primary inputs, the number of the industries in the economy, and denotes the direct requirements in -th primary input necessary to produce the output of industry . Thus, it obviously holds . By post-multiplying the matrix with the “generalized inverse Leontief matrix”, we get a matrix, say , defined as , where gives the direct and indirect contribution of the -th primary input to the price formation of the net product of industry . Thus, it also holds . Therefore, the matrix gives the contribution of the different categories of primary inputs to the price formation of the net outputs of the different industries in the economy.
We can further decompose the contribution of costs to price formation per industry of origin of the primary inputs costs, by defining a new matrix, say , as , where gives the direct and indirect contribution of the primary inputs of industry to the price formation of the net output of industry . In a similar way, we can decompose the contribution of costs to price formation per primary input cost and industry of origin, by defining the matrix as , where is the vector of the -th primary input used per industry. Therefore, gives the contribution of the -th primary input of industry to the price formation of the net output of industry .
The above formulation provides a supply and use framework for estimating the contribution of primary costs to the price formation of the various industries of the economy. Since we are interested in the formation of energy prices, we focus on the industry that is related to energy production. Our empirical analysis is based on data from the SUT’s of the Greek economy for the year 2018, i.e., the year with the most recent data at the time of this research. The SUT’s of the Greek economy (for the year 2018) were retrieved from the website of the Hellenic Statistical Authority (ELSTAT),
www.statistics.gr (accessed on 10 June 2022), and they describe the production of 64 products by 64 industries. The industry of interest in our analysis is the 24th in order in the SUT’s named “Electricity, gas, steam and air conditioning supply” (“Energy” hereafter). Moreover, from the value-added sector in the SUT’s, we can identify four categories of primary inputs, i.e., “Consumption of fixed capital”, “Net taxes”, “Profits”, and “Wages”. In order to capture the contribution of imports in price formation, we consider the imports of the economy as a primary input. Hence, imports are also included as part of the total supply of each industry. Since the SUT’s of the Greek economy provides detailed information about the imports from the EU countries as well as imports from the non-EU countries, we add these two new categories of primary inputs in our analysis as “EU Imports” and “Extra EU Imports”. Thus, the present analysis is based on Make and Use matrices of dimensions
and six categories of primary inputs.
4. Discussion and Conclusions
In this paper, we developed a method to estimate the contribution of primary inputs costs to the net outputs of the various industries of a national economy through a supply and use model; this method captures the direct and indirect contribution of each primary input to the price formation in all industries of the economy. Furthermore, the usage of data from the Supply and Use Tables, instead of the traditional input-output tables, allows us to avoid the restrictive assumptions involved in the conversion methods that transform the Supply and Use Tables into Symmetric Input-Output Tables. On the empirical side, we used more recent (compared to the Symmetric Input-Output Tables) data from the Supply and Use Tables of the Greek economy for the year 2018 (the latest available data at the time of this research). The analysis was principally focused on the estimation of the contribution of primary inputs costs in the formation of energy prices.
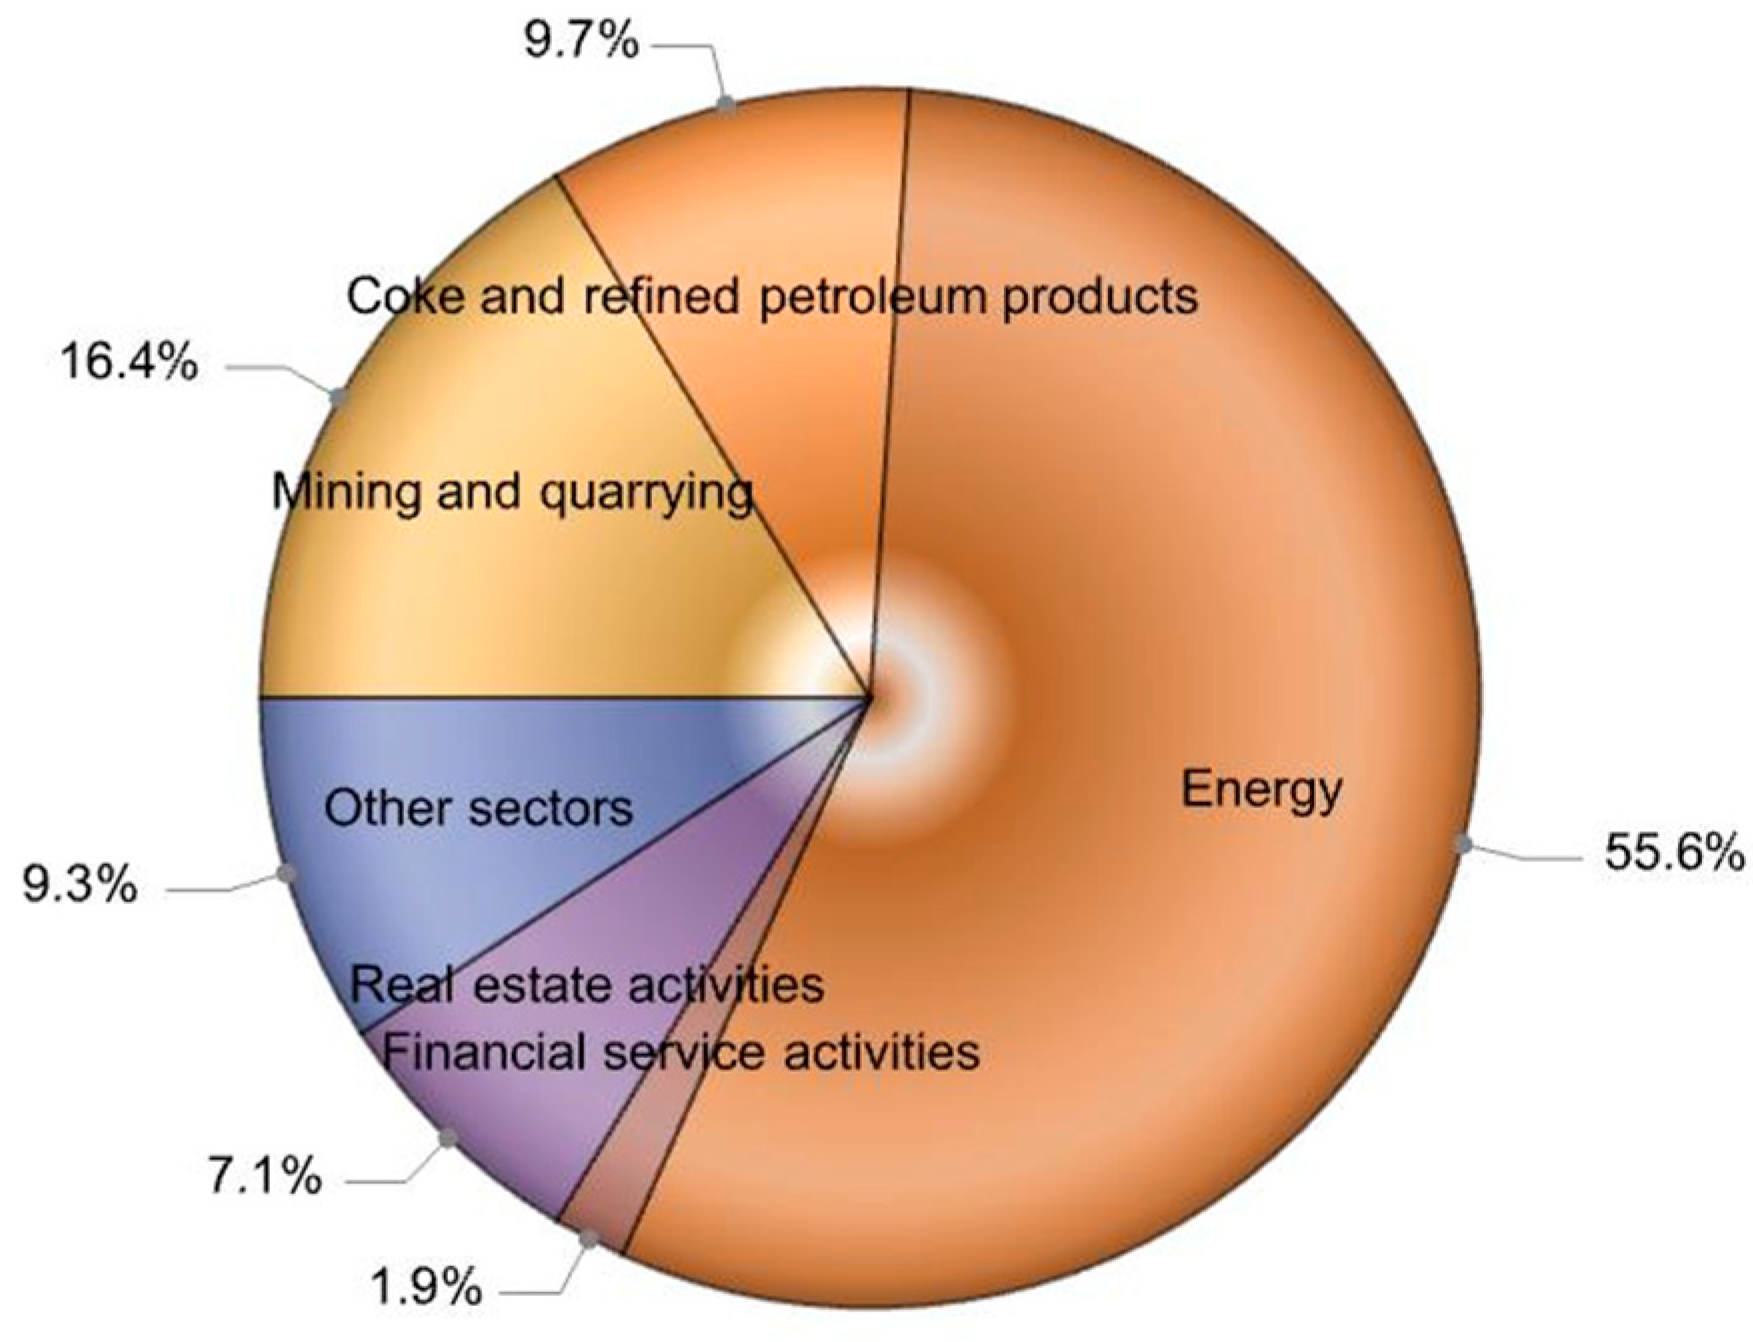
Our empirical results revealed that the energy prices in the Greek economy are mostly formed by Profits and Imports. The Profits that form energy prices are mainly distributed to the energy sector itself (about 86.4%). The Imports largely concern Extra EU imports of “Mining and quarrying products” and “Coke and refined petroleum products”. Another industry of the Greek economy that has a noticeable contribution to the formation of energy prices is “Real estate activities”, which contributes to about 8.0% of the profits and about 22.2% of the consumption of fixed capital that form energy prices. As far as the contribution of the energy sector to the price formation of the other industries of the Greek economy is concerned, the energy sector mainly contributes to the price formation of industrial sectors. The highest contribution is identified in the industries “Sewerage; waste collection, treatment and disposal activities; materials recovery; remediation activities and other waste management services” (9.4%), “Water collection, treatment and supply” (8.1%) and “Manufacture of basic metals” (8.0%).
These results are in line with the findings of Lychnaras et al. [
28] and Rodousakis and Soklis [
29] regarding the intersectoral linkages of the Greek energy sector. More specifically, based on an extended version of the hypothetical extraction method proposed by Dietzenbacher and van der Linden [
30] and data originating from the Symmetric Input-Output Tables of the Greek economy for the year 2015, Lychnaras et al. [
28] found that the Greek energy sector mostly relies on buying inputs from the industries “Mining and quarrying products” and “Coke and refined petroleum products”. Besides, Rodousakis and Soklis [
29] found that the industry that mostly depends on the energy sector for the purchase of inputs is the industry “Sewerage; waste collection, treatment and disposal activities; materials recovery; remediation activities and other waste management services”.
Since energy prices have risen dramatically during the previous months and policy authorities struggle to take sufficient measures to contain energy prices, the proposed methodology and empirical results in this study could be relevant and important. More specifically, our results for the formation of energy prices in the Greek economy indicate that a policy to contain them could be mainly based on the implementation of income and import substitution policies.
On the short run, the relatively high share of profits distributed to the energy sector that form energy prices indicates that an income policy which would limit excessive profits could have significant positive effects on the containment of energy prices; this policy would be particularly beneficial for the competitiveness of the industries in which the energy sector has a relatively high contribution in the price formation of their products, i.e., “Sewerage; waste collection, treatment and disposal activities; materials recovery; remediation activities and other waste management services”, “Water collection, treatment and supply” and “Manufacture of basic metals”; it is worth noting that the implementation of such a policy has recently been proposed by the UN Secretary-General, who declared that “
The combined profits of the largest energy companies in the first quarter of this year are close to $100 billion. I urge governments to tax these excessive profits, and use the funds to support the most vulnerable people through these difficult times” [
31]. On the long run, an import substitution policy towards the exploitation of domestic mining and quarrying products as well as the coke and refined petroleum products could have a significantly positive impact, not only on the retainment of energy prices, but also on the increase in the energy security of the country.
Finally, it should be noted that, similar to all the traditional input-output analyses, the proposed model assumes fixed structures in the inter-industry relationships. Moreover, since the data about the structure of the Greek economy are derived from the Supply and Use Tables for the year 2018, the analysis does not capture possible changes due to structural reforms that occurred in the latest years through the implementation of decarbonatization policies in the Greek energy sector. Thus, future research efforts could employ more recent (when available) datasets and possible extensions of the proposed methodological framework to consider the dynamics of energy price formation mechanisms, including various types of investment/financial flows and exogenous shocks. Given the availability of more refined data at the sectoral level, the analysis could also focus on the prices of different types of activities and sources of energy, such as those related to lignite, natural gas and renewable energy sources. Additionally, the inclusion of information about different countries by use of inter-country input-output data [
32,
33,
34,
35,
36] could further contribute to the current knowledge, by providing insights not only into the inter-industry relationships, but also into the inter-country relationships among industries.


