Article

Numerical Investigation of Tip Leakage Vortex Cavitating Flow in a Waterjet Pump with Emphasis on Flow Characteristics and Energy Features

State Key Lab of Water Resources and Hydropower Engineering Science, Wuhan University, Wuhan 430072, China
*
Author to whom correspondence should be addressed.
Energies 2022, 15(19), 6916; https://doi.org/10.3390/en15196916
Submission received: 2 August 2022 / Revised: 11 September 2022 / Accepted: 15 September 2022 / Published: 21 September 2022
(This article belongs to the Special Issue Advances in Pumped Storage Hydraulic System)

Abstract

:
The Delayed Detached Eddy Simulation (DDES) turbulence model was coupled with a homogeneous cavitation model to analyze the tip-leakage vortex (TLV) cavitating-flow characteristics in a waterjet pump. The numerical results agree well with experimental data. The results show that the vortex evolution in the waterjet pump has three stages, which is similar to that around a hydrofoil, but the vorticity variations in the waterjet pump are more complicated. The relative-vorticity-transport equation was then applied to find the reason for the differences between the vorticity variation observed in the waterjet pump and that around a hydrofoil. The results indicate that the drastic fusion process of the TSV cavity and the TLV cavity in the waterjet pump resulted in the formation of triangular cavitation region near the blade tip that is difficult to reproduce by stationary hydrofoil simulation. This fusion process caused the local variation of fluid volume and further affected the vorticity transport. The entropy-production evaluation method considering the phase transition was then used to analyze the dissipation losses in the complex cavitation region. The results indicate that the drastic fusion process of the TSV cavity and the TLV cavity significantly influenced the entropy production rate distributions and enhanced the disturbance of the flow field. In addition, severe phase transition occurs in the drastic fusion region accompanied by huge phase-transition losses.

1. Introduction

Turbomachines have tip clearances between the casing and the blade tip to prevent contact as the rotor rotates. The pressure difference between the suction side (SS) and the pressure side (PS) then results in tip-leakage flow through the clearance. The leakage flow starts from the PS, accelerates inside the clearance, and creates a tip-leakage vortex (TLV) near the SS [1,2,3]. Simultaneously, the free flow near the blade tip separates from the PS, resulting in the generation of a tip-separation vortex (TSV) near the PS [4]. An induced vortex (IV) is also formed during this process [5]. Normally, the pressure is very low inside the vortex core and can even reach the saturated vapor pressure, which results in cavitation near the vortex core. The flow structures are strongly affected by the cavitation interacting with the vortex. The complex vortex structures and vortex cavitation near the tip clearance often induce adverse effects such as operating instabilities, efficiency losses, and noise [6,7,8,9]. The TLV cavitating-flow characteristics are still not well understood, which limits further improvements of the operating stability and operating efficiency of turbomachines.
Previous research methods on the tip-clearance flow characteristics have included experimental and numerical simulation with the blade modeled as a simple hydrofoil with a tip clearance to study the clearance-dependent flow phenomena. Muthanna et al. [10,11,12,13] experimentally measured the TLV characteristics for a GE rotor B aerofoil and documented the effects of the endwall motion, clearance size, and grid-generated turbulence. You et al. [4,14,15,16] numerically studied the same model using large eddy simulations (LES). They monitored the evolution of the tip-gap flow, the turbulence statistics, and the viscous loss mechanisms to develop strategies for improved designs. Regarding the tip-clearance flow characteristics with cavitation occurring, many scholars have carried out detailed studies. Zhao et al. [17] proposed a visualization method of cavitation pattern based on images and experimentally captured the generation, development, and collapse of the TLV cavity. Decaix et al. [18] numerically investigated the TLV around a NACA0009 hydrofoil for cavitating and non-cavitating conditions. They came to the conclusion that the TLV vortex core trajectory of a cavitating case was different than that of a non-cavitating case, with the cavitation-led vortex trajectory being closer to the side wall and the SS. Cheng et al. [19] placed emphasis on the influences of TLV cavitation around a NACA 0009 hydrofoil on the local flow field to develop TLV cavitation-control strategies. They discovered that the TLV cavitation greatly influenced the vorticity and turbulent kinetic-energy distributions.
Hydrofoils are relatively simple models that do not completely model the tip-clearance flow phenomena, especially for static models that do not accurately reflect all the effects of the relative motion between the impeller and the casing endwall [20,21,22]. More recent improved numerical simulations have improved research on the tip-clearance flows in turbomachinery. Zhang et al. [23] applied the shear stress transport (SST) k-ω turbulence model to capture the TLV flow characteristics in an axial flow pump for various flow rates. They found that the vorticity, turbulent kinetic energy, and static pressure distributions inside the TLV core were influenced by the TLV structure. Shi et al. [24] used the same turbulence model to analyze the effects of the blade-tip geometry on the TLV dynamics in an axial-flow pump. They found that the shear layer fed turbulence into the TLV core, but the flow changed for different blade-tip geometries. Regarding cavitation in the tip clearance, Huang et al. [25] successfully captured the TLV cavitating flow in a mixed-flow waterjet pump with numerical models and found that cavitation development enhanced flow instability and vorticity generation. Han et al. [26] explored the effects of cavitation on the vortex distribution in the axial waterjet pump using the LES verification and validation method. They found that the vortex stretching and bending, vortex dilatation, and vortex baroclinic-torque terms significantly affected the vortex distribution, and the viscosity diffusion and Coriolis-force terms also influenced the vorticity changes in the cavitation region. Zhang et al. [27] conducted numerical simulation to study the TLV characteristics under the effects of cavitation in an axial-flow pump. They found that the TLV core trajectory was farther from the SS with cavitation occurring. Thus, Zhang et al. [27] and Decaix et al. [18] both studied the influence of cavitation on the TLV trajectory, but observed opposite effects due to their different geometric models. These results indicate that the TLV cavitating-flow characteristics can differ in the turbomachinery and around hydrofoils, which will influence the assessment of operational stability and energy performance. However, little attention has been paid to the differences in the TLV cavitating-flow characteristics inside turbomachinery and around hydrofoils, or the effects of the differences on energy features.
This study used the Delayed Detached Eddy Simulation (DDES) [28] turbulence model coupled with the Zwart–Gerber–Belamri [29] cavitation model to predict the TLV cavitating flow in a waterjet pump. The numerical results were compared with experimental data to verify the calculational accuracy. Then, the vortex characteristics in the narrow clearance were investigated in terms of the flow distribution, vortex formation mechanism, and vortex evolution. The calculations were also applied to analyze the differences in the TLV cavitating-flow characteristics inside the waterjet pump and around hydrofoils [30] and the reasons for the differences, revealing the limitations of using hydrofoils to simulate the tip-gap flow of rotating machinery. Finally, the entropy production-evaluation method was used to analyze the effect of the above differences on the prediction of the energy performance of the waterjet pump while focusing on energy losses because of the phase transition. Therefore, this work promotes further understanding of the internal flow characteristics and energy characteristics of waterjet pumps in engineering.

2. Numerical Method

2.1. Governing Equations

With the homogeneous two-phase flow assumption, the vapor/liquid flow is considered to have the same velocity and pressure. The interphase-slip velocity is ignored and the vapor and the liquid are distinguished by the volume fraction. The mass- and momentum-conservation equations for the vapor/liquid two-phase flow can be written as:
ρ m t + ρ m u j x j = 0
ρ m u i t + ρ m u i u j x j = p x i + x j [ μ m ( u i x j + u j x i 2 3 u k x k δ i j ) ]
where p is the pressure, uj is the velocity component in the j direction, and ρm and μm are the mixture density and dynamic viscosity, respectively, defined as,
ρ m = α v ρ v + ( 1 α v ) ρ l
μ m = α v μ v + ( 1 α v ) μ l
where the subscripts l and ν represent the liquid and vapor, respectively, and α is the volume fraction.
The Reynolds-Averaged Navier–Stokes (RANS) methods do not require extremely large meshes and computing resources but introduce excessive dissipation that inhibits most of the transient flow characteristics. The LES method can capture many unsteady flow features but requires larger meshes and computational resources. The Delayed Eddy Simulation (DES) model was developed to improve the computational accuracy with reasonable mesh sizes and computational times. The DES model is a hybrid of the RANS and LES models that uses the RANS model to simulate the flow near the wall and the LES model to simulate the flow away from the wall, but this model is prone to mesh-induced separation. The Delayed Detached Eddy Simulation (DDES) model [28,31,32] was then proposed to overcome the defects of the DES model.
Therefore, to capture the transient flow characteristics during the evolution of vortex and cavitation without consuming too many computational resources, the DDES model was chosen as the turbulence model in this work, which is an improved hybrid model of the RANS and LES models. This model has an additional Reynolds stress term introduced after the Reynolds time averaging of the Navier–Stokes (N-S) equations. Thus, the equations then need to be closed before the solution. With the Boussinesq assumption, the final governing equations can be written as:
ρ m t + ρ m u j ¯ x j = 0
ρ m u i ¯ t + ( ρ m u i ¯ u j ¯ ) x j = p ¯ x i + x j [ ( μ m + μ t ) ( u i ¯ x j + u j ¯ x i 2 3 u k ¯ x k δ i j ) ]
where “-” means a time average. The transport equations of the turbulent kinetic energy k and the turbulent eddy frequency ω are:
( ρ m k ) t + x j ( ρ m u j k ) = x j [ ( μ m + μ t σ k 3 ) k x j ] + P k ρ m k 3 / 2 l D D E S
( ρ m ω ) t + x j ( ρ m u j ω ) = x j [ ( μ m + μ t σ ω 3 ) ω x j ] + ( 1 F 1 ) 2 ρ m 1 σ ω 2 ω k x j ω x j + α 3 ω k P k β 3 ρ m ω 2
with the turbulent viscosity then given by:
μ t = ρ m a 1 k max ( a 1 ω , S F 2 )
where the formula for the functions F1 and F2 are:
F 1 = tanh ( arg 1 4 )
arg 1 = min ( max ( k β ω y , 500 υ ω y 2 ) , 4 ρ m k C D k w σ ω 2 y 2 )
F 2 = tanh ( arg 2 2 )
arg 2 = max ( 2 k C μ ω y , 500 υ ω y 2 )
where υ is the kinematic viscosity and y is the distance to the nearest wall.
Pk is the turbulence production, which can be modeled as:
P k = min ( μ t S 2 , 10 C μ ρ m k ω )
The model coefficients α3, β3, σk3, and σω3 are computed using linear combinations of the model coefficients for the k-ω and k-ε models with α3, for example, as:
α 3 = F 1 α 1 + ( 1 F 1 ) α 2
The corresponding model coefficients are:
α 1 = 5 / 9 , α 2 = 0.44 , β 1 = 0.075 , β 2 = 0.0828 , σ k 1 = 0.85 , σ k 2 = 1 , σ ω 1 = 2 , σ ω 2 = 1 / 0.856 , C μ = 0.09 , a 1 = 0.3
The length scale lDDES, which is the core in the DDES model, is defined as:
l D D E S = l R A N S f d max ( 0 , l R A N S l L E S )
f d = 1 tanh [ ( C d 1 r d ) C d 2 ]
r d = υ t + υ κ 2 y 2 0.5 ( S i j 2 + Ω i j 2 )
l R A N S = k C μ ω
l L E S = C D D E S Δ
where Ωij is the vorticity tensor and Sij is the strain-rate tensor. The other model coefficients are Cd1 = 20, Cd2 = 3, and κ= 0.41. The model coefficient CDDES can be expressed as:
C D D E S = C D E S , k - ω F 1 + C D E S , k - ω ( 1 F 1 )
where CDES,k-ω = 0.78 and CDES,k-ε = 0.61.

2.2. Cavitation Model

Lots of studies have proven that the cavitation model proposed by Zwart et al. [29] is generally applicable and accurate for cavitating-flow simulation in axial-flow pump [26,27], so the current study also used this model to capture the tip-clearance cavitation in a waterjet pump. The cavitation is described by the vapor-transfer equation:
( α v ρ v ) t + ( α v ρ v u j ) x j = m + m
The source terms m+ and m for the evaporation and condensation rates, respectively, are derived from the simplified Rayleigh–Plesset equation as:
m + = F vap 3 α nuc ( 1 α v ) ρ v R b 2 3 | p v p | ρ l
m = F cond 3 α v ρ v R b 2 3 | p v p | ρ l
where Fvap and Fcond represent the vaporization and condensation source term coefficients, with values of 50 and 0.01, respectively. αnuc is the volume fraction of the nucleation site, with a value of 5 × 10⁻⁴ and Rb is the typical bubble radius, with a value of 1 × 10⁻⁶ m. These constants were recommended by Zwart et al. [29]. pv is the saturation-vapor pressure of 4245.5 Pa, which is the same as in the experiment by Han et al. [33].

3. Physical Model, Numerical Setup, and Mesh Information

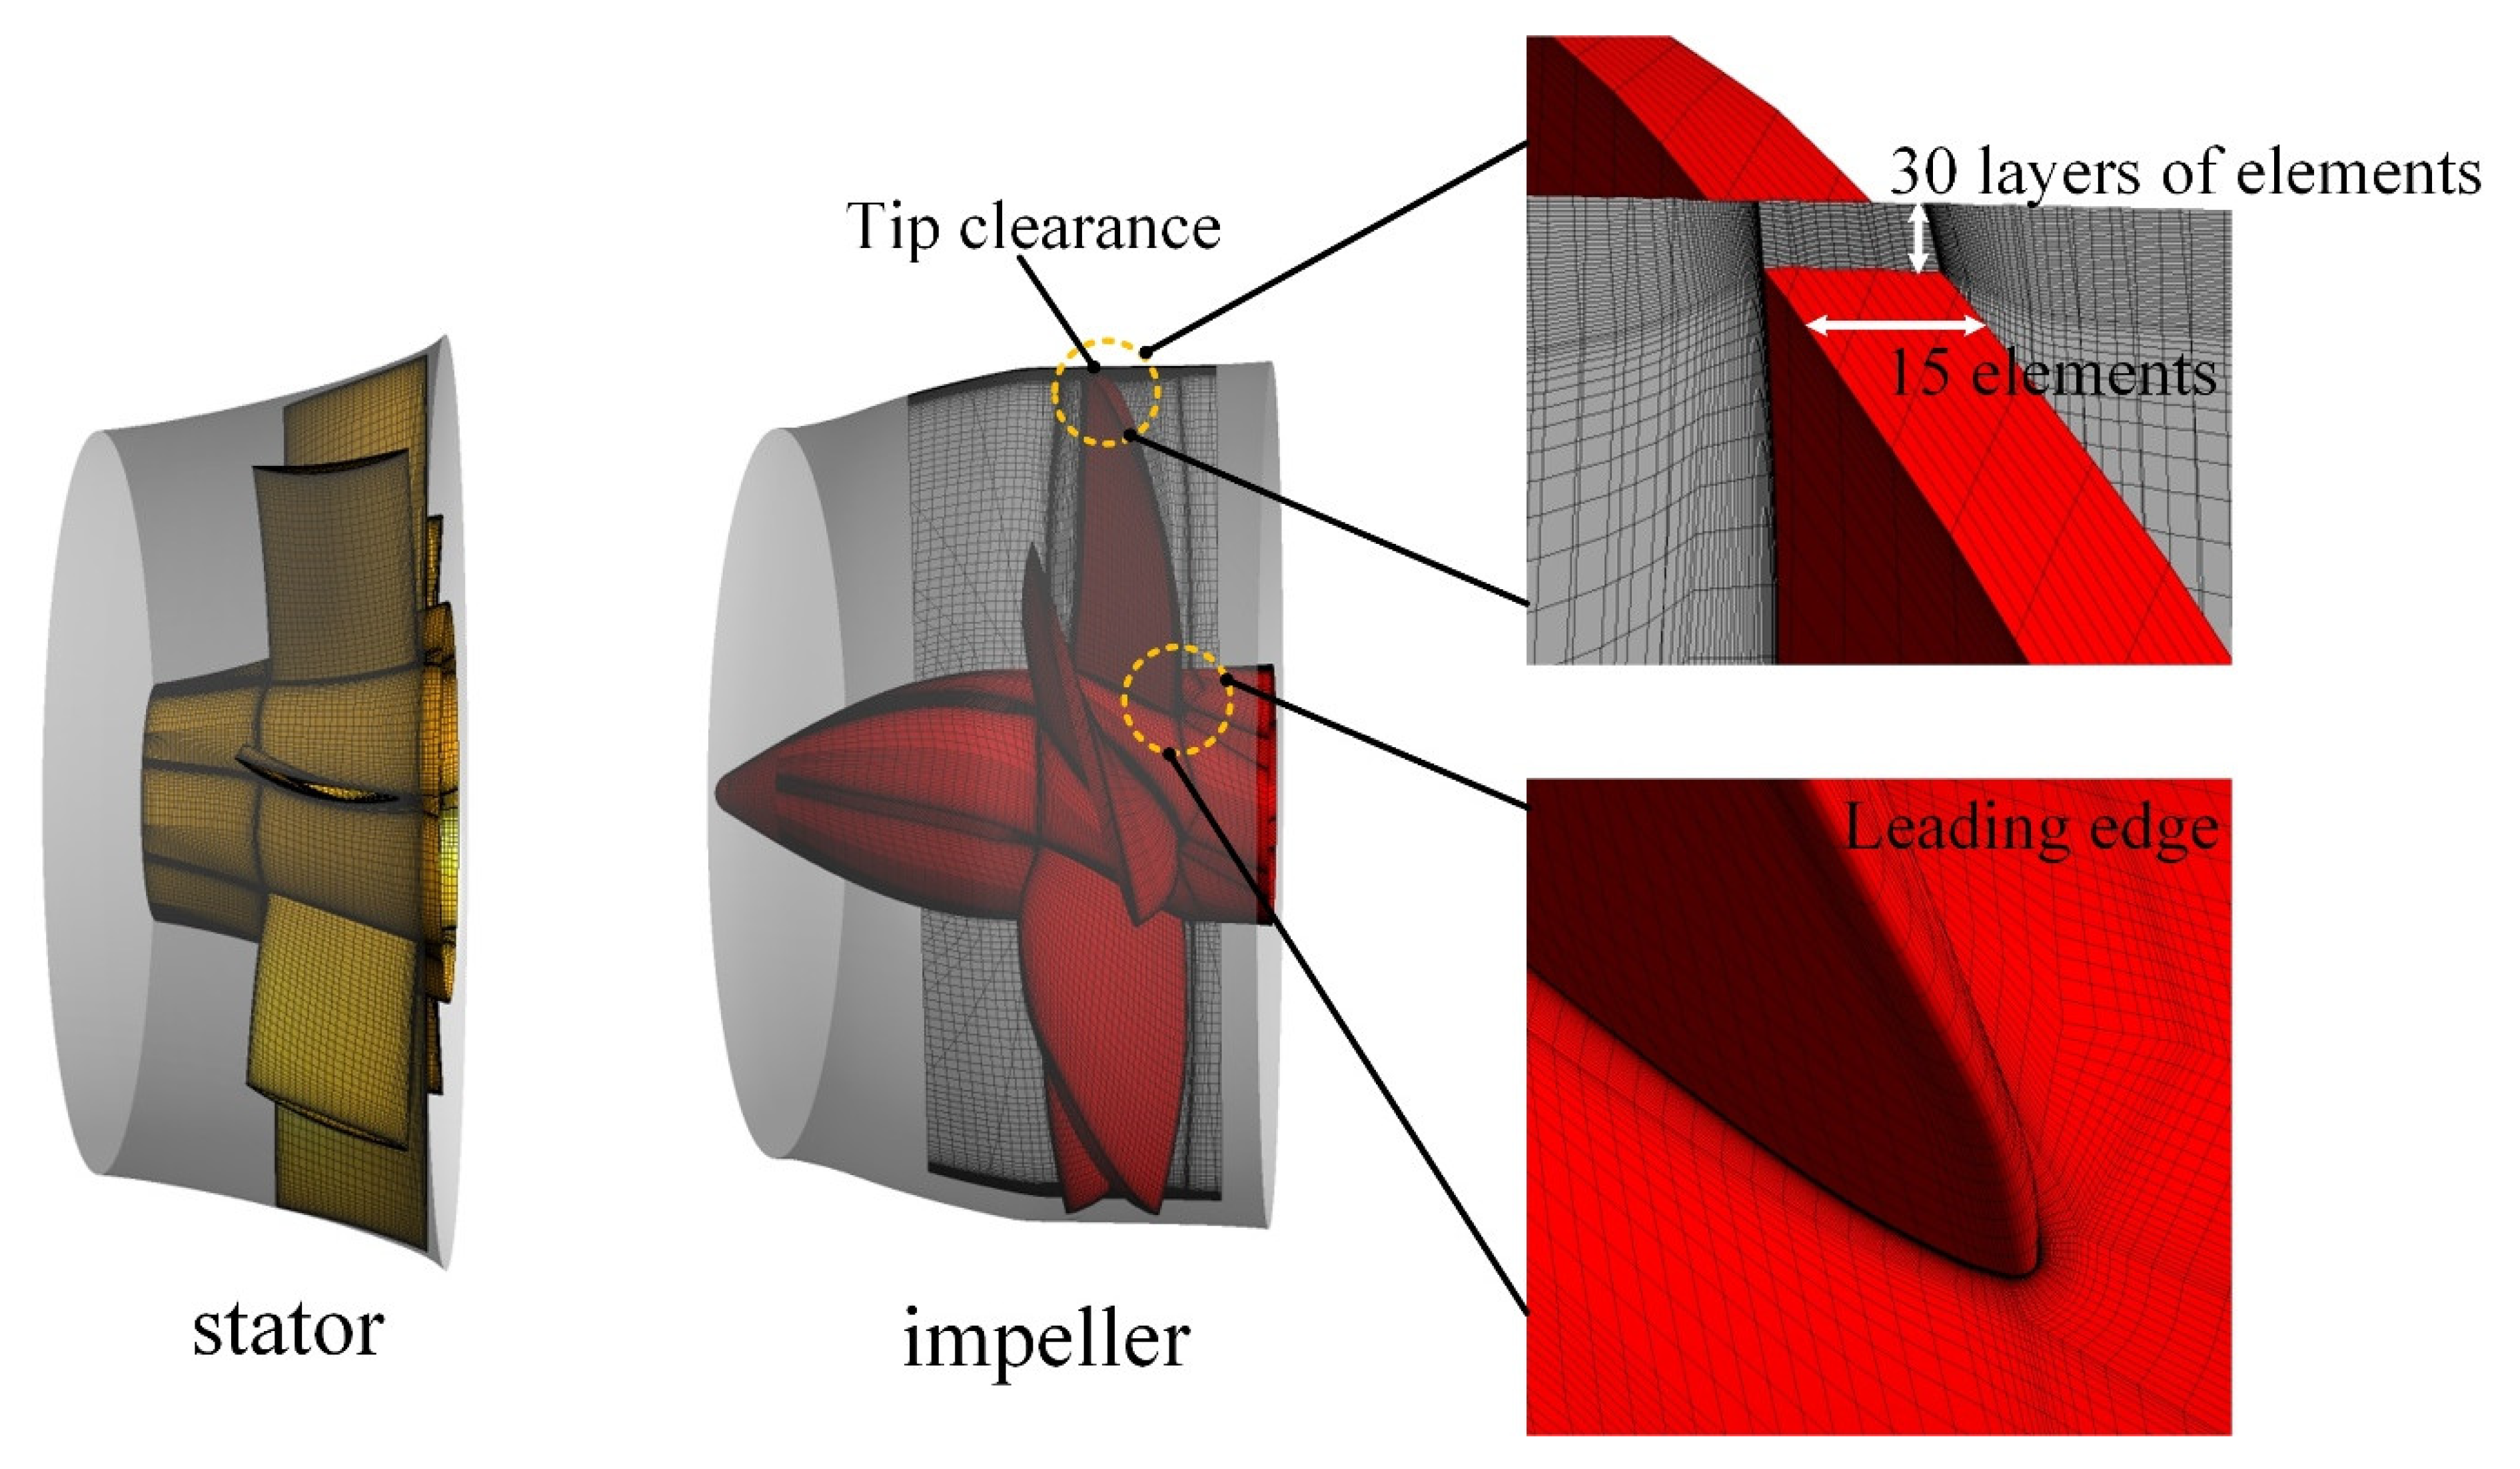
The model used in this work is a waterjet pump model with a front stator. The simulation domain was divided into the impeller domain with six blades, the stator domain with eight blades, and the flow-channel domain, where the impeller domain was set to rotate. The entire simulation domain is shown in Figure 1, where the area of focus is magnified. The simulation-domain size and the operating conditions were the same as those in the experiment [33].
The characteristic diameter of the impeller D is 166.4 mm. The propeller is shaped like an axial-flow pump, which was modeled by the high-precision modeling software Croe to ensure the geometric accuracy. There was a 1 mm clearance between the blade tip and the casing. The flow-channel cross-section was 3.65 D × 3.65 D, the flow-channel length was 15.81 D, the center of the propeller shaft coincided with the geometric center of the flow channel, the guide vane inlet was 4.32 D from the inlet, and the casing length in the flow direction was 1.09 D. The simulation was carried out using CFX. The flow-channel surface-boundary condition used the free-slip wall condition, whereas the waterjet-pump surfaces used the no-slip wall condition. The casing endwall outside the impeller was set as a counter-rotating wall condition. Three refined structured grids were created for the entire simulation domain, with the numbers of elements shown in Table 1. The mesh 2 distribution is shown in Figure 2.
The impeller is the most important part of the waterjet pump, so the mesh quality around the impeller greatly influenced the results. This paper focuses on capturing the flow details near the waterjet-pump tip clearance, so the mesh generation near the blade-tip area was very important for accurately obtaining the flow characteristics in the clearance. An O-type mesh topology was used to improve the mesh quality around the blades. The leakage-flow structures in the tip clearance were accurately modeled by using 30 layers of elements across the 1 mm tip clearance, with 15 elements along the blade thickness.
The numerical solution started with steady simulations without cavitation until the flow became steady with the cavitation model, and then added to predict the steady cavitating flow. Then, the steady solution was used to begin the unsteady cavitation simulation in the waterjet pump. The inlet velocity was set to U = 2.466 m/s for both the steady and unsteady cases, which is consistent with the experimental conditions [33]. The outlet static pressure pout depended on the cavitation number σ = (poutpv)/(0.5ρn2D2) = 2. The convection terms applied the high-resolution scheme, with the transient terms applying the second-order backward Euler scheme. The rotational speed n was 1500 rpm.

4. Results and Discussions

4.1. Performance Analysis and Grid-Independence Test

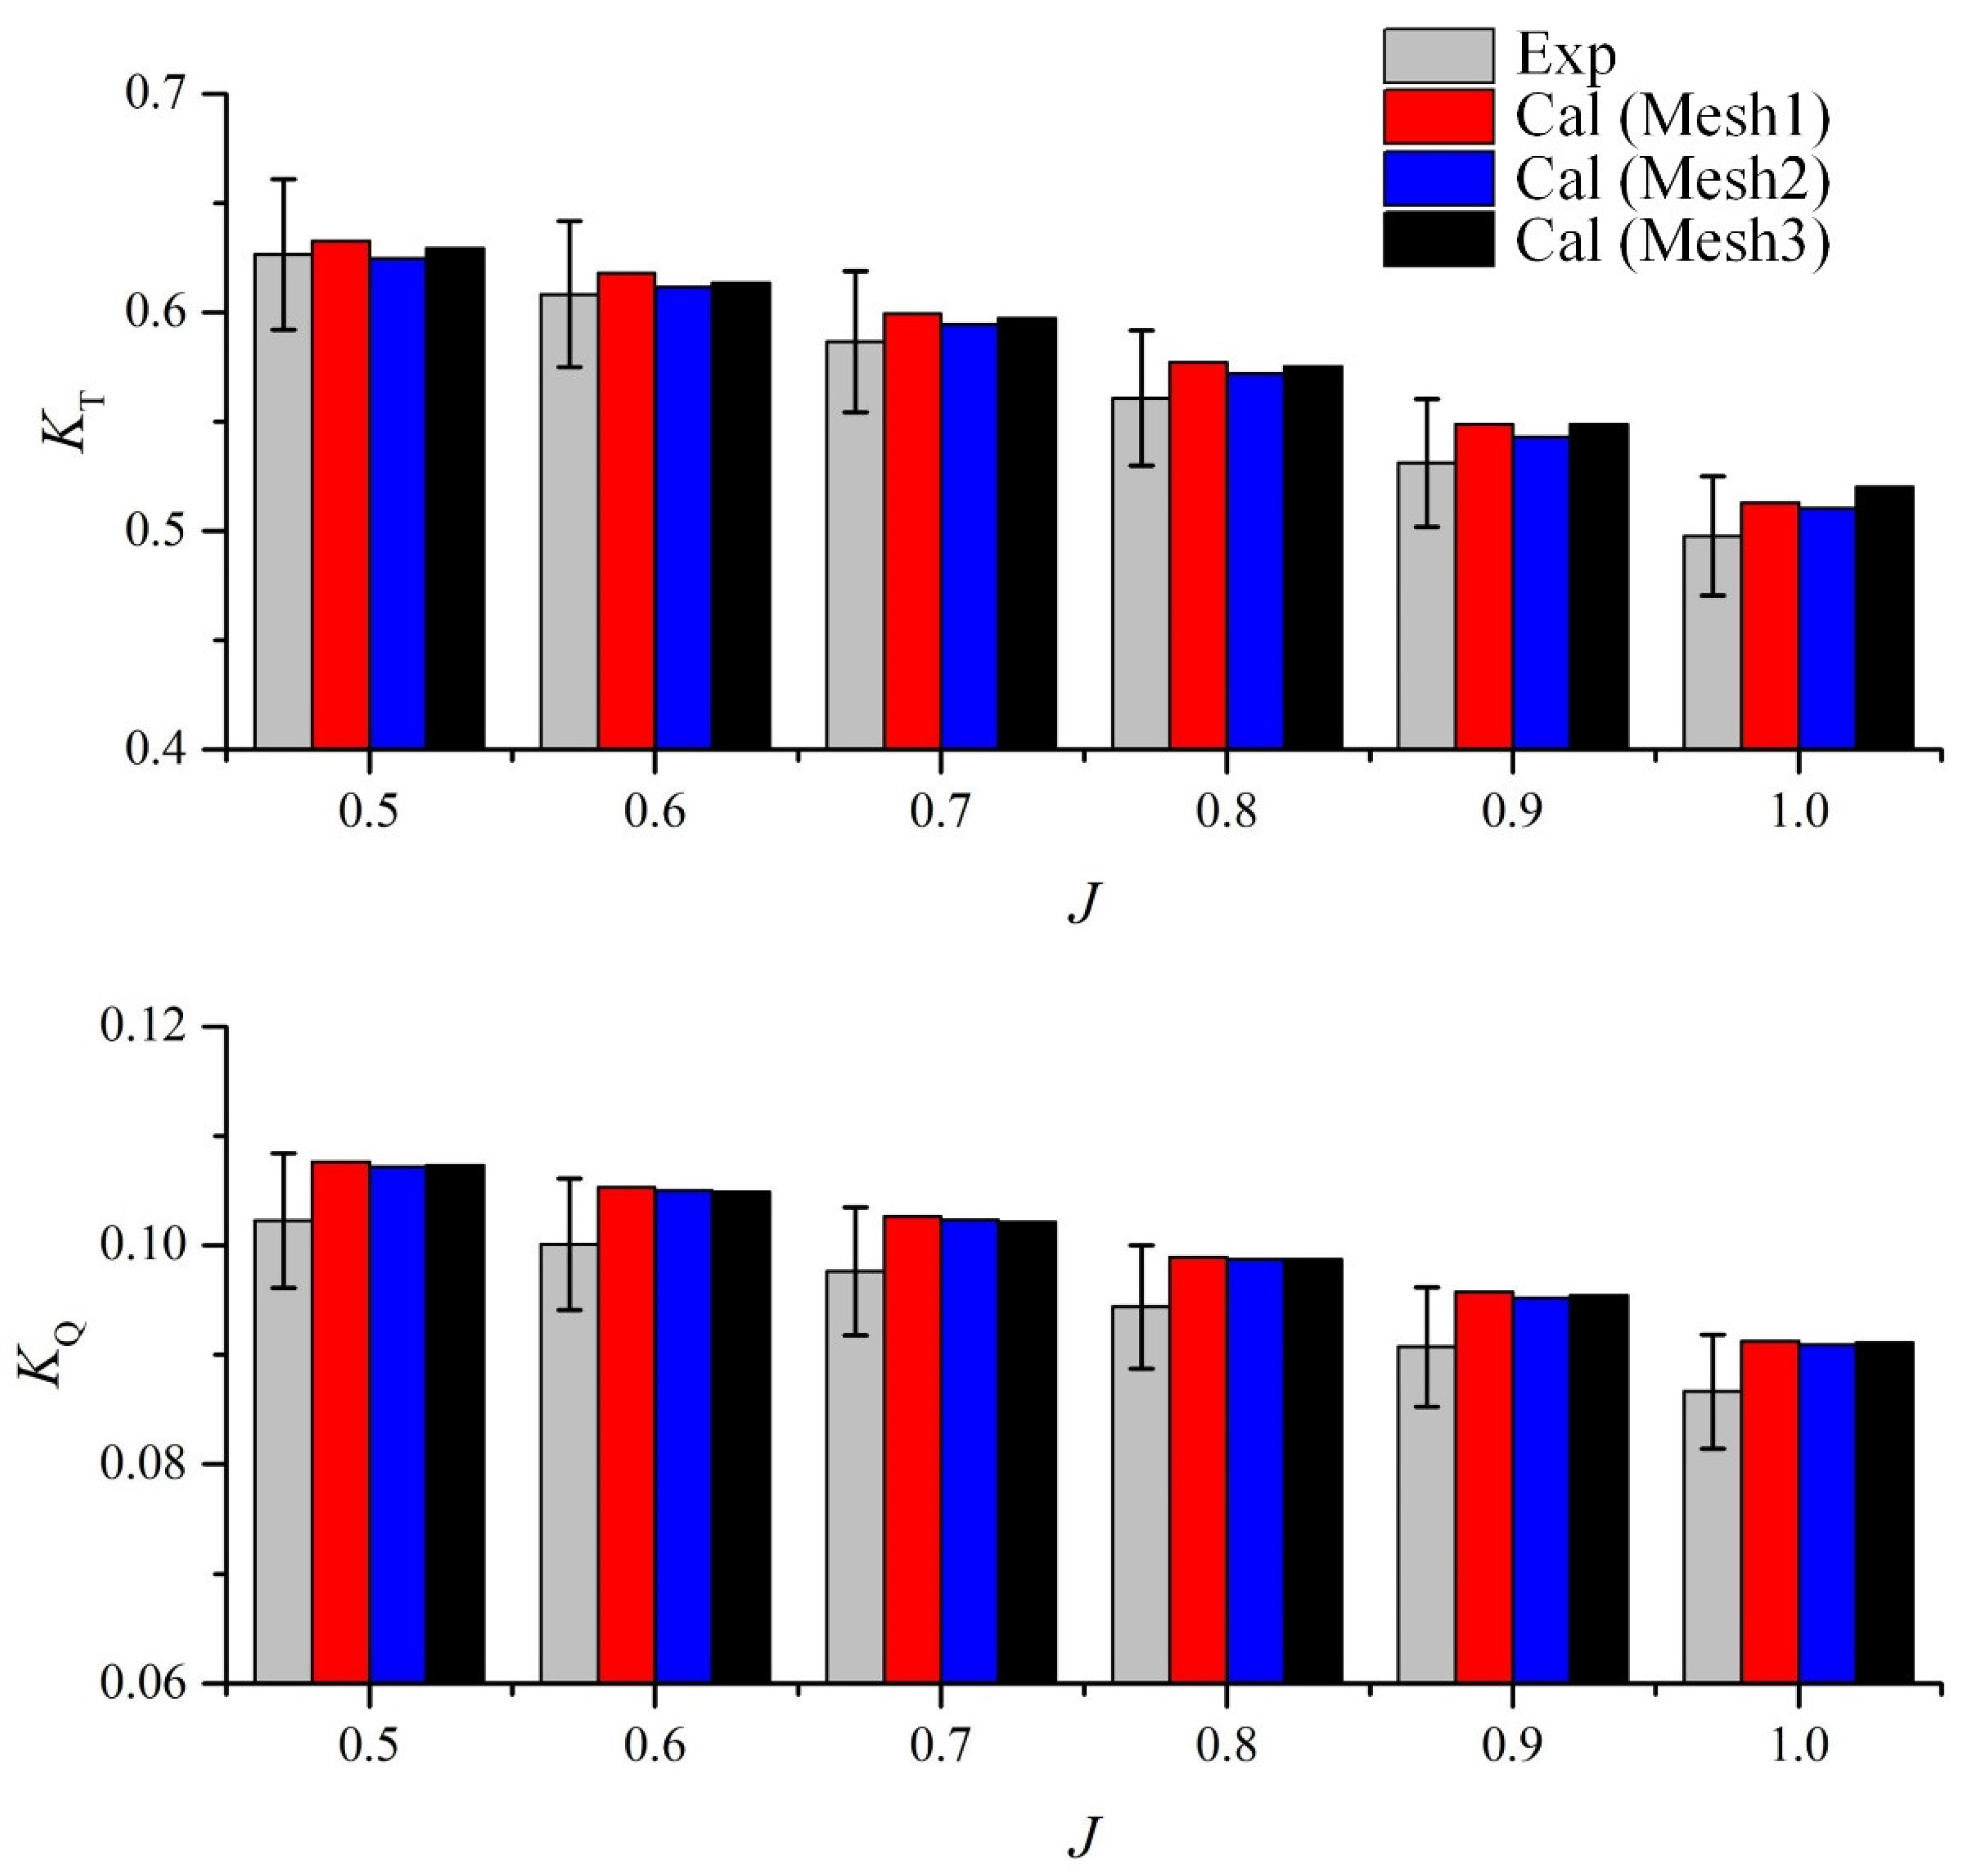
Figure 3 shows the direct plots of the thrust coefficient and torque coefficient and marks the range of relative error within 5% by error bars to compare the experimental [33] and calculated hydrodynamic performance of the waterjet pump. The abscissa is the advance ratio J (J = U/nD) and the ordinates are two dimensionless performance parameters, the thrust coefficient KT (KT = thrust/ρ1n2D4) and the torque coefficient KQ (KQ = torque/ρ1n2D5). The predicted thrust coefficients computed using the three meshes were in good agreement with the experimental data, with a maximum error not exceeding 5% within a relatively wide range of advance ratios. The deviations of the torque coefficients calculated by the three meshes were greater than those of the thrust coefficients, which may have been caused by the small reference values of the torque coefficients, but the predicted torque coefficients also met the simulation requirement. Therefore, the modeling of the waterjet pump, calculation setup, and meshing method in this work were reasonable. This paper focuses on the evolution of vortices and cavitation in the tip clearance. In the following, the mesh selection is carried out by comparing the numerical results of vortices and cavitation calculated by different meshes.
Figure 4 shows the measured and predicted cavitation regions and the predicted vortex structures for the three meshes, where the cavitation structures were visualized by the isosurface of the vapor-volume fraction αv = 0.1 and the vortex structures were visualized by the λ2 [34] criterion with a threshold of −1 × 10⁶ s−2. The results show significant cavitation due to the low pressures for the current calculational conditions. Cavitation was mainly concentrated in the tip clearance and TLV regions. Near the leading edge (LE), the TLV cavity was generated from the SS like the TLV. The cavity in the clearance region, which is collectively referred to as the tip-clearance cavity in this paper, was generated from the PS of the blade tip, then developed from the PS to the SS, and was then rolled up by the TLV cavity to form a triangular cavitation area, as shown by the circular dotted line. Near the trailing edge (TE), the cavity twisted into a cloud and developed downstream, with its shape gradually becoming stable.
The comparison between the experimental observations and the simulation results with the three different meshes shows that all three meshes could accurately simulate the cavity-generation position and evolution. As the grid number increased, the predicted cavity length became closer to that seen in the experiment, as shown by the dotted line in Figure 4, which indicates a fairly large change in the cavity length predicted by Mesh 1 and Mesh 2, whereas the cavity lengths predicted by Mesh 2 and Mesh 3 were almost the same. At the same time, the TLV and IV predicted using Meshes 1 and 2 differed some, whereas those predicted by Meshes 2 and 3 were nearly the same. Thus, the results given by Mesh 2 were used for the following analyses to balance computing consumption and accuracy.

4.2. Vortex Characteristics in the Tip Clearance

4.2.1. Vortex Distribution and Formation Mechanism

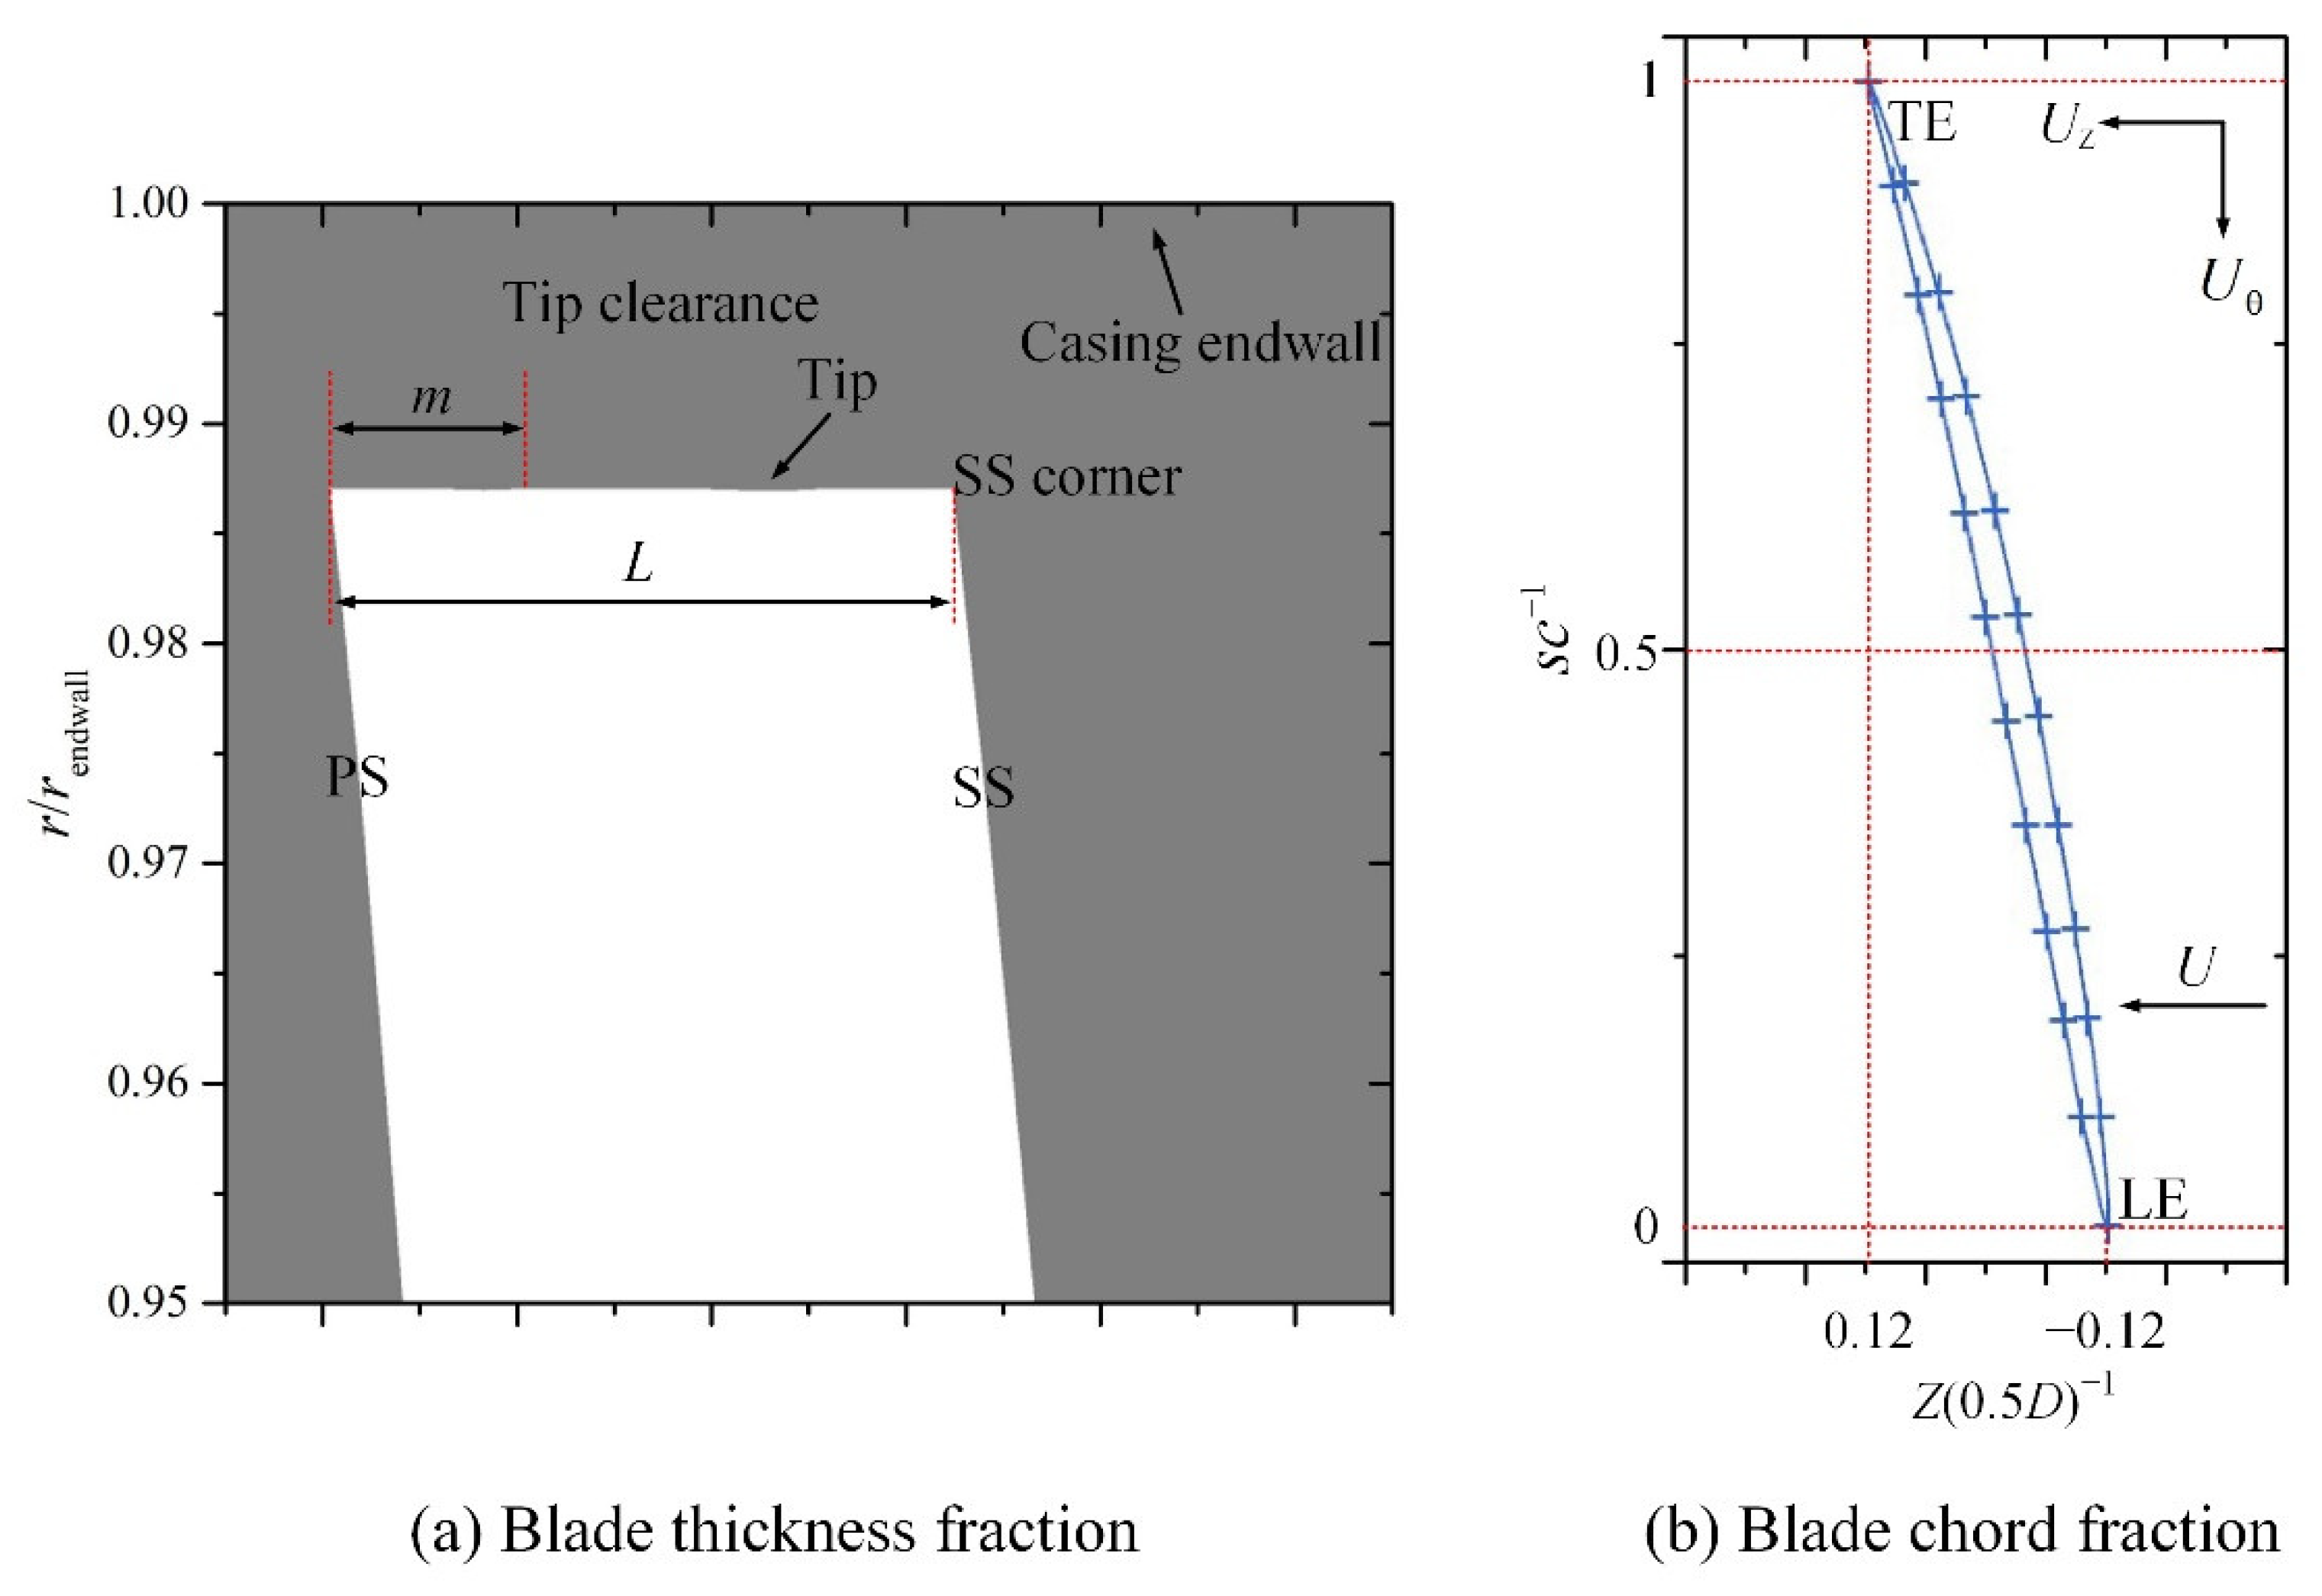
Figure 5 shows the definition of the geometric parameters in the tip clearance. The blade thickness fraction was defined as mL−1, where L is the blade thickness and m is the distance from the monitoring point to the PS, as shown in Figure 5a. The blade-chord fraction was defined as sc−1, where c is the blade chord and s is the distance from the monitoring point to the LE along the blade-chord direction. The blade-chord fraction changes from the LE to the TE are shown in Figure 5b. The radial and axial positions are represented by the dimensionless variables r/rendwall and Z(0.5D)−1, where r is the monitoring-point radial distance, rendwall is the casing-endwall radial distance, and Z is the axial coordinate of the monitoring point.
Figure 6 shows the vortex-distribution and -formation mechanism near the tip clearance to describe the leakage flow and leakage vortex in more detail.
The vortex structures were visualized by the λ2 criterion with a threshold of −6 × 10⁵ s−2, as shown in Figure 6a. The TSV was generated from the PS near the LE. The TLV was generated from the SS near the LE and then moved away from the SS and rolled up some vortices in the clearance. Near the TE, the IV appeared near the clearance and rotated in the opposite direction to that of the TLV. The TLV developed downstream and its morphology gradually stabilized.
These phenomena show that the vortex structures near the clearance are very complex. To further explain the vortex-formation mechanism, the axial-velocity distributions at the 0.5 blade-chord fraction are shown in Figure 6b and the time-averaged circumferential vorticity and velocity vector distributions at the 0.5 blade-chord fraction are shown in Figure 6c,d, where rtip is the blade-tip radial distance, htip is the tip-clearance height, Uz is the axial velocity, and ω c ¯ is the time-averaged circumferential vorticity. Figure 6c shows the vorticity distribution near the blade, whereas Figure 6d shows the vorticity distribution between blades. To show the pressure difference on PS and SS near the tip clearance, the pressure contour is shown in the lower right corner of Figure 6c, with a threshold of 20,000 Pa to 30,000 Pa, which uses the same legend color as the vorticity contour. The pressure contour shows that a huge pressure difference was captured near the blade tip PS.
The results in Figure 6b and c show that for small blade-thickness fractions, the axial velocity changed from positive to negative along the direction from the blade tip to the casing endwall. It indicates that the free flow near the blade tip separated near the PS due to the effect of the pressure difference, resulting in generation of the TSV near the PS. There was a large amount of tip-leakage flow from the middle of the clearance to the casing endwall, which had a high negative axial velocity and interacted with the free flow existing near the blade tip. Consequently, a shear vortex was also generated in the clearance in addition to the TSV. For large blade-thickness fractions, the tip-leakage flow negative-axial velocity was very large, resulting in the formation of wall jets and the TLV near the SS. The TLV then led to the IV being generated in the boundary layer of the casing endwall and rotating in the opposite direction to that of the TLV. Figure 6b also shows that the flow reattached near the SS, but the actual reattachment location cannot be seen in the qualitative vector diagram.
Figure 6d shows that the pressure difference near the PS caused the channel fluid to roll up, whereas the TLV generated by the previous blade caused the channel fluid to roll down, so only a small amount of fluid entered the tip clearance.

4.2.2. Vortex Evolution

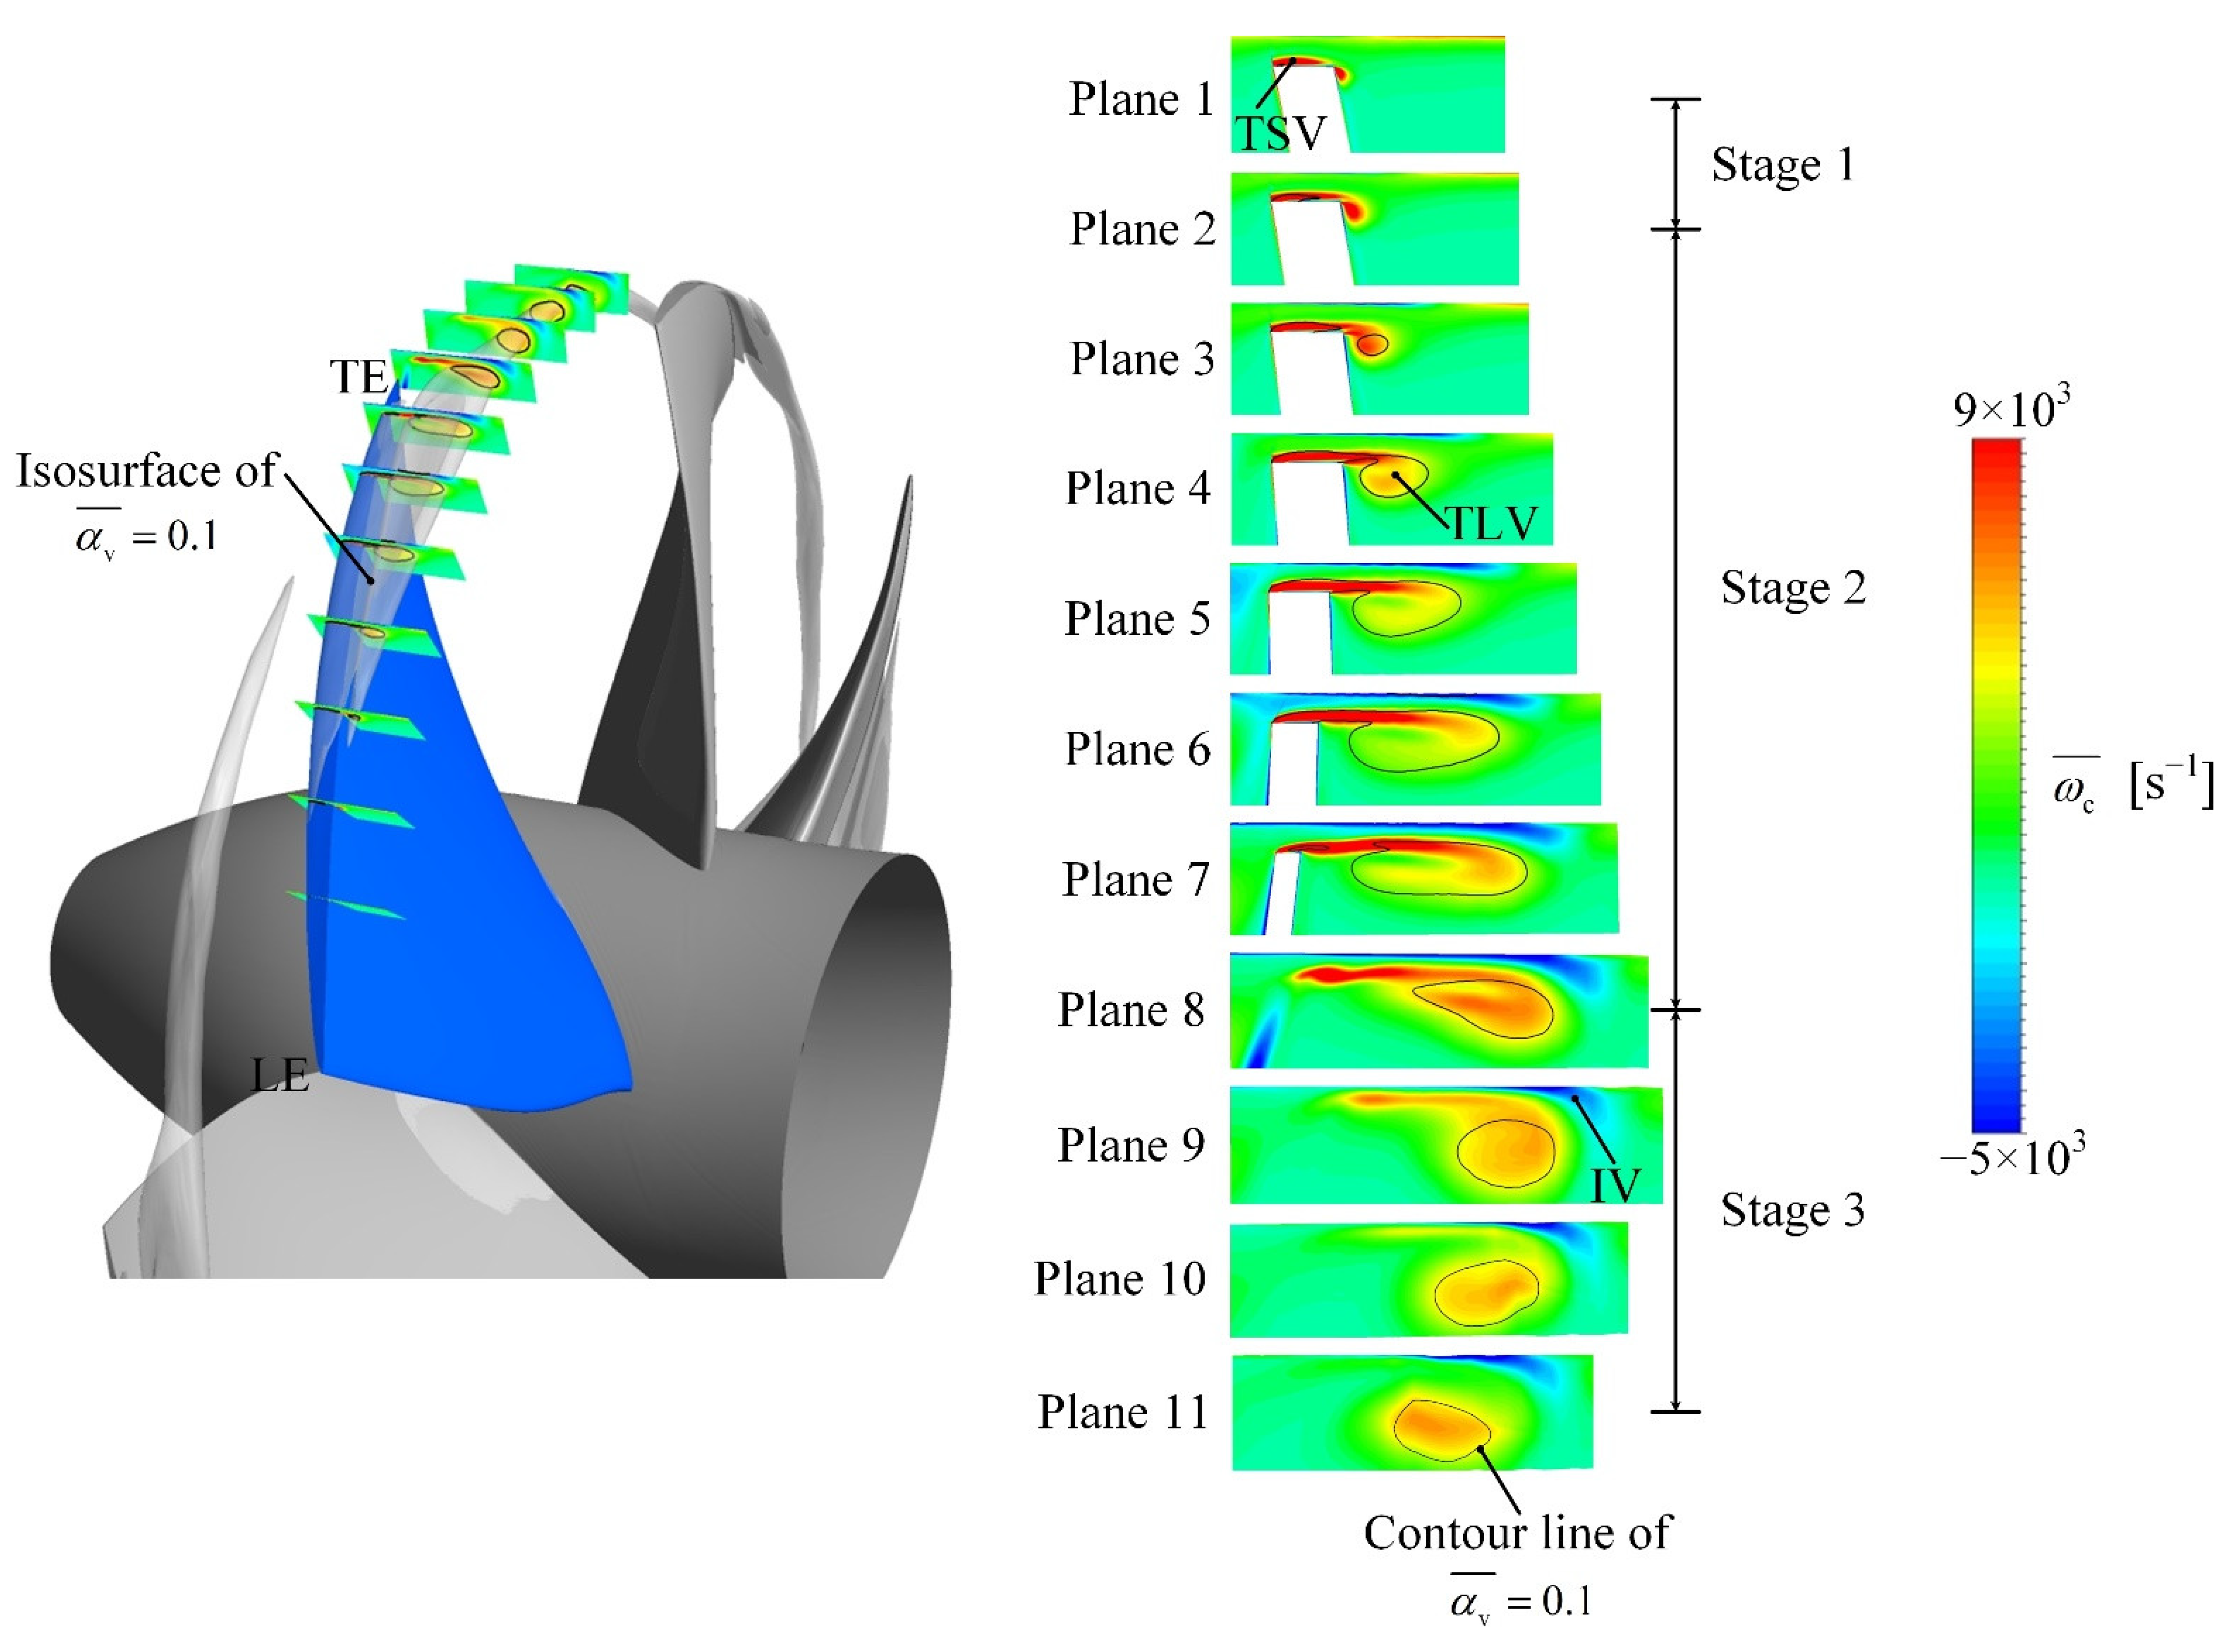
Figure 7 shows the vortex evolution with cavitation and gives 11 planes from the LE to the TE to reveal the development stages of vortices, with the cavities presented by the isosurface of the time-averaged vapor volume fraction α v ¯ = 0.1. The time-averaged circumferential vorticity distributions and the α v ¯ = 0.1 contour lines are shown on the planes. The vortex evolution can be divided into three stages. The TSV and the TLV develop independently during Stage I, the TSV approaches and gradually merges into the TLV during Stage II, and the IV develops and interacts with the TLV during Stage III. Cheng et al. [30] obtained the same results for TLV cavitating flow around a straight NACA0009 hydrofoil. During Stage I, the TSV is generated at the PS corner of the blade tip, whereas the TLV is generated at the SS corner of the blade tip. The TLV and TSV are separated by the blade tip and interact very little with each other. This stage has a very small TLV cavity and a larger TSV cavity. The vortices and cavitation develop to begin Stage II, where the TSV is rolled up by the TLV and gradually merges into the TLV. The IV is seen near the boundary layer of the casing endwall rotating in the opposite direction to that of the TLV. The TLV cavity begins to grow and the TSV cavity extends from the PS to the SS, eventually merging into the TLV cavity. Then, the final stage begins as the TSV and TLV almost finish combining. The IV detaches from the boundary layer of the casing endwall and interacts with the TLV. The cavity twists into a cloud and develops downstream steadily. According to Leweke et al. [35], the TLV cannot remain stable when interacting with IV, so the TLV dissipates as it moves downstream.
Figure 7 shows that the vorticity inside the TLV cavity decreased from Plane 1 to Plane 6, then increased from Plane 7 to Plane 8, and then became relatively stable from Plane 9 to Plane 11. This phenomenon differs from that observed by Cheng et al. [30], who found that the vorticity inside the TLV cavity decreased as the TLV developed around a hydrofoil, which indicates that the vortex dynamic characteristics in the waterjet pump cannot be accurately predicted through the calculation of hydrofoils. The potential causes for this phenomenon are further explored below.

4.3. Influence of the Cavitation on the Vortex Evolution

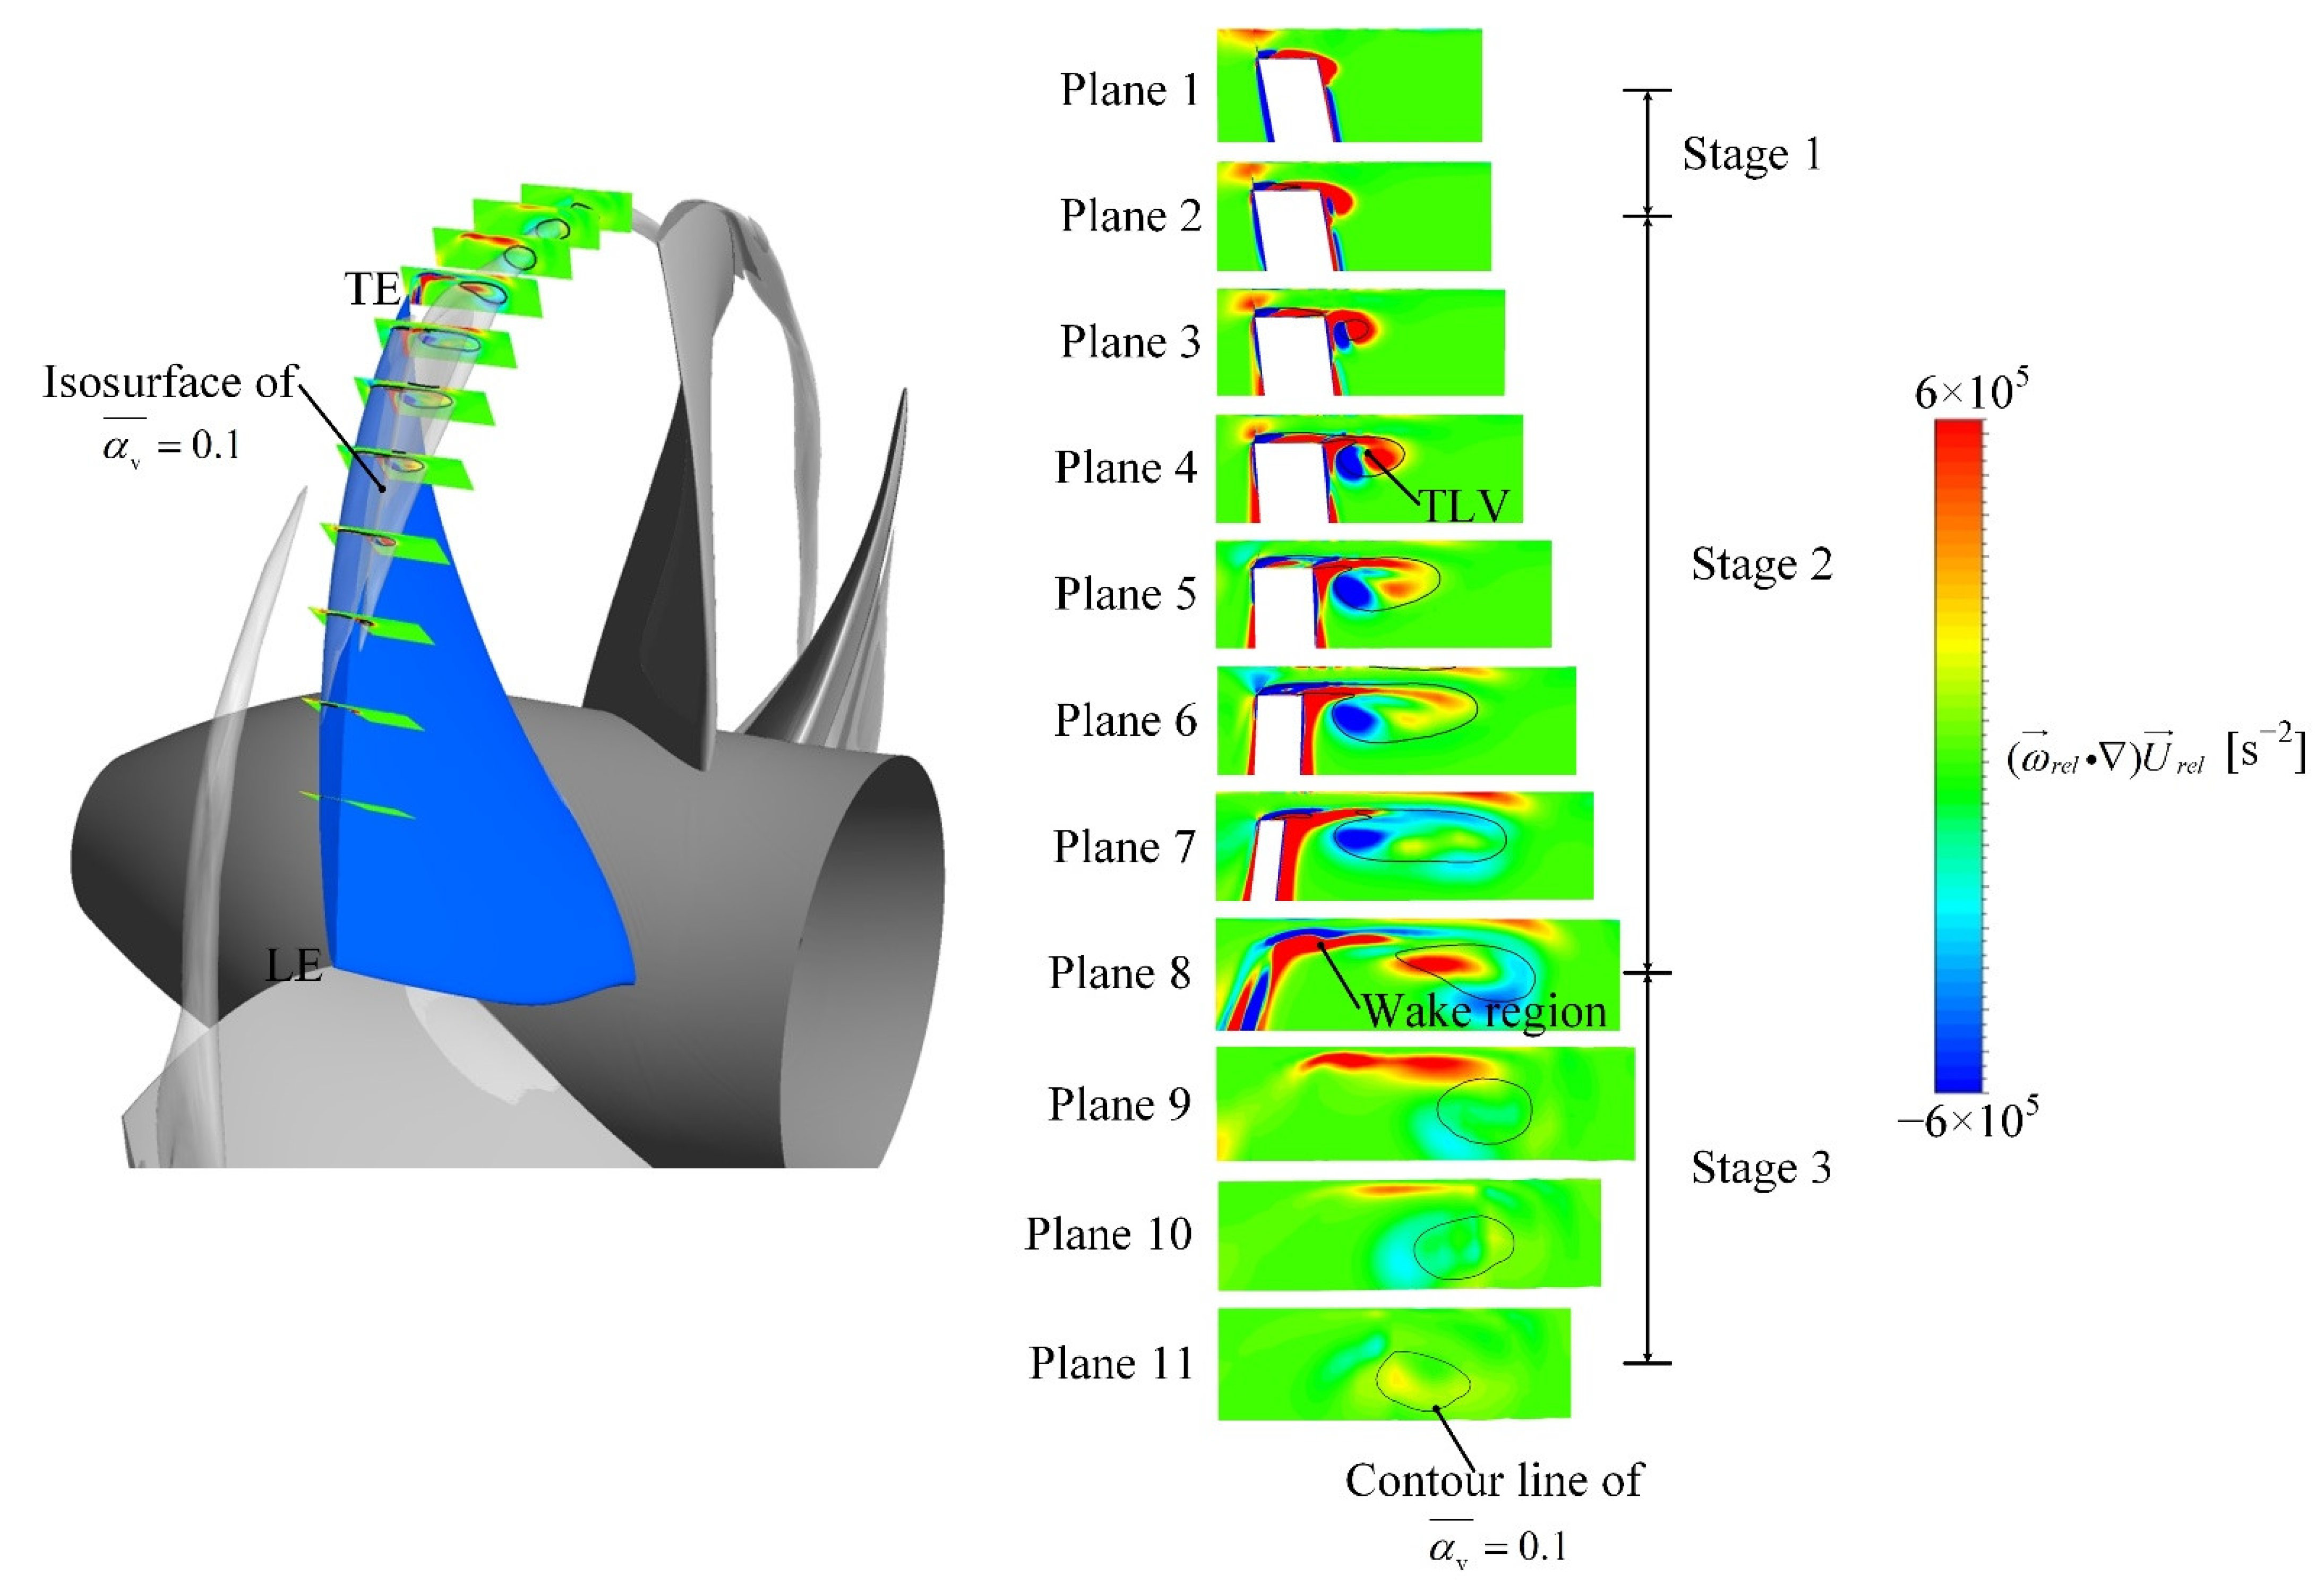
Cheng et al. [30] used a stationary hydrofoil with tip clearance to calculate the vortex evolution without considering the effects of rotation and geometric differences, resulting in the deviation between the calculated results and the real observations of the rotating machinery. The results obtained from stationary hydrofoil calculation cannot accurately reflect the TLV evolution in the waterjet pump observed in Figure 7. To better explore the mechanism driving the vorticity variation seen in Figure 7, the relative vorticity transport equation was used here [36]:
ω r e l t = ( ω r e l ) U r e l ω r e l ( U r e l ) + ρ m × p ρ m 2 + υ 2 ω r e l 2 × ( n × U r e l )
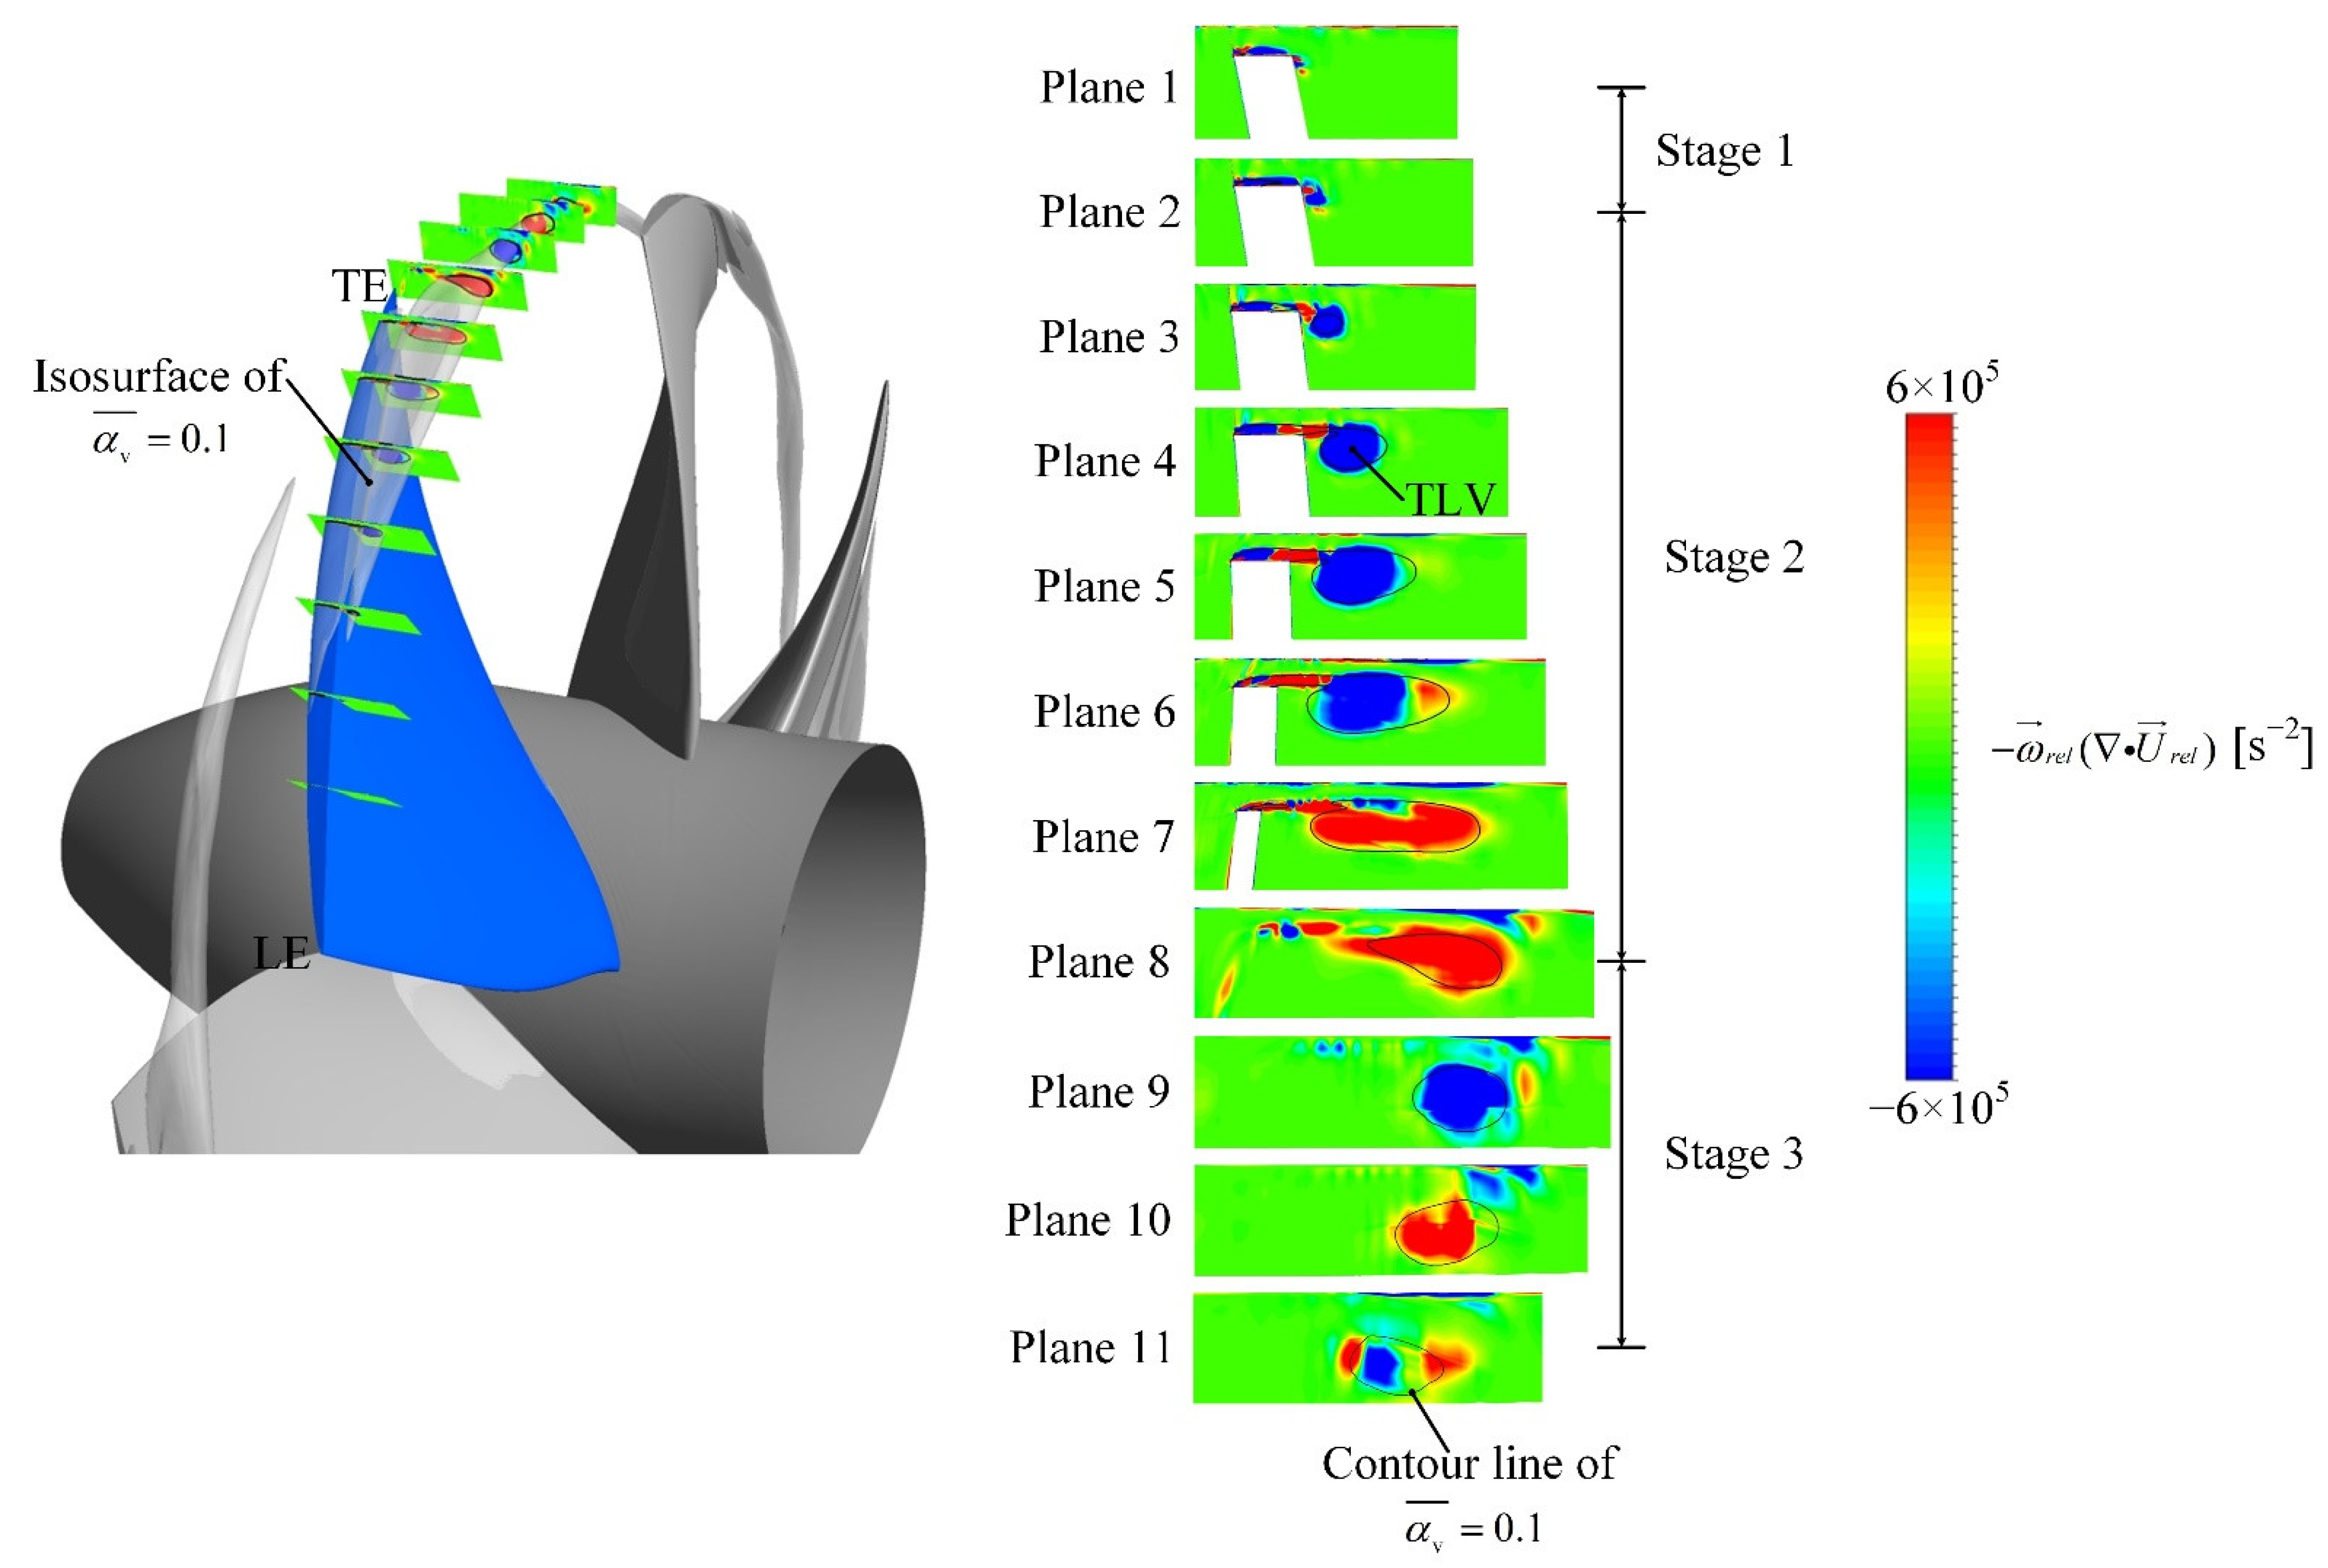
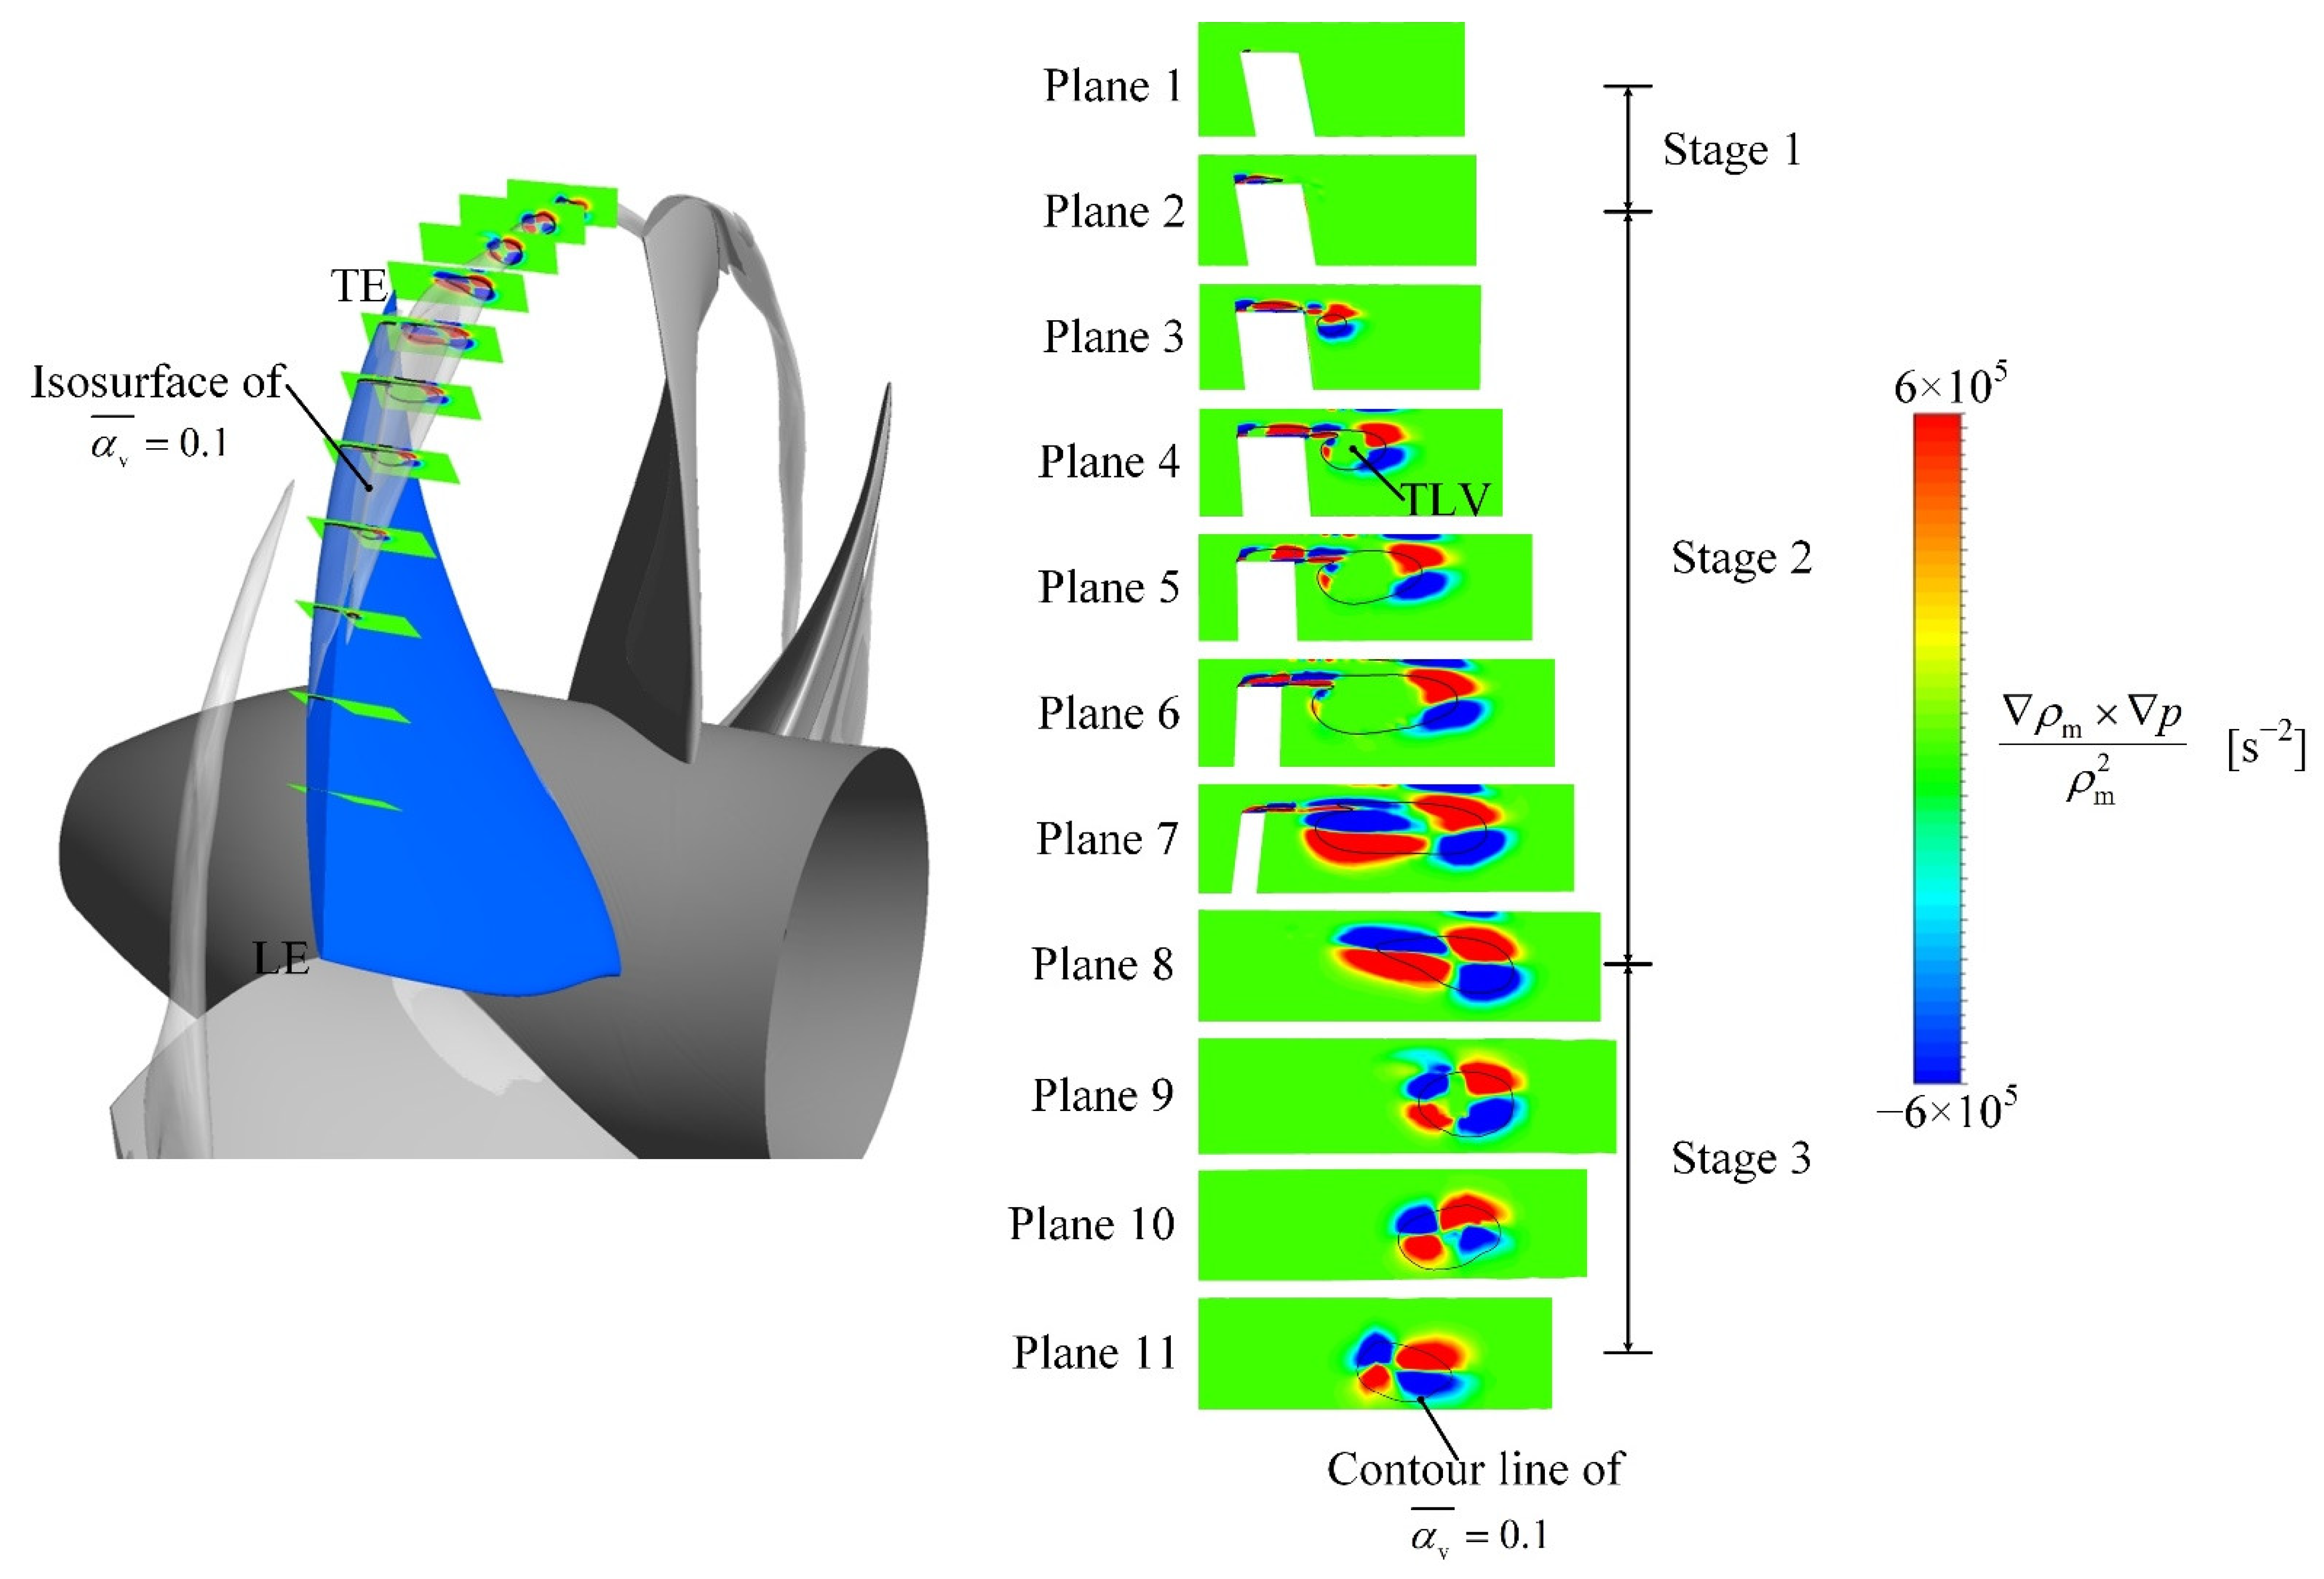
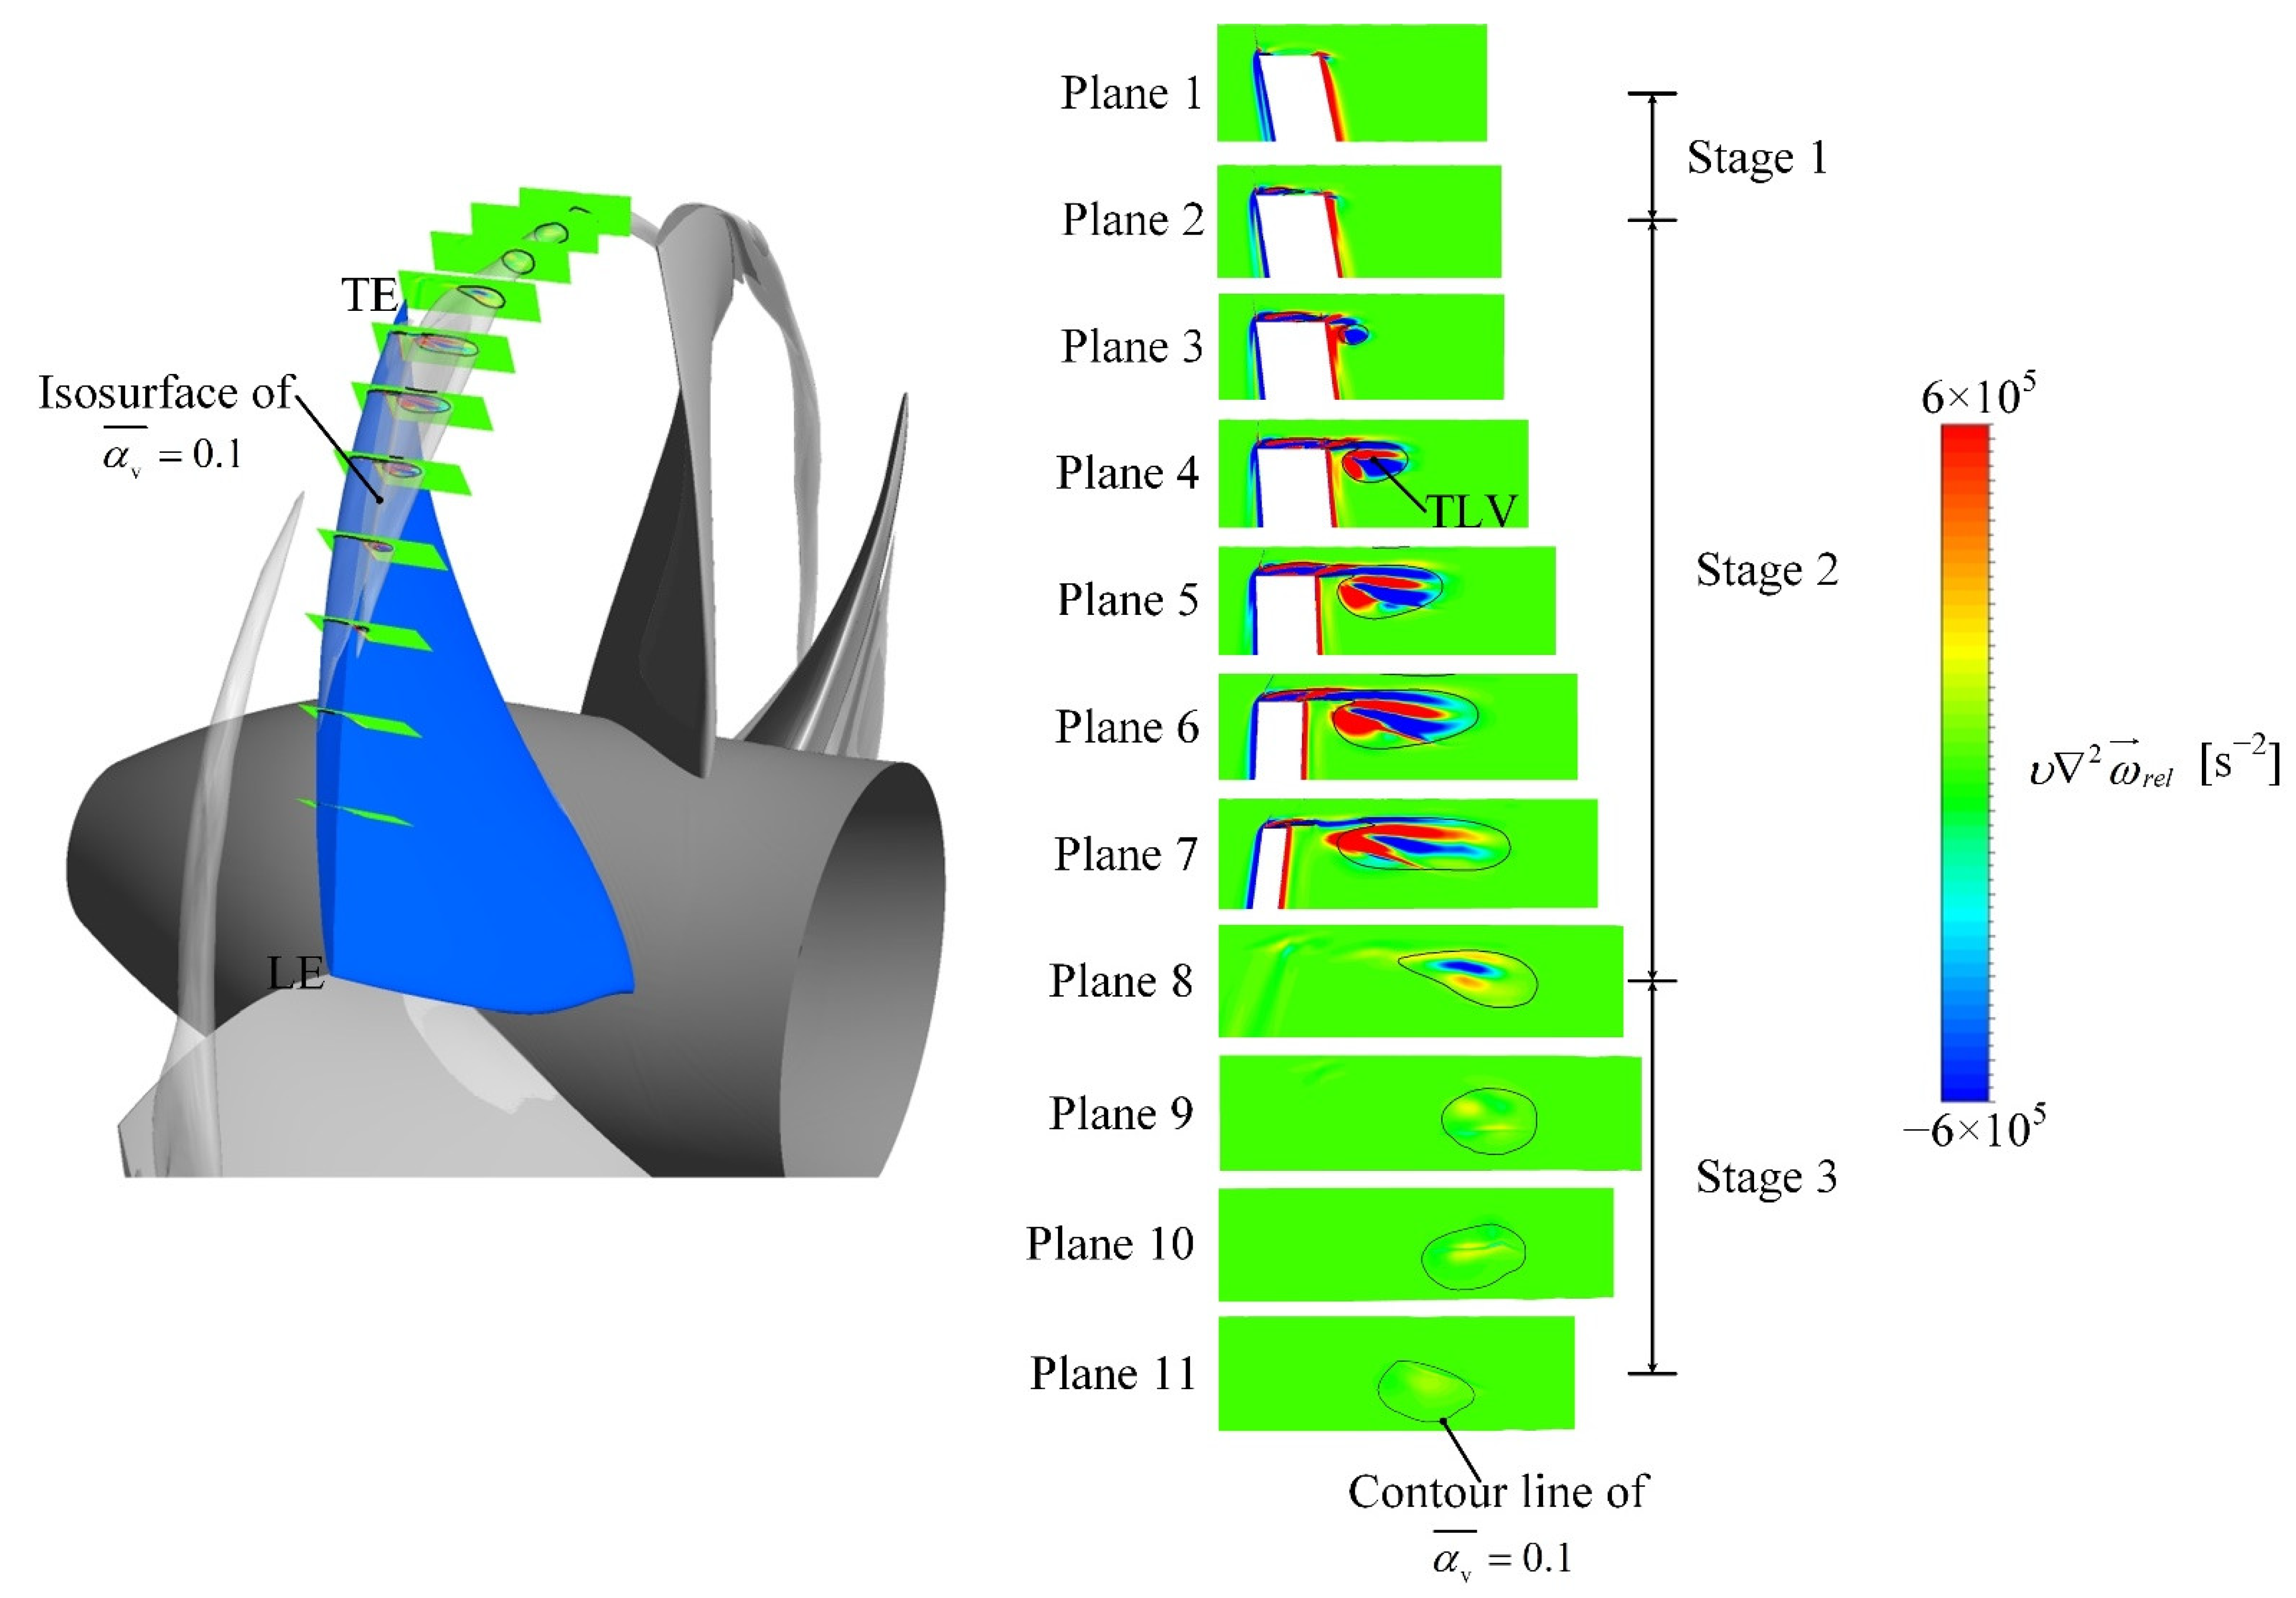
where Urel is the relative velocity, ωrel is the relative vorticity, ▽ is the Hamiltonian operator, and the subscript rel represents variables in cylindrical coordinates. The left side of Equation (25) is the rate of change of the vorticity with time, the first term on the right side of Equation (25) is the vortex stretching-and-bending term caused by the velocity gradients, the second term is the vortex-dilatation term caused by the fluid volume change, the third term is the vortex baroclinic-torque term caused by the misalignment of the density and pressure gradients, the fourth term is the viscous-diffusion term caused by the fluid viscosity, and the fifth term is the Coriolis-force term caused by the rotation, which is much smaller than the other terms and whose effect on the vortex evolution can be ignored here.
Figure 8, Figure 9, Figure 10 and Figure 11 show the distributions of the stretching-and-bending, dilatation, baroclinic-torque, and viscous-diffusion terms near the tip clearance. The planes and the visualization of the cavities are consistent with those in Figure 7.
As shown in Figure 8, the larger vortex stretching-and-bending terms were concentrated in the cavitation region and the wake region. This shows that large vorticity variation was caused by the velocity gradients due to the complex flow and the cavitation. The TLV cavitation region had both positive and negative vortex stretching-and-bending terms from Plane 1 to Plane 8, with the values then almost zero from Plane 9 to Plane 11. Thus, the vortex stretching-and-bending term cannot intuitively explain the TLV vorticity variation observed in Figure 7.
Figure 9 shows the vortex-dilatation term distribution near the tip clearance. The largest values were concentrated in the cavitation region. Negative values were observed in the TLV cavitation region from Plane 1 to Plane 6, indicating that the vorticity in the TLV region would decrease due to the fluid-volume change during this process. From Plane 7 to Plane 8, the value in the TLV cavitation region was positive, resulting in a vorticity increase in the TLV. Plane 9 to Plane 11 had both positive and negative values that alternated in the TLV cavitation region and were evenly distributed, leading to little change in the vorticity in the TLV. Thus, the vorticity variation caused by the vortex-dilatation term conforms to that in Figure 7, which is probably the main reason for the phenomenon observed in Figure 7.
The cavitation changes the fluid volume and thus the vortex moment of inertia which also changes the vorticity. When the cavity volume starts to increase, the vortex radius then increases; at the same time, the vorticity starts to decrease, and vice versa. The comparison between the experimental results of the waterjet pump and the hydrofoil [30] shows that the fusion of the TSV cavity and the TLV cavity in the waterjet pump was more intense, resulting in a triangular cavitation region, as shown in Figure 4, which is difficult to reproduce with stationary hydrofoil simulation. The contour line of α v ¯ = 0.1 in Figure 7 shows that the TLV cavity developed into the triangular cavitation region with an increase in volume and left the triangular cavitation region with a decrease in volume and then stayed at a relatively stable volume. The cavity-volume variation shows that the variations of the vortex-dilatation term in the waterjet pump and around a hydrofoil were different, which is probably the main reason for why the vorticity variation in the TLV observed in Figure 7 is different from that observed by Cheng et al. [30].
Figure 10 shows the vortex baroclinic-torque term distribution near the tip clearance, which was mainly concentrated at the vapor–liquid interface. The cavitation changed the fluid density, which led to misalignment of the density and pressure gradients at the vapor–liquid interface, which affected the vorticity.
In Figure 11, the viscous-diffusion term was mainly concentrated in the cavitation region. The fluid viscosity created a shear force between the fluid with the velocity gradient, which was accompanied by vorticity generation, dissipation, and diffusion. The viscous-diffusion term distribution indicates that the viscous shear strongly influenced the vorticity in the cavitation region from Plane 1 to Plane 7. When the TLV developed downstream from Plane 8 to Plane 11, the viscous shear had little effect on the vorticity in the TLV cavitation region.

4.4. Entropy-Production Features in the Tip Clearance

According to the above discussions based on the relative-vorticity-transport equation, it can be found that the complex cavitation evolution in the waterjet pump significantly affected the vorticity variation. Previous studies have proven that the enstrophy dissipation rate Ω = μ|ω′|2, defined by vorticity ω′ and viscosity µ, is directly related to energy dissipation [37,38]. It indicates that the vorticity variation affects the energy dissipation during operation, which should be a concern. From the perspective of macroscopic thermodynamics, entropy production can reflect dissipation losses caused by irreversible factors in a system. The entropy production-evaluation method was used here to analyze the energy losses in the complex cavitation region [39,40].
As for incompressible fluids, the entropy-production rate can be written as follows [41]:
S EP = Φ T
where Φ is the viscous-dissipation function, which is closely related to the enstrophy-dissipation rate [37]. T is the temperature, which was maintained at 298K in this study.
The flow in the waterjet pump was highly turbulent. The entropy-production rate in turbulent flow can be divided into two parts after the Reynolds time-averaged processes: One is the entropy-production rate caused by time-averaged velocity S EP D ¯ , and the other is the entropy-production rate caused by fluctuating velocity S EP D . The entropy-production rate in turbulent flow can be written as:
S EP = S EP D ¯ + S EP D
S EP D ¯ = μ eff T [ 2 { ( u ¯ x ) 2 + ( v ¯ y ) 2 + ( w ¯ z ) 2 } + ( u ¯ y + v ¯ x ) 2 + ( u ¯ z + w ¯ x ) 2 + ( v ¯ z + w ¯ y ) 2 ]
S EP D = μ eff T [ 2 { ( u x ) 2 + ( v y ) 2 + ( w z ) 2 } + ( u y + v x ) 2 + ( u z + w x ) 2 + ( v z + w y ) 2 ]
where u ¯ is the time-averaged velocity, u is the fluctuating velocity, μ eff is the effective viscosity, and μ eff = μ + μ t , μ t is the eddy viscosity.
This section focuses on the energy losses near the blade tip, wherein the RANS model was used to simulate the flow. However, the RANS model cannot solve the fluctuating velocity. Some reports proposed other feasible methods to evaluate the losses caused by fluctuating velocity, which identified the entropy-production rate caused by fluctuating velocity as follows based on the k-ω turbulence model [42,43,44]:
S EP D = β ρ ω k T ( β = 0.09 )
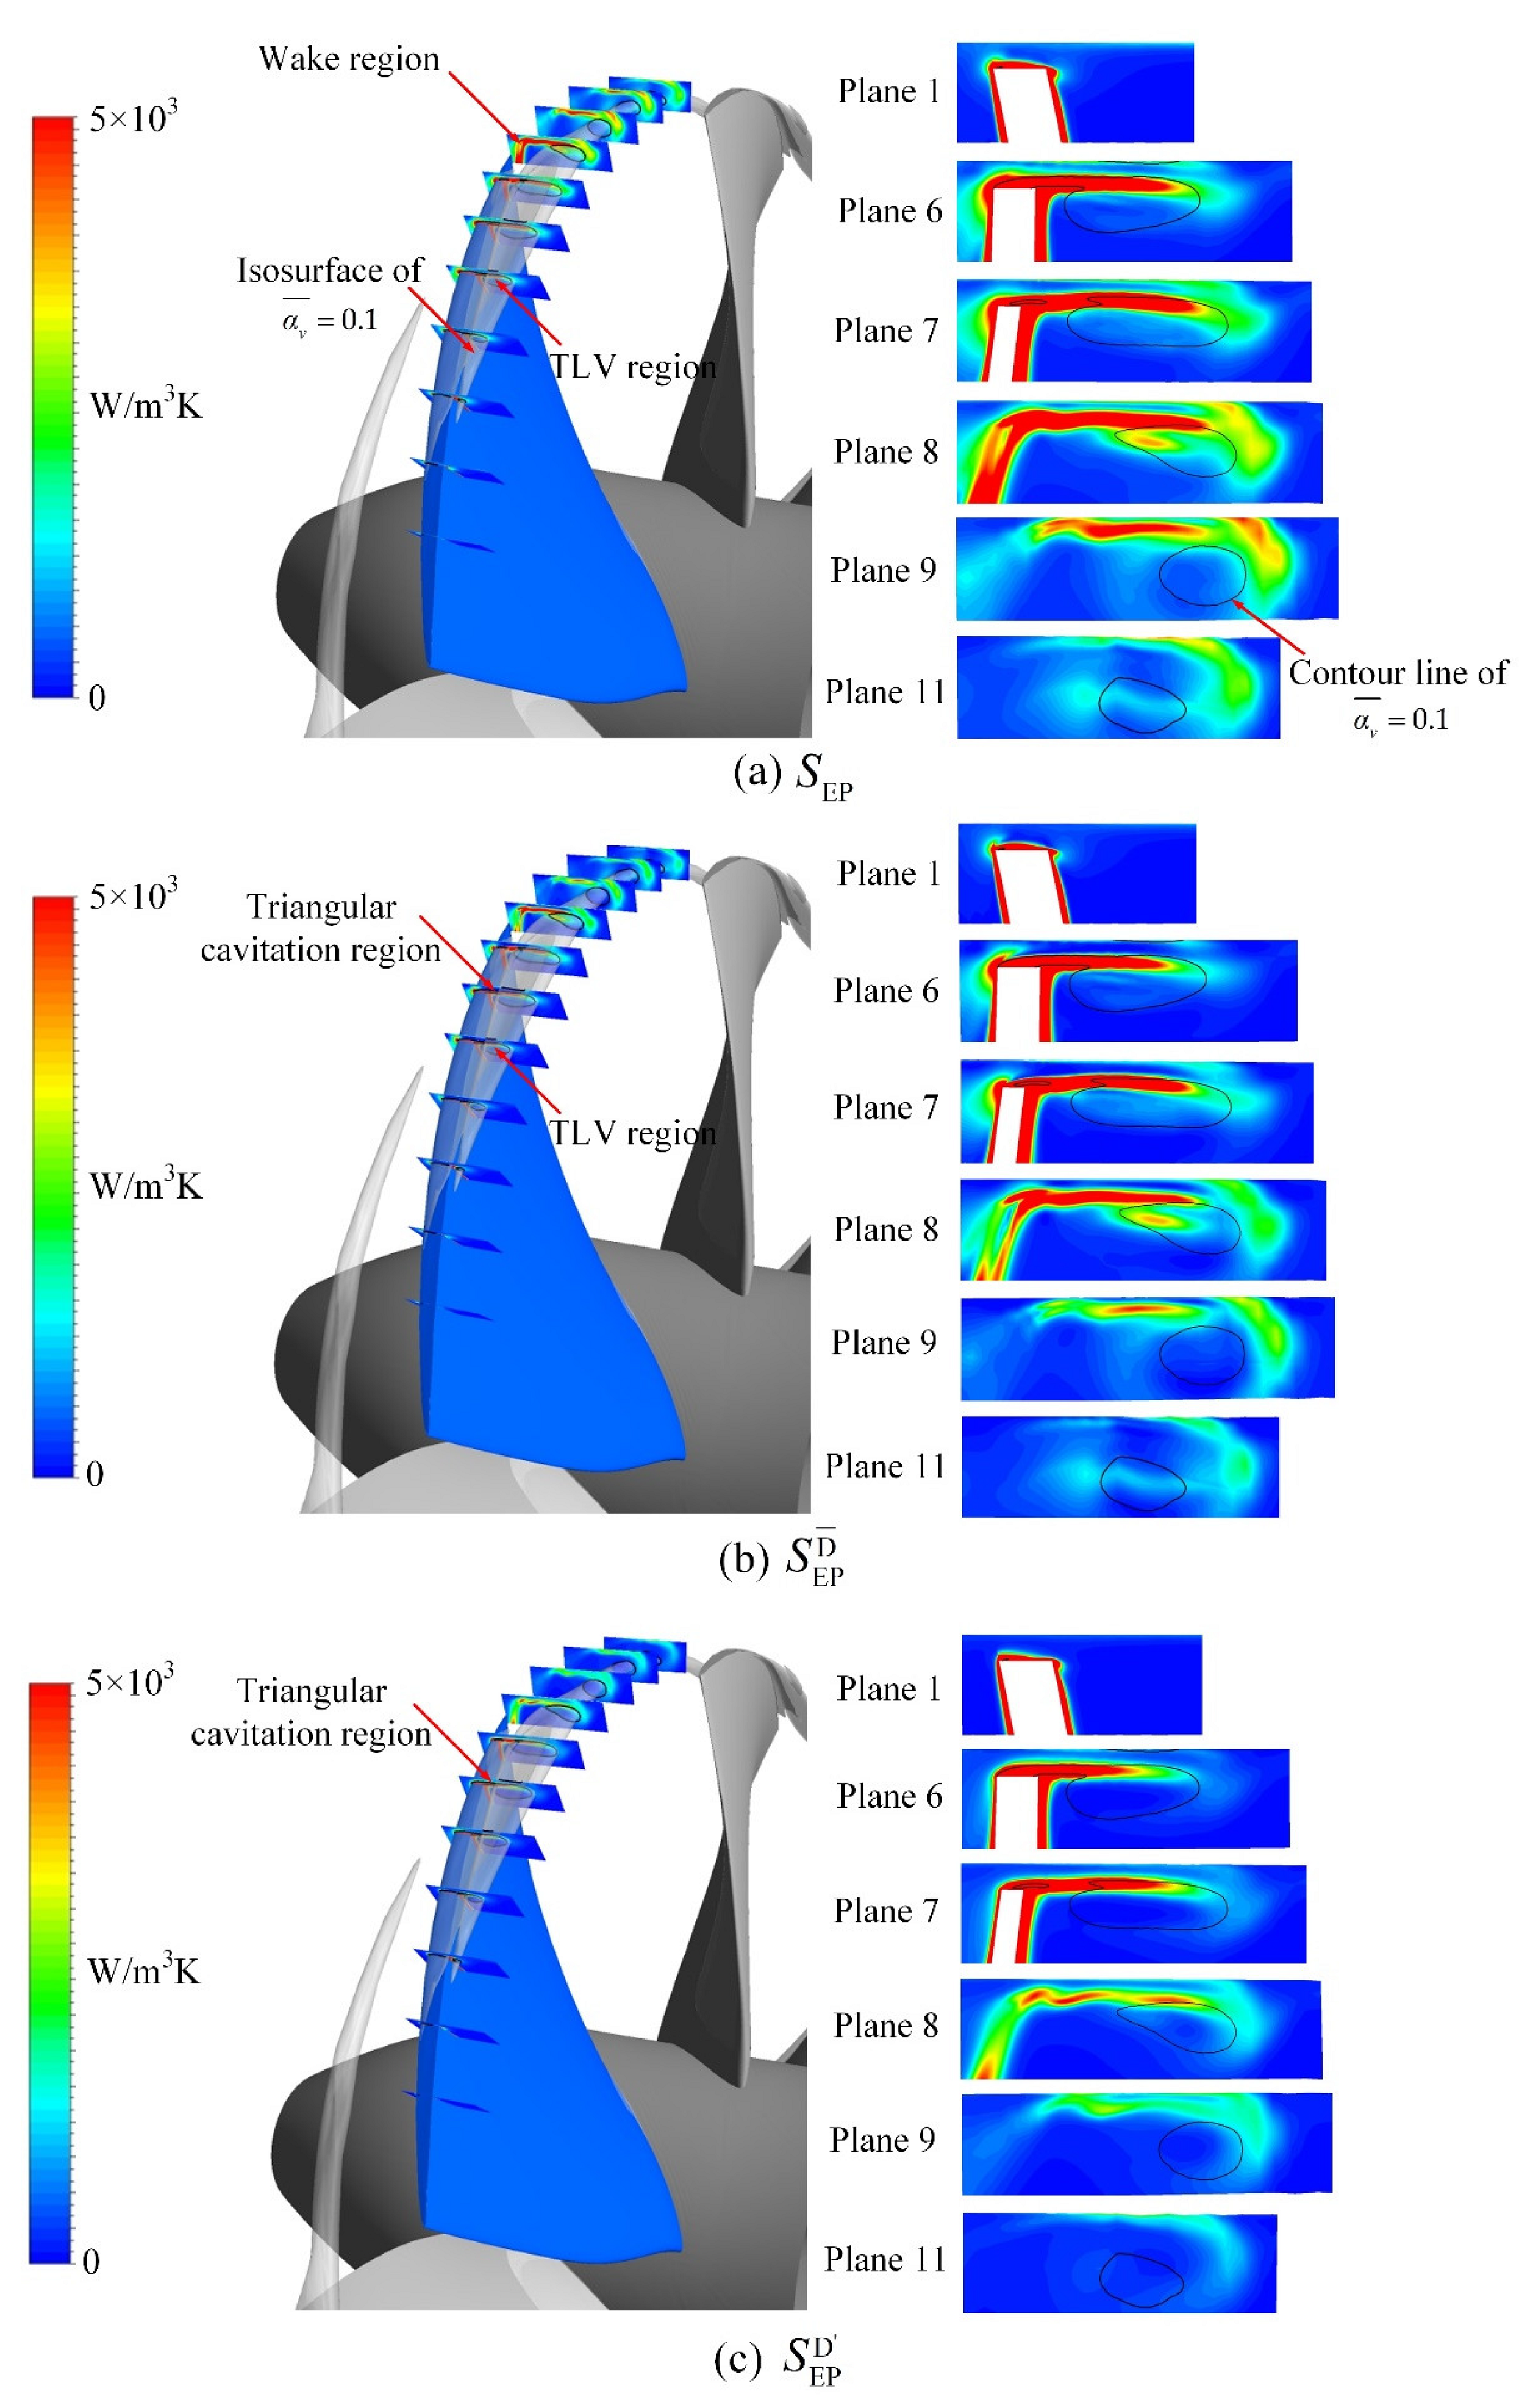
Figure 12 shows the distributions of the total entropy-production rate, the entropy-production rate caused by time-averaged velocity, and the entropy-production rate caused by fluctuating velocity. The TLV evolution, including its emergence, merger with TSV, and downstream development, could be captured through the planes used in Figure 7, with cavity structures identified by the isosurface of α v ¯ = 0.1. The peak values of total entropy production rate were concentrated in the location of the vorticity peaks in Figure 7 and the wake region, which reveals that the vorticity accumulation and the complex wake flow can cause great dissipation losses near the tip clearance. Near the TLV region, the values of the total entropy-production rate and entropy-production rate caused by time-averaged velocity decreased from Plane 1 to Plane 6, then increased from Plane 7 to Plane 8, and then became relatively stable from Plane 9 to Plane 11, which is consistent with the vorticity-variation process shown in Figure 7. This variation process does not appear in the variation of the entropy-production rate caused by fluctuating velocity, indicating that the vorticity variation in the TLV region influenced by the complex cavitation evolution mainly affected the distribution of dissipation loss through the time-average-velocity field. The peak values of the entropy-production rate caused by the time-averaged velocity and the entropy-production rate caused by fluctuating velocity both appeared in the triangular cavitation region with large vorticity, as shown in Figure 7. It is shown that the intensified fusion of the TLV and the TSV in the waterjet pump caused the increaseme in vorticity and the disturbance of the flow field, thus increasing the energy dissipation in the time-average-velocity field and pulsating-velocity field.
The original entropy-production evaluation equation is based on the assumption that the fluid is incompressible [39,40], which can reflect the influence of complex flow on energy losses in the flow field without considering the effects of phase transition. The cavitation occurs in the waterjet pump with the rapid generation and collapse of the bubbles. As the phase transition between vapor and fluid is very violent, the energy losses caused by interphase interaction cannot be ignored. To further describe the effects of interphase interaction, Joseph [45] combined the entropy-production-rate expression and the mixture internal-energy equation considering the phase-transition process to optimize the original entropy-production evaluation method. Wang et al. [46] simplified the equation proposed by Joseph and obtained the entropy-production rate caused by interphase interaction, which can be expressed as follows:
S EP σ = 2 H c σ T m ρ v
where H c is the mean curvature of the bubble, σ is the surface tension of a bubble, and m is the interphase mass-transfer rate. The interface entropy-production rate S EP σ considers the effects of surface tension and curvature of the phase interface, directly reflecting the effects of interphase mass transfer on energy losses.
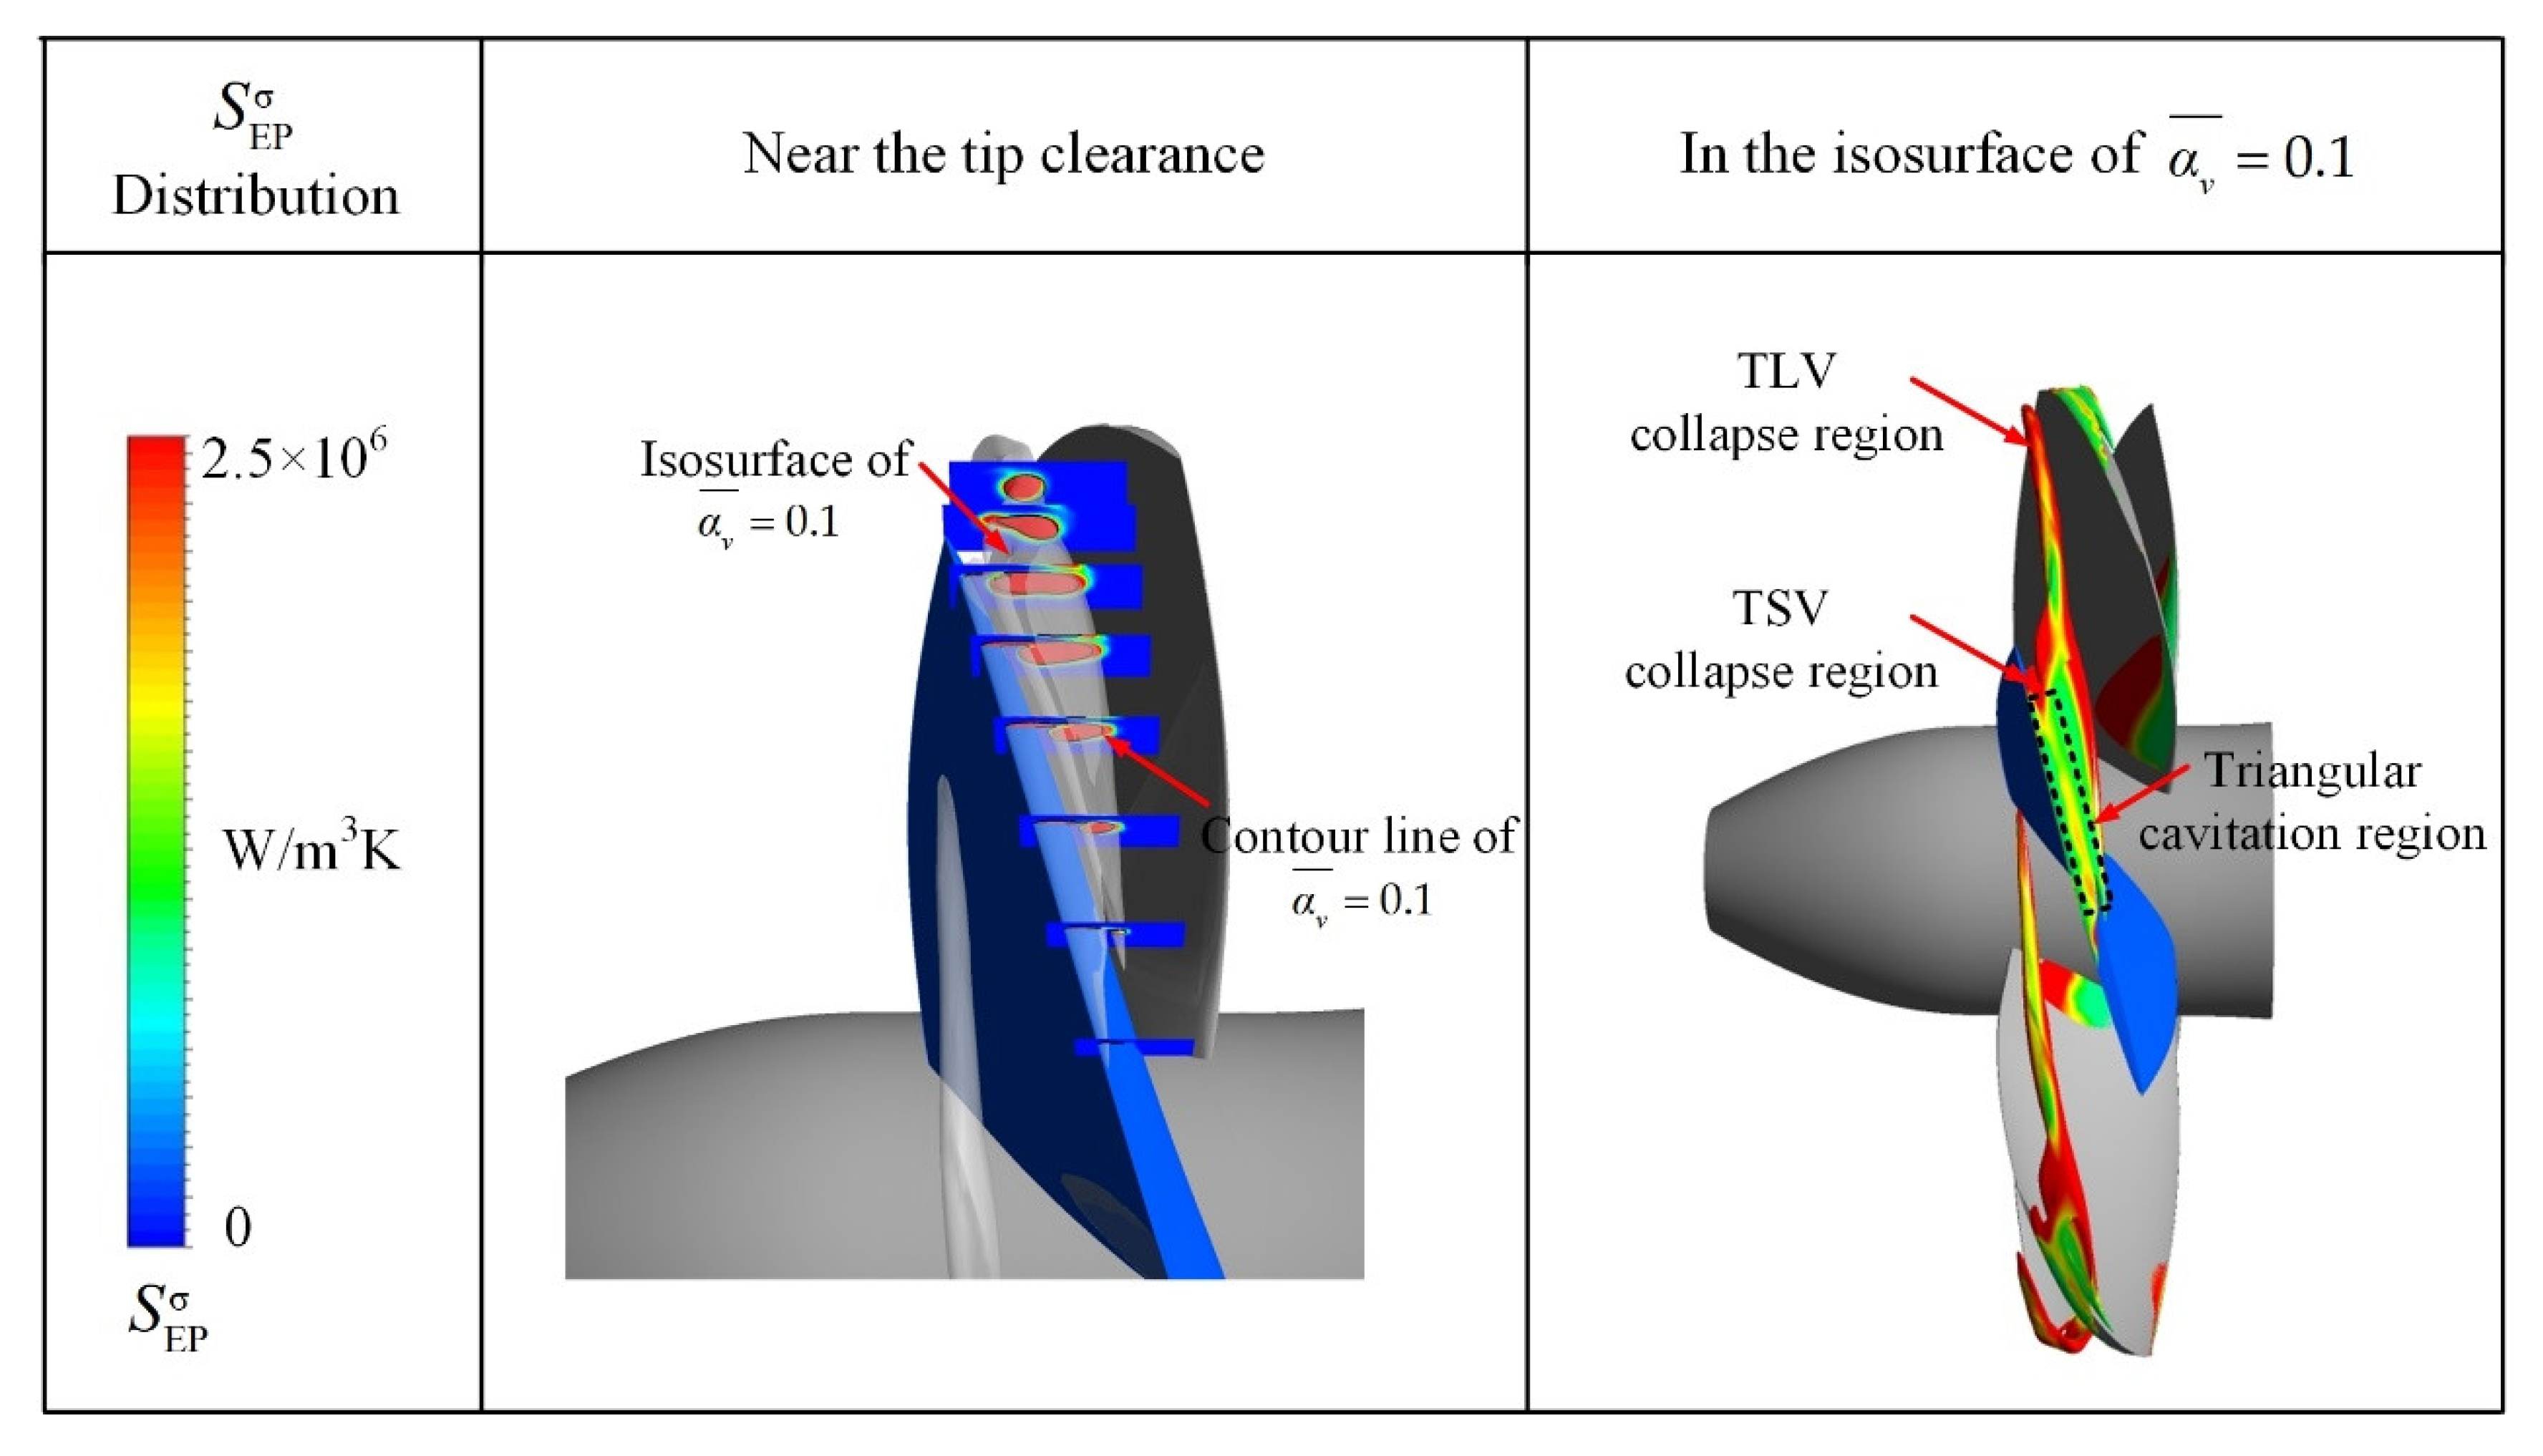
Figure 13 shows the interface entropy-production-rate distributions near the tip clearance and in the isosurface of α v ¯ = 0.1. The large values of the interface entropy-production rate filled the whole cavitation region, which indicates that the interface entropy-production rate can intuitively reflect the effects of phase transition on energy losses. The magnitude of the interface entropy-production rate was significantly higher than the original entropy-production rate, showing that the energy losses caused by the phase transition near the waterjet-pump blade tip was of great severeness. The large values of interface entropy-production rate in the isosurface of α v ¯ = 0.1 were concentrated in the TSV cavity-collapse region near the TE, the triangular cavitation region, and the TLV cavity-collapse region along the downstream. The TLV cavity in the experiment developed downstream and then began to spiral and collapse, as shown in Figure 4. The isosurface of α v ¯ = 0.1 did not reproduce the specific process of TLV cavity collapse, but the intense phase transition and the phase-transition losses through the process of TLV cavity collapse were captured by the peak values of the interface entropy-production rate. Similarly, the peak values of interface entropy-production rate also captured the phase transition and the phase-transition losses that appeared at the position of the intensified fusion of the TLV cavity and the TSV cavity. This is consistent with the phenomenon that a large number of bubbles appeared in the triangular cavitation region in the experiment. In summary, the phase transition and the energy losses are closely related. The intensified fusion of the TLV cavity and the TSV cavity in the waterjet pump was accompanied by a dramatic phase transition. The simulation in this study did not recognize the details of the phase transition, but the location where the phase transition occurred violently could be identified through the interface entropy-production rate.

5. Conclusions

In this study, the TLV cavitating-flow characteristics in a waterjet pump were studied numerically. The predicted hydrodynamic performance and cavitation patterns were compared with previous experimental data. The vortex characteristics, the influence of the cavitation on the vortex evolution, and the entropy-production features in the tip clearance were analyzed in the present studies. The conclusions can be summarized as follows:
(1)
The predicted hydrodynamic performance and cavitation patterns in the waterjet pump agree well with previous experimental data. The vortex structures could be accurately captured by DDES. Therefore, the model and the selected grid and numerical calculation method are suitable for capturing the transient cavitating flow.
(2)
The vortex characteristics in the tip clearance were investigated based on the flow distribution, formation mechanism, and evolution of the vortices. The results show that the vortex evolution in the waterjet pump was similar to that around a hydrofoil [30] and can be divided into three stages, but the vorticity variations in the waterjet pump were more complicated.
(3)
The relative-vorticity-transport equation was applied to discover the reason for the differences between the TLV vorticity variation observed in the waterjet pump and that observed around a hydrofoil [30]. The results indicate that the drastic fusion process of TSV cavity and the TLV cavity in the waterjet pump resulted in the formation of a triangular cavitation region near the blade tip, which is difficult to reproduce by stationary hydrofoil simulation. This fusion process caused the local variation of fluid volume and further affected the vorticity transport, which is probably the main reason for differences in the TLV vorticity variation inside the waterjet pump and around hydrofoils [30].
(4)
The entropy-production evaluation method considering the phase transition was then used to analyze the dissipation losses in the complex cavitation region. The results indicate that the drastic fusion process of the TSV cavity and the TLV cavity in the waterjet pump significantly influenced the entropy-production-rate distributions and enhanced the disturbance of the flow field. In addition, severe phase transition occurred in the drastic fusion region accompanied by huge phase-transition losses.

Author Contributions

Conceptualization, S.L. and X.W.; methodology, S.L. and X.W.; software, S.L.; validation, S.L., X.W., and H.C.; formal analysis, S.L.; investigation, S.L.; resources, S.L. and B.J.; data curation, S.L. and B.J.; writing—original draft preparation, S.L.; writing—review and editing, S.L., X.W., B.J., and H.C.; visualization, S.L., X.W., B.J., and H.C.; supervision, X.W., B.J., and H.C.; project administration, B.J.; funding acquisition, B.J. All authors have read and agreed to the published version of the manuscript.

Funding

This research was funded by the National Natural Science Foundation of China (Ji Bin), grant number 52176041.

Institutional Review Board Statement

Not applicable.

Informed Consent Statement

Not applicable.

Data Availability Statement

The data are supported by unpublished experiments supported by the same funding with the published paper (Han, C.-Z.; Xu, S.; Cheng, H.-Y.; Ji, B.; Zhang, Z.-Y. LES method of the tip clearance vortex cavitation in a propelling pump with special emphasis on the cavitation-vortex interaction. J. Hydrodyn. 2020, 32, 1212–1216, https://doi.org/10.1007/s42241-020-0070-9).

Acknowledgments

This work was financially supported by the National Natural Science Foundation of China (project No. 52176041).

Conflicts of Interest

The authors declare no conflict of interest.

References

  1. Miorini, R.L.; Wu, H.; Katz, J. The internal structure of the tip leakage vortex within the rotor of an axial Waterjet pump. Turbomach 2012, 134, 031018. [Google Scholar] [CrossRef]
  2. Wu, H.; Miorini, R.L.; Katz, J. Measurements of the tip leakage vortex structures and turbulence in the Meridional plane of an axial water-jet pump. Exp. Fluids 2011, 50, 989–1003. [Google Scholar] [CrossRef]
  3. Wu, H.; Miorini, R.L.; Tan, D.; Katz, J. Turbulence within the tip-leakage vortex of an axial waterjet pump. AIAA J. 2012, 50, 2574–2587. [Google Scholar] [CrossRef]
  4. You, D.; Wang, M.; Moin, P.; Mittal, R. Large-eddy simulation analysis of mechanisms for viscous losses in a turbomachinery tip-clearance flow. J. Fluid Mech. 2007, 586, 177–204. [Google Scholar] [CrossRef]
  5. Doligalski, T.L.; Smith, C.R.; Walker, J.D.A. Vortex interactions with walls. Annu. Rev. Fluid Mech. 1994, 26, 573–616. [Google Scholar] [CrossRef]
  6. Denton, J.D. Loss Mechanisms in Turbomachines; American Society of Mechanical Engineers: New York, NY, USA, 1993; p. V002T014A001. [Google Scholar]
  7. Li, Y.S. Mixing in axial flow compressors: Part I—Test facilities and measurements in a four-stage compressor. J. Turbomach. 1991, 113, 161–165. [Google Scholar] [CrossRef]
  8. Mailach, R.; Lehmann, I.; Vogeler, K. Rotating instabilities in an axial compressor originating from the fluctuating blade tip vortex. J. Turbomach. 2001, 123, 453–460. [Google Scholar] [CrossRef]
  9. Farrell, K.J.; Billet, M.L. A correlation of leakage vortex cavitation in axial-flow pumps. J. Fluids Eng. 1994, 116, 551–557. [Google Scholar] [CrossRef]
  10. Kolera, C.M. The Effects of Free Stream Turbulence on the Flow Field through a Compressor Cascade. Ph.D. Thesis, Virginia Polytechnic Institute and State University, Blacksburg, VA, USA, 2002. [Google Scholar]
  11. Muthanna, C. Wake of a compressor cascade with tip gap, part 1: Mean flow and turbulence structure. AIAA J. 2004, 42, 2320–2331. [Google Scholar] [CrossRef]
  12. Wang, Y. Wake of a compressor cascade with tip gap, part 2: Effects of endwall motion. AIAA J. 2004, 42, 2332–2340. [Google Scholar] [CrossRef]
  13. Wenger, C.W.; Devenport, W.J.; Wittmer, K.S.; Muthanna, C. Wake of a compressor cascade with tip gap, part 3: Two point statistics. AIAA J. 2004, 42, 2341–2346. [Google Scholar] [CrossRef]
  14. You, D. Study of Tip Clearance Flow in a Turbomachinery Cascade Using Large Eddy Simulation; Stanford University Press: Stanford, CA, USA, 2004. [Google Scholar]
  15. You, D.; Mittal, R.; Wang, M.; Moin, P. Computational methodology for large-eddy simulation of tip-clearance flows. AIAA J. 2004, 42, 271–279. [Google Scholar] [CrossRef]
  16. You, D.; Mittal, R.; Wang, M.; Moin, P. Analysis of stability and accuracy of finite-difference schemes on a skewed mesh. J. Comput. Phys. 2006, 213, 184–204. [Google Scholar] [CrossRef]
  17. Zhao, Y.; Jiang, Y.; Cao, X. Study on tip leakage vortex cavitating flows using a visualization method. Mod. Phys. Lett. B 2018, 32, 1850003. [Google Scholar] [CrossRef]
  18. Decaix, J.; Dreyer, M.; Balarac, G. RANS computations of a confined cavitating tip-leakage vortex. Eur. J. Mech. B/Fluids 2018, 67, 198–210. [Google Scholar] [CrossRef]
  19. Cheng, H.Y.; Ji, B.; Long, X.P. A review of cavitation in tip-leakage flow and its control. J. Hydrodyn. 2021, 33, 226–242. [Google Scholar] [CrossRef]
  20. Aeschlimann, V.; Beaulieu, S.; Houde, S. Inter-blade flow analysis of a propeller turbine runner using stereoscopic PIV. Eur. J. Mech. B/Fluids 2013, 42, 121–128. [Google Scholar] [CrossRef]
  21. Lemay, S.; Aeschlimann, V.; Fraser, R. Velocity field investigation inside a bulb turbine runner using endoscopic PIV measurements. Exp. Fluids 2015, 56, 120. [Google Scholar] [CrossRef]
  22. Dreyer, M.; Decaix, J.; Münch-Alligné, C.; Farhat, M. Mind the gap: A new insight into the tip leakage vortex using stereo-PIV. Exp. Fluids 2014, 55, 1849. [Google Scholar] [CrossRef]
  23. Zhang, D.; Shi, W.; Van Esch, B.B. Numerical and experimental investigation of tip leakage vortex trajectory and dynamics in an axial flow pump. Comput. Fluids 2015, 112, 61–71. [Google Scholar] [CrossRef]
  24. Shi, L.; Zhang, D.; Zhao, R. Effect of blade tip geometry on tip leakage vortex dynamics and cavitation pattern in axial-flow pump. Sci. China Technol. Sci. 2017, 60, 1480–1493. [Google Scholar] [CrossRef]
  25. Huang, R.; Ji, B.; Luo, X. Numerical investigation of cavitation-vortex interaction in a mixed-flow waterjet pump. J. Mech. Sci. Technol. 2015, 29, 3707–3716. [Google Scholar] [CrossRef]
  26. Han, C.; Long, Y.; Xu, M. Verification and Validation of Large Eddy Simulation for Tip Clearance Vortex Cavitating Flow in a Waterjet Pump. Energies 2021, 14, 7635. [Google Scholar] [CrossRef]
  27. Zhang, H.; Wang, J.; Zhang, D. Numerical Analysis of the Effect of Cavitation on the Tip Leakage Vortex in an Axial-Flow Pump. J. Mar. Sci. Eng. 2021, 9, 775. [Google Scholar] [CrossRef]
  28. Gritskevich, M.S.; Garbaruk, A.V.; Schütze, J. Development of DDES and IDDES formulations for the k-ω shear stress transport model. Flow Turbul. Combust. 2012, 88, 431–449. [Google Scholar] [CrossRef]
  29. Zwart, P.J.; Gerber, A.G.; Belamri, T. A two-phase flow model for predicting cavitation dynamics. In Proceedings of the Fifth International Conference on Multiphase Flow, Yokohama, Japan, 30 May–3 June 2004. [Google Scholar]
  30. Cheng, H.Y.; Bai, X.R.; Long, X.P.; Ji, B.; Peng, X.X.; Farhat, M. Long. Large eddy simulation of the tip-leakage cavitating flow with an insight on how cavitation influences vorticity and turbulence. Appl. Math. Model. 2020, 77, 788–809. [Google Scholar] [CrossRef]
  31. Spalart, P.R.; Deck, S.; Shur, M.L. A new version of detached-eddy simulation, resistant to ambiguous grid densities. Theor. Comput. Fluid Dyn. 2006, 20, 181–195. [Google Scholar] [CrossRef]
  32. Strelets, M. Detached eddy simulation of massively separated flows. In Proceedings of the 39th Aerospace Sciences Meeting and Exhibit, Reno, NV, USA, 8–11 January 2001. [Google Scholar]
  33. Han, C.Z.; Xu, S.; Cheng, H.Y. LES method of the tip clearance vortex cavitation in a propelling pump with special emphasis on the cavitation-vortex interaction. J. Hydrodyn. 2020, 32, 1212–1216. [Google Scholar] [CrossRef]
  34. Jeong, J. On the identification of a vortex. J. Fluid Mech. 1995, 285, 69–94. [Google Scholar] [CrossRef]
  35. Leweke, T.; Le Dizes, S.; Williamson, C.H. Dynamics and instabilities of vortex pairs. Annu. Rev. Fluid Mech. 2016, 48, 507–541. [Google Scholar] [CrossRef] [Green Version]
  36. Long, Y.; Han, C.; Ji, B. Verification and validation of large eddy simulations of turbulent cavitating flow around two marine propellers with emphasis on the skew angle effects. Appl. Ocean. Res. 2020, 101, 102167. [Google Scholar] [CrossRef]
  37. Lin, T.; Li, X.; Zhu, Z. Application of enstrophy dissipation to analyze energy loss in a centrifugal pump as turbine. Renew. Energy 2021, 163, 41–55. [Google Scholar] [CrossRef]
  38. Kazbekov, A.; Kumashiro, K.; Steinberg, A.M. Enstrophy transport in swirl combustion. J. Fluid Mech. 2019, 876, 715–732. [Google Scholar] [CrossRef]
  39. Bejan, A. Advanced Engineering Thermodynamics; John Wiley & Sons: New York, NY, USA, 1977. [Google Scholar]
  40. Bejan, A.; Kestin, J. Entropy Generation through Heat and Fluid Flow; John Wiley & Sons Inc.: New York, NY, USA, 1983. [Google Scholar]
  41. Bejan, A. Entropy generation minimization: The method of thermodynamic optimization of finite-size systems and finite-time processes. J. Appl. Phys. 1996, 79, 1191–1218. [Google Scholar] [CrossRef]
  42. Kock, F.; Herwig, H. Local entropy production in turbulent shear flows: A high-Reynolds number model with wall functions. Int. J. Heat Mass Transf. 2004, 47, 2205–2215. [Google Scholar] [CrossRef]
  43. Herwig, H.; Kock, F. Direct and indirect methods of calculating entropy generation rates in turbulent convective heat transfer problems. Heat Mass Transf. 2007, 43, 207–215. [Google Scholar] [CrossRef]
  44. Kock, F.; Herwig, H. Entropy production calculation for turbulent shear flows and their implementation in CFD codes. Int. J. Heat. Mass. Tran. 2005, 26, 672–680. [Google Scholar] [CrossRef]
  45. Sun, J. Two-phase Eulerian averaged formulation of entropy production for cavitation flow. Ph.D. Thesis, University of Manitoba, Winnipeg, Canada, 2014. [Google Scholar]
  46. Wang, C.; Zhang, Y.; Yuan, Z.; Ji, K. Development and application of the entropy production diagnostic model to the cavitation flow of a pump-turbine in pump mode. Renew. Energy 2020, 154, 774–785. [Google Scholar] [CrossRef]
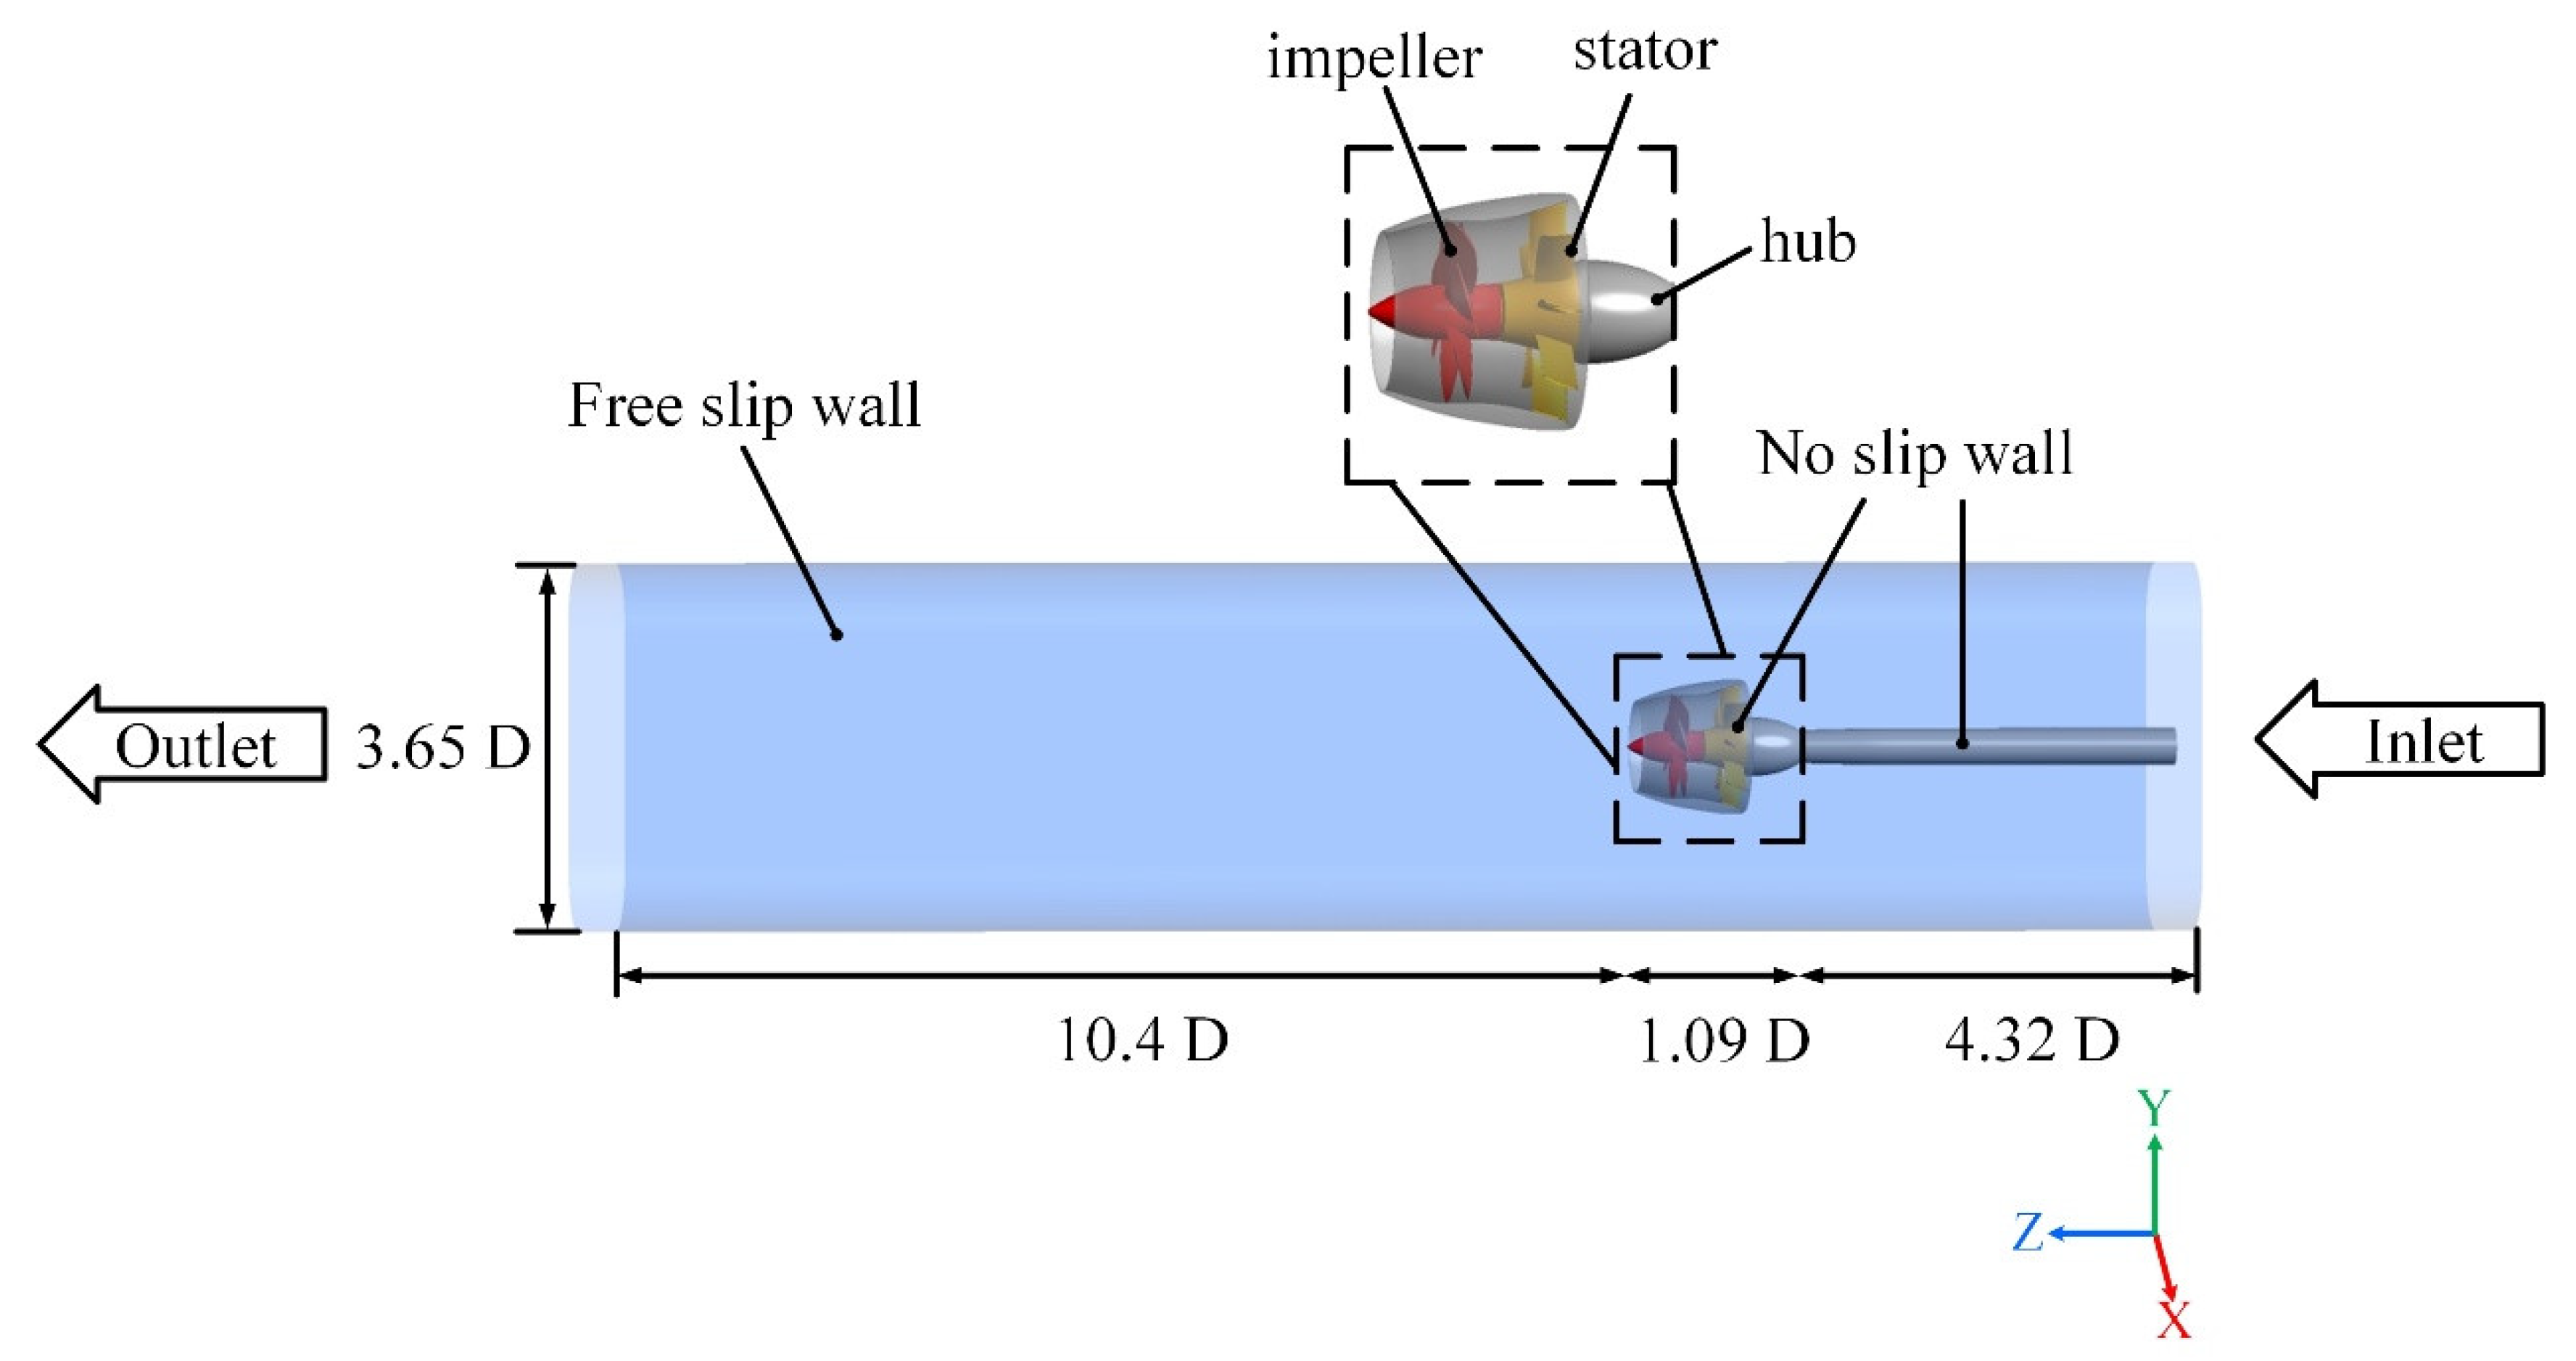
Figure 1. Simulation-domain and boundary conditions.
Energies 15 06916 g001
Figure 2. Structured mesh in the pump for Mesh 2.
Energies 15 06916 g002
Figure 3. Measured [33] and calculated thrust coefficients KT and torque coefficients KQ for the waterjet pump.
Energies 15 06916 g003
Figure 4. Measured [33] and predicted cavitation regions and predicted vortex structures.
Energies 15 06916 g004
Figure 5. Geometric parameters in the tip clearance. (a) Blade thickness fraction; (b) Blade chord fraction.
Energies 15 06916 g005
Figure 6. Axial-velocity and vortex-structure distributions in the tip clearance. (a) Vortex isosurface; (b) Axial velocity distribution; (c) Circumferential vorticity near the blade; (d) Circumferential vorticity between the blades.
Energies 15 06916 g006
Figure 7. Vortex evolution with cavitation.
Energies 15 06916 g007
Figure 8. Vortex stretching-and-bending term.
Energies 15 06916 g008
Figure 9. Vortex-dilatation term.
Energies 15 06916 g009
Figure 10. Vortex baroclinic-torque term.
Energies 15 06916 g010
Figure 11. Viscous-diffusion term.
Energies 15 06916 g011
Figure 12. Entropy production-rate distributions near the clearance. (a) Total entropy-production rate; (b) entropy-production rate caused by time-averaged velocity; (c) entropy-production rate caused by fluctuating velocity.
Energies 15 06916 g012
Figure 13. Interface entropy-production-rate distributions near the tip clearance and in the isosurface of α v ¯ = 0.1.
Energies 15 06916 g013
Table 1. Mesh information.
Mesh No.Number of Elements
Mesh 13,392,135
Mesh 26,497,196
Mesh 311,102,036
Publisher’s Note: MDPI stays neutral with regard to jurisdictional claims in published maps and institutional affiliations.