Article

Analysis of China’s Coal Reduction Path under the Goal of Peak Carbon Emissions and Carbon Neutralization

1
Research Center for Environmental Economics, Fudan University, Shanghai 200433, China
2
School of Economics, Fudan University, Shanghai 200433, China
3
Business School, University of Shanghai for Science and Technology, Shanghai 200093, China
*
Author to whom correspondence should be addressed.
Energies 2022, 15(19), 6929; https://doi.org/10.3390/en15196929
Submission received: 3 July 2022 / Revised: 2 September 2022 / Accepted: 5 September 2022 / Published: 22 September 2022
(This article belongs to the Special Issue Energy and Resource Management under Carbon Neutrality)

Abstract

:
In recent years, China has proposed the goal of peaking carbon dioxide emissions by 2030 and achieving carbon neutrality by 2060, which will significantly alter its existing coal-based energy mix. Since coal is China’s primary source of energy and the largest contributor to carbon emissions, coal reduction is an important measure toward carbon neutrality. In order to guarantee the stable development of economy and society in the process of coal reduction, the path and cost of coal reduction need to be studied in depth. Based on coal use in China, this paper examines and measures the stages and costs of coal reduction. It also gives a definition for coal reduction costs for the first time, including economic cost, environment and ecology cost, and health cost, as well as proposes a framework for analyzing the “full cost, full process, and full scenario”. We measure the cost in combination with the KAYA formula, and take into account the time value of the cost. Based on the above measurement framework, we calculate the unit coal reduction cost and estimate the coal reduction cost between CNY 454.38 and 827.1 billion.

1. Introduction

In the face of a series of environmental crises and global political and economic problems caused by climate change, the United Nations has urged countries to take practical actions to reduce greenhouse gas emissions and strengthen their defenses against climate change in recent years [1,2,3]. In the 2020s, to actively develop a low-carbon economy, nearly 110 countries have set the goal of achieving carbon neutrality (net zero greenhouse gas emissions) by the middle of the 21st century [4,5,6]. They have developed effective measures for climate governance and international cooperation. Although the complex relationship between carbon emissions and climate change is still a point of contention and debate in academic circles, reducing the use of fossil energy and developing green and clean energy have generally become the trend of world economic development and have been recognized and supported by the majority of countries.
According to the 2020 Emissions Gap Report from the United Nations Environmental Program (UNEP), global greenhouse gas emissions in 2019 were about 52.4 billion tons of CO2e, with China contributing 27% of the emissions at 14 billion tons of CO2e [7]. In the context of global energy saving and carbon reduction becoming a general international consensus, in 2020, China proposed the ambitious goal of peaking carbon dioxide emissions before 2030 and achieving carbon neutrality before 2060 (“Dual Carbon” targets). However, China’s coal consumption still accounts for a relatively large proportion [8,9]. According to the data released by the National Bureau of Statistics of China in 2021, coal consumption accounted for 56.8% of the country’s total energy consumption in 2020, an increase of 0.6% year-over-year and the fourth consecutive year of growth. As the world’s largest coal consumer and greenhouse gas emitter, fulfilling the “Dual Carbon” targets is a considerable challenge, and reducing coal use will have a significant influence on economic and social stability.
In order to better predict the cost of coal reduction in the process of carbon emission reduction, the framework of this article includes three parts. The first part compares and analyzes the domestic and international literature on coal reduction and shows a series of policy documents issued by China on coal reduction. In the second part, we try to explain the cost of coal reduction and set up three scenarios based on the “Dual Carbon” targets and the impact of coal reduction on the economy, environment and ecology, and human health. The third part constructs a functional relationship to measure the coal cost based on the KAYA formula and analyzes the coal cost of three scenarios and different stages of coal reduction while considering the time value factor.

2. Literature Review

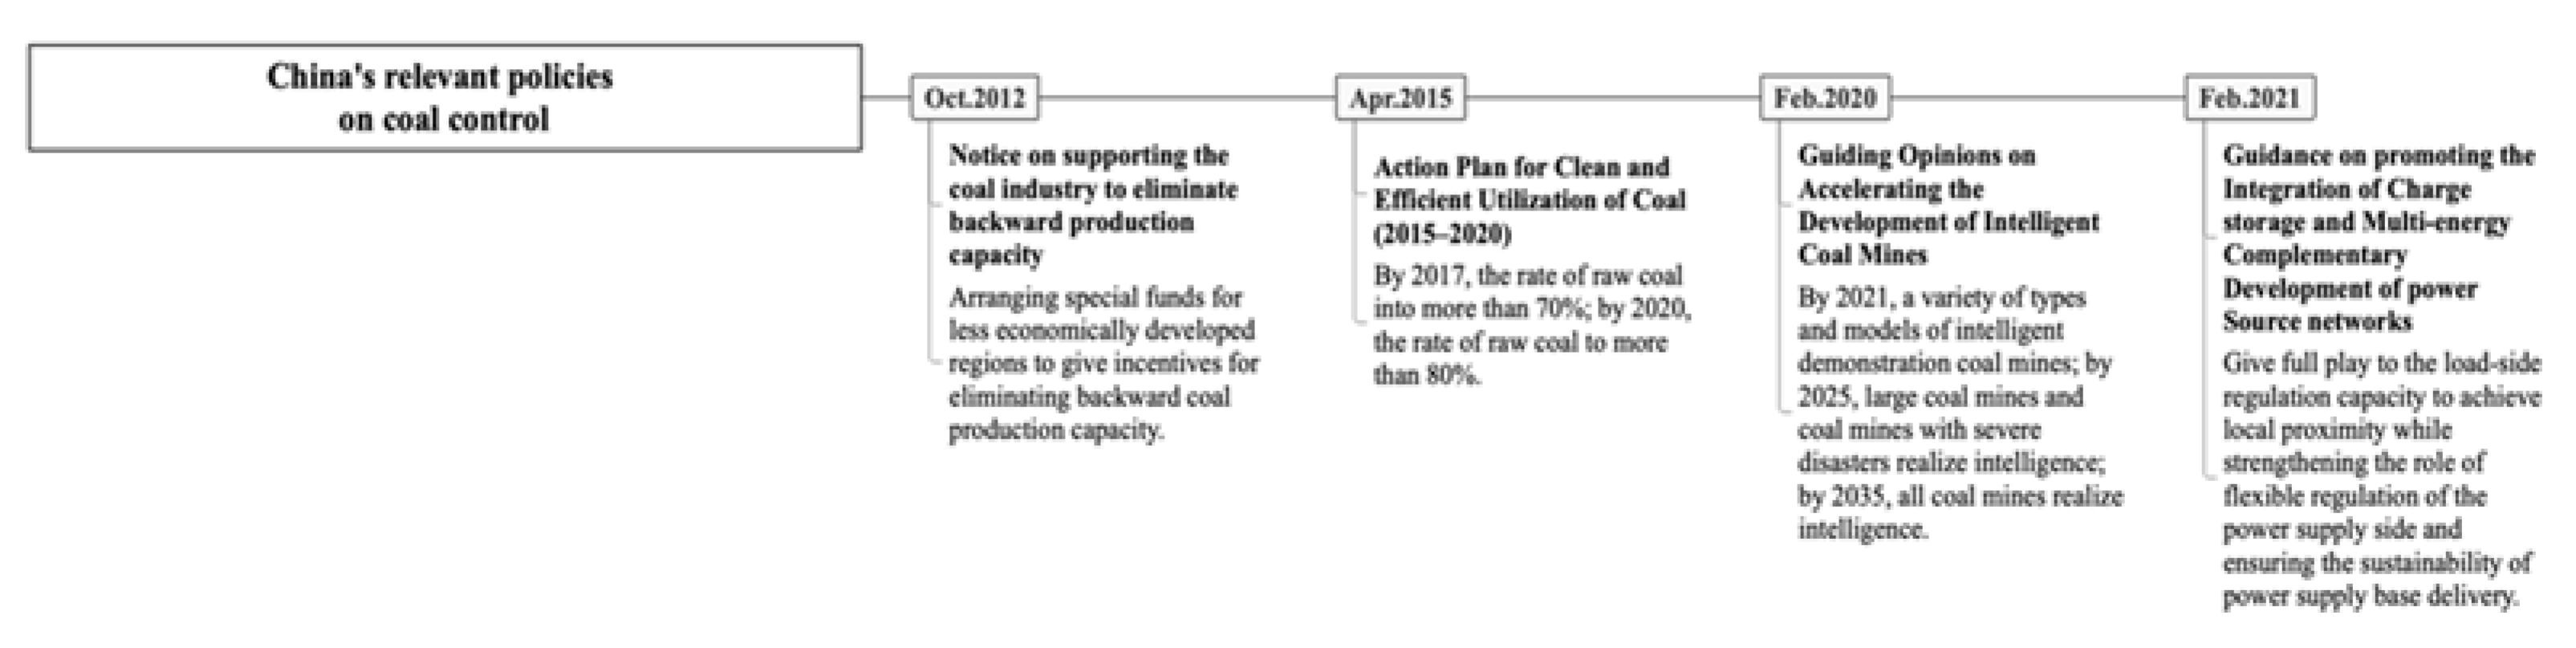
2.1. National Policy on Coal Control

China has introduced several policies on coal control and carbon reduction in recent years (Figure 1), mainly about promoting energy structure and clean utilization of coal use, covering the top-level design of the coal industry, control plans, and policies issued by coal authorities, and other industrial policies and fiscal policies associated with coal. The objectives of these policies are primarily focused on the target control of energy and coal, such as the degree of improvement of coal operation efficiency and the amount of coal usage reduction. However, under the new goal of “carbon neutral”, the coal policy on how to affect local economic development, industrial structure, ecological environment, energy security, risk prevention, etc., is relatively lacking. The “cost” issue in the coal control and reduction document is rarely addressed. The issue of “cost” in the coal control and reduction documents is seldom involved, and it is impossible to clarify the economics of the coal reduction process.

2.2. Literature Review

A series of studies have been conducted by many scholars on China’s coal reduction initiatives and “Dual Carbon” targets, which mainly consist of three types of literature. For example, Zhang et al. systematically discuss the transformation path of China’s energy economy [10]; Xie et al. clarify that the rapid development of the coal industry has supported the rapid growth of China’s economy since the reform and opening up, and that the low-carbon transformation of the coal industry is also essential for the high-quality development of China’s national economy under the goal of carbon neutrality [11]. The second category of literature focuses on carbon reduction and control. For example, Lin et al. developed a computable general equilibrium (CGE) model to assess the macroeconomic impact of energy cost increases due to energy mix changes [12]; Teng was the first to point out that coal costing should also consider the ecological and social costs behind the application [13,14]; Liu et al. reveal for the first time the quantitative relationship between the time to peak carbon and GDP growth in China. The third category of literature discusses the stages, scenarios, and projections of carbon reduction and coal control under the “Dual Carbon” targets [15], e.g., the Energy Sector Advisory Study Group divides China’s energy revolution into three time periods: before 2020, from 2020 to 2030, and from 2030 to 2050, and decomposes the target of energy structure innovation into three stages. Yuan et al. proposed a roadmap for decarbonization of China’s power system based on the “Dual Carbon” targets: achieving peak carbon by 2025, a rapid decline in carbon emissions after 2035, near-zero-emissions by 2050, and achieving carbon negative by 2060 [16]; in addition, for coal reduction itself, Xu et al. designed three time stages, 2015, 2020, and 2030, to study the ultra-low emission retrofit and energy utilization of coal-fired power plants, and predicted the total emissions of NOX, SO2, and PM2.5 [17]; Xie et al. argued that under the carbon neutrality target constraint, China’s coal needs to shift from fundamental to pocket energy in the process of 12~15 t/yr of consumption for power peaking, carbonaceous reducers, and securing energy supply [18]. For coal reduction scenarios, Zhao et al. measured SO2 emissions from coal-fired power plants in China by 2020 by setting up a baseline control scenario, a general control scenario, and a stringent control scenario, respectively [19].
Many studies have been conducted to measure global coal power-stranded assets under climate targets. According to Pfeiffer et al., 51–58% of global coal-fired power plants are at risk of stranding [20,21]. More than 45% of the world’s coal-stranded assets can be attributed to China’s large installed coal capacity and small unit age. Currently, there are three main methods for calculating stranded assets: the cost method, the account balance method, and the cash flow method. Depending on the calculation methods and parameter values, the value of stranded assets in China varies considerably. Caldecott et al. used the cost method to estimate the value of stranded assets for the complete retirement of coal-fired power units in China from 2021 to 2036 at CNY 3.1 to 7.2 trillion [22,23]. Using the account balance method, the value of stranded assets is relatively small. China’s coal-stranded assets are estimated to range from $263.1 to $416.9 billion according to Saygin et al. [24], while Li et al. determined that the size of stranded assets is only $37.3 to 158.3 billion under the 2 °C scenario and $655.1 billion under the 1.5 °C scenario [25]. Currently, there are relatively more studies using the cash flow method to account for stranded assets of coal power plants in China, and the value of the stranded assets ranges from CNY 0.3 trillion to 3.16 trillion. However, most parameters are chosen based on national uniform parameters, without considering regional differences in coal power plant operation.
The main characteristics of the above literature are as follows. Firstly, from the methodological point of view, many studies use scenario analysis and other methods to set up different coal transition scenarios to measure the future emission levels of CO2 and a series of air pollutants; secondly, from the thematic content, more studies set up different scenarios of China’s carbon reduction and coal control paths, focusing on the analysis from the perspective of coal reduction technologies. However, the above studies lack a systematic study of China’s coal control and carbon reduction under the guidance of the “Dual Carbon” targets. They have not fully discussed the different constraint scenarios and stages of achieving the “Dual Carbon” targets. In particular, the composition, measurement, and simulation of coal reduction costs are not clearly defined in the existing literature, and a complete measurement system is lacking. The innovation of this paper is to construct a theoretical framework of “full cost, full process, and full scenario” under the goal of “Dual Carbon” targets, to split the cost into different stages, and to use the expenditure method.

3. Theoretical Framework

Coal reduction is an extensive, multi-stage, and time-consuming task. There are different paths to achieve the goal of “Dual Carbon” targets and the cost of coal reduction varies under different paths. Based on this, this study proposes a coal reduction path from the perspective of “full cost, full process, and full scenario”, systematically describes the cost components of coal reduction, phased targets, and coal reduction scenarios under different economic and social development requirements, and designs the measurement framework for coal reduction accordingly.

3.1. Full Cost: The Meaning and Scope of Coal Reduction Cost

The cost of coal reduction can be understood from two aspects: on the one hand, from the perspective of the whole process and life cycle of coal application, its cost should include “production-processing-transportation-use”. On the other hand, Teng argues that the cost of coal includes not only the actual monetary cost incurred (the explicit cost of the coal reduction process, but the cost does not take into account the benefits generated by new energy substitution and other actions) but also the health, ecological, and social losses resulting from its use (the implicit cost of the coal reduction process) [13].
This paper, combined with the existing research, believes that a scientific, safe, and orderly coal reduction path should be one that minimizes costs and maximizes benefits. Policymakers need to conduct a comprehensive analysis and comparison of the costs in the coal reduction process and divide the coal reduction costs into two types: explicit cost and implicit cost. The former mainly refers to economic cost, and the latter mainly includes health cost, environment and ecology cost, and governance cost (Figure 2). Among these, the economic cost involves the macroeconomic cost of crucial industries (thermal power, iron and steel, building materials, chemical industry, etc.), key regions (coal-producing areas, coal transport areas, coal-using areas, etc.), critical areas (coal production, coal power generation, high coal consumption industries, and residential consumption, etc.), the integrated benefits involved in the development process of multi-energy complementary new-type comprehensive system, and the dynamic coal reduction process of coal “ballast”, as well as the cost-effectiveness of carrying out coal industry transformation and multipurpose utilization. Health cost involves the burden and benefit of human health capital caused by environmental pollution generated by coal-related industries. Environment and ecology cost involve the environmental treatment costs and ecological restoration costs caused by air and water pollution generated by coal-related industries, as well as the environmental and ecological carbon sink benefits resulting from conducting coal reduction. In addition, policymakers should consider the governance cost arising from policy formulation, policy implementation, regional collaboration, public participation, etc., in the coal reduction process. On this basis, they are based on the measurement of Teng, and assuming an annual discount rate of r = 8%, the unit cost of coal reduction with 2021 as the baseline is 415 CNY/ton [13].

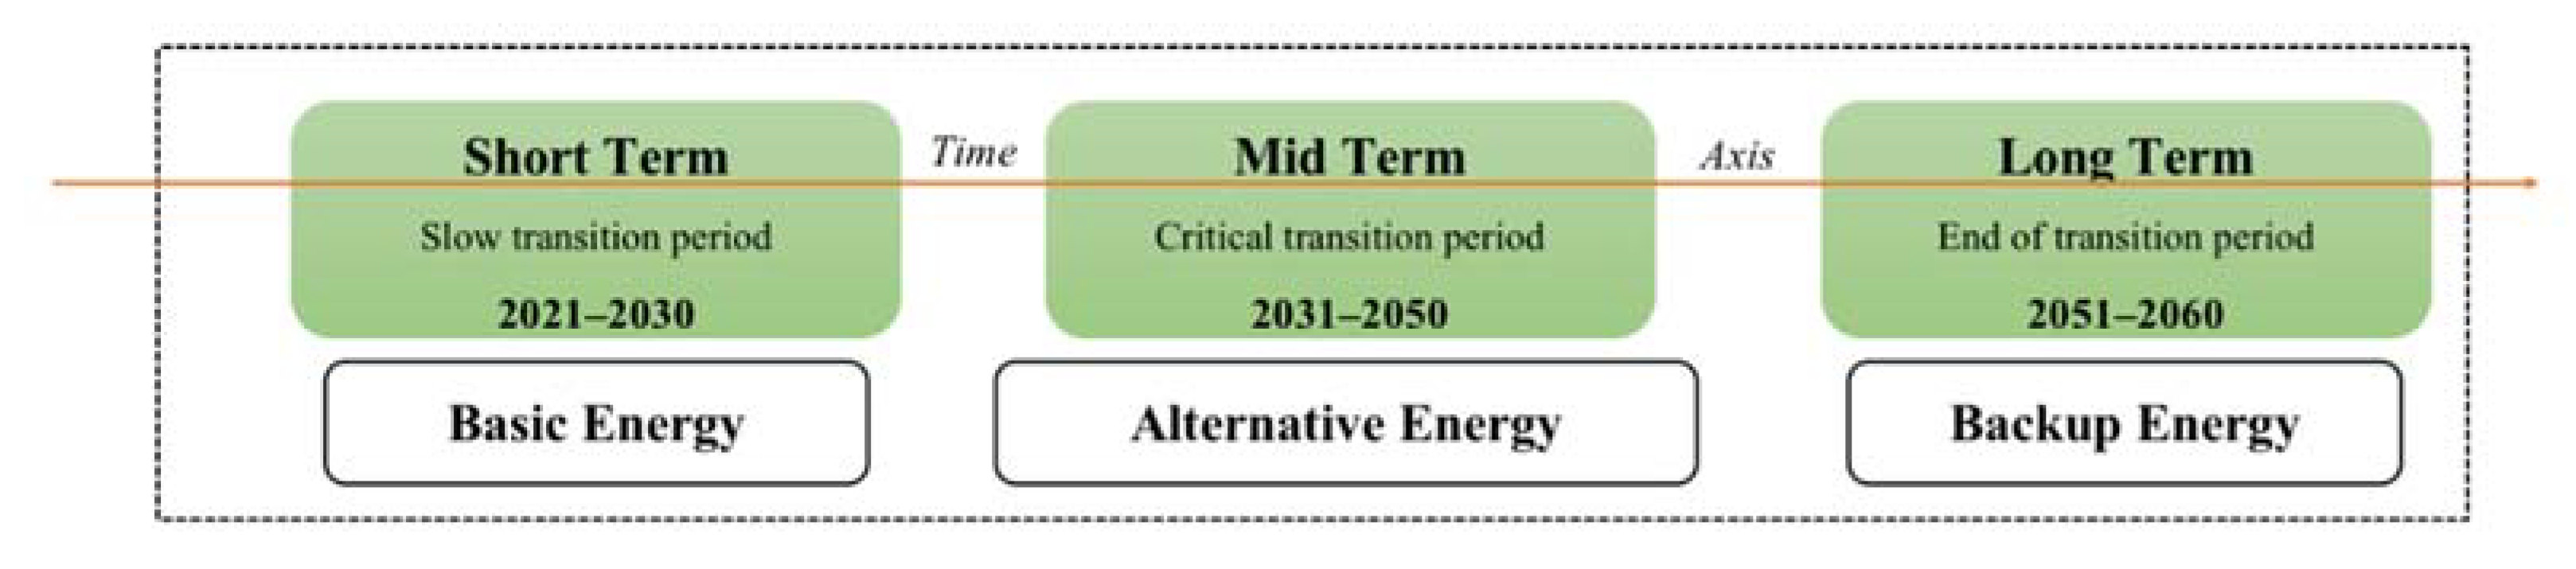
3.2. Full Process: Time Cycle Requirements Based on the “Dual Carbon” Targets

The Chinese government has set a clear timeline for carbon emissions reduction by setting targets for peak carbon by 2030 and carbon neutrality by 2060, as well as potential requirements for transforming the energy structure, especially the milestones for coal reduction. Setting milestones for the transformation of the energy system has been reflected on several occasions: for example, the Chinese government has formulated energy development plans once every five years; the European Union has also broken down its goals into phases and developed the European energy strategy for 2020, the EU’s climate and energy policy framework for 2030, and the EU Energy Roadmap 2050. Among the available studies, The Comprehensive Research Group for Energy Consulting and Research of the Chinese Academy of Engineering divides the process of China’s energy revolution into three phases: the period before 2020 is the optimization of energy structure, especially the promotion of clean and efficient coal [11]. The period from 2020 to 2030 is the period of energy transformation, mainly the strategy of replacing coal with clean energy, and the period from 2030 to 2050 is the period of energy revolution finalization, forming a new energy system that is green, diversified and intelligent.
Based on the requirements of the “Dual Carbon” targets and the above discussion, this paper divides the coal reduction process into three stages: the slow transition period–the peak stage of elemental fossil energy (2021–2030), the critical transition period–the stage of structural change of fossil energy and alternative energy (2031–2050), and the end of transition period–new energy becomes the primary energy source, and fossil fuel becomes the backup energy source (2051–2060) (Figure 3).
There are significant differences in the use of coal and its position in the energy mix at each stage. These differences are rooted in the different carbon emission targets at each stage. Table 1 summarizes the expected CO2 emissions, coal consumption, and the position of coal and new energy in the energy mix for each stage in the existing studies.

3.3. Full Scenario: Different Options for Multiple Objectives

The coal reduction process will be influenced and constrained by various factors. Beyond the “Dual Carbon” targets, issues such as energy security and stable economic and social development cannot be ignored [10]. Therefore, it is necessary to set up different coal reduction scenarios for comparative analysis to demonstrate the coal reduction situation fully and cost under different conditions and then enrich the theoretical framework of coal reduction pathways. By setting the proportion of coal in primary energy consumption decreasing gradually, this paper introduces three different coal reduction scenarios, baseline, controlled and enhanced, to analyze the future coal consumption and use trends in China.
Scenario Ι is the baseline scenario, which implicitly conditions the extrapolation of trends based solely on existing coal use and reduction processes (based on the 13th FYP) without considering “peak carbon” and “carbon neutral” targets. The “carbon neutral” target is not considered. Scenario II is the coal-controlled scenario, which fully complies with the goals of achieving “peak carbon” by 2030 and “carbon neutral” by 2060, and optimizes the energy structure based on Scenario Ι, reducing the proportion of coal in primary energy consumption, decreases the growth rate of coal consumption year by year, and reduces the industrial structure. The growth rate of coal consumption will decrease yearly, the industrial structure will be further reduced, and the economic growth rate will be slowed down. At the same time, energy security factors will be fully considered. Scenario III is an enhanced control scenario based on Scenario II. Based on Scenario II, this scenario considers the advantages of energy structure, resource endowment, industrial scale, technology accumulation, and future development opportunities and needs. It takes more extraordinary measures than Scenario II to reduce the proportion of coal in primary energy consumption, shut down coal-related industries on a larger scale, and increase the proportion of renewable energy. We aim to achieve the target five years earlier than under the “carbon peak” and “carbon neutral” requirements (if the speedup will occur mainly during the critical transition period).

4. Methodology and Data Analysis

4.1. Calculation Equations

The KAYA equation has been used as an essential model to measure the relationship between carbon emissions and energy consumption in the literature on carbon emission measurement [28,29,30]. This paper combines the modified KAYA equation [15] to measure the total coal reduction expenditure based on the change in CO2 formed by coal consumption, as shown in Equation (1).
C O 2 = C O 2 C o a l × C o a l G D P × G D P
However, it is essential to note that Equation (1) lacks economic implications. CO2 emissions are not only closely related to energy use and unit energy consumption but also to the costs incurred behind the energy mix shift.
On the other hand, the GDP accounting by expenditure method reflects GDP through the total expenditure of the whole society to buy final products in a certain period. Accordingly, the GDP of Equation (1) is replaced by the monetary quantity M measuring expenditure (cost), as shown in Equation (2).
C O 2 = C O 2 C o a l × C o a l M × M
Thus, the total cost of coal reduction is shown in Equation (3).
M = C O 2 × 1 C O 2 C o a l × M C o a l = C O 2 × 1 C I × M C
CO2 stands for carbon dioxide emissions, C O 2 C o a l stands for carbon dioxide emissions per unit of coal, which is a constant value (2.69 tCO2/tce) (denoted as CI); M C o a l stands for the unit cost of coal (coal reduction), which is a constant value (415 CNY/tce) (denoted as MC).
The first-order difference is shown in Equation (4).
Δ C o a l × M C = Δ M = ( C O 2 × M C C I ) t ( C O 2 × M C C I ) 0 = M C C I × Δ C O 2
Thus, the cost of coal reduction ( Δ M ,   Δ C o a l × M C ) can be measured precisely for different stages and scenarios.

4.2. Cost Calculation

Based on the previous analysis of the three perspectives of cost, stage, and link in the coal reduction pathway, nine costs are calculated for the three coal reduction stages in the three scenarios using Equation (4) given in Section 3.1 to form a cost measurement matrix. For details, please see Table 2.
Based on the above measurement framework, we set the unit coal reduction cost (MC) at 415 CNY/tce and use Scenario 1 and 3 as the endpoints of the interval to estimate the coal reduction cost. The total cost from 2021 to 2060 is likely to be between 454.4 and 827.1 billion CNY (in 2021 prices, r = 8%).

4.3. Sensitivity Analysis

Discount rate (r), unit cost of coal (coal reduction) (MC), and carbon dioxide emissions per unit of coal (CI) are key factors affecting the cost of coal reduction. Based on the previous analysis, the above three indicators are regarded as variables and selected for sensitivity analysis on the total cost of coal reduction (using scenario Ⅱ as the criterion). The results are shown in Table 3. In terms of each influencing factor, when they change (decrease or increase by 10%), there is an impact on cost accounting at the level of about 10%; among them, the impact of MC is positive, and the impact of r and CI is negative.

5. Conclusions and Further Research

This paper investigates the total cost of coal reduction under the goals of “carbon peaking” and “carbon neutrality”. Coal, as the primary energy source in China at this stage, provides the main energy supply for economic activities and inevitably brings about excessive CO2 emissions. Therefore, the key to the “Dual Carbon” targets is to change the current “coal-rich” energy mix. Combined with the time cycle to achieve the “Dual Carbon” targets and other important issues such as source security, this paper presents different scenarios of coal reduction pathways and the comprehensive costs incurred by coal reduction.. Based on the KAYA equation, this paper makes a preliminary calculation of the cost of coal reduction.
The analysis in this paper can provide ideas and guidelines for solving the practical problems of how much to reduce, how much to keep, how to reduce, and how to keep in the coal reduction path under the “Dual Carbon” targets constraint, and then provide some values for solving the problems of coal governance, supply and demand, optimization and upgrading in China.

5.1. Conclusions

(1)
The transformation of the coal industry under the goal of “Dual Carbon” targets should be integrated with the national economic and social development, ecological civilization construction, and sustainable energy development requirements, so that coal is organically linked with economic, ecological, and circular development requirements.
(2)
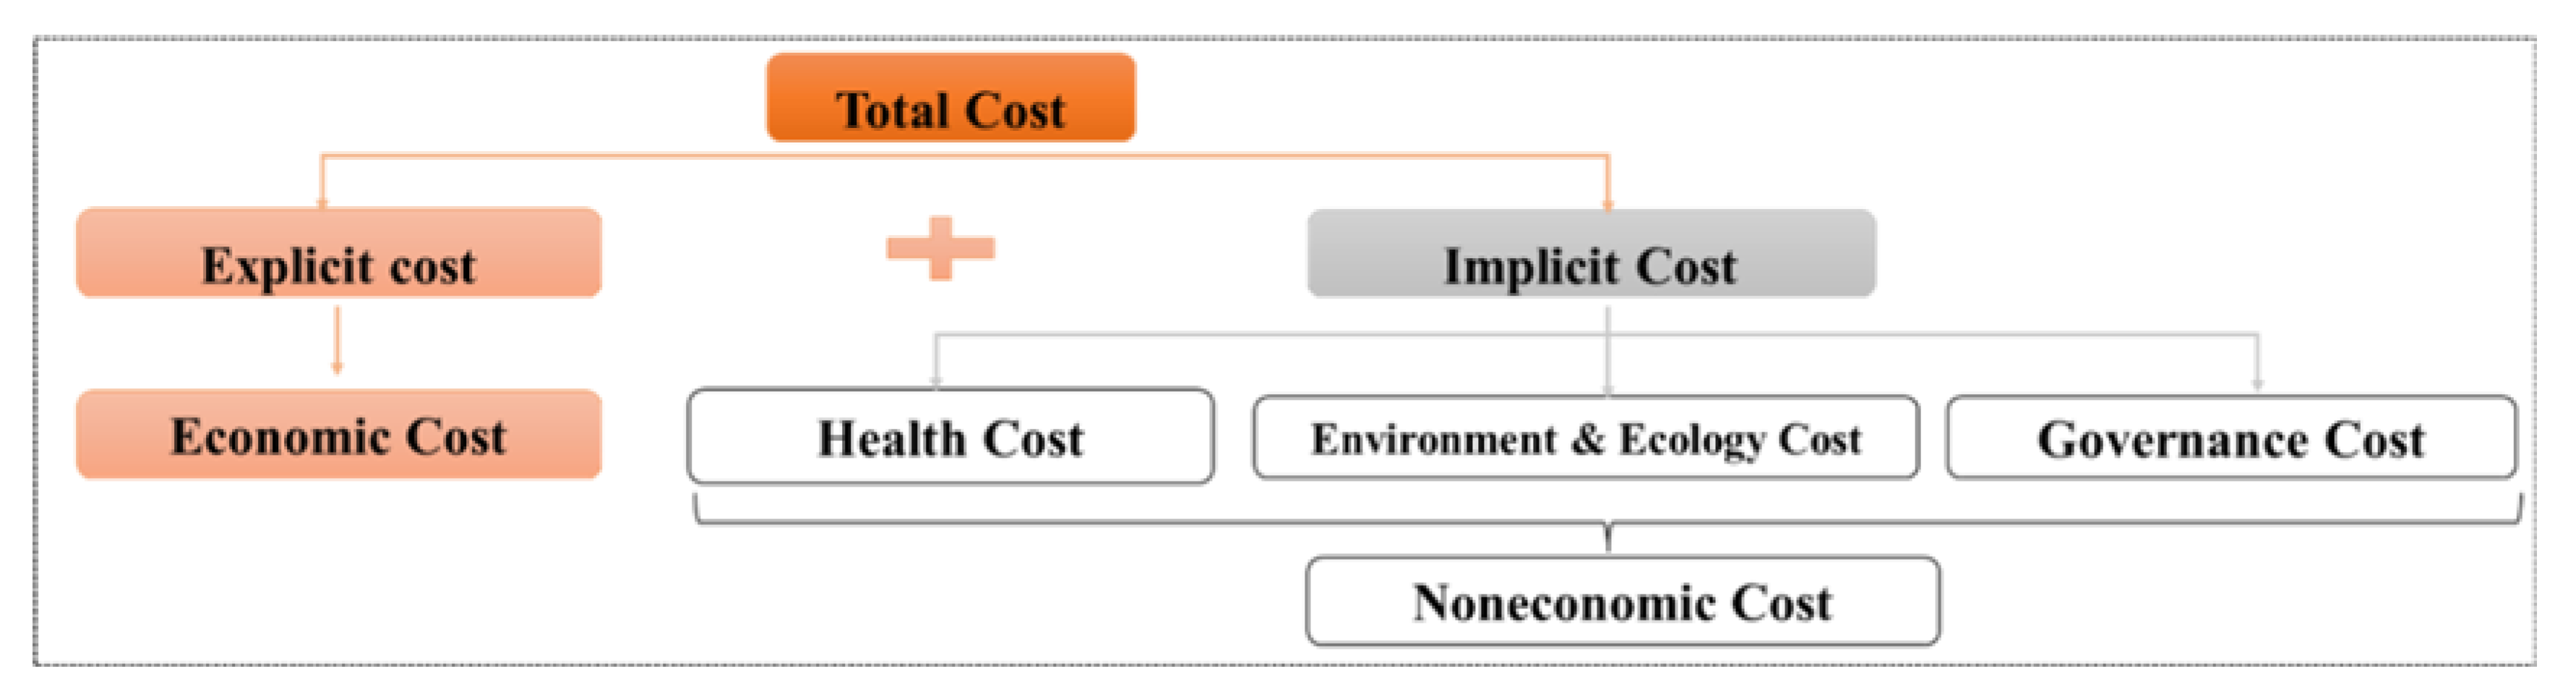
The total cost of the coal reduction process should be fully understood. The connotation and scope of coal reduction costs are expanded to include not only the monetary economic costs, which are calculated based on the sunk costs incurred in the projects and equipment involved in all aspects of coal mining, production, circulation, consumption, and application. Besides economic costs, it also includes non-economic benefits, such as environmental and ecology costs, health costs, and even the cost of changing economic and social development modes. For example, due to the reduction in the direct burning of coal that will result from coal reduction, other air pollutants such as SO2 and PM2.5 will also decrease, resulting in improved public health. These public social interests in the environment and ecology cost, and health cost are taken into account in the indirect benefits obtained from the coal reduction process.
(3)
The impact and risk of the coal reduction process should be fully foreseen, the trade-off between rigid demand and elastic demand for coal should be emphasized, and the rigid primary demand for energy security, people’s livelihood, urban transportation, and employment should be measured and guaranteed to form a systematic solution.

5.2. Further Research Outlooks

(1)
This study has enriched the concept of coal reduction cost. The concept of “full cost” is proposed for the first time, and the process of coal reduction includes not only economic cost but also noneconomic costs such as environment and ecology cost and health cost. However, there is no discussion on how to quantify these costs scientifically. In the next step, we will conduct more in-depth research on the measurement methods of these noneconomic costs.
(2)
The cost interval of coal reduction in different stages is proposed. In the next step, we will focus on the coal reduction costs in different regions, such as coal-producing regions and coal-using regions, and in different vital coal-using industries such as iron and steel, chemical industry, and electric power.
(3)
This paper only focuses on the cost of coal as an energy source without considering alternative sources. In the next step, we will combine the use of new energy sources such as wind and solar energy. This will enable us to further calculate the energy substitution in the coal reduction process.

Author Contributions

Conceptualization, H.L.; Data curation, X.W.; Formal analysis, H.L.; Writing—original draft, H.L. and X.W.; Writing—review & editing, S.C. All authors have read and agreed to the published version of the manuscript.

Funding

This research received no external funding.

Informed Consent Statement

Not applicable.

Data Availability Statement

Not applicable.

Conflicts of Interest

The authors declare no conflict of interest.

References

  1. Ogle, S.M.; Grant, D.; Kurz, W.A.; Rocha, M.T.; Ted, H.; Amy, S.; Smith, J.E.; Christopher, W.; Thelma, K. Delineating managed land for reporting national greenhouse gas emissions and removals to the united nations framework convention on climate change. Carbon Balance Manag. 2018, 13, 9. [Google Scholar] [CrossRef]
  2. Tubiello, F.N.; Conchedda, G.; Wanner, N.; Federici, S.; Grassi, G. Carbon emissions and removals from forests: New estimates, 1990–2020. Earth Syst. Sci. Data 2021, 13, 1681–1691. [Google Scholar] [CrossRef]
  3. Luisetti, T.; Ferrini, S.; Grilli, G.; Jickells, T.D.; Kennedy, H.; Kröger, S.; Lorenzoni, I.; Milligan, B.; Molen, J.V.D.; Parker, R.; et al. Climate action requires new accounting guidance and governance frameworks to manage carbon in shelf seas. Nat. Commun. 2020, 11, 4599. [Google Scholar] [CrossRef] [PubMed]
  4. Zhao, Y.H.; Su, Q.; Li, B.K.; Zhang, Y.Y.; Wang, X.J.; Zhao, H.R.; Guo, S. Have those countries declaring “zero carbon” or “carbon neutral” climate goals achieved carbon emissions-economic growth decoupling? J. Clean. Prod. 2022, 363, 132450. [Google Scholar] [CrossRef]
  5. Xie, Y.C.; Qi, J.G.; Zhang, R.; Jiao, X.M.; Shirkey, G.; Ren, S.H. Toward a Carbon-Neutral State: A Carbon–Energy–Water Nexus Perspective of China’s Coal Power Industry. Energies 2022, 15, 4466. [Google Scholar] [CrossRef]
  6. Wang, Q.; Xiao, Y.H. Has Urban Construction Land Achieved Low-Carbon Sustainable Development? A Case Study of North China Plain, China. Sustainability 2022, 14, 9434. [Google Scholar] [CrossRef]
  7. United Nations Environment Programme and International Livestock Research Institute. Preventing the Next Pandemic: Zoonotic Diseases and How to Break the Chain of Transmission. 2020. Available online: https://72d37324-5089-459c-8f70-271d19427cf2.filesusr.com/ugd/056cf4_b5b2fc067f094dd3b2250cda15c47acd.pdf (accessed on 23 May 2022).
  8. Wang, J.Z.; Jiang, H.Y.; Zhou, Q.P.; Wu, J.; Qin, S.S. China’s natural gas production and consumption analysis based on the multicycle Hubbert model and rolling Grey model. Renew. Sustain. Energy Rev. 2016, 53, 1149–1167. [Google Scholar] [CrossRef]
  9. Chai, S.Q.; Zhang, G.Z.; Li, G.Q.; Zhang, Y.F. Industrial hydrogen production technology and development status in China: A review. Clean Technol. Environ. Policy 2021, 23, 1931–1946. [Google Scholar] [CrossRef]
  10. Zhang, X.L.; Huang, X.D.; Zhang, D.; Geng, Y.; Tian, L.X.; Fan, Y.; Chen, W.Y. Research on the Pathway and Policies for China’s Energy and Economy Transformation toward Carbon Neutrality. J. Manag. World 2022, 38, 35–66. (In Chinese) [Google Scholar]
  11. Xie, H.P.; Liu, H.; Wu, G. A quantitative analysis of dependent index and contribution rate between China’s economic and coal development. J. China Univ. Min. Technol. Soc. Sci. 2012, 14, 1–6. (In Chinese) [Google Scholar]
  12. Lin, B.Q.; Liu, X.Y. China’s Carbon Dioxide Emissions under the Urbanization Process: Influence Factors and Abatement Policies. Econ. Res. J. 2010, 45, 66–78. (In Chinese) [Google Scholar]
  13. Teng, F. The real cost of coal, so big? Environ. Econ. 2015, Z1, 24–25. (In Chinese) [Google Scholar]
  14. Yang, X.; Pang, J.; Teng, F.; Gong, R.X.; Springer, C. The environmental co-benefit and economic impact of China’s low-carbon pathways: Evidence from linking bottom-up and top-down models. Renew. Sustain. Energy Rev. 2021, 136, 110438. [Google Scholar] [CrossRef]
  15. Liu, Q.; Chen, Y.; Teng, F.; Tian, C.; Zheng, X.Q.; Zhao, X.C. Pathway and policy analysis to China’s deep decarbonization. China Popul. Resour. Environ. 2017, 27, 162–170. (In Chinese) [Google Scholar] [CrossRef]
  16. Yuan, J.H.; Zhang, H.N. Carbon neutrality, power system decarbonization and coal power exit. China Power Enterp. Manag. 2020, 31, 17–20. (In Chinese) [Google Scholar]
  17. Xu, Y.; Hu, J.L.; Ying, Q.; Hao, H.K.; Wang, D.X.; Zhang, H.L. Current and future emissions of primary pollutants from coal-fired power plants in Shaanxi, China. Sci. Total Environ. 2017, 595, 505–514. [Google Scholar] [CrossRef]
  18. Xie, H.P.; Ren, S.H.; Xie, Y.C.; Jiao, X.M. Development opportunities of the coal industry towards the goal of carbon neutrality. J. China Coal Soc. 2021, 46, 2197–2211. (In Chinese) [Google Scholar]
  19. Zhao, Y.; Wang, S.X.; Duan, L.; Lei, Y.; Cao, P.F.; Hao, J.M. Primary air pollutant emissions of coal-fired power plants in China: Current status and future prediction. Atmos. Environ. 2008, 42, 8442–8452. [Google Scholar] [CrossRef]
  20. Pfeiffer, A.; Hepburn, C.; Vogt-Schilb, A.; Caldecott, B. Committed emissions from existing and planned power plants and asset stranding required to meet the Paris Agreement. Environ. Res. Lett. 2018, 13, 054019. [Google Scholar] [CrossRef]
  21. Pfeiffer, A.; Millar, R.; Hepburn, C.; Beinhocker, E. The ‘2 °C capital stock’ for electricity generation: Committed cumulative carbon emissions from the electricity generation sector and the transition to a green economy. Appl. Energy 2016, 179, 1395–1408. [Google Scholar] [CrossRef]
  22. Caldecott, B.; Tilbury, J.; Ma, Y. Stranded Down under? Environmentrelated Factors Changing China’s Demand for Coal and what this Means for Australian Coal Assets; Smith School of Enterprise and the Environment at University of Oxford: Oxford, UK, 2013; Available online: https://gallery.mailchimp.com/a81a00a6b5c399f21857b67de/files/SAP_Report_Stranded_Down_Under_Final.pdf (accessed on 20 June 2022).
  23. Caldecott, B.; Dericks, G.; Tulloch, D.; Liao, X.W.; Kruitwagen, L.; Bouveret, G.; Mitchell, J. Stranded Assets and Thermal Coal in China: An Analysis of Environment-Related Risk Exposure; Smith School of Enterprise and the Environment at University of Oxford: Oxford, UK, 2017; Available online: http://www.nrdc.cn/Public/uploads/2017-11-06/5a0014d70ac24.pdf (accessed on 14 June 2022).
  24. Saygin, D.; Rigter, J.; Caldecott, B.; Wagner, N.; Gielen, D. Power sector asset stranding effects of climate policies. Energy Sources Part B Econ. Plan. Policy 2019, 14, 99–124. [Google Scholar] [CrossRef]
  25. Li, Z.; Chen, S.Y.; Dong, W.J.; Liu, P.; Du, E.S. Low carbon transition pathway of power sector under carbon emission constraints. Proc. CSEE 2021, 41, 3987–4001. (In Chinese) [Google Scholar]
  26. Chinese Academy of Engineering Research, Strategy and Path of China’s Carbon Peak and Carbon Neutralization. 2022. Available online: https://baijiahao.baidu.com/s?id=1728980167075745359&wfr=spider&for=pc (accessed on 10 April 2022).
  27. International Energy Agency (IEA). Carbon Neutrality Roadmap of China’s Energy System; Research Report; IEA: Paris, France; Available online: https://yhp-website.oss-cn-beijing.aliyuncs.com/upload/AnenergysectorroadmaptocarbonneutralityinChina_1633481516331.pdf (accessed on 12 April 2022).
  28. Yin, J.H.; Zheng, M.Z.; Chen, J. The effects of environmental regulation and technical progress on co2 kuznets curve: An evidence from China. Energy Policy 2015, 77, 97–108. [Google Scholar] [CrossRef]
  29. Zhou, X.Y.; Zhang, J.; Li, J.P. Industrial structural transformation and carbon dioxide emissions in China. Energy Policy 2013, 57, 43–51. [Google Scholar] [CrossRef]
  30. Ouyang, X.L.; Lin, B.Q. An analysis of the driving forces of energy-related carbon dioxide emissions in China’s industrial sector. Renew. Sustain. Energy Rev. 2015, 45, 838–849. [Google Scholar] [CrossRef] [Green Version]
Figure 1. China’s relevant policies on coal control.
Energies 15 06929 g001
Figure 2. Deconstruction of coal reduction costs.
Energies 15 06929 g002
Figure 3. Phased coal reduction path.
Energies 15 06929 g003
Table 1. Expected CO2 emissions in each phase and the position of coal and new energy in the energy mix.
Development CycleSlow Transition Period
(2021–2030)
Critical Transition Period
(2031–2050)
End of Transition Period
(2051–2060)
Emission Target for CO2
(billion tons)
10.5–12.22.6–4.0≈0
CoalPositioningBasic energyAlternative energyBackup energy
Consumption
(billion t)
45–3535–2515–12
New EnergyPositioningSupplementary energyAlternative energyPrinciple energy
Share in the energy consumption structure/%15–2930–4920–80
Note: The emission target for CO2 in the Slow transition period is 10.5–12.2, with 10.5 from Zhang et al. [10] and 12.2 from the Chinese Academy of Engineering [26]. The emission target for CO2 in the Critical transition period is 2.6–4.0, with 2.6 from Zhang et al. [10] and 4.0 from the IEA [27].
Table 2. Cost calculation.
Slow Transition Period
(2021–2030)
Critical Transition Period
(2031–2050)
End of Transition Period
(2051–2060)
Scenario 1:
Baseline
t = 1 10 1 ( 1 + r ) t M C × 1 10 × ( 15 13.5 ) 2.69 1 ( 1 + r ) 10 t = 1 20 1 ( 1 + r ) t M C × 1 20 × ( 13.5 6.0 ) 2.69 1 ( 1 + r ) 30 t = 1 10 1 ( 1 + r ) t M C × 1 10 × ( 6.0 2.50 ) 2.69
Scenario 2:
Controlled
t = 1 10 1 ( 1 + r ) t M C × 1 10 × ( 15 12.2 ) 2.69 1 ( 1 + r ) 10 t = 1 20 1 ( 1 + r ) t M C × 1 20 × ( 12.2 4.0 ) 2.69 1 ( 1 + r ) 30 t = 1 10 1 ( 1 + r ) t M C × 1 10 × 4.0 2.69
Scenario 3:
Enhanced
t = 1 10 1 ( 1 + r ) t M C × 1 10 × ( 15 10.5 ) 2.69 1 ( 1 + r ) 10 t = 1 15 1 ( 1 + r ) t M C × 1 15 × ( 10.5 2.6 ) 2.69 1 ( 1 + r ) 25 t = 1 10 1 ( 1 + r ) t M C × 1 10 × 2.6 2.69
Note: In this table, we substitute the estimated value of carbon dioxide emission reduction (based on Section 3.2) into “ Δ C O 2 ” of Equation (4), and assume that carbon emissions are reduced at a constant speed during one specific period. The level of carbon emissions is without imposing any coal control measures.
Table 3. Sensitivity analysis of coal reduction cost (%).
FactorsRate of ChangeTotal CostRate of ChangeTotal Cost
Discount rate (r)−10+10.43+10−8.92
Unit cost of coal (coal reduction) (MC)−10−10+10+10
carbon dioxide emissions per unit of coal (CI)−10+11.11+10−9.09
Publisher’s Note: MDPI stays neutral with regard to jurisdictional claims in published maps and institutional affiliations.

