Article

The Interaction Mechanism of Tourism Carbon Emission Efficiency and Tourism Economy High-Quality Development in the Yellow River Basin

1
School of Tourism, Hainan University, Haikou 570228, China
2
College of Culture Tourism, Shanxi University of Finance and Economics, Taiyuan 030031, China
3
Hainan Province Holistic Tourism Research Base, Haikou 570228, China
4
Academician Desheng Wu Station of Hainan Province, Haikou 570228, China
*
Author to whom correspondence should be addressed.
Energies 2022, 15(19), 6975; https://doi.org/10.3390/en15196975
Submission received: 29 August 2022 / Revised: 19 September 2022 / Accepted: 20 September 2022 / Published: 23 September 2022
(This article belongs to the Special Issue Available Energy and Environmental Economics)

Abstract

:
Exploring the relationship between the tourism carbon environment and high-quality economic development in the Yellow River Basin is a national strategy to meet the realistic requirements of the goal of “Carbon Peak and Carbon Neutral”. It is also conducive to the realization of “Ecological Protection and High-quality Development Strategy in the Yellow River Basin”. Therefore, based on the calculation of tourism’s carbon emission efficiency and the evaluation of the tourism economy’s high-quality development, the interaction mechanism between them was observed. The results showed that, firstly, the tourism carbon emission efficiency of the Yellow River Basin increased slightly from 2010 to 2019, with an average of 0.9782, which was at a medium efficiency level. Secondly, the tourism economy’s high-quality development level is rising, and the speed of development is fast, especially in western provinces. Thirdly, there is a parasitic relationship between the two, but in each province, there is a positive or negative asymmetric symbiotic relationship. The tourism economy’s high-quality development has a greater impact on the efficiency of tourism’s carbon emissions. Fourthly, energy and capital input, as well as coordination and innovation factors, are important driving factors of the symbiosis between the two, among which the role of labor input was gradually revealed, and the impact factor experienced the changing process of “sharing-coordination-innovation”. This study provides a theoretical framework and evaluation methods for evaluating and analyzing the relationship between tourism’s carbon emission efficiency and the tourism economy’s high-quality development, and it provides data support and policy suggestions for the real development.

Graphical Abstract

1. Introduction

China is the world’s largest emitter of greenhouse gases, and its low-carbon development faces huge challenges. In September 2020, China proposed the climate goal of “carbon peak by 2030 and carbon neutral by 2060” for the first time at the UN General Assembly. The Central Economic Work Conference in December 2020, the Government Work Report in March 2021, and the 14th Five-Year Plan have repeatedly reaffirmed this climate goal.
Tourism has become one of the major sources of global climate change [1]. The carbon emission of tourism accounts for 5% of the total global carbon emission, and the greenhouse effect formed by the carbon emission of tourism accounts for about 14% of the total global effect. By 2035, tourism’s carbon emissions are expected to increase by 152%, and its contribution to the greenhouse effect is expected to increase by 188% [2]. In response to this problem, more attention should be given to key issues such as sustainability and adaptation to climate change [3]. Tourism should strive to reduce carbon emissions and improve the efficiency of tourism’s carbon emissions, and some actions based on anticipatory action planning are needed in the tourism sector [4]. The availability and sharing of knowledge and information related to tourism’s carbon emissions is a basic requirement for the successful planning of the tourism sector regarding this phenomenon [5].
Global tourist arrivals are expected to maintain an annual growth rate of 3.3% between 2010 and 2030 to reach 1.8 billion arrivals [6], generating rapid economic growth for the tourism industry as well as huge challenges. As a pillar industry of China’s national economy, the economic development of tourism is also an important issue that requires attention. The China Tourism Economy Blue Book (No. 13) put forward the tourism economy’s high-quality development. The development of the tourism economy is closely related to social, economic, and ecological environments [7,8]. Studies have shown that, with the passage of time, tourism consumption and total tourism emissions are roughly 2:1 in direct proportion [9]. Therefore, the next step is to realize how “ecological benefits” and “economic benefits” go hand in hand. It is important to study the interaction mechanism between tourism’s carbon emission efficiency and the tourism economy. It helps to realize low-carbon tourism and the high-quality development of tourism.
The Yellow River Basin is an important economic belt and ecological barrier in China. The general secretary’s speech in 2019 at the Symposium on Ecological Protection and High-quality Development in the Yellow River Basin, as well as the proposal made at the 6th Meeting of the Financial and Economic Commission of the CPC Central Committee in 2020 to make overall planning and coordinated progress based on the whole Basin and the ecosystem, all illustrate the importance of achieving a win-win situation between economic development and environmental protection in the Yellow River Basin. Therefore, this paper analyzed tourism’s carbon emission efficiency (TCEE) and the tourism economy’s high-quality development (TEHQD) in nine provinces in the Yellow River Basin from 2010 to 2019. Then, we explored the symbiotic interaction mechanism between TCEE and TEHQD. This is part of the tourism industry’s active response to climate change. It provides a basis for the tourism economy’s high-quality development, and it also provides ideas and paths for the realization of low-carbon tourism and high-quality economic development in the Yellow River Basin.
There are three main contributions of this paper. Firstly, from a theoretical perspective, this study is conducive to deepening the research on low-carbon tourism, exploring the tourism economy’s high-quality development (TEHQD) from a low-carbon perspective, improving the research on the relationship between tourism’s carbon emission efficiency (TCEE) and the tourism economy from the symbiotic perspective, enriching the research framework of the interaction mechanism. Secondly, this study adapted to the goal of “Carbon Peak and Carbon Neutral” and the requirements of the tourism economy’s high-quality development. Research on the carbon emission efficiency of tourism can guide the development of tourism to better assume corresponding responsibilities for carbon reduction. The evaluation system for the tourism economy’s high-quality development (TEHQD) was established, which can help to evaluate the development level of the tourism economy comprehensively and provide ideas for the tourism economy’s high-quality development. Thirdly, this study contributes to the realization of the Ecological Protection and High-quality Development strategy in the Yellow River Basin. Taking the nine provinces in the Yellow River Basin as the study area, the study of tourism’s carbon emission efficiency (TCEE) was used to connect with ecological protection, and the study of the tourism economy’s high-quality development was used to correspond with a high-quality development strategy, which can not only promote the development of the two but also contribute to the integration of the two.
The rest of this paper is organized as follows. The second part reviews the relevant literature of this paper. The third part introduces the model, the data source, the specific evaluation index system, and the formula. The fourth part is the empirical analysis of this paper, including the evaluation of TCEE, the evaluation of TEHQD, the evaluation of the symbiosis between TCEE and TEHQD, and the construction of the symbiosis interaction mechanism between TCEE and TEHQD. Following that, the research conclusion, the countermeasure suggestion, the shortage, and the prospect are given in the fifth part.

2. Literature Review

Tourism’s carbon emission efficiency (TCEE) refers to tourism’s ecological efficiency based on carbon emissions from the perspective of low carbon, which is used to observe the value that can be achieved by the cost of carbon emissions. At present, research on tourism’s ecological efficiency has covered concept [10], mechanism analysis [11], countermeasures and suggestions [12], model building [13,14], and efficiency measurement [15,16]. In terms of the specific content of the research, it mainly includes research on the input and output effect of tourism resources. For example, Jiang (2022) took tourism’s CO2 emission efficiency as undesired output, established an index system based on the input and output of tourism’s CO2 emission efficiency, and measured the tourism CO2 emission efficiency of Chinese provinces [17]. The application of tourism’s ecological efficiency to destination management, as well as the research on energy consumption and carbon emission intensity generated in the process of tourism are also receiving attention. Reilly (2010) studies have shown that tourism traffic is the most important part of energy consumption, and promoting the efficiency of transportation energy will help to enhance the efficiency of tourism ecology [18]. From the perspective of research methods, the current evaluation of tourism’s ecological efficiency mostly adopts the single ratio method [19], carbon footprint model [20], life cycle assessment [21], carrying capacity of the low-carbon tourism environment model [22], DEA model [23], and SBM-DEA model [24]. Some researchers who use the single ratio method to measure tourism’s carbon emission efficiency usually choose the two indexes of tourism’s carbon emissions and tourism’s income for accounting [25]. However, most researchers choose to use the “input-output” index and calculate the tourism carbon emission efficiency by establishing a model. From the perspective of the “input” index, it mainly focuses on capital input, labor input, resource input, and energy input [24]. From the perspective of “output” indicators, desirable output indicators such as tourism’s income and number of tourists are mainly used [26]. In terms of influencing factors, urbanization, economic development level, government regulation, and tourism development level have an impact on tourism’s ecological efficiency [27]. Other researchers analyzed the impact of foreign direct investment [28] and technology embedding [29] on tourism eco-efficiency. It can be seen that, at present, research on the influencing factors of tourism’s carbon emission efficiency are mostly focused on the single level of economy, industry, and technology, while the influencing factors of humanities, society, and environment are relatively rare. the exploration of multi-faceted influencing factors has not yet received attention. Researchers mostly use exponential decomposition [24], the regression model [28], or the spatial econometric model [24] to study the influencing factors and analyze the linear relationship between each influencing factor and tourism’s ecological efficiency, but they rarely consider the dynamic relationship and interaction mechanism between each influencing factor and tourism’s ecological efficiency.
Tourism development is closely related to economy, culture, and ecological environment [30]. With China’s requirements of high-quality development, the tourism economy’s high-quality development (TEHQD) has also entered the horizon of researchers. Research on the influencing factors of the development quality of the tourism economy has always been the focus of scholars [31]. It has been found that resource conservation, ecological environmental protection, and sustainable development are the important goals of tourism’s economic development and the important content of quality improvement [32]. Efficiency improvement, structural optimization, and environmental coordination are the core contents and important ways to promote the development of the tourism economy [33]. Scientific and reasonable arrangements should be made to maximize the adjustment of tourism’s resource development and ecological environment protection to improve the sustainable development capacity of the tourism economy [34].
The relationship between the development of the tourism economy and other factors has always been an important issue, such as the relationship between carbon emissions and international tourism growth [35], between tourism investment and energy innovation on carbon dioxide emissions [36], between tourism economy and regional integration [37], and between tourism economic development and government policy [38,39]. With the development of tourism and the improvement of the quality requirements of the tourism economy, the relationship between tourism and the ecological environment is increasingly concerned. Tourism development not only brings economic benefits to the local area, but it also increases the pressure on the local ecological environment [40]. Therefore, it is necessary to take certain measures to promote the coordination between tourism and the environment to realize the sustainable development of tourism [41]. In terms of research content, studies on the tourism economy and ecological environment mainly include their interaction [42], their coupling and coordinated development evaluation [43], influencing factors [44], policies and paths to promote their joint development [45], tourism’s ecological footprint measurement [46,47], tourism’s ecological efficiency [24], tourism’s environmental capacity [48,49], and tourism’s ecological security [50]. From the perspective of research methods, in addition to macro qualitative description, spatial data analysis [24], and econometric analysis [28], the coupled coordination model is the most common quantitative study [51].
To sum up, the evaluation of tourism’s efficiency from the perspective of ecology is the basis and premise for the realization of the high-quality and sustainable development of tourism, when low carbon tourism has become the goal and mode of tourism development. However, the current research on tourism’s carbon emission efficiency usually focuses on the form of tourism’s ecological efficiency and less directly considers the more detailed tourism carbon emission efficiency. In the calculation of tourism’s carbon emission efficiency, the single ratio method is mainly used, and the research method needs to be expanded urgently. The construction of the “input-output” evaluation index of tourism’s carbon emission efficiency rarely considers the undesired output. The few evaluation systems that include an undesired output rarely take tourism’s carbon emissions as a specific index. The influencing factors of tourism’s carbon efficiency focus on a single aspect, such as economy, industry, technology, society, and environment factors, and multifaceted influence factors are uncommon. Research on the relationship between various influencing factors and tourism’s ecological efficiency that gives priority to a linear relationship between the interaction mechanism and dynamic relationship is relatively lacking. The consideration of the development of the tourism economy is mainly based on a single factor, such as industry or technology, and lacks the comprehensive consideration of the tourism economy’s high-quality development. Studies on the relationship between the tourism economy and other factors are mainly about social and industrial factors; the relationship between the tourism economy and the ecological environment needs more attention. Most of the studies on tourism’s economic development related to the ecological environment are focused on the environment of the whole society, and few of them are detailed towards tourism or even tourism’s carbon emission efficiency. The research methods are mainly coupled and coordinated, while other methods should be applied.

3. Research Methods and Data Sources

3.1. Modeling and Data Sources

3.1.1. Modeling

The empirical analysis in this paper was based on the following analysis framework, as shown in Figure 1. This paper first used the Super-SBM model to calculate tourism’s carbon emission efficiency (TCEE) of the Yellow River Basin from 2010 to 2019. Secondly, the entropy method and linear weighting were used to comprehensively evaluate the tourism economy’s high-quality development (TEHQD). Finally, taking tourism’s carbon emission efficiency (TCEE) and the tourism economy’s high-quality development (TEHQD) as the symbiosis unit, the symbiosis degree model was used to reflect the correlation degree of their mutual influence. The symbiosis coefficient was used to measure the mutual influence degree between the two, and the geographical detector was used to explore the driving factors and obstructive factors affecting the symbiosis development of the two to construct an interactive mechanism model of tourism’s carbon emission efficiency (TCEE) and the tourism economy’s high-quality development (TEHQD).

3.1.2. Data Sources

This study covered nine provinces in the Yellow River Basin from 2010 to 2019. In the establishment of the index system of this paper, the actual operability and feasibility were considered. Thus, the statistical data from government departments were selected. The original data were from the “China Tourism Statistical Yearbook”, the “China Energy Statistical Yearbook”, the “China Transportation Statistical Yearbook”, the EPS database, the provincial statistical yearbook, and the social and economic development bulletin. In this paper, data with inconsistent accounting ranges in different years were processed, and some missing data were supplemented and improved by third-order moving average.
The “bottom-up” method was used to calculate the carbon emissions in advance for the undesired output data of tourism’s carbon emission efficiency (TCEE). The “bottom-up” carbon emission calculation method is based on the six elements of tourism, such as tourism transportation, tourism accommodation, and tourism activities. It is actually the best choice for the carbon emission calculation, according to the actual situation in China, and this method has been widely used in the tourism field in China. Because China has yet to establish a dedicated database of carbon accounts for tourism satellites, much of the data are not available. Therefore, the “bottom-up” carbon emission calculation is more reasonable and effective. The data measured by the symbiotic interaction model come from the evaluation results of tourism’s carbon emission efficiency (TCEE) and the tourism economy’s high-quality development (TEHQD).

3.2. Tourism’s Carbon Emission Efficiency (TCEE) Evaluation Index System and Evaluation Method

3.2.1. Evaluation Index System of Tourism’s Carbon Emission Efficiency (TCEE)

The input-output index system of TCEE was established as shown in Table 1. Among them, energy input was expressed by the ratio of the tertiary industry energy consumption to the total energy consumption. The desirable output included tourism income and tourist reception. Tourism income was measured by the ratio of the sum of the income of star hotels, travel agencies, and tourist attractions to the total tourism income, and tourist reception was measured by the ratio of the total number of tourists in tourist attractions to the total number of tourists.

3.2.2. Super-SBM Model

Since the traditional DEA model has the deviation of efficiency value caused by the relaxation of input and output, the undesirable output was incorporated into the evaluation system [52]. The non-radial and non-directional Super-SBM model based on relaxation variables was used to achieve the effective ordering of decision-making units [53]. Suppose there are n DMU (decision units), and each DMU has m input indicators, s1 desirable output indicators, s2 undesirable output indicators, and x, ye, and yu are the elements of the corresponding input matrix, desirable output matrix, and undesirable output matrix, respectively. Input matrix X = x 1 , x 2 , x 3 , , x n R m × n , and desirable output matrix Y e = y 1 e , y 2 e , y 3 e , , y n e R s 1 × n . The undesirable output matrix Y u = y 1 u , y 2 u , y 3 u , , y n u R s 2 × n . The Super-SBM model containing the undesired outputs is:
{ m i n ρ = 1 m i = 1 m x ¯ x i k 1 s 1 + s 2 r = 1 s 1 y e ¯ y r k e + t = 1 s 2 y u ¯ y r k u x ¯ j = 1 , k n x i j λ j ;   y e ¯ j = 1 , k n y r j e λ j ;   y u ¯ j = 1 , k n y t j d λ j ;   x ¯ x k ;   y e ¯ y k e ;   y u ¯ y k u λ j 0 ,   i = 1 , 2 , , m ; j = 1 , 2 , , n ,   j 0 ; r = 1 , 2 , , s 1 ; t = 1 , 2 , , s 2
x ¯ , y e ¯ , and y u ¯ represent the input, desirable output, and undesirable output vectors considering the slack variables, respectively,   j represents the decision unit, n is the number of decision-making units, k is the production period, and λ j is the weight vector of decision-making units. ρ is the efficiency value, ρ 1 is a relatively effective decision unit, and 0 < ρ < 1 is a relatively invalid decision unit.

3.3. Evaluation Index System and Evaluation Method for the Tourism Economy’s High-Quality Development (TEHQD)

3.3.1. Evaluation Index System of the Tourism Economy’s High-Quality Development (TEHQD)

The evaluation index system of TEHQD was established from five dimensions of “innovation, coordination, green, openness and sharing”, as shown in Table 2. A21 tourism R&D expenditure is represented by “the whole society R&D expenditure” multiplied by “the ratio of tourism production value to the gross national economic product”. A22 is represented by “R&D personnel in the whole society” multiplied by “ratio of tourism employees to total employment in the region”. A23 is represented by “total social fixed asset investment” multiplied by “ratio of tourism output value to GDP”. B24 is represented by the difference between “turnover of local passengers” and “total turnover of national passengers”. C22 is represented by the ratio of “garden green space area” to “total urban area”. D22 is represented by the ratio of “international tourists per 10,000 people” to “tourism employees”. E22 is expressed by the ratio of “park area” to “total population”.

3.3.2. Entropy Value Method

The method of assigning weight to entropy can avoid subjective judgment and ensure a scientific and effective index score [54]. First of all, standardized treatment should be carried out according to the basic indicators, and the formula is as follows:
x i j = X i j X j , min X j , m a x X j , m i n   positive   indicators X j , m a x X i j X j , m a x X j , m i n   negative   indicators
In the formula, X i j is the original value of the j index of the i sample, x i j is the normalized value of X i j . X j , m a x and X j , m i n are the maximum and minimum values of the j index, respectively, and there are m samples and n indexes. Since there is a value of 0 after normalization, x i j is shifted to the right by 1 unit to obtain x i j prime for logarithmic operation in the information entropy.
Determine the entropy value of item j :
H j = 1 l n m i = 1 m ( P i j × l n P i j )   ,   P i j = x i j / i = 1 m x i j
Determine the weight of item j :
w j = 1 H j / j = 1 n 1 H j
The linear weighted model was adopted to measure the comprehensive development level of the tourism economy’s high-quality development (TEHQD). The formula is as follows:
v E = j = 1 n w j e e j
v E is the value of TEHQD, w j e is the weight of each index of TEHQD, and e j is the standardized value of each index of TEHQD.

3.4. Symbiotic Interaction Model between Tourism’s Carbon Emission Efficiency (TCEE) and the Tourism Economy’s High-Quality Development (TEHQD)

3.4.1. Symbiosis Model

Symbiosis can describe the correlation degree of the variation of quality parameters between two symbiosis units or systems and reflect the correlation degree of their mutual influence [55]. This paper took tourism’s carbon emission efficiency (TCEE) and the tourism economy’s high-quality development (TEHQD) as symbiotic units and selected the added value of the comprehensive score of TCEE and TEHQD as the main quality parameters. Then, the symbiotic degree of TCEE and TEHQD is:
δ C E = d v C / v C d v E / v E = v E v C d v C d v E
Similarly, the symbiosis degree between TEHQD and TCEE is:
δ E C = d v E / v E d v C / v C = v C v E d v E d v C
If δ C E = δ E C > 0, it indicates that TCEE and TEHQD are in a positive symbiotic state. If δ C E δ E C > 0, then the two parties are in a positive asymmetric symbiosis. If δ C E = δ E C < 0, it indicates that TCEE and TEHQD are in a state of reverse symmetry symbiosis. If δ C E δ E C < 0, it indicates that both parties are in a state of reverse asymmetric symbiosis. If δ C E > 0 (=0, <0), δ E C < 0 (=0, >0), it indicates that the two parties are in the parasitic, coexisting, and parasitic states, respectively.

3.4.2. Symbiosis Coefficient

The symbiosis coefficient is usually used to measure the degree of mutual influence between symbiosis units. The symbiosis coefficient of the main quality parameters of tourism’s carbon emission efficiency (TCEE) and the tourism economy’s high-quality development (TEHQD) can be expressed as follows:
θ C M = δ C E m δ C E m + δ E C m  
θ E M = δ E C m δ C E m + δ E C m
θ C M + θ E M = 1
If θ C M = 0, it indicates that TCEE has no influence on the TEHQD. If θ C M = 1, it indicates that the TEHQD has no impact on the TCEE, but only the TCEE has an impact on the TEHQD. If 0 < θ C M < 0.5, it indicates that the TEHQD has a relatively large impact on TCEE. If θ C M = 0.5, the interaction between TCEE and TEHQD is the same. If 0.5 < θ C M < 1, it indicates that TCEE has a relatively large impact on the TEHQD.

3.4.3. Geographical Detector

The spatial differentiation of tourism’s carbon emission efficiency (TCEE) and the tourism economy’s high-quality symbiotic development (TEHQD) in the Yellow River Basin is explored by using geographic detectors [56]. The driving factors behind it were revealed, and the interactive mechanism of the two was explored.
Factor detection was used to analyze the spatial differentiation of dependent variable Y and the explanatory power of independent variable X i to the dependent variable, which is measured by the q value and expressed as follows:
q = 1 1 N σ h = 1 L N h σ h 2 = 1 S S W S S T ,   S S W = h = 1 L N h σ h 2 , S S T = N σ 2
where q represents the explanatory power of the influencing factor X i , q 0 , 1 . The larger the q value is, the stronger the explanatory power of the independent variable X to attribute Y is, and vice versa. N is the total number of provincial units, and N h is the total number of units in the province of the layer h divided by the variable factor. σ 2 is the total variance of Y value, and σ h 2 is the variance of the h layer. S S W and S S T are the sum of variances and total variances within layers, respectively.

4. Empirical Analysis

4.1. Calculation of Tourism’s Carbon Emission Efficiency (TCEE)

Under the condition that tourism’s carbon emissions are taken as an undesirable output, according to Formula (1), the Super-SBM model was used to calculate the tourism carbon emission efficiency (TCEE) of nine provinces in the Yellow River Basin from 2010 to 2019. The results are shown in Table 3. Tourism’s carbon efficiency in the Yellow River Basin has been fluctuating, rising slightly in 2010 compared to 2019. The average TCEE was 0.9782, in the medium level of efficiency, with the frontier still having room for improvement. Obviously, there is a big waste and diseconomy in tourism resources, and tourism’s carbon efficiency has great development potential.
From the perspective of spatial distribution, there were six provinces whose average TCEE exceeded 1 and whose TCEE was effective, which were, respectively, Ningxia, Inner Mongolia, Sichuan, Qinghai, Henan, and Shanxi. Among them, Ningxia ranked first in tourism’s carbon emission efficiency (1.1518). The last three provinces, Gansu, Shaanxi, and Shandong, had relatively low efficiency of tourism’s carbon emissions. Among them, the efficiency of Shandong was at the bottom of the Yellow River Basin (0.6908). The difference of TCEE between Shandong and Ningxia was 0.461, and the latter was 1.67 times of the former, indicating that there is a large inter-provincial difference in TCEE in the Yellow River Basin.
From the perspective of time distribution, the inter-annual change rates of TCEE in the Yellow River Basin from 2010 to 2019 were higher in Henan, Gansu, and Qinghai, while the inter-annual change rates were lower in Ningxia, Sichuan, and Shandong. In 2019, the TCEE of all provinces was effective, except for Shandong. Compared to 2010, the TCEE increased significantly in Qinghai, Gansu, Shaanxi, Shanxi, and Henan provinces, and it decreased significantly in Ningxia and Shandong provinces. It can be seen that the TCEE in the Yellow River Basin also had a large time difference.
From the perspective of the weight of each resource index of TCEE (Table 4), the weight of the output index was higher than that of the input, indicating that input factors need to be strengthened in order to achieve a higher efficiency of tourism carbon.
In terms of input index, energy input had the highest weight (0.1136), while resource input had the lowest weight (0.0792). Among them, total energy consumption (0.0289) had the highest weight. It can be seen that this index plays a significant role in TCEE. It is especially significant for the provinces with sparse population and abundant energy resources, such as Qinghai, Gansu, and Inner Mongolia, and the provinces with developed economy and large energy consumption, such as Henan and Shandong. The weight of the index of fixed asset investment of travel agencies (0.0156) was low, which shows that the existing capital investment of travel agencies cannot provide enough development space for tourism and needs to be strengthened, especially for Shanxi, Gansu, and Ningxia.
In terms of output index, the weight of desirable output (0.2879) was significantly higher than that of the undesirable output (0.1356), among which the weight of total number of visits (0.0431) was the highest, which is more significant for Qinghai, Sichuan, Inner Mongolia, Shanxi, and Henan. While the effect of total number of visits on Shandong is not obvious, the number of visitors plays a more important role in TCEE. The income of travel agencies (0.0162) had a low weight, and the contribution rate in Sichuan, Gansu, Inner Mongolia, and Shandong provinces was low, which is more dependent on the income of star hotels and scenic spots.

4.2. Evaluation of the Tourism Economy’s High-Quality Development (TEHQD)

According to Formulas (2)–(5), the comprehensive evaluation value of the tourism economy’s high-quality development (TEHQD) in the Yellow River Basin can be obtained, as shown in Table 5. From 2010 to 2019, the TEHQD in the Yellow River Basin showed a positive upward trend, except Shanxi, where the level of TEHQD fluctuated greatly. Other provinces had a gentle growth.
From the provincial TEHQD, it had the following three characteristics. First of all, the evaluation of TEHQD increased significantly, with an average growth rate of 3.3 times. Ningxia, Sichuan, and other western regions are developing faster because the economic development and policy dividend brought a series of advantages, such as industrial structure adjustment and tourism development, while the development speed of Shandong, Henan, and Shanxi are lower than the average level due to the eastern region as a whole entering the stage of slow development. The central region, such as Shanxi, should strive to adjust the industrial structure, change the current development mode, and pay more attention to the tourism economy’s high-quality development. Secondly, the TEHQD in different provinces is more and more obvious. In 2010, there was a difference of 0.0646 between Henan (0.1573), which ranked first, and Ningxia (0.0926), which ranked last. By 2019, there was a difference of 0.1482 between Ningxia (0.4503), which ranked first, and Shandong (0.3021), which ranked last, in the comprehensive evaluation value of TEHQD. The difference in 2019 was 2.3 times of that in 2010. Thirdly, from the average value of comprehensive evaluation, there was a certain similarity between the TEHQD and the evaluation of TCEE; thus, there was a co-existing relationship to some extent.
From the perspective of the weight of each resource index of TEHQD (Table 6), the open index (0.1363) and the sharing index (0.1194) had a large weight, indicating that these two indexes play a more obvious role in promoting TEHQD in the Yellow River Basin than other indexes. However, the coordination index (0.0928) had the smallest weight; thus, in order to realize the high-quality development of the regional tourism economy in the Yellow River basin, attention should be paid to the coordinated development of regions, industries, and other aspects.
In terms of the innovation index, the weight of tourism R&D expenditure was the highest (0.0363), indicating that this index plays a significant role, especially for the central and western provinces such as Qinghai, Sichuan, and Shaanxi. For the economically developed eastern regions, such as Shandong, tourism R&D personnel are more important. In terms of the coordination index, the proportion of the tertiary industry in the tourism economy had the highest weight (0.0318), and the index weight of Inner Mongolia and Henan was higher than the average level of the Yellow River basin, indicating that the industrial coordination degree has brought great dividends to the high-quality development of the local tourism economy. However, the proportion of the tertiary industry of the tourism economy in Sichuan and Ningxia is very low, indicating that this index has not brought the advantage of the high-quality development of the tourism economy to the local area. The proportion of the secondary industry of the tourism economy in Sichuan and the proportion of the primary industry of the tourism economy in Ningxia play a more important role. In terms of green indicators, the weight of each indicator is above 0.2, indicating that all indicators of green development play an important role. Among them, the weight of green coverage in built-up areas is the highest (0.0251), especially for cities with a high urbanization rate and a relatively developed economy, such as Sichuan, Henan, and Shandong. However, central and western provinces such as Qinghai, Gansu, Shaanxi, and Shanxi, with slower tourism and economic development and more serious environmental pollution, had the highest proportion of investment in environmental governance in GDP. For areas with excellent tourism development and sparse population such as Ningxia and Inner Mongolia, the contribution of tourism greening has become an important green index in TEHQD. In terms of the opening index, the foreign investment in tourism (0.0527) had the highest weight, but the foreign investment of tourism in Shanxi is relatively insufficient. The proportion of foreign tourists in the number of inbound tourists plays a more significant role in Shanxi (0.533), indicating that the proportion of foreign tourists in Shanxi is relatively large, which brings advantages to TEHQD. In terms of the sharing index, tourism per capita GDP (0.0177) had the lowest weight and needs to be strengthened.

4.3. Symbiotic Interaction between Tourism’s Carbon Emission Efficiency (TCEE) and the Tourism Economy’s High-Quality Development (TEHQD)

4.3.1. Calculation of Symbiosis Degree

According to Formulas (6) and (7), the symbiosis degree of tourism’s carbon emission efficiency (TCEE) and the tourism economy’s high-quality development (TEHQD) in the Yellow River Basin can be obtained, as shown in Table 7. In general, the average symbiosis degree of the Yellow River Basin is δ C E = 0.2617 > 0, δ E C = −2.1192 < 0, which indicates that there is a parasitic relationship between TCEE and TEHQD.
From a provincial perspective, the results show that, firstly, the average symbiosis of Qinghai, Sichuan, Gansu, Shaanxi, Shanxi, Henan, and Shandong provinces are δ C E > 0, δ E C < 0 or δ C E < 0, δ E C > 0, indicating that the TCEE and TEHQD in these regions are parasitic, but from the point of view of each year, it is positive or negative asymmetric symbiosis. The difference of the symbiosis coefficient in each year resulted in the deviation of the overall mean coefficient. Secondly, the average symbiosis degree of Ningxia was δ C E = −0.8605 δ E C = −5.6814 < 0, indicating that the TCEE and the TEHQD show a reverse asymmetric symbiosis. Thirdly, as the average symbiosis degree δ C E and δ E C were close, it can be considered that the TCEE and the TEHQD in Inner Mongolia have approximately presented a positive symbiosis and experienced a transition from positive asymmetric symbiosis to reverse asymmetric symbiosis to positive asymmetric symbiosis from 2010 to 2019.

4.3.2. Calculation of Symbiosis Coefficient

According to Formulas (8) and (9), the symbiosis coefficient of tourism’s carbon emission efficiency (TCEE) and the tourism economy’s high-quality development (TEHQD) in the Yellow River Basin was calculated, as shown in Table 8. The results all meet the feature that the sum of the symbiosis coefficients is 1 in Formula (10). In general, the average symbiosis coefficient of the Yellow River Basin is 0 < θ C M = 0.3885 < 0.5, 0.5 < θ E M = 0.6115 < 1, indicating that TEHQD has a relatively large impact on TCEE.
From a provincial perspective, the results show that, firstly, the symbiosis coefficient ( θ C M ) of Qinghai, Sichuan, Ningxia, Inner Mongolia, Shaanxi, Shanxi, and Henan is between 0 and 0.5, indicating that TEHQD has a greater impact on TCEE. That means TEHQD can play a positive impact on TCEE. Its development process fluctuated from 2010 to 2019, which is related to multiple factors such as provincial tourism development, economic development speed, and environmental background. Secondly, the symbiosis coefficient ( θ C M ) of Gansu and Shandong was between 0.5 and 1, indicating that TCEE has a relatively large impact on TEHQD. That is to say, the improvement of TCEE can promote the TEHQD to some extent. Among them, in recent years, Shandong province gradually changed into a TEHQD with a greater impact on TCEE, while Gansu province was in the promotion stage of TEHQD before 2014 (0 < θ C M < 0.5) and began to change into a TCEE with a greater impact after 2014. Thirdly, the symbiosis coefficient ( θ C M ) of Inner Mongolia, Shaanxi, Gansu, and Shandong was close to 0.5, which can be approximated as the state of interaction between TCEE and TEHQD, forming a relatively benign symbiosis state.
In conclusion, with the continuous development of economy, society, the demand of the nation, and people changing and under the influence of the national policies about the Yellow River Basin, tourism’s carbon efficiency has improved, and the tourism economy is changing to high quality development. In this procession, the TEHQD has undoubtedly contributed to the local economy, environment, and other aspects. At the same time, the improvement of TCEE can not only benefit the carbon environment, but it can also play an important role in the efficient and high-quality development of tourism, thus promoting the TEHQD. It can be seen that TCEE and the tourism economy in the Yellow River Basin form a corresponding symbiotic interface in the symbiotic environment, influencing, promoting, and developing each other in the symbiotic state.

4.4. Symbiotic Interaction Mechanism between Tourism’s Carbon Emission Efficiency (TCEE) and the Tourism Economy’s High-Quality Development (TEHQD)

4.4.1. Research on the Influencing Factors of Symbiotic Interaction

From the symbiotic interaction between TCEE and TEHQD, through the analysis of the explanatory power q of each effective factor, it was found that (Table 9), firstly, on the whole, energy input and capital input are the most important factors affecting the symbiosis between the TEHQD and the TCEE. Among them, D11 (the total energy consumption (0.9726)), C11 (the number of employees in hotels (0.9112)), and A11 (the original value of fixed assets of star hotels (0.8983)) have q values greater than 0.89, which are the key factors affecting symbiosis. Secondly, in 2011, energy factors were important factors affecting the symbiosis between the TEHQD and TCEE, and there was a large gap in explanatory power q with other factors. Among them, D11 (the total energy consumption (0.9612)) and D12 (the energy consumption of tertiary industry (0.9599)) were the key factors affecting symbiosis. Thirdly, in 2015, the effect of energy input factors was still significant, but the desirable output became the most important factor affecting the symbiosis between the TEHQD and TCEE. The gap between the explanatory power q of each factor gradually narrowed, and the explanatory power gap of other factors was very small except for the resource input, which all become relatively important influencing factors. Among them, E15 (the total number of visitors at scenic spot (0.9942)), E16 (the total number of visitors (0.9928)), and F13 (the carbon emission from tourism activity (0.9928)) are the most critical factors affecting symbiosis. Fourthly, compared to 2015, the explanatory power q of each factor decreased in 2019, and the gap widened. Capital input and labor input are important factors affecting the symbiosis between TEHQD and TCEE. C11 (the number of employees in hotels (0.9918)), A11 (the original value of fixed assets in star hotels (0.9854)), and D11 (the total energy consumption (0.9736)) are the key influencing factors. To sum up, with the development of time, the role of capital and labor input in TCEE gradually emerges, experiencing a development process from “energy” to “capital”. Among them, D12 (the effect intensity of tertiary industry energy consumption) and C12 (travel agency employees) decreased significantly, while the effect of C13 (scenic area employees), E12 (star hotel operating income), E15 (tourist attractions total number of reception), A11 (star hotel fixed assets), and other indicators gradually increased and changed significantly. Indicators such as D11 (total energy consumption), E14 (operating income of tourist attractions), and C11 (number of hotel employees) were important influencing factors in recent years.
From the symbiotic interaction between TEHQD and TCEE (Table 9), through the analysis of the explanatory power q of each effective factor, it can be found that, firstly, overall, coordination and innovation were the most important factors affecting the symbiosis between TCEE and TEHQD. The q values of A23 (tourism fixed asset investment (0.9363)), B24 (tourist turnover (0.9301)), A21 (tourism R&D expenditure (0.9241)), and C22 (tourism greening contribution (0.9076)) were all greater than 0.9, and these are the key factors affecting symbiosis. Secondly, in 2011, sharing factors were the most important factors affecting the symbiosis between TCEE and TEHQD. Among them, C21 (the green coverage rate of built-up area (0.9977)), E23 (the per capita disposable income of residents (0.9961)), and E22 (the per capita public recreation area (0.9959)) were the key factors affecting the symbiosis. Thirdly, in 2015 and 2019, coordination became the most important factor affecting the symbiosis between TCEE and TEHQD, followed by innovation. In 2015, A23 (tourism fixed asset investment (0.9791)), B22 (tourism economy secondary industry proportion (0.9584)), C23 (per capita park green area (0.9439)), E22 (per capita public recreation area (0.9439)), and A21 (tourism R&D expenditure (0.94)) were the key factors affecting symbiosis. By 2019, compared to 2015, in addition to A21 (tourism R&D expenditure (0.945)) and A23 (tourism fixed asset investment (0.945)), C22 (tourism greening contribution (0.9669)) and B24 (tourist turnover regional differences (0.9661)) became important influencing factors. To sum up, with the change of time, the role of innovation and coordination factors in TEHQD gradually came into prominence. It experienced a development procession of “sharing-coordination-innovation”. C21 (the effect intensity of built-up area green coverage rate), E23 (residents per capita disposable income), E22 (per capita public recreation area), and D23 (tourism foreign exchange income) decreased significantly. A23 (tourism fixed asset investment), C23 (per capita park green area), A21 (tourism R&D expenditure), B24 (regional differences in tourist turnover), and C24 (environmental governance investment in GDP) gradually increased and changed significantly. C22 (contribution to tourism greening) and D22 (number of international tourism employees per 10,000 people) have been important influencing factors in recent years. However, the gap between the explanatory power q of each influencing factor gradually widened.

4.4.2. Interactive Mechanism Model

  • Based on the symbiotic system theory
Based on the symbiotic system theory, a symbiotic interaction mechanism model of tourism’s carbon emission efficiency (TCEE) and the tourism economy’s high-quality development (TEHQD) was established by taking TCEE and TEHQD as two main symbiotic units (Figure 2). TCEE can evaluate the development quality of tourism from the dual perspectives of economy and ecology, and the TEHQD is based on a tourism economic development concept of “innovation, coordination, green, open and sharing”, which also involves many aspects such as economy, ecology, and tourism’s development quality. Therefore, there is a quality parameter compatibility between the two symbiotic units. That is, some attributes of the symbiotic units are related, so it can be judged that there is a symbiotic interaction between the two units. The symbiotic interface is the energy transmission channel between symbiotic units, and the transmission of different types of energy requires different symbiotic interfaces. Because the symbiosis between TCEE and TEHQD is relatively complex, involving multiple symbiotic internal and external environments, such as politics, economy, culture, society, and ecology, the tourism market, as the result of the comprehensive effect of TCEE and TEHQD, can represent the comprehensive interaction between the two symbiotic units and, thus, can serve as the symbiotic interface of the symbiotic interaction mechanism.
2.
Influencing factors based on interaction mechanism
From the perspective of the influencing factors of the interaction mechanism, symbiosis is a phenomenon of mutual influence and interaction between the two symbiotic units of TCEE and TEHQD (Figure 3). Through various interactions, the symbiotic relationship between the two symbiotic units can generate a new energy or achieve energy transformation, namely symbiosis energy generation. The specific performance is the symbiosis unit’s ability to improve. From the interactive influence of TCEE on TEHQD, energy input and the capital input factor are the main factors driving the two symbiotic coordination interaction. From the interactive impact of TEHQD on TCEE, coordination and innovation are the main factors promoting the symbiotic coordination and interaction between the two. It can be found that the total energy consumption, the number of hotel employees, and the original value of fixed assets of star hotels are the key attraction factors affecting the symbiosis from the perspective of the symbiotic interaction between TCEE and TEHQD. From the perspective of the symbiotic interaction between TEHQD and TCEE, the investment in fixed assets of tourism, the R&D expenditure of tourism, regional differences in passenger turnover, and the tourism greening contribution are the key attraction factors affecting the symbiosis.

5. Conclusions and Suggestions

5.1. Research Conclusions

Based on the calculation of tourism’s carbon emission efficiency (TCEE) and the evaluation of the tourism economy’s high-quality development (TEHQD), this paper discussed the symbiotic interaction mechanism between TCEE and TEHQD in nine provinces of the Yellow River Basin. The main conclusions are as follows:
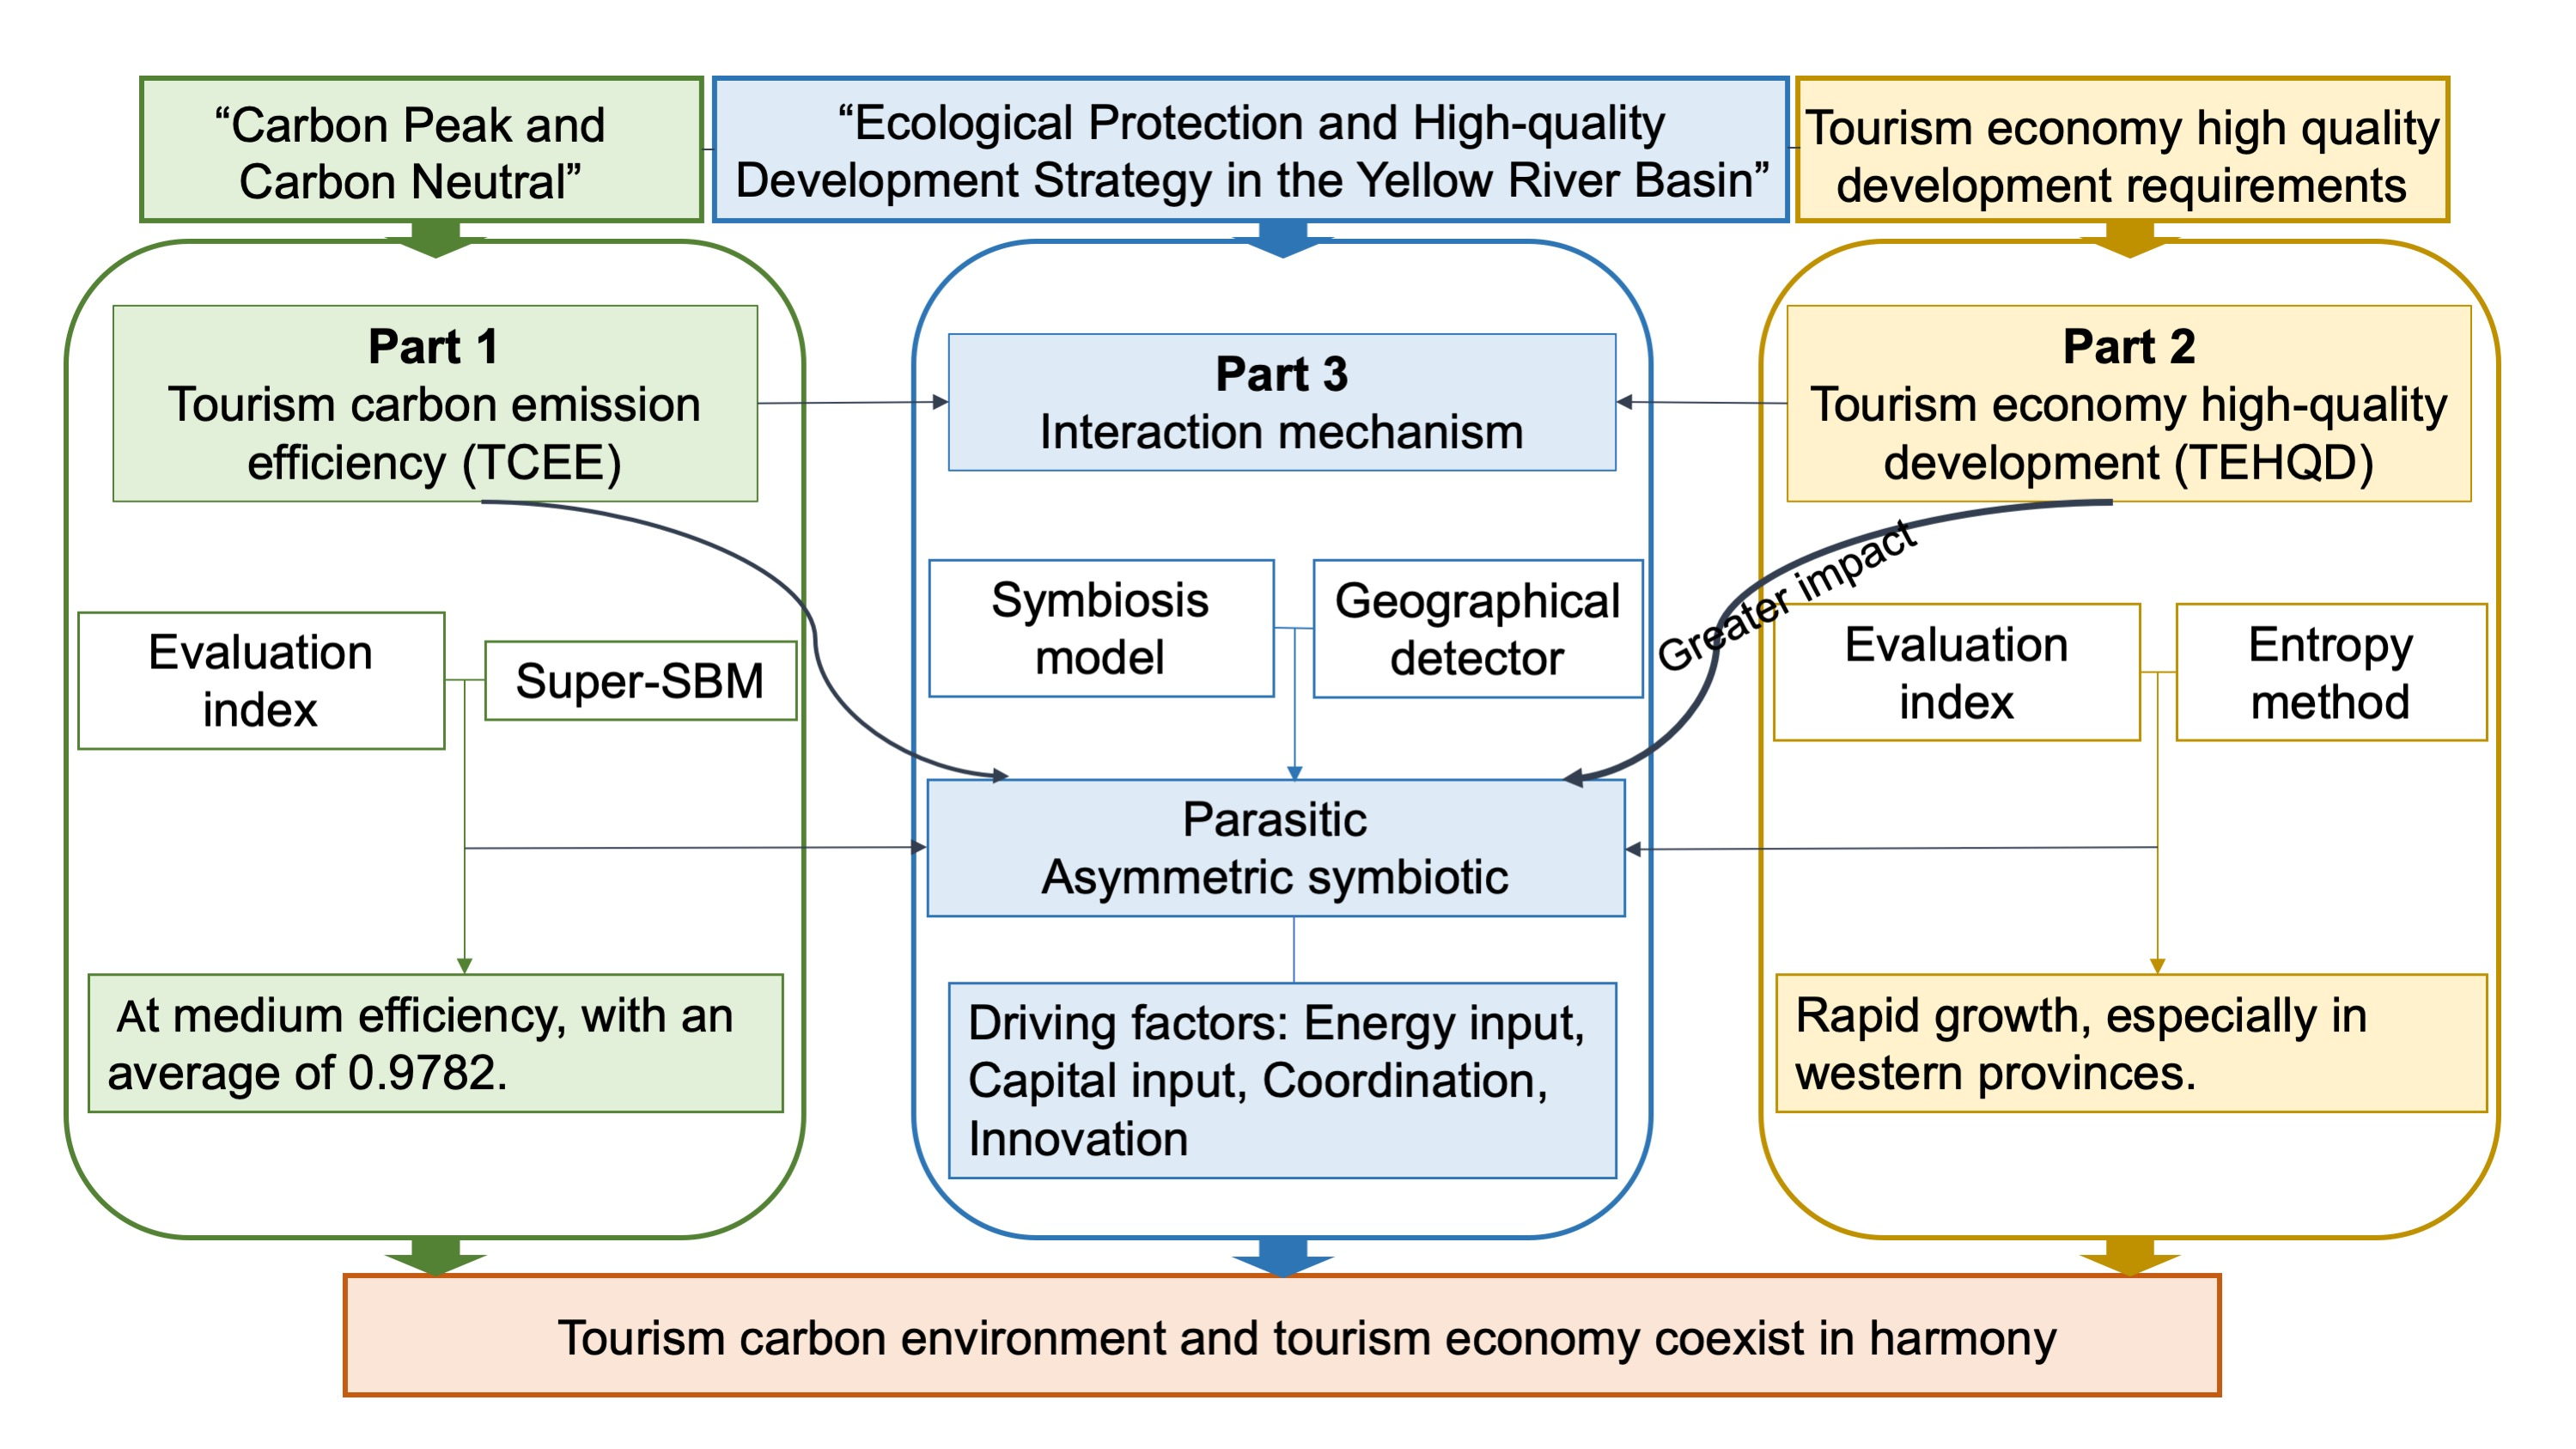
  • From the perspective of TCEE, the TCEE of the Yellow River Basin was in a state of fluctuation from 2010 to 2019, with a large time difference. The average value of TCEE in the Yellow River Basin was 0.9782, which is in the middle efficiency level. However, there was a large spatial difference in the TCEE of each province.
  • From the perspective of TEHQD, the evaluation of TEHQD in the Yellow River Basin increased from 2010 to 2019, and the speed of development was fast, especially in western provinces. The inter-provincial differences in the TEHQD gradually widened.
  • From the perspective of the symbiotic interaction between TCEE and TEHQD, on the whole, there was a parasitic relationship between TCEE and TEHQD in the Yellow River Basin. However, from the perspective of each year, all provinces showed positive or negative asymmetric symbiosis. The TEHQD in the Yellow River Basin has a greater impact on the TCEE. The TCEE and the TEHQD in Inner Mongolia, Shaanxi, Gansu, and Shandong provinces showed mutual influence and interaction ( θ C M is close to 0.5), forming a relatively harmonious symbiotic state.
  • From the influencing factors of symbiotic interaction between TCEE and TEHQD, energy input and capital input were the most important influence factors, but as time changed, the role of the energy input factor significantly reduced, and the role of labor input gradually emerged. Capital investment is always the key factor of symbiotic interaction between TCEE and TEHQD. Coordination and innovation are two important factors that affect the symbiosis between TCEE and TEHQD. With the change of time, the main influencing factors experienced a process of “sharing-coordination-innovation”.

5.2. Research Suggestions

Based on the above conclusions, the following suggestions and countermeasures are proposed:
  • In terms of tourism’s carbon emission in the Yellow River Basin, especially in Shandong, Henan, Sichuan, and other provinces with large carbon emissions, tourism transportation carbon emissions should be taken as the main body of emission reduction, focusing on the rail infrastructure and related supporting construction. The construction of central and western provinces especially need to strengthen the transport network and expand the advantages of rail transport to reduce high carbon emissions from air and road transport. Secondly, tourism’s energy consumption should be changed from the internal source. For example, the government can regulate the high energy consumption behavior of tourism enterprises and individuals by carbon emission tax, subsidy, and other ways. Tourism enterprises can also provide corresponding incentives and compensation measures for tourists.
  • In terms of tourism’s carbon emission efficiency (TCEE), firstly, on the basis of strengthening desirable output, input and undesirable output should be continuously reduced. Secondly, the Yellow River Basin provinces should make efforts to break the administrative regional barriers and promote experience exchange among provinces. Full play should be given to the leading role of provinces with high efficiency in tourism carbon emissions and the intercommunication of technology, concept, management, and other aspects among provincial administrative regions should be realized in the Yellow River Basin. In particular, the eastern region needs to focus on the issue of tourism’s carbon emission efficiency to solve the existing large regional differences. Thirdly, the creation of structural (tangible) measures are fundamental [5]. Governments and municipal councils should issue guidelines and establish participatory networks to involve various stakeholders related to tourism and planning.
  • In terms of the tourism economy’s high-quality development (TEHQD), firstly, we should focus on the “coordinated” development of regions, industries, and other aspects. Secondly, giving full play to the advantages of the provinces, the construction of the tourism economy’s high-quality development should be promoted in the Yellow River Basin. For example, Shandong and Henan rely on their good location conditions and economic advantages; thus, they should enhance the level of innovation and open up, promoting the development of green. At the same time, two-way interactions with the central and western regions should be strengthened to narrow the gap in the quality development of the tourism economy in different regions. Some provinces, such as Inner Mongolia, Shaanxi, and Shanxi should, on the basis of maintaining their current development status, give full play to their geographical advantages to link the east with the west and play the role of a bridge for regional connection. Qinghai, Sichuan, Ningxia, and Gansu should make full use of the advantages of good tourism resources, increase the input and output of tourism efficiency, and promote the tourism economy’s high-quality development.
  • In terms of the symbiotic interaction between tourism’s carbon emission efficiency (TCEE) and the tourism economy’s high-quality development (TEHQD), the efficiency of tourism’s carbon emissions should be improved to meet the tourism economy’s high-quality development, from the parasitic development to the symbiotic development. Secondly, each province should put forward countermeasures for its own problems according to local conditions. For example, Ningxia should focus on improving the efficiency of tourism’s carbon emissions; at the same time, they should strengthen the construction of the high-quality tourism economy, so that the reverse asymmetric symbiosis can gradually change to a positive symbiosis. Inner Mongolia should continue to maintain the approximate positive symbiosis relationship between tourism’s carbon emission efficiency and the tourism economy’s high-quality development and should promote its transition to positive symbiosis. Thirdly, the Yellow River Basin should pay more attention to the improvement of tourism’s carbon emission efficiency, while Gansu and Shandong should focus on improving the high-quality development level of the tourism economy.
  • In terms of the influencing factors of symbiotic interaction between tourism’s carbon emission efficiency (TCEE) and the tourism economy’s high-quality development (TEHQD). Firstly, energy input and capital input in tourism’s carbon emission efficiency should be strengthened. Energy utilization efficiency should be improved, and the green development level of tourism’s carbon emission efficiency should be promoted. Tourism capital input should be increased and the development of tourism boosted. Importance should be attached to the role of influencing factors such as total energy consumption, the number of hotel employees, and the original value of fixed assets of star hotels in tourism’s carbon emission efficiency in particular. Secondly, importance should be attached to the role of “coordination” and “innovation” in the tourism economy’s high-quality development. Increasing investment in innovation, increasing research and development funds, and cultivating innovative talents should all be priorities. Striving to narrow the gap between regions, industries, and departments, and realizing the coordinated and sustainable development of them should be considered as well. In particular, attention should be paid to the effects of fixed assets investment, R&D expenditure, regional differences in tourist turnover, and sharing degrees of tourism greening.

5.3. Limitations and Future Research Directions

This paper presented an evaluation method and constructed a symbiotic interaction mechanism between tourism’s carbon emission efficiency and the tourism economy’s high-quality development in the Yellow River Basin, which provides theoretical support for the subsequent evaluation and practical basis for subsequent policy practice. However, due to the availability of data and the inadequacy of previous relevant studies, the selection and establishment of the index system may have deficiencies. At the same time, the selection of indicators are quantitative indicators without qualitative evaluation, which has limitations. To select a case in this paper, on the other hand, there is a limit too. It can only reflect the status of the Yellow River basin, a single specific area. At the same time, the influencing factors of the interaction mechanism were not further subdivided, such as the different effects of political, economic, cultural, social, and ecological factors on the interaction mechanism.
Thus, in the future, the measurement of tourism’s carbon emission and its efficiency should be more precise and specific. For example, a variety of methods can be used to compare to obtain more accurate results, or the carbon emissions of the ecosystem in terms of technogenic pollution can be taken into account. Further exploration will be carried out from the aspects of technology and energy efficiency, such as studying the impact of existing technologies on tourism’s carbon emission efficiency and further on tourism economy or the impact of innovative technologies on energy efficiency in tourism. Secondly, the symbiotic interaction mechanism between tourism’s carbon emission efficiency and the tourism economy’s high-quality development can be explored from multiple regions and multiple levels. On the basis of expanding the research area, different research scales were explored from different levels, such as region, city, county, or village to build a complete interactive mechanism model. Thirdly, the symbiotic interaction mechanism between tourism carbon emission efficiency and tourism economy high-quality development was studied from multiple perspectives. To improve the selection of influencing factors and the establishment of the index system, different mechanisms of action can be studied from the internal and external aspects of the symbiotic interaction system. On this basis, different types of influencing factors can be explored separately to find the commonality and individuality of each type of factor.

Author Contributions

Conceptualization, S.L. and Z.C.; methodology, S.L. and Z.C.; funding acquisition, Y.T. and B.H.; investigation, S.L., Z.C., Y.T. and B.H.; resources, Z.C.,Y.T. and B.H.; software, S.L. and Z.C.; formal analysis, S.L. and Z.C.; data curation, S.L.; writing—original draft preparation, S.L. and Z.C.; writing—review and editing, S.L. and B.H.; visualization, S.L.; supervision, B.H.; project administration, B.H. and Y.T. All authors have read and agreed to the published version of the manuscript.

Funding

This research was supported by the Project of Hainan Academician Innovation Platform Scientific Research (YSPTZX202210), the Project of National Social Science Foundation of China (21BJY194).

Institutional Review Board Statement

Not applicable.

Informed Consent Statement

Not applicable.

Data Availability Statement

The sources of relevant data acquisition have been described in the text.

Conflicts of Interest

The authors declare no conflict of interest.

References

  1. Gössling, S. Global Environmental Consequences of Tourism. Glob. Environ. Chang. 2002, 12, 283–302. [Google Scholar] [CrossRef]
  2. Scott, D.; Amelung, B.; Ceron, J.P.; Dubois, G.; Gössling, S.; Peeters, P.; Simpson, M.C. Climate Change and Tourism: Responding to Global Challenges. Climate Change & Tourism Responding to Global Challenges; UNWTO: Madrid, Spain, 2007; pp. 168–181. [Google Scholar]
  3. Lopes, H.; Remoaldo, P.; Silva, M.; Ribeiro, V.; Vide, J.M. Climate in Tourism’s Research Agenda: Future Directions Based on Literature Review. Geogr. Bull. 2021, 90, 1–58. [Google Scholar] [CrossRef]
  4. Scott, D.; Hall, C.M.; Gossling, S. Global Tourism Vulnerability to Climate Change. Ann. Tour. Res. 2019, 77, 49–61. [Google Scholar] [CrossRef]
  5. Lopes, H.; Remoaldo, P.; Ribeiro, V.; Javier, M. Pathways for Adapting Tourism to Climate Change in an Urban Destination—Evidences Based on Thermal Conditions for the Porto Metropolitan Area (Portugal). J. Environ. Manag. 2022, 315, 115161. [Google Scholar] [CrossRef]
  6. UNWTO. Tourism Highlights, 2014th ed.; World Tourism Organization: Madrid, Spain, 2014. [Google Scholar]
  7. Stryzhak, O. Assessment of the Relationship Between the Tourism Sector Development and Other Sectors of Economy. Econ. Dev. 2019, 18, 10–18. [Google Scholar] [CrossRef]
  8. Zhang, F.; Peng, H.; Sun, X.; Song, T. Influence of Tourism Economy on Air Quality-An Empirical Analysis Based on Panel Data of 102 Cities in China. Int. J. Environ. Res. Public Health 2022, 19, 4393. [Google Scholar] [CrossRef] [PubMed]
  9. Sun, Y.Y. Decomposition of Tourism Greenhouse Gas Emissions: Revealing the Dynamics between Tourism Economic Growth, Technological Efficiency, and Carbon Emissions. Tour. Manag. 2016, 55, 326–336. [Google Scholar] [CrossRef]
  10. William, D.J. Changing Course: A Global Business Perspective on Development and the Environment. Thromb. Haemost. 1992, 111, 575–582. [Google Scholar]
  11. Ruan, W.; Li, Y.; Zhang, S.; Liu, C.H. Evaluation and Drive Mechanism of Tourism Ecological Security Based on the DPSIR-DEA Model. Tour. Manag. 2019, 75, 609–625. [Google Scholar] [CrossRef]
  12. Surugiu, C.; Surugiu, M.R.; Breda, Z.; Dinca, A.I. An Input-output Approach of CO2 Emissions in Tourism Sector in Post-communist Romania. Procedia Econ. Financ. 2012, 3, 987–992. [Google Scholar] [CrossRef]
  13. Liu, G.; Shi, P.; Hai, F.; Zhang, Y.; Li, X. Study on Measurement of Green Productivity of Tourism in the Yangtze River Economic Zone, China. Sustainability 2018, 10, 2786. [Google Scholar] [CrossRef] [Green Version]
  14. Kytzia, S.; Walz, A.; Wegmann, M. How Can Tourism Use Land More Efficiently? A Model-based Approach to Land-use Efficiency for Tourist Destinations. Tour. Manag. 2011, 32, 629–640. [Google Scholar] [CrossRef]
  15. Perch-Nielsen, S.; Sesartic, A.; Stucki, M. The Greenhouse Gas Intensity of the Tourism Sector: The Case of Switzerland. Environ. Sci. Policy 2010, 13, 131–140. [Google Scholar] [CrossRef]
  16. Zha, J.; He, L.; Liu, Y.; Shao, Y. Evaluation on Development Efficiency of Low-carbon Tourism Economy: A Case Study of Hubei Province, China. Socio-Econ. Plan. Sci. 2019, 66, 47–57. [Google Scholar] [CrossRef]
  17. Jiang, G.; Zhu, A.; Li, J. Measurement and Impactors of Tourism Carbon Dioxide Emission Efficiency in China. J. Environ. Public Health 2022, 14, 9161845. [Google Scholar] [CrossRef] [PubMed]
  18. Reilly, J.; Williams, P.; Haider, W. Moving Towards More Eco-efficient Tourist Transportation to a Resort Destination: The Case of Whistler, British Columbia. Res. Transp. Econ. 2010, 26, 66–73. [Google Scholar] [CrossRef]
  19. Li, P.; Yang, L.G. Ecological Footprint Study on Tourism Itinerary Products in Shangri-La, Yunnan Province, China. Acta Ecol. Sin. 2007, 27, 2954–2963. [Google Scholar] [CrossRef]
  20. Li, Y.; Zhang, L. Ecological Efficiency Management of Tourism Scenic Spots Based on Carbon Footprint Analysis. Int. J. Low-Carbon Technol. 2020, 15, 550–554. [Google Scholar] [CrossRef]
  21. Kuo, N.; Chen, P. Quantifying Energy Use, Carbon Dioxide Emission, and Other Environmental Loads from Island Tourism Based on a Life Cycle Assessment Approach. J. Clean. Prod. 2009, 17, 1324–1330. [Google Scholar] [CrossRef]
  22. Han, J. Carrying Capacity of Low Carbon Tourism Environment in Coastal Areas from the Perspective of Ecological Efficiency. J. Coast. Res. 2018, 83, 199–203. [Google Scholar] [CrossRef]
  23. Zha, J.; Tan, T.; Yuan, W.; Yang, X.; Zhu, Y. Decomposition Analysis of Tourism CO2 Emissions for Sustainable Development: A Case Study of China. Sustain. Dev. 2020, 28, 169–186. [Google Scholar] [CrossRef]
  24. Haibo, C.; Ke, D.; Fangfang, W.; Ayamba, E.C. The Spatial Effect of Tourism Economic Development on Regional Ecological Efficiency. Environ. Sci. Pollut. Res. Int. 2020, 27, 1–18. [Google Scholar] [CrossRef] [PubMed]
  25. Qiu, X.; Fang, Y.; Yang, X.; Zhu, F. Tourism Eco-Efficiency Measurement, Characteristics, and Its Influence Factors in China. Sustainability 2017, 9, 1634. [Google Scholar] [CrossRef]
  26. Guo, L.; Li, P.; Zhang, J.; Xiao, X.; Peng, H. Do Socio-economic Factors Matter? A Comprehensive Evaluation of Tourism Eco-efficiency Determinants in China Based on the Geographical Detector Model. J. Environ. Manag. 2022, 320, 115812. [Google Scholar] [CrossRef]
  27. Xiong, G.; Deng, J.; Ding, B. Characteristics, Decoupling Effect, and Driving Factors of Regional Tourism’s Carbon Emissions in China. Environ. Sci. Pollut. Res. Int. 2022, 29, 47082–47093. [Google Scholar] [CrossRef]
  28. Tong, Y.; Zhou, H.; Jiang, L. Exploring the Transition Effects of Foreign Direct Investment on the Eco-efficiency of Chinese Cities: Based on Multi-source Data and Panel Smooth Transition Regression Models. Ecol. Indic. 2020, 121, 107073. [Google Scholar] [CrossRef]
  29. Nitti, M.; Pilloni, V.; Giusto, D.; Popescu, V. IoT Architecture for a Sustainable Tourism Application in a Smart City Environment. Mob. Inf. Syst. 2017, 2017, 9201640. [Google Scholar] [CrossRef]
  30. Cortés-Jiménez, I. Which Type of Tourism Matters to the Regional Economic Growth? The Cases of Spain and Italy. Int. J. Tour. Res. 2010, 10, 127–139. [Google Scholar] [CrossRef]
  31. Hassan, T.H.; Salem, A.E.; Abdelmoaty, M.A. Impact of Rural Tourism Development on Residents’ Satisfaction with the Local Environment, Socio-Economy and Quality of Life in Al-Ahsa Region, Saudi Arabia. Int. J. Environ. Res. Public Health 2022, 19, 4410. [Google Scholar] [CrossRef]
  32. Shi, C.; Peng, J. Construction of Low-carbon Tourist Attractions Based on Low-carbon Economy. Energy Procedia 2011, 5, 759–762. [Google Scholar] [CrossRef]
  33. Zhang, Y.; Tian, L. The Sustainable Development of Circular Economy under the Perspective of Ecological Tourism. Adv. Mater. Res. 2014, 1010–1012, 2090–2093. [Google Scholar] [CrossRef]
  34. Tang, Z.; Shi, C.B.; Liu, Z. Sustainable Development of Tourism Industry in China under the Low-carbon Economy. Energy Procedia 2011, 5, 1303–1307. [Google Scholar] [CrossRef]
  35. Akadiri, S.S.; Lasisi, T.T.; Uzuner, G.; Akadiri, A.C. Examining the Impact of Globalization in the Environmental Kuznets Curve Hypothesis: The Case of Tourist Destination States. Environ. Sci. Pollut. Res. Int. 2019, 26, 12605–12615. [Google Scholar] [CrossRef]
  36. Balsalobre-Lorente, D.; Driha, O.M.; Leitão, N.C.; Murshed, M. The Carbon Dioxide Neutralizing Effect of Energy Innovation on International Tourism in EU-5 Countries Under the Prism of The EKC Hypothesis. J. Environ. Manag. 2021, 298, 113513. [Google Scholar] [CrossRef] [PubMed]
  37. Andraz, J.M.; Norte, N.M.; Goncalves, H.S. Effects of Tourism on Regional Asymmetries: Empirical Evidence for Portugal. Tour. Manag. 2015, 50, 257–267. [Google Scholar] [CrossRef]
  38. Araujo, L.M.D.; Bramwell, B. Partnership and Regional Tourism in Brazil. Ann. Tour. Res. 2002, 29, 1138–1164. [Google Scholar] [CrossRef]
  39. Baidal, J. Regional Development Policies: An Assessment of Their Evolution and Effects on the Spanish Tourist Model. Tour. Manag. 2003, 24, 655–663. [Google Scholar] [CrossRef]
  40. Morri, E.; Pruscini, F.; Scolozzi, R.; Santolini, R. A Forest Ecosystem Services Evaluation at the River Basin Scale: Supply and Demand Between Coastal Areas and Upstream Lands (Italy). Ecol. Indic. 2014, 37, 210–219. [Google Scholar] [CrossRef]
  41. Mbaiwa, J.E. The Socio-economic and Environmental Impacts of Tourism Development on the Okavango Delta, North-western Botswana. J. Arid Environ. 2003, 54, 447–467. [Google Scholar] [CrossRef]
  42. Wang, Z.W. Interaction Between the Tourism Industry and Ecological Environment Based on the Complicated Adaptation System (CAS) Theory: A Case Study on Henan Province, China. Nat. Environ. Pollut. Technol. 2020, 19, 1039–1045. [Google Scholar] [CrossRef]
  43. Wang, Z.W.; Han, H.L. Analysis on Tourism Environmental Pollution and Tourism Economy-Ecological Environmental Coordination Degree: A Case Study from China. Nat. Environ. Pollut. Technol. 2021, 20, 1353–1361. [Google Scholar] [CrossRef]
  44. Pan, Y.; Weng, G.; Li, C.; Li, J. Coupling Coordination and Influencing Factors among Tourism Carbon Emission, Tourism Economic and Tourism Innovation. Int. J. Environ. Res. Public Health 2021, 18, 1601. [Google Scholar] [CrossRef]
  45. Liu, Y.; Suk, S. Coupling and Coordinating Relationship between Tourism Economy and Ecological Environment-A Case Study of Nagasaki Prefecture, Japan. Int. J. Environ. Res. Public Health 2021, 18, 12818. [Google Scholar] [CrossRef] [PubMed]
  46. Hunter, C.; Shaw, J. The Ecological Footprint as a Key Indicator of Sustainable Tourism. Tourism Management 2007, 28, 46–57. [Google Scholar] [CrossRef]
  47. Gössling, S.; Hansson, C.B.; Horstmeier, O.; Saggel, S. Ecological Footprint Analysis as A Tool to Assess Tourism Sustainability. Ecol. Econ. 2002, 43, 199–211. [Google Scholar] [CrossRef]
  48. Lawson, S.R.; Manning, R.E.; Valliere, W.A.; Wang, B. Proactive Monitoring and Adaptive Management of Social Carrying Capacity in Arches National Park: An Application of Computer Simulation Modeling. J. Environ. Manag. 2003, 68, 305–313. [Google Scholar] [CrossRef]
  49. Zhang, X.H.; Lin, M.; Lin, S. The Method of Tourism Environmental Carrying Capacity. Ecosyst. Assess. Fuzzy Syst. Manag. 2014, 254, 87–92. [Google Scholar]
  50. Xu, M.; Liu, C.; Li, D.; Zhong, X.L. Tourism Ecological Security Early Warning of Zhangjiajie, China Based on the Improved TOPSIS Method and the Grey GM (1,1) Model. J. Appl. Ecol. 2017, 28, 3731–3739. [Google Scholar]
  51. Lai, Z.; Ge, D.; Xia, H.; Yue, Y.; Wang, Z. Coupling Coordination between Environment, Economy and Tourism: A Case Study of China. PLoS ONE 2020, 15, e0228426. [Google Scholar] [CrossRef]
  52. Zahedi-Seresht, M.; Khosravi, S.; Jablonsky, J.; Zykova, P. A Data Envelopment Analysis Model for Performance Evaluation and Ranking of DMUs with Alternative Scenarios. Comput. Ind. Eng. 2020, 152, 107002. [Google Scholar] [CrossRef]
  53. Zhao, P.J.; Zeng, L.E.; Lu, H.Y.; Zhou, Y.; Hu, H.Y.; Wei, X.Y. Green Economic Efficiency and its Influencing Factors in China From 2008 to 2017: Based on the Super-SBM Model with Undesirable Outputs and Spatial Dubin Model. Sci. Total Environ. 2020, 741, 140026. [Google Scholar] [CrossRef]
  54. Wang, F.; Liu, P.; Wang, P. An Evaluation Study of Rural Scientific and Technological Talents Based on TODIM Method with Hybrid Indicator. J. Intell. Fuzzy Syst. 2021, 40, 1–14. [Google Scholar] [CrossRef]
  55. Lan, Q.; Liu, C.; Ling, S. Research on Measurement of Symbiosis Degree Between National Fitness and the Sports Industry from the Perspective of Collaborative Development. Int. J. Environ. Res. Public Health 2019, 16, 2191. [Google Scholar] [CrossRef] [Green Version]
  56. Zhou, C.S.; Chen, J.; Wang, S.J. Examining the Effects of Socioeconomic Development on Fine Particulate Matter (PM2.5) in China’s Cities Using Spatial Regression and the Geographical Detector Technique. Sci. Total Environ. 2018, 619–620, 436–445. [Google Scholar] [CrossRef]
Figure 1. Analysis framework of the symbiotic interaction model between tourism’s carbon emission efficiency (TCEE) and the tourism economy’s high-quality development (TEHQD).
Energies 15 06975 g001
Figure 2. Symbiotic interaction mechanism model of tourism’s carbon emission efficiency (TCEE) and the tourism economy’s high-quality development (TEHQD) in the Yellow River Basin.
Energies 15 06975 g002
Figure 3. Interactive mechanism model of tourism’s carbon emission efficiency (TCEE) and the tourism economy’s high-quality development (TEHQD) in the Yellow River Basin.
Energies 15 06975 g003
Table 1. Evaluation index system of tourism’s carbon emission efficiency (TCEE).
TCEE SystemIndicator TypeIndicatorsIndicators Direction
InputA1 Capital inputA11 Original value of fixed assets of star hotels/thousand yuan+
A12 Original value of fixed assets of travel agency/thousand yuan+
B1 Resource inputB11 Number of star-rated hotels+
B12 Number of travel agencies+
B13 The scenic area number+
C1 Labor inputC11 Number of hotel employees+
C12 Number of travel agency employees+
C13 Number of employees in scenic spots+
D1 Energy inputD11 Total energy consumption/tons of standard coal+
D12 Energy consumption in the tertiary industry/tons of standard coal+
OutputE1 Desirable outputE11 Tourism revenue/100 million yuan+
E12 Star hotel operating income/100 million yuan+
E13 Travel agency revenue/100 million yuan+
E14 Tourist attractions operating income/100 million yuan+
E15 Total number of visitors in tourist attractions/100 million yuan+
E16 Total number of visits/100 million yuan+
F1 Undesirable outputF11 Tourism transport carbon emissions/tone
F12 Tourism accommodation carbon emissions/tone
F13 Tourism activity carbon emission/tone
Table 2. Evaluation index system of the tourism economy’s high-quality development (TEHQD).
TEHQD SystemIndicator TypeIndicatorsIndicators Direction
Tourism economy high-quality developmentA2 InnovationA21 Tourism R&D expenditure/yuan+
A22 Tourism R&D personnel+
A23 Investment in fixed assets of tourism/thousand yuan+
B2 CoordinationB21 Proportion of the primary industry in tourism economy/%+
B22 Proportion of the secondary industry in tourism economy/%+
B23 Proportion of the tertiary industry in tourism economy/%+
B24 Regional difference in passenger turnover/100 million passenger-km+
C2 GreenC21 Green coverage rate of built-up area/%+
C22 Tourism greening contribution/%+
C23 Per capita green area of park/square meters+
C24 Proportion of investment in environmental governance in GDP/%+
D2 opennessD21 Proportion of foreign tourists in inbound tourists/%+
D22 Number of international tourism employees per 10,000 people+
D23 Foreign exchange income from tourism/100 million dollars+
D24 Foreign investment in tourism/100 million dollars+
E2 SharingE21 Tourism employment contribution/%+
E22 Per capita public recreation area m2/person+
E23 Capita disposable income of households/yuan+
E24 Capita GDP/yuan+
Table 3. Tourism’s carbon emission efficiency (TCEE) in the nine provinces in the Yellow River Basin.
ProvinceYearAverageRank
2010201120122013201420152016201720182019
Qinghai0.10470.13451.24730.56431.30901.03191.03551.89841.75811.55161.06354
Sichuan1.32641.26621.13351.50011.48941.29150.38820.27551.28591.25861.12152
Gansu0.19671.13401.08400.22681.15521.01291.44720.34161.22391.03520.88587
Ningxia1.39790.31291.24391.09341.18441.25311.39061.36071.13251.14861.15181
Inner Mongolia1.10121.25101.27991.90100.68441.76580.42461.23770.32221.11931.10873
Shaanxi0.07590.21930.45430.42350.37801.54341.03471.10390.48751.33000.70518
Shanxi0.35601.30701.41611.57740.66100.24971.04801.98540.36561.24641.02136
Henan1.17050.19231.16140.55341.30910.20082.10810.33291.64831.87641.05535
Shandong1.44821.38760.30191.17201.20281.05780.10590.06290.04430.12410.69089
Yellow River Basin0.79750.80051.03581.00131.04151.04520.99810.95550.91871.18780.9782
Table 4. Weight of tourism’s carbon emission efficiency (TCEE) evaluation index of the nine provinces in the Yellow River Basin.
TCEE SystemIndicatorsQinghaiSichuanGansuNingxiaInner MongoliaShaanxiShanxiHenanShandong
A1
(0.0981)
A11
(0.0198)
0.01170.01320.02760.01380.03460.01980.01840.02860.0102
A12
(0.0156)
0.01470.01410.01360.00920.01690.01730.01390.01410.0262
B1
(0.0792)
B11
(0.0221)
0.01840.01860.02530.02970.02710.01790.02120.01870.0222
B12
(0.0192)
0.01920.01790.01550.01680.02280.01790.01400.03380.0149
B13
(0.0220)
0.01140.01750.02060.01540.03310.03310.02100.02160.0247
C1
(0.0899)
C11
(0.0258)
0.01880.02590.02350.02290.03720.03590.02350.01350.0309
C12
(0.0169)
0.01390.01170.01240.02900.00980.03590.01090.01680.0118
C13
(0.0166)
0.01830.01380.02010.00980.00990.02410.01130.01600.0259
D1
(0.1136)
D11
(0.0289)
0.04060.01380.03930.01530.03450.02830.02260.03510.0304
D12
(0.0202)
0.02600.01420.01370.01530.02210.02050.02900.02220.0191
E1
(0.2879)
E11
(0.0330)
0.03760.03220.03490.02650.03260.03700.03500.03780.0231
E12
(0.0269)
0.02560.05420.01230.00960.02370.02400.03640.01880.0378
E13
(0.0162)
0.01850.01180.01170.01600.01160.01860.02580.02000.0118
E14
(0.0346)
0.02480.04900.04290.10010.02250.02400.02160.01600.0106
E15
(0.0329)
0.03200.02240.04330.03190.02850.02630.04110.02790.0425
E16
(0.0431)
0.04170.03390.02950.02520.03460.03130.03590.03610.1196
F1
(0.1356)
F11
(0.0183)
0.02170.02050.02920.01720.01540.01320.01340.01930.0151
F12
(0.0264)
0.01880.01410.03850.03220.06160.01110.02410.01830.0185
F13
(0.0218)
0.01870.04890.01610.01330.01240.02370.01790.01820.0273
Table 5. Comprehensive evaluation of the tourism economy’s high-quality development (TEHQD) of the nine provinces in the Yellow River Basin.
ProvinceYearAverageRank
2010201120122013201420152016201720182019
Qinghai0.10060.14880.14290.18490.20300.23170.32080.36720.34110.38490.24262
Sichuan0.11020.12930.15000.18240.19780.21950.26880.29610.33000.44750.23323
Gansu0.11010.09300.16030.20710.19450.20840.25220.26110.31220.40940.22085
Ningxia0.09260.09880.11570.14510.15470.17330.23220.33330.34410.45030.21408
Inner Mongolia0.10960.11910.12630.16750.19710.23870.24600.29080.30970.39630.22017
Shaanxi0.12450.11160.15450.18810.24910.26670.30510.34310.36790.42240.25331
Shanxi0.15280.18890.23120.27380.19920.18110.23510.22280.27710.34250.23044
Henan0.15730.13320.12950.13880.14720.18180.24710.30530.34080.42120.22026
Shandong0.12130.12210.15920.17110.20530.21620.24290.27500.28530.30210.21009
Yellow River Basin0.11990.12720.15220.18430.19420.21310.26110.29940.32310.39740.2272
Table 6. Weight of the tourism economy’s high-quality development (TEHQD) evaluation index of the nine provinces in the Yellow River Basin.
TEHQD
System
IndicatorsQinghaiSichuanGansuNingxiaInner MongoliaShaanxiShanxiHenanShandong
A2
(0.0959)
A21
(0.0363)
0.04320.04130.03530.03470.03490.04290.03390.03570.0245
A22
(0.0277)
0.02310.03900.01840.02340.02100.02920.02960.03650.0292
A23
(0.0319)
0.04010.03240.03060.02590.03300.03500.03090.03520.0244
B2
(0.0928)
B21
(0.0214)
0.02700.02750.01730.02300.02070.02090.02080.01560.0194
B22
(0.0191)
0.01690.03510.01530.02000.01800.01800.02210.01480.0120
B23
(0.0318)
0.02690.01530.03070.02020.04850.02690.03200.05910.0270
B24
(0.0205)
0.02350.02190.02010.01790.01970.02310.02120.01850.0183
C2
(0.0953)
C21
(0.0251)
0.02740.03160.02040.02510.01920.02230.02440.03180.0236
C22
(0.0248)
0.01830.01080.01710.04900.02680.01930.02850.02950.0236
C23
(0.0209)
0.01740.02660.02310.02460.01400.01610.01490.03130.0196
C24
(0.0245)
0.04150.01510.03140.01220.01210.03020.03010.02560.0226
D2
(0.1363)
D21
(0.0254)
0.01960.01640.02650.01610.02990.01850.05330.01780.0308
D22
(0.0283)
0.01710.01540.03150.03960.01180.02240.04380.03330.0401
D23
(0.0299)
0.03350.02440.03660.04080.02100.02700.04310.02600.0168
D24
(0.0527)
0.04990.05740.06720.06400.05410.05500.04090.04330.0427
E2
(0.1194)
E21
(0.0371)
0.04150.05480.02830.01830.06410.03710.02250.03440.0325
E22
(0.0286)
0.04150.02410.02970.04840.01490.03350.01810.02610.0208
E23
(0.0360)
0.04100.04000.03460.03260.03400.04110.03500.03270.0330
E24
(0.0177)
0.01830.02290.01590.01480.01120.02160.01790.02030.0164
Table 7. Symbiosis between tourism’s carbon emission efficiency (TCEE) and the tourism economy’s high-quality development (TEHQD).
Province 201120122013201420152016201720182019Average
Qinghai δ C E 0.0677−4.4416−0.6215−0.5463−0.38690.1920−1.09871.2779−0.5807−0.6820
δ E C 14.7786−0.2251−1.6090−1.8306−2.58475.2080−0.91020.7825−1.72201.3208
Sichuan δ C E −1.44060.0702−0.85450.52050.55500.7392−0.6277−1.42350.8648−0.1774
δ E C −0.694214.2513−1.17031.92121.80181.3528−1.5932−0.70251.15641.8137
Gansu δ C E −0.8155−0.6781−0.29081.19981.4569−0.82832.8167−1.21521.53760.3537
δ E C −1.2263−1.4747−3.43910.83350.6864−1.20730.3550−0.82290.6504−0.6272
Ningxia δ C E −12.73450.5669−0.5746−0.4786−0.1739−0.0509−0.07455.8721−0.0968−0.8605
δ E C −0.07851.7639−1.7405−2.0894−5.7503−19.6466−13.42880.1703−10.3330−5.6814
Inner Mongolia δ C E 0.04980.6651−1.0111−0.4304−0.108912.9749−2.95122.59850.57471.3735
δ E C 20.09481.5036−0.9891−2.3235−9.18040.0771−0.33880.38481.74001.2187
Shaanxi δ C E 0.48970.1655−0.7004−0.5425−2.71041.21130.14983.2747−2.2085−0.0968
δ E C 2.04206.0428−1.4278−1.8434−0.36890.82566.67340.3054−0.45281.3107
Shanxi δ C E −1.02980.0404−0.0081−0.2984−1.04130.25211.74770.40550.38210.0500
δ E C −0.971124.7507−123.6111−3.3511−0.96033.96740.57222.46642.6174−10.5022
Henan δ C E 0.46662.0937−0.03251.5051−0.0237−0.15910.5901−2.02340.07570.2769
δ E C 2.14320.4776−30.73910.6644−42.1233−6.28381.6946−0.494213.2040−6.8285
Shandong δ C E 23.9285−2.2827−2.3001−1.0972−0.64601.2108−0.15280.9130−0.51042.1181
δ E C 0.0418−0.4381−0.4348−0.9114−1.54810.8259−6.54631.0953−1.9593−1.0972
Yellow River Basin δ C E 0.9980−0.4223−0.7104−0.0187−0.34211.72690.04441.07550.00430.2617
δ E C 4.01455.1835−18.3512−0.9923−6.6698−1.6534−1.50240.35390.5446−2.1192
Table 8. Symbiosis coefficient of tourism’s carbon emission efficiency (TCEE) and the tourism economy’s high-quality development (TEHQD).
Province 201120122013201420152016201720182019Average
Qinghai θ C M 0.00460.95180.27860.22980.13020.03560.54690.62020.25220.3389
θ E M 0.99540.04820.72140.77020.86980.96440.45310.37980.74780.6611
Sichuan θ C M 0.67480.00490.42200.21320.23550.35330.28260.66960.42790.3649
θ E M 0.32520.99510.57800.78680.76450.64670.71740.33040.57210.6351
Gansu θ C M 0.39940.31500.07800.59010.67970.40690.88810.59620.70280.5174
θ E M 0.60060.68500.92200.40990.32030.59310.11190.40380.29720.4826
Ningxia θ C M 0.99390.24320.24820.18640.02940.00260.00550.97180.00930.2989
θ E M 0.00610.75680.75180.81360.97060.99740.99450.02820.99070.7011
Inner Mongolia θ C M 0.00250.30670.50550.15630.01170.99410.89700.87100.24830.4437
θ E M 0.99750.69330.49450.84370.98830.00590.10300.12900.75170.5563
Shaanxi θ C M 0.19340.02670.32910.22740.88020.59470.02200.91470.82990.4464
θ E M 0.80660.97330.67090.77260.11980.40530.97800.08530.17010.5536
Shanxi θ C M 0.51470.00160.00010.08180.52020.05970.75340.14120.12740.2444
θ E M 0.48530.99840.99990.91820.47980.94030.24660.85880.87260.7556
Henan θ C M 0.17880.81430.00110.69380.00060.02470.25830.80370.00570.3090
θ E M 0.82120.18570.99890.30620.99940.97530.74170.19630.99430.6910
Shandong θ C M 0.99830.83900.84100.54630.29440.59450.02280.45460.20670.5331
θ E M 0.00170.16100.15900.45370.70560.40550.97720.54540.79330.4669
Yellow River Basin θ C M 0.44000.38920.30040.32500.30910.34070.40850.67150.31220.3885
θ E M 0.56000.61080.69960.67500.69090.65930.59150.32850.68780.6115
Table 9. Factor detection of symbiosis between tourism’s carbon emission efficiency (TCEE) and the tourism economy’s high-quality development (TEHQD).
Year201120152019Average
Variableqpqpqpq
A110.74840.0401 *0.96100.0000 *0.9854 0.0000 * 0.8983
A120.76200.0314 *0.94700.0000 *0.7445 0.0036 * 0.8178
B110.76590.0281 *0.96280.0000 *0.7178 0.0130 * 0.8155
B120.75670.0343 *0.98060.0000 *0.8544 0.0010 * 0.8639
B130.75510.0351 *0.42310.27450.7473 0.0189 * 0.6418
C110.76910.0148 *0.97270.0000 *0.9918 0.0000 * 0.9112
C120.77020.0264 *0.95650.0000 *0.6250 0.0391 * 0.7839
C130.73270.0285 *0.96280.0000 *0.8507 0.0012 * 0.8487
D110.96120.0000 *0.98300.0000 *0.9736 0.0000 * 0.9726
D120.95990.0000 *0.97240.0000 *0.4939 0.1655 0.8087
E110.76040.0323 *0.98060.0000 *0.8410 0.0017 * 0.8607
E120.74840.0401 *0.96280.0000 *0.8507 0.0012 * 0.8540
E130.74060.0258 *0.97800.0000 *0.7593 0.0139 * 0.8260
E140.77390.0246 *0.98760.0000 *0.8567 0.0009 * 0.8727
E150.76590.0281 *0.99420.0000 *0.8559 0.0009 * 0.8720
E160.75670.0342 *0.99280.0000 *0.6785 0.0253 * 0.8093
F110.31640.59990.97050.0000 *0.7170 0.0299 * 0.6680
F120.76920.0281 *0.96280.0000 *0.8559 0.0009 * 0.8626
F130.76590.0281 *0.99280.0000 *0.4819 0.1888 * 0.7469
A210.88740.0008 *0.94000.0000 *0.94500.0000 *0.9241
A220.89800.0001 *0.71250.0459 *0.71650.0561 *0.7757
A230.88470.0009 *0.97910.0000 *0.94500.0000 *0.9363
B210.90210.0004 *0.81990.0084 *0.93330.0000 *0.8851
B220.88460.0004 *0.95840.0000 *0.85250.0011 *0.8985
B230.88590.0009 *0.86330.0027 *0.83530.0022 *0.8615
B240.88680.0008 *0.93750.0000 *0.96610.0000 *0.9301
C210.99770.0000 *0.70200.0365 *0.64560.0347 *0.7818
C220.90390.0003 *0.85200.0032 *0.96690.0000 *0.9076
C230.60820.13670.94390.0000 *0.78450.0013 *0.7789
C240.88500.0009 *0.82840.0068 *0.93420.0000 *0.8825
D210.86960.0007 *0.80870.0054 *0.71710.0326 *0.7985
D220.90040.0001 *0.84880.0032 *0.89350.0001 *0.8809
D230.90100.0004 *0.83060.0058 *0.63820.0107 *0.7899
D240.88510.0009 *0.80610.0059 *0.82400.0028 *0.8384
E210.90360.0003 *0.79170.0165 *0.72340.0517 *0.8062
E220.99590.0000 *0.94390.0000 *0.44670.43160.7955
E230.99610.0000 *0.80870.0115 *0.73330.0492 *0.8460
E240.83370.0060 *0.85590.0003 *0.81440.0037 *0.8347
* Indicates that the factor is valid after passing the significance test at 0.05 level.
Publisher’s Note: MDPI stays neutral with regard to jurisdictional claims in published maps and institutional affiliations.

