Abstract
Mining-induced hydromechanical behavior of sandstone is critical to mining safety and disaster prevention. To investigate the evolution behavior of the mechanical and permeability properties of sandstone, mining-induced stress was imitated by increasing axial stress and decreasing confining stress, and a set of hydromechanical experiments were further performed, incorporating the effect of in situ stress, pore pressure, and mining stress. The results show the similar variation tendencies of the deformation and permeability of sandstone under different loading paths of in situ stress and pore pressure. Most sandstone samples maintain a compression state for the peak stress condition. The failure mode evolved from shear failure to shear–tension failure with the increase in in situ stress. The stress-relief effect significantly effects the permeability, since the permeability of sandstone increases exponentially with decreasing effective confining stress. The growth rate of permeability in Stage II is significantly greater than that in Stage I. One order of magnitude of permeability was presented at the peak stress situation. A fitting exponential model based on the alteration of effective confining stress was proposed to describe the permeability evolution dominated by the stress-relief effect, and the discovered permeability model can accurately describe the experimental results. The research results provide significant guidance for understanding the hydromechanical behavior and water hazard prevention for underground coal mines.
1. Introduction
The mechanical properties and seepage characteristics of sandstone, a typical sedimentary rock, have been widely investigated in underground rock mass engineering, such as carbon geological storage, coal mining, water hazard prevention of mines, and so on. As underground activities move towards the deeper crust, the stress–fracture–seepage field behavior in the rock becomes more complex [1,2,3]. Therefore, the research on rock deformation behavior and permeability evolution under hydromechanical coupling is an urgent basic topic in the field of rock mechanics, which has extreme scientific significance and application prospects for deep underground activities.
Existing related studies mainly concentrated on the mechanical property of the triaxial compression test, and the seepage law in this loading process has been widely and deeply discussed. At present, many researchers have carried out triaxial total stress–strain and cyclic loading–unloading seepage tests on different types of rocks, such as sandstone, limestone, and granite, including intact and fractured rocks [4,5,6,7,8,9]; analyzed the mechanical and seepage characteristics with rock brittleness–ductility under different confining pressures and osmotic pressures [10,11,12,13,14,15]; and obtained the variation relationship between permeability and axial stress before and after peak strength [16]. Liu et al. [17] studied the hydromechanical behavior of sandstone with different physical properties, and modeled the damage variables and permeability evolution of the Weibull random distribution. Xiao et al. [18] investigated the hydromechanical properties of red sandstone, collected in Ganzhou, with triaxial compression seepage tests, and established a piecewise model for stress-dependent permeability to discuss the impact of osmotic pressure on the strength and stiffness of red sandstone before the peak strength. Li et al. [19] carried out triaxial compression tests of sandstone to research the effect of different confining pressures and seepage pressures on the failure mechanism and permeability evolution of reservoir sandstone, and established COMSOL numerical model to accurately inverse the laboratory experimental results. Moreover, CT scanning technology, as a hot visualization technology, is widely used in this research field [20,21].
The current rock mechanics theory is mostly based on the total stress–strain test obtained from the triaxial rock mechanics standardization test [22,23,24]. However, when analyzing engineering disturbance and disaster, it can be found that this standardized test is separated from engineering activities and does not reflect the influence of in situ stress state and mining disturbance path. Therefore, Xie et al. [25,26] took the lead in proposing the mining stress path of coal under different mining layouts, i.e., protective coal-seam mining, top-coal caving mining, and non-pillar mining, which established a bridge between laboratory experiment and field practice. In addition, corresponding mining-induced mechanical behavior, fracture distribution, and coal permeability evolution were analyzed. Zuo et al. [27] investigated the mechanical behavior of limestone under different stress paths, including the complete stress–strain process and mining stress path. Xia et al. [28] conducted loading and unloading triaxial mechanical tests with real-time ultrasonic monitoring for single fissure sandstone and studied the deformation characteristics, the failure form, and the crack evolution of single fissure sandstone with specific angles and lengths under the fully mechanized top-coal caving mining stress path.
As stated above, most of the existing work focused on the mechanical behaviors and permeability evolution for coal in the mining process. However, there is still a lack of quantitative analysis on the mining-induced mechanical behavior and seepage property of sandstone. Moreover, it would be of great significance to investigate the differences in deformation and permeability responding to the change of the mining-induced underground environment. Therefore, in this study, the influence of in situ stress, pore pressure, and mining-induced stress on the deformation and transport behavior of sandstone was investigated. The damage deformation at different mining-induced stress states was dynamically monitored, and the failure mode under the peak stress condition was analyzed. Besides, the effective stress-based permeability evolution was discussed.
2. Experimental Section
2.1. Sample Preparation
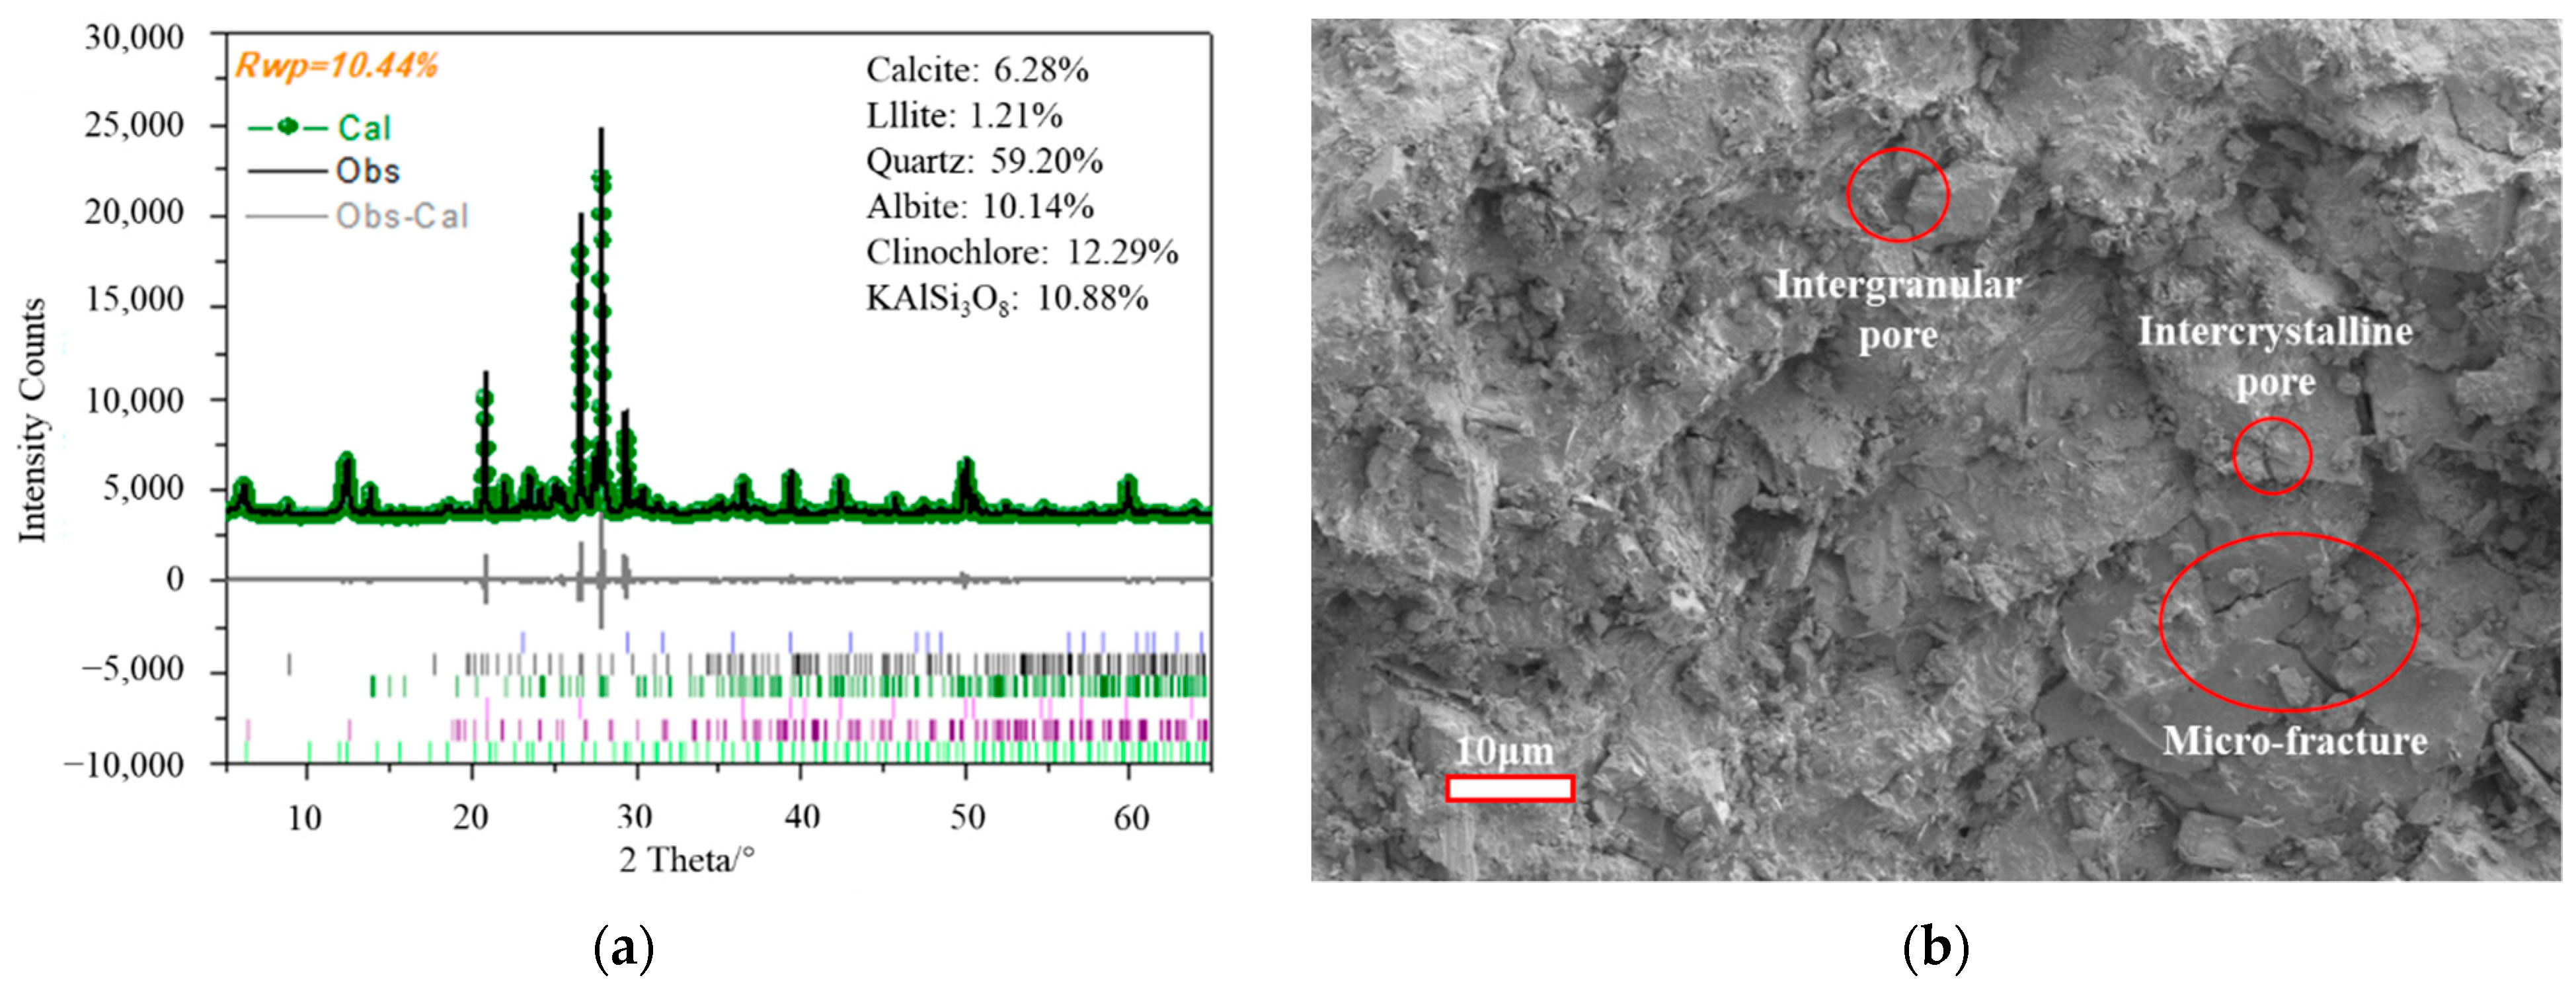
A gray sandstone block taken from a coal mine in the Ordos Basin was used in this study. Some 50 mm diameter cylindrical samples were drilled from the sandstone block in the same direction by a core-drilling machine. Then, the cylindrical samples were cut to about 50 mm in diameter and 100 mm in length by a grinding machine with the high-precision standard proposed by the ISRM. The X-ray diffraction (XRD) results show that the sandstone is mainly composed of quartz (59.2%), clinochlore (12.3%), albite (10.1%), and other minerals (18.4%) (Figure 1a). The pore spaces of sandstone are completely dominated by intergranular pore, intercrystalline pore, and microfracture based on the scanning electron microscope (SEM) results (Figure 1b). Moreover, the average density and porosity of the sandstone are 2.44 g/cm3 and 11.2%, respectively.
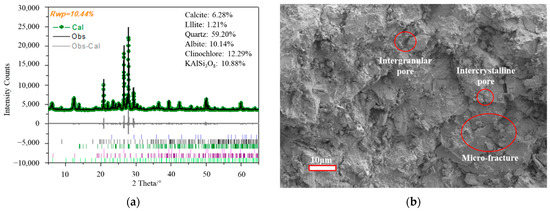
Figure 1.
The (a) XRD and (b) SEM test results.
2.2. Experimental Apparatus
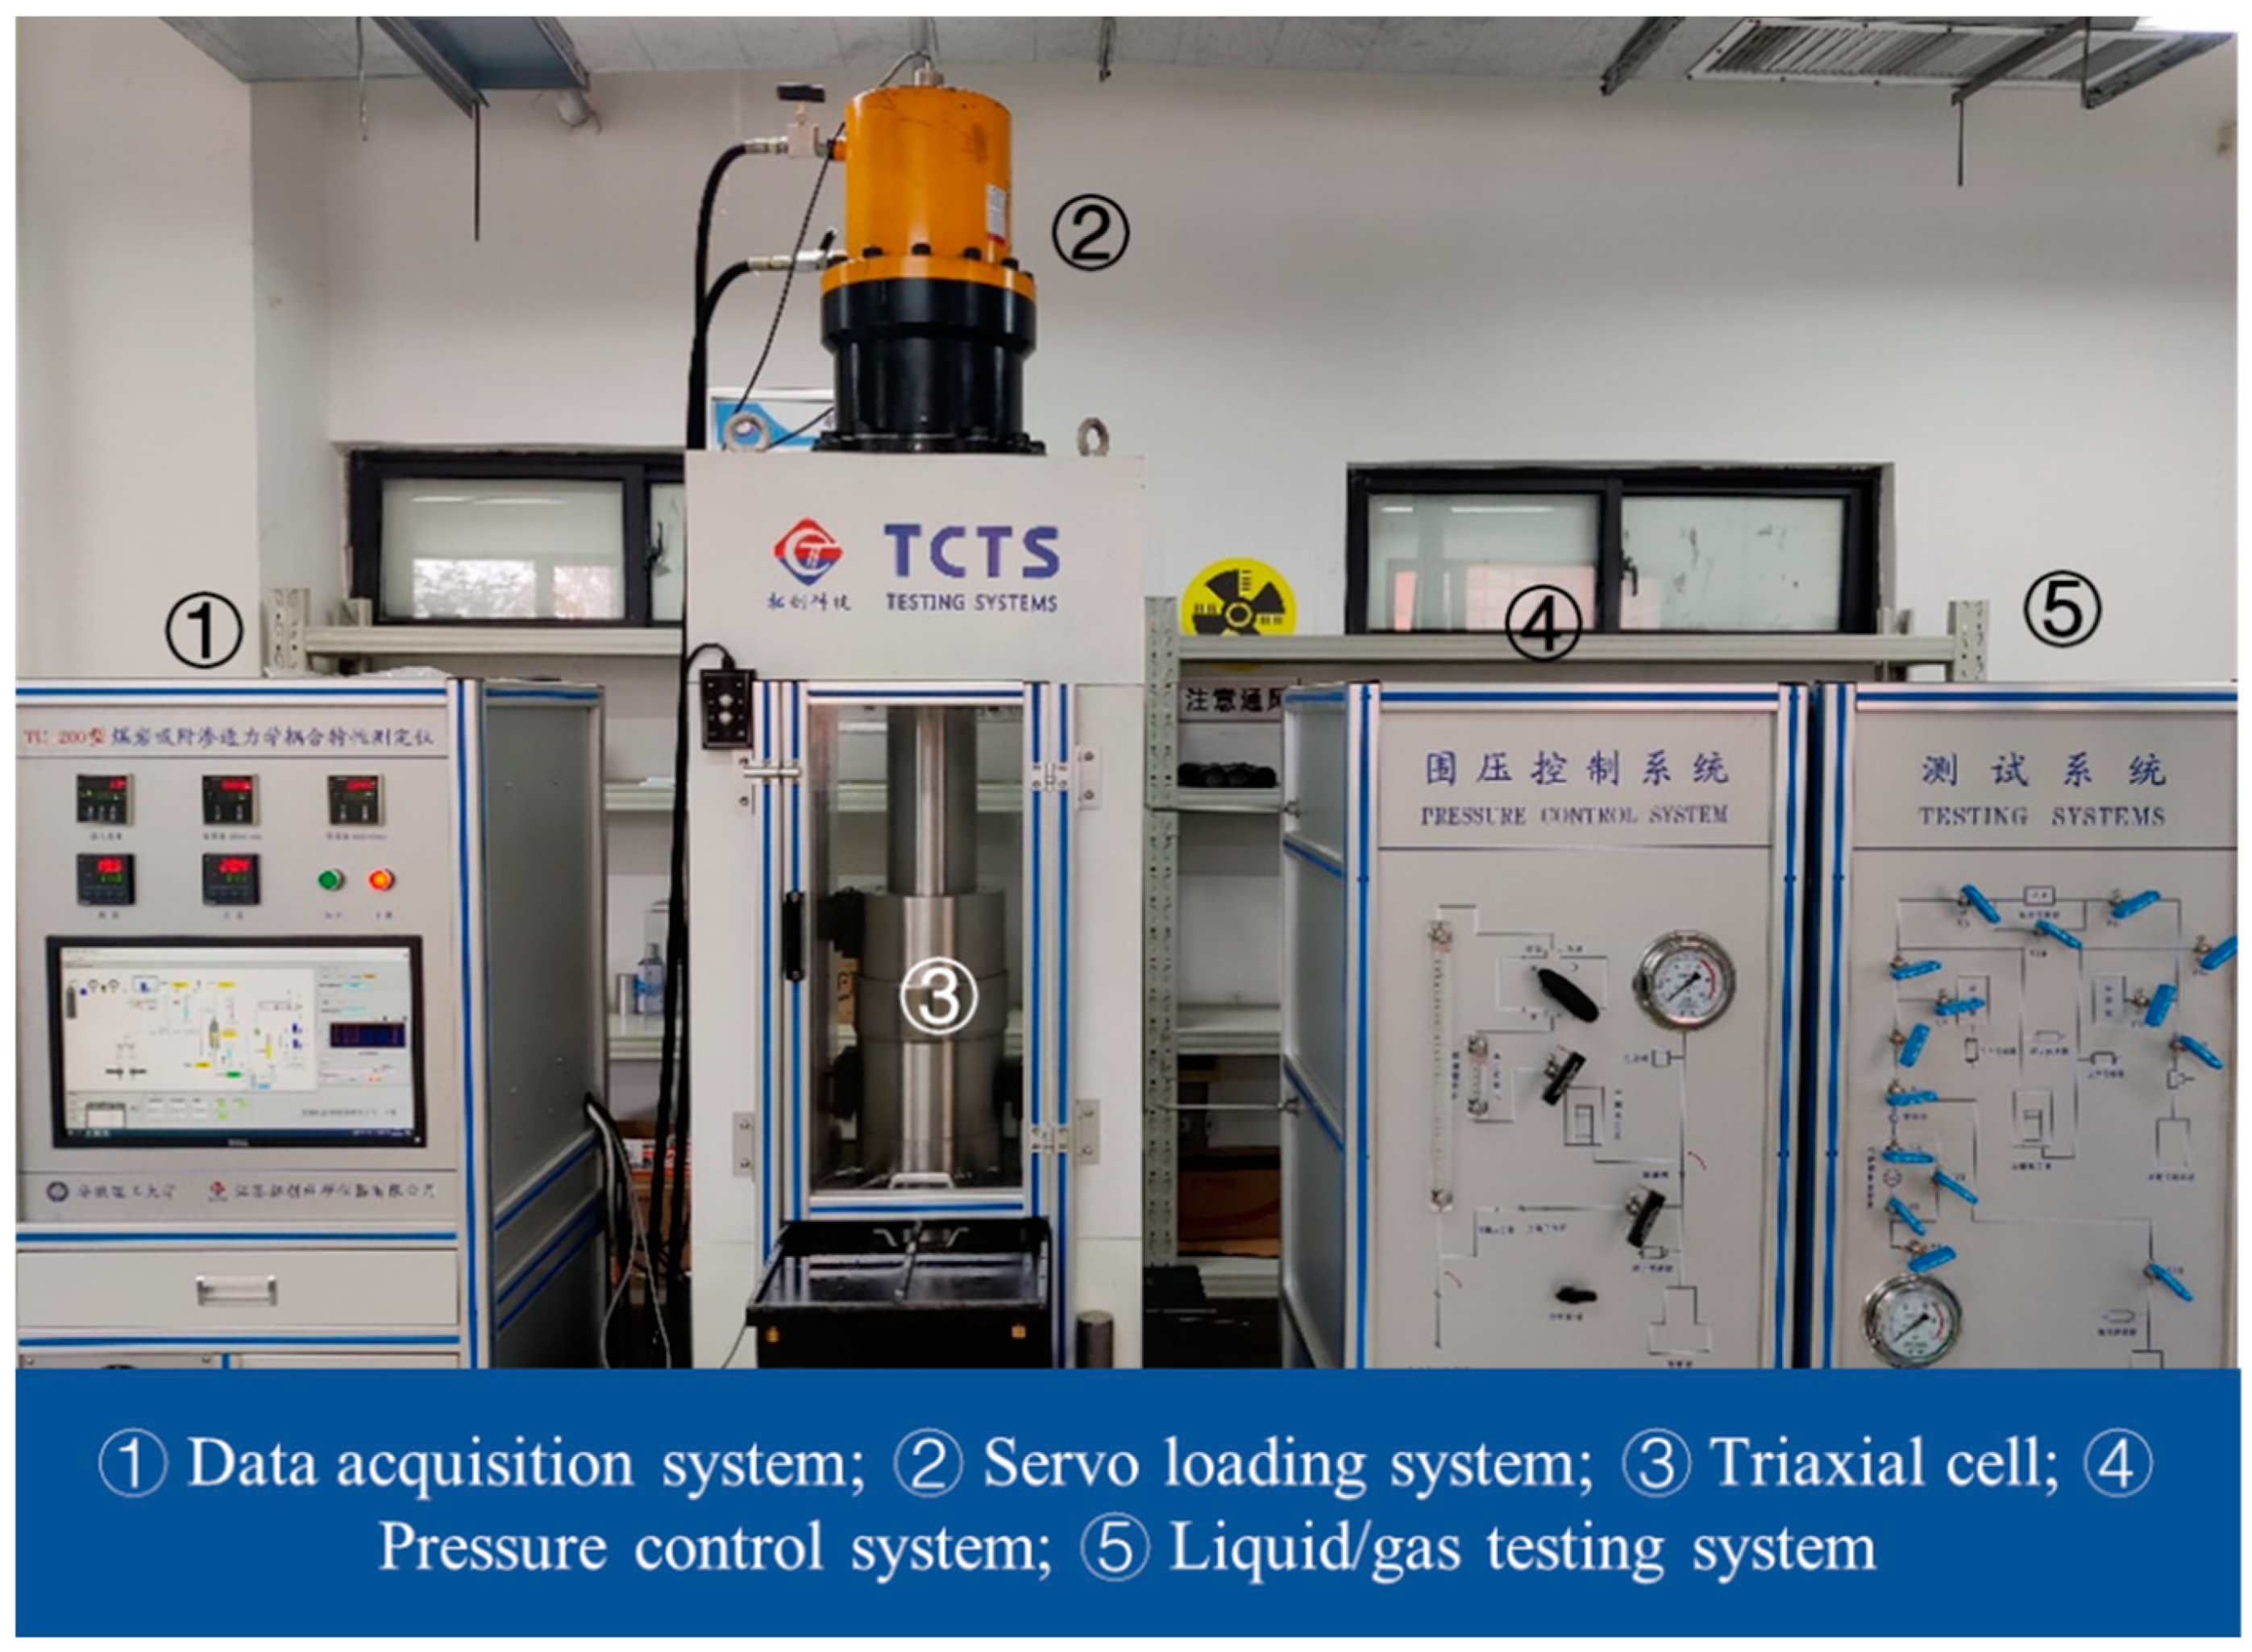
The hydromechanical tests were carried out using a triaxial servo-controlled permeation experimental apparatus. The apparatus, comprising six parts, a servo loading system, a triaxial cell, a pressure control system, a liquid/gas testing system, a data collection system, and an auxiliary system, can supply an axial and confining stress applied to the samples with a stable temperature during the measurement of permeability in this work. The experimental apparatus is shown in Figure 2, and the equipment parameters were described in detail by a previous study [29].
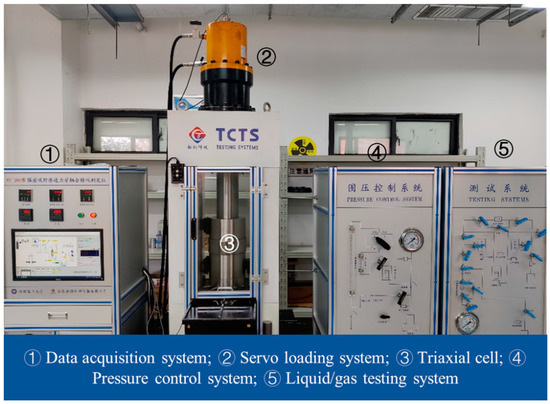
Figure 2.
Triaxial servo-controlled mechanical–seepage coupling experimental apparatus [29].
2.3. Experimental Procedure
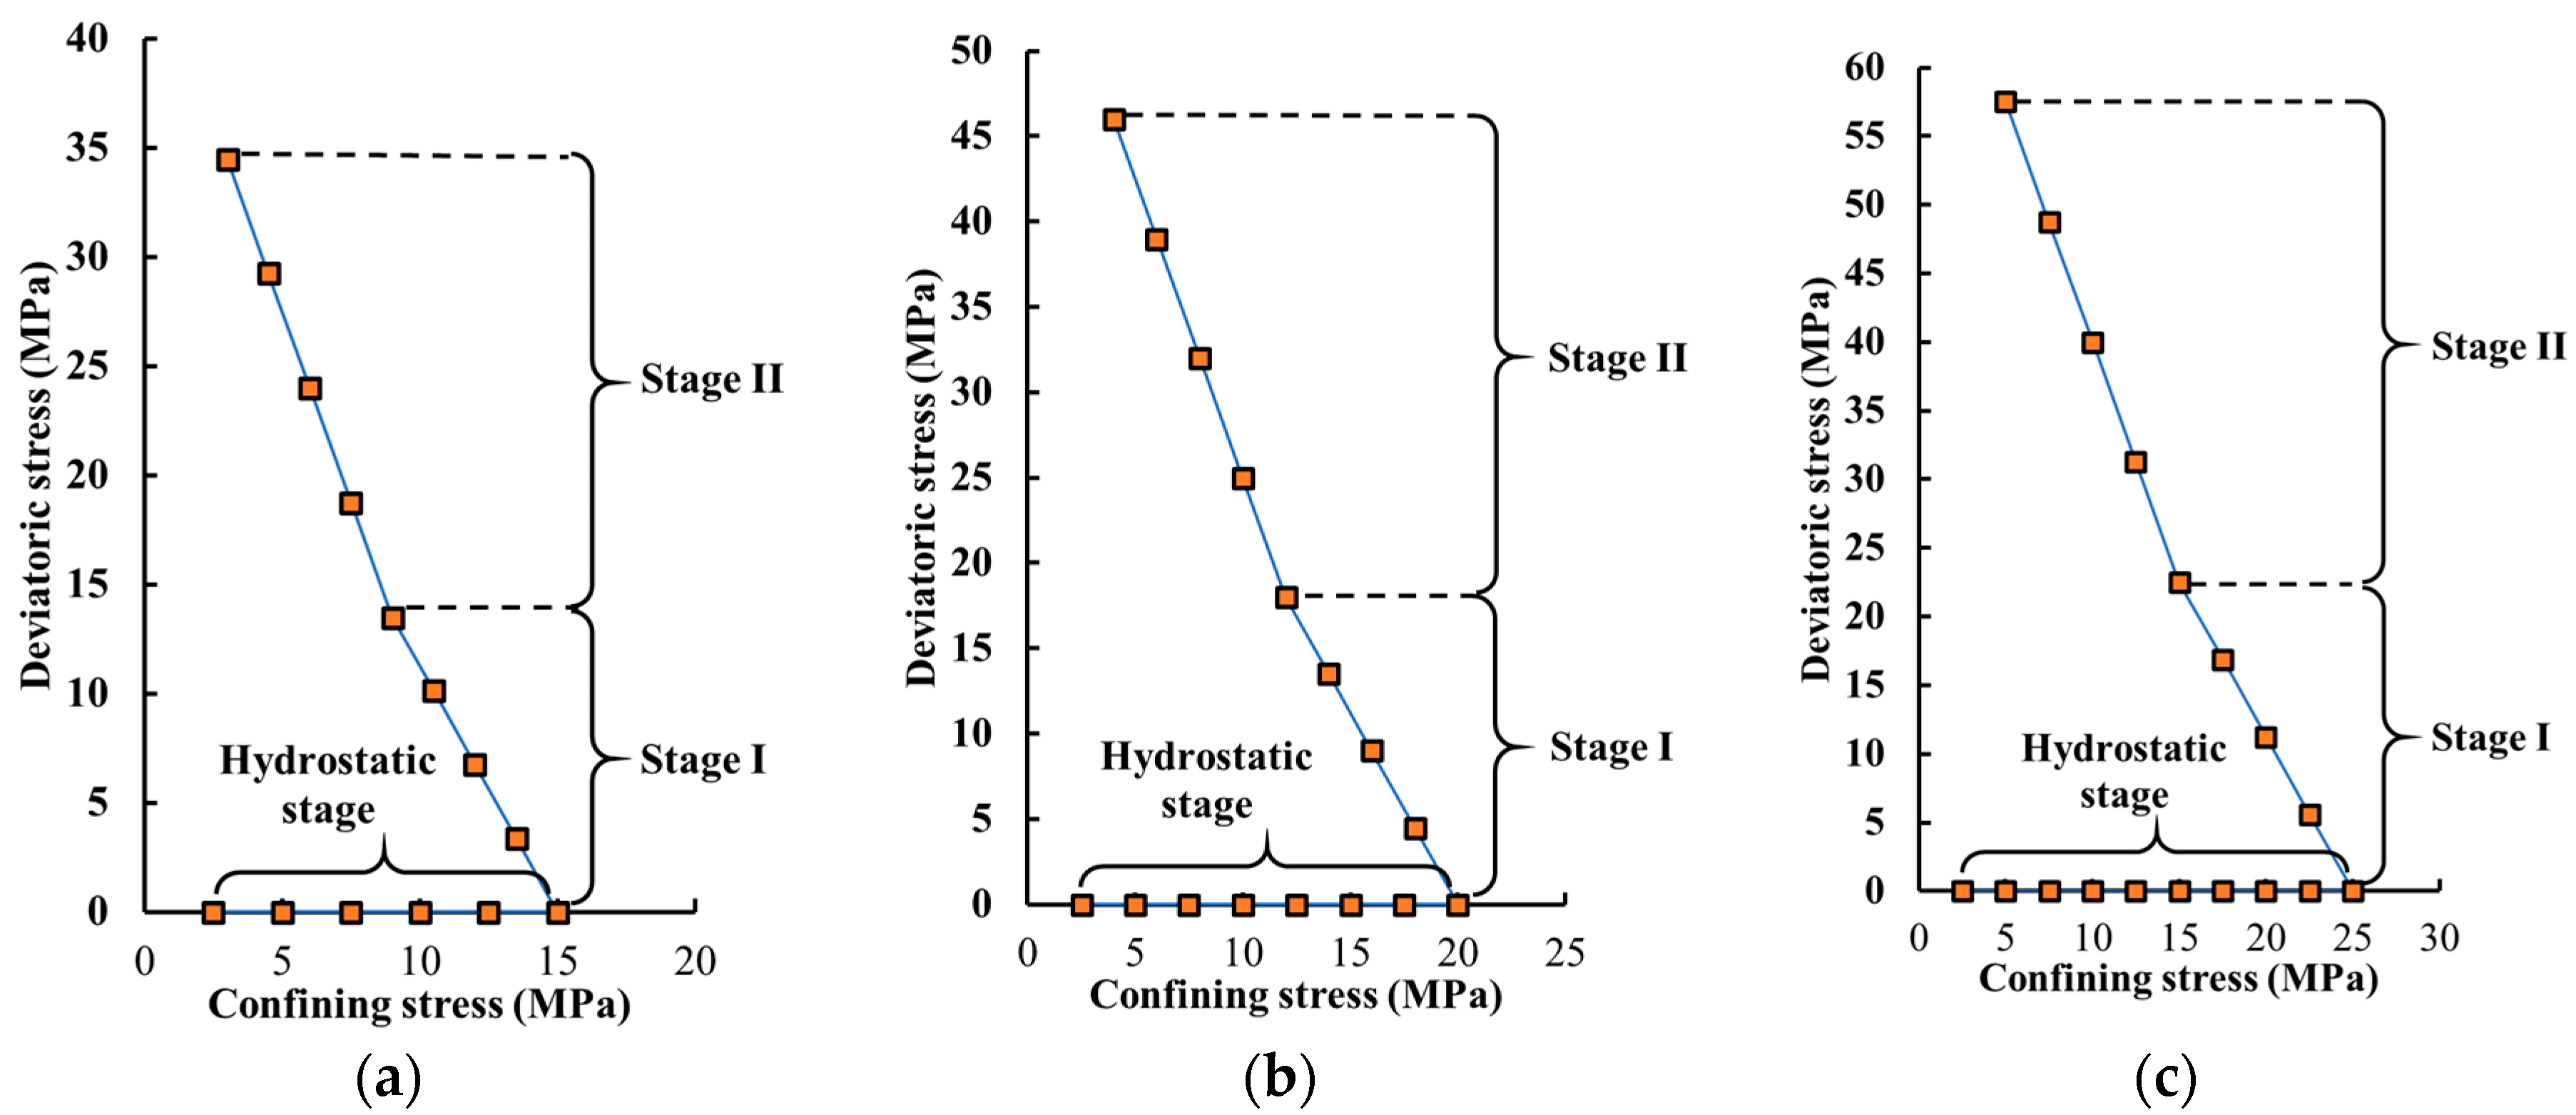
Nitrogen with a purity of 99.999% was used as the testing gas, and different in situ stresses (15 MPa, 20 MPa, and 25 MPa) and gas pressures (1 MPa, 1.5 MPa, and 2 MPa) were considered in the experiments. Nine sandstone samples were prepared, and each test corresponded to one sample under one stress state. All the experiments were carried out at 20 °C. Moreover, the information on the sandstone samples with designated experimental conditions was summarized in Table 1. The specific mining stress path is described below (Figure 3):

Table 1.
Information on sandstone samples.
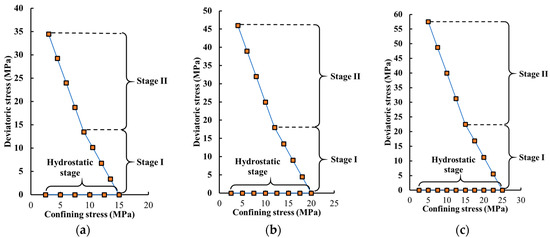
Figure 3.
Loading schemes of different sandstone samples ((a–c) are the initial confining pressure of 15 MPa, 20 MPa, and 25 MPa, respectively).
- (1)
- Hydrostatic pressure stage: The sandstone specimens were firstly dried at 100 °C for 48 h. Then, the dried specimens were sealed with a thermal-shrinkable sleeve and placed into the triaxial cell. The specimens were hydrostatically loaded to the target confining pressure (15 MPa, 20 MPa, and 25 MPa) at the rate of 3 MPa/min. Nitrogen with a specified pressure (1 MPa, 1.5 MPa, and 2 MPa) was then injected into the upstream of the specimens.
- (2)
- Stage I: The axial stress was loaded to 1.5 times the initial confining pressure by the stress control mode with a loading rate of 0.625 MPa/min, while the confining stress was unloaded to 0.6 times the initial confining pressure with a loading rate of −0.5 MPa/min.
- (3)
- Stage II: In this study, the concentration coefficient of front abutment pressure was determined as 2.5, and the horizontal stress unloaded to 0.2 times the initial state. So, the axial stress was further loaded to 2.5 times the initial confining pressure by the stress control mode with a loading rate of 1.25 MPa/min, while the confining stress was unloaded to 0.2 times the initial confining pressure with a loading rate of −0.5 MPa/min.
- (4)
- Stage III: The confining pressure remained constant, which ensured that the pore pressure is not larger than the confining pressure and the permeability can continue to be measured while preventing equipment damage. In addition, the load mode of displacement control with a rate of 0.1 mm/min was selected to control the axial stress loading until the specimens were destroyed. Throughout the experiments, the gas flows were continuously recorded at the downstream cylinders for calculating the permeability.
In this study, the permeability of sandstone was obtained by using Darcy’s law:
where k is the permeability of the sample, m2; q is the gas flow rate, m3/s; P0 is the atmospheric pressure, Pa; μ is the gas viscosity, Pa·s; L is the length of the cylindrical sample, m; ϕ is the diameter of the cylindrical sample, m; P1 is the inlet gas pressure Pa; and P2 is the outlet gas pressure, Pa.
3. Results and Discussion
3.1. Deformation Behavior of Sandstone under Mining Stress
Taking the Biot coefficient remain constant at 1, the effective stress can be expressed as [30]:
where σe is the effective stress, MPa; σ1 is the axial stress, MPa; σ3 is the confining stress, MPa; and P is the pore pressure, MPa. Besides, ignoring high-order small quantities, the volume strain can be approximately expressed as:
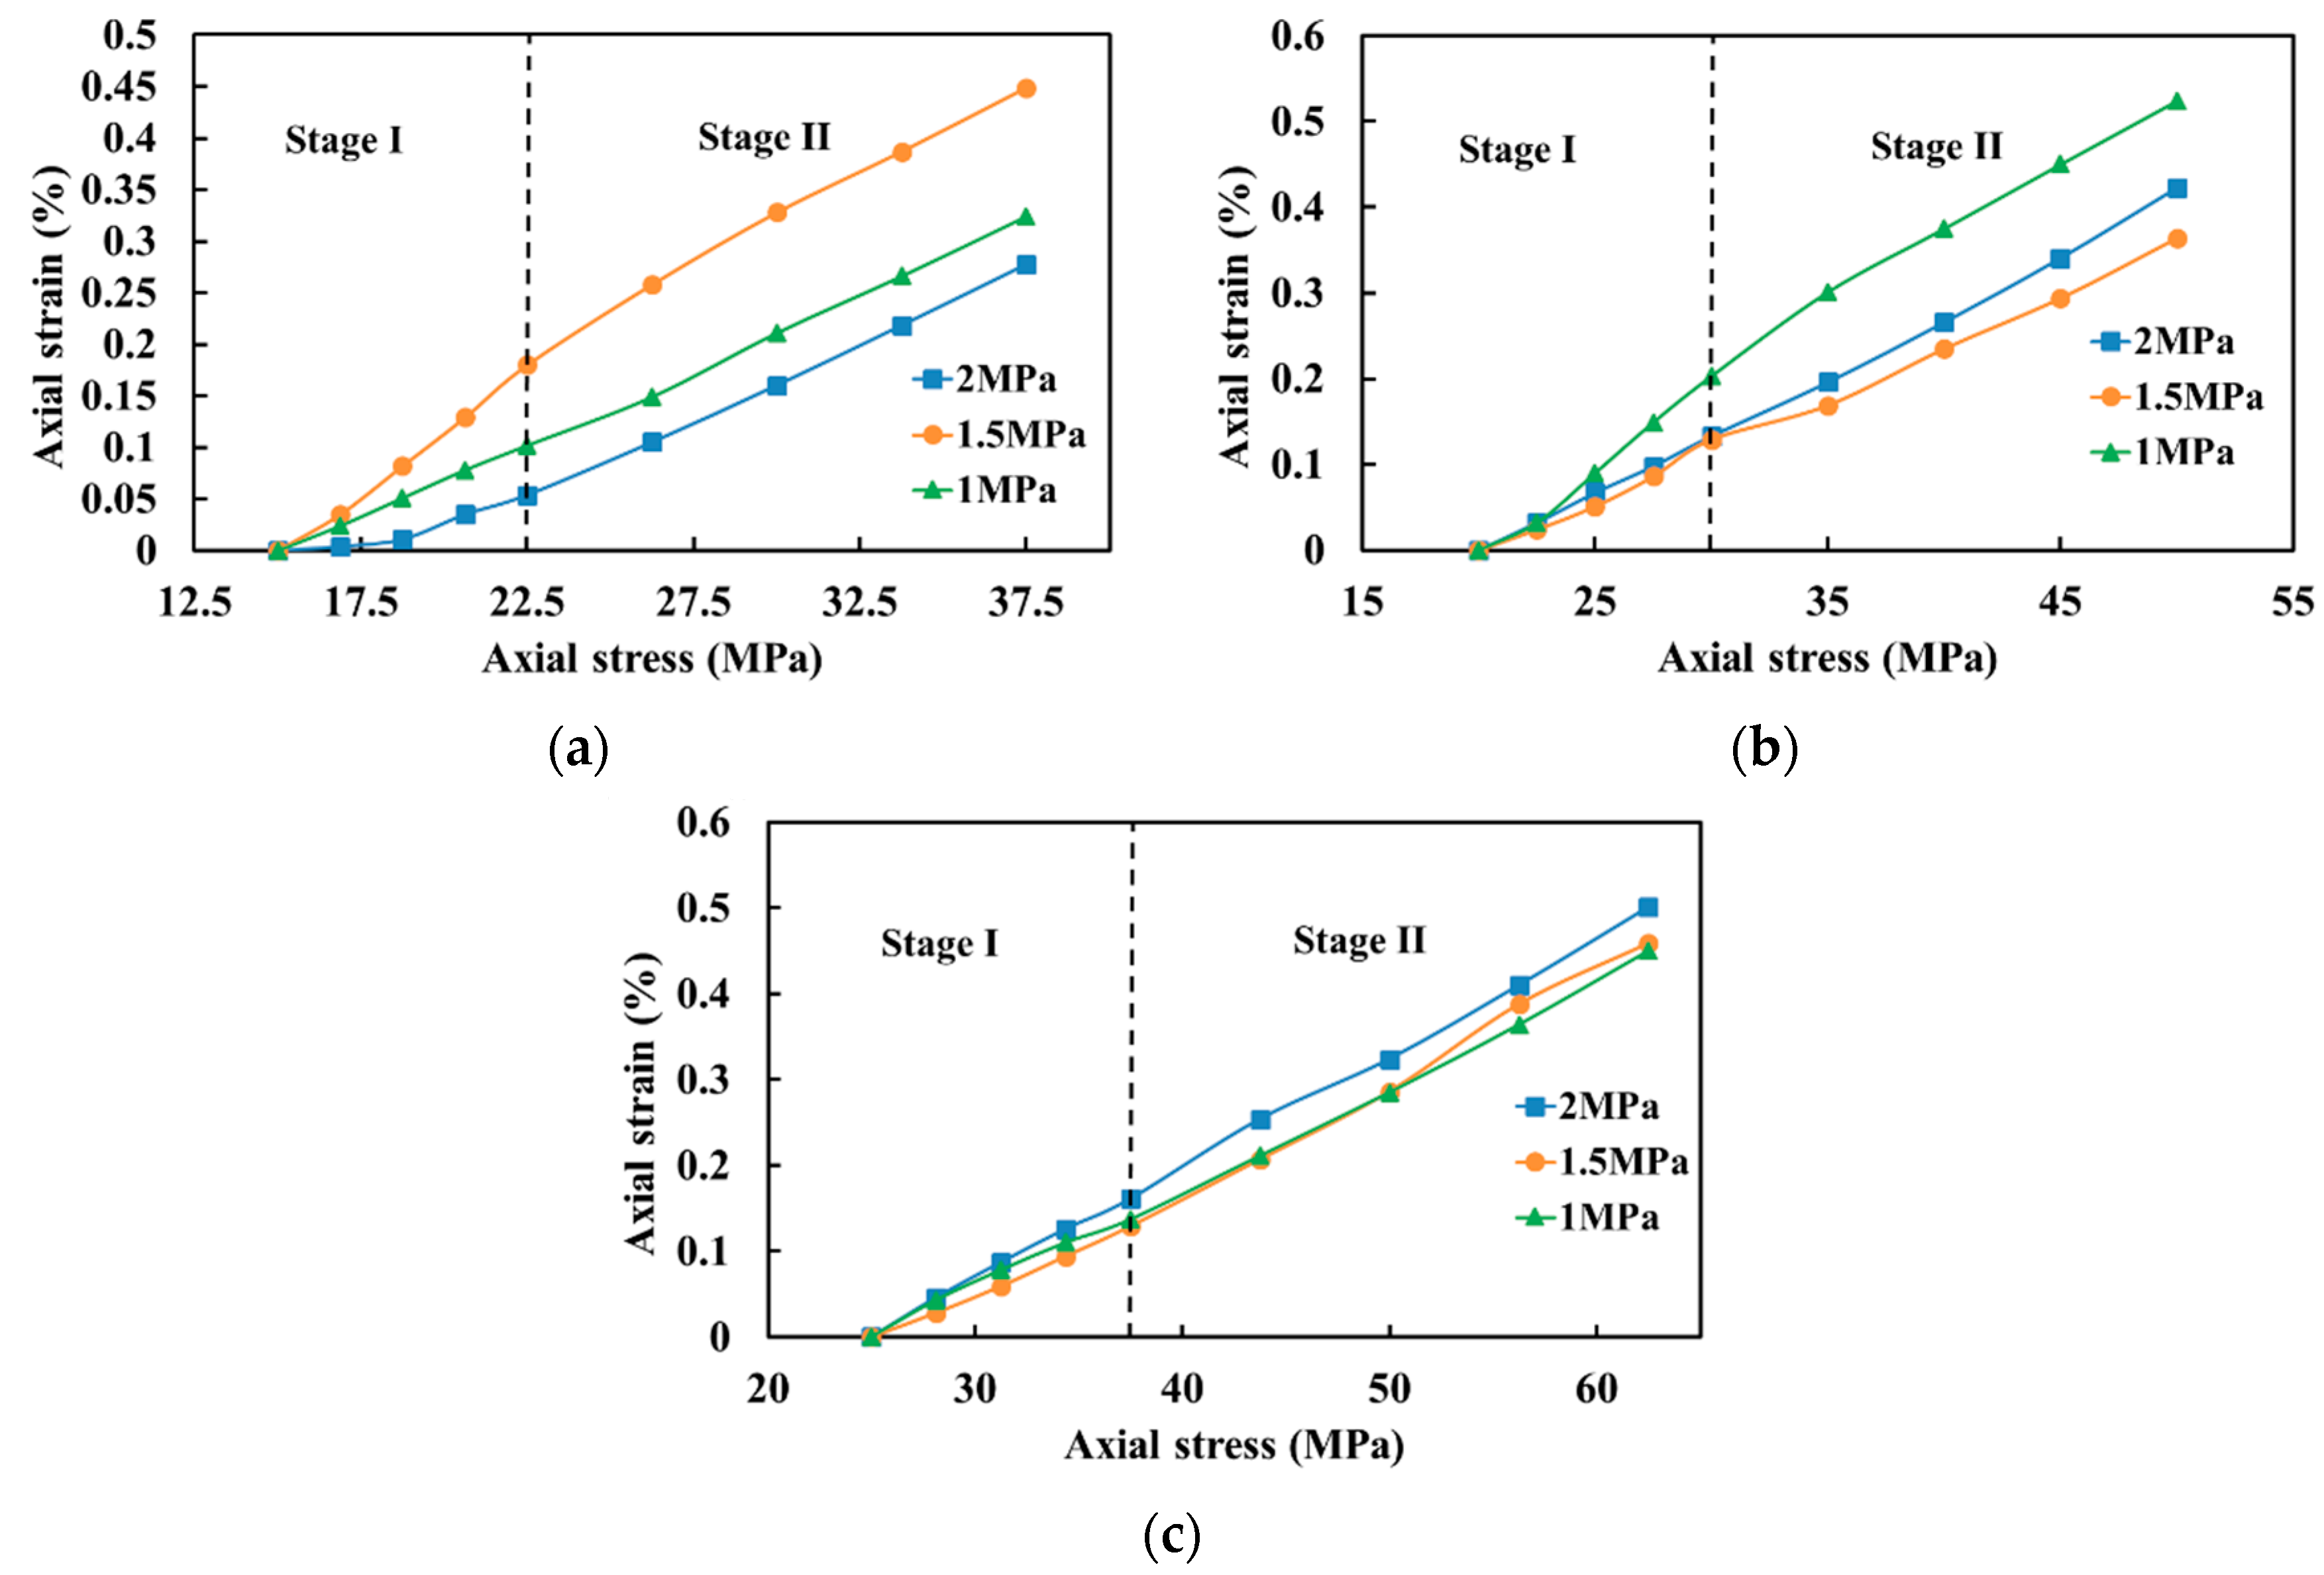
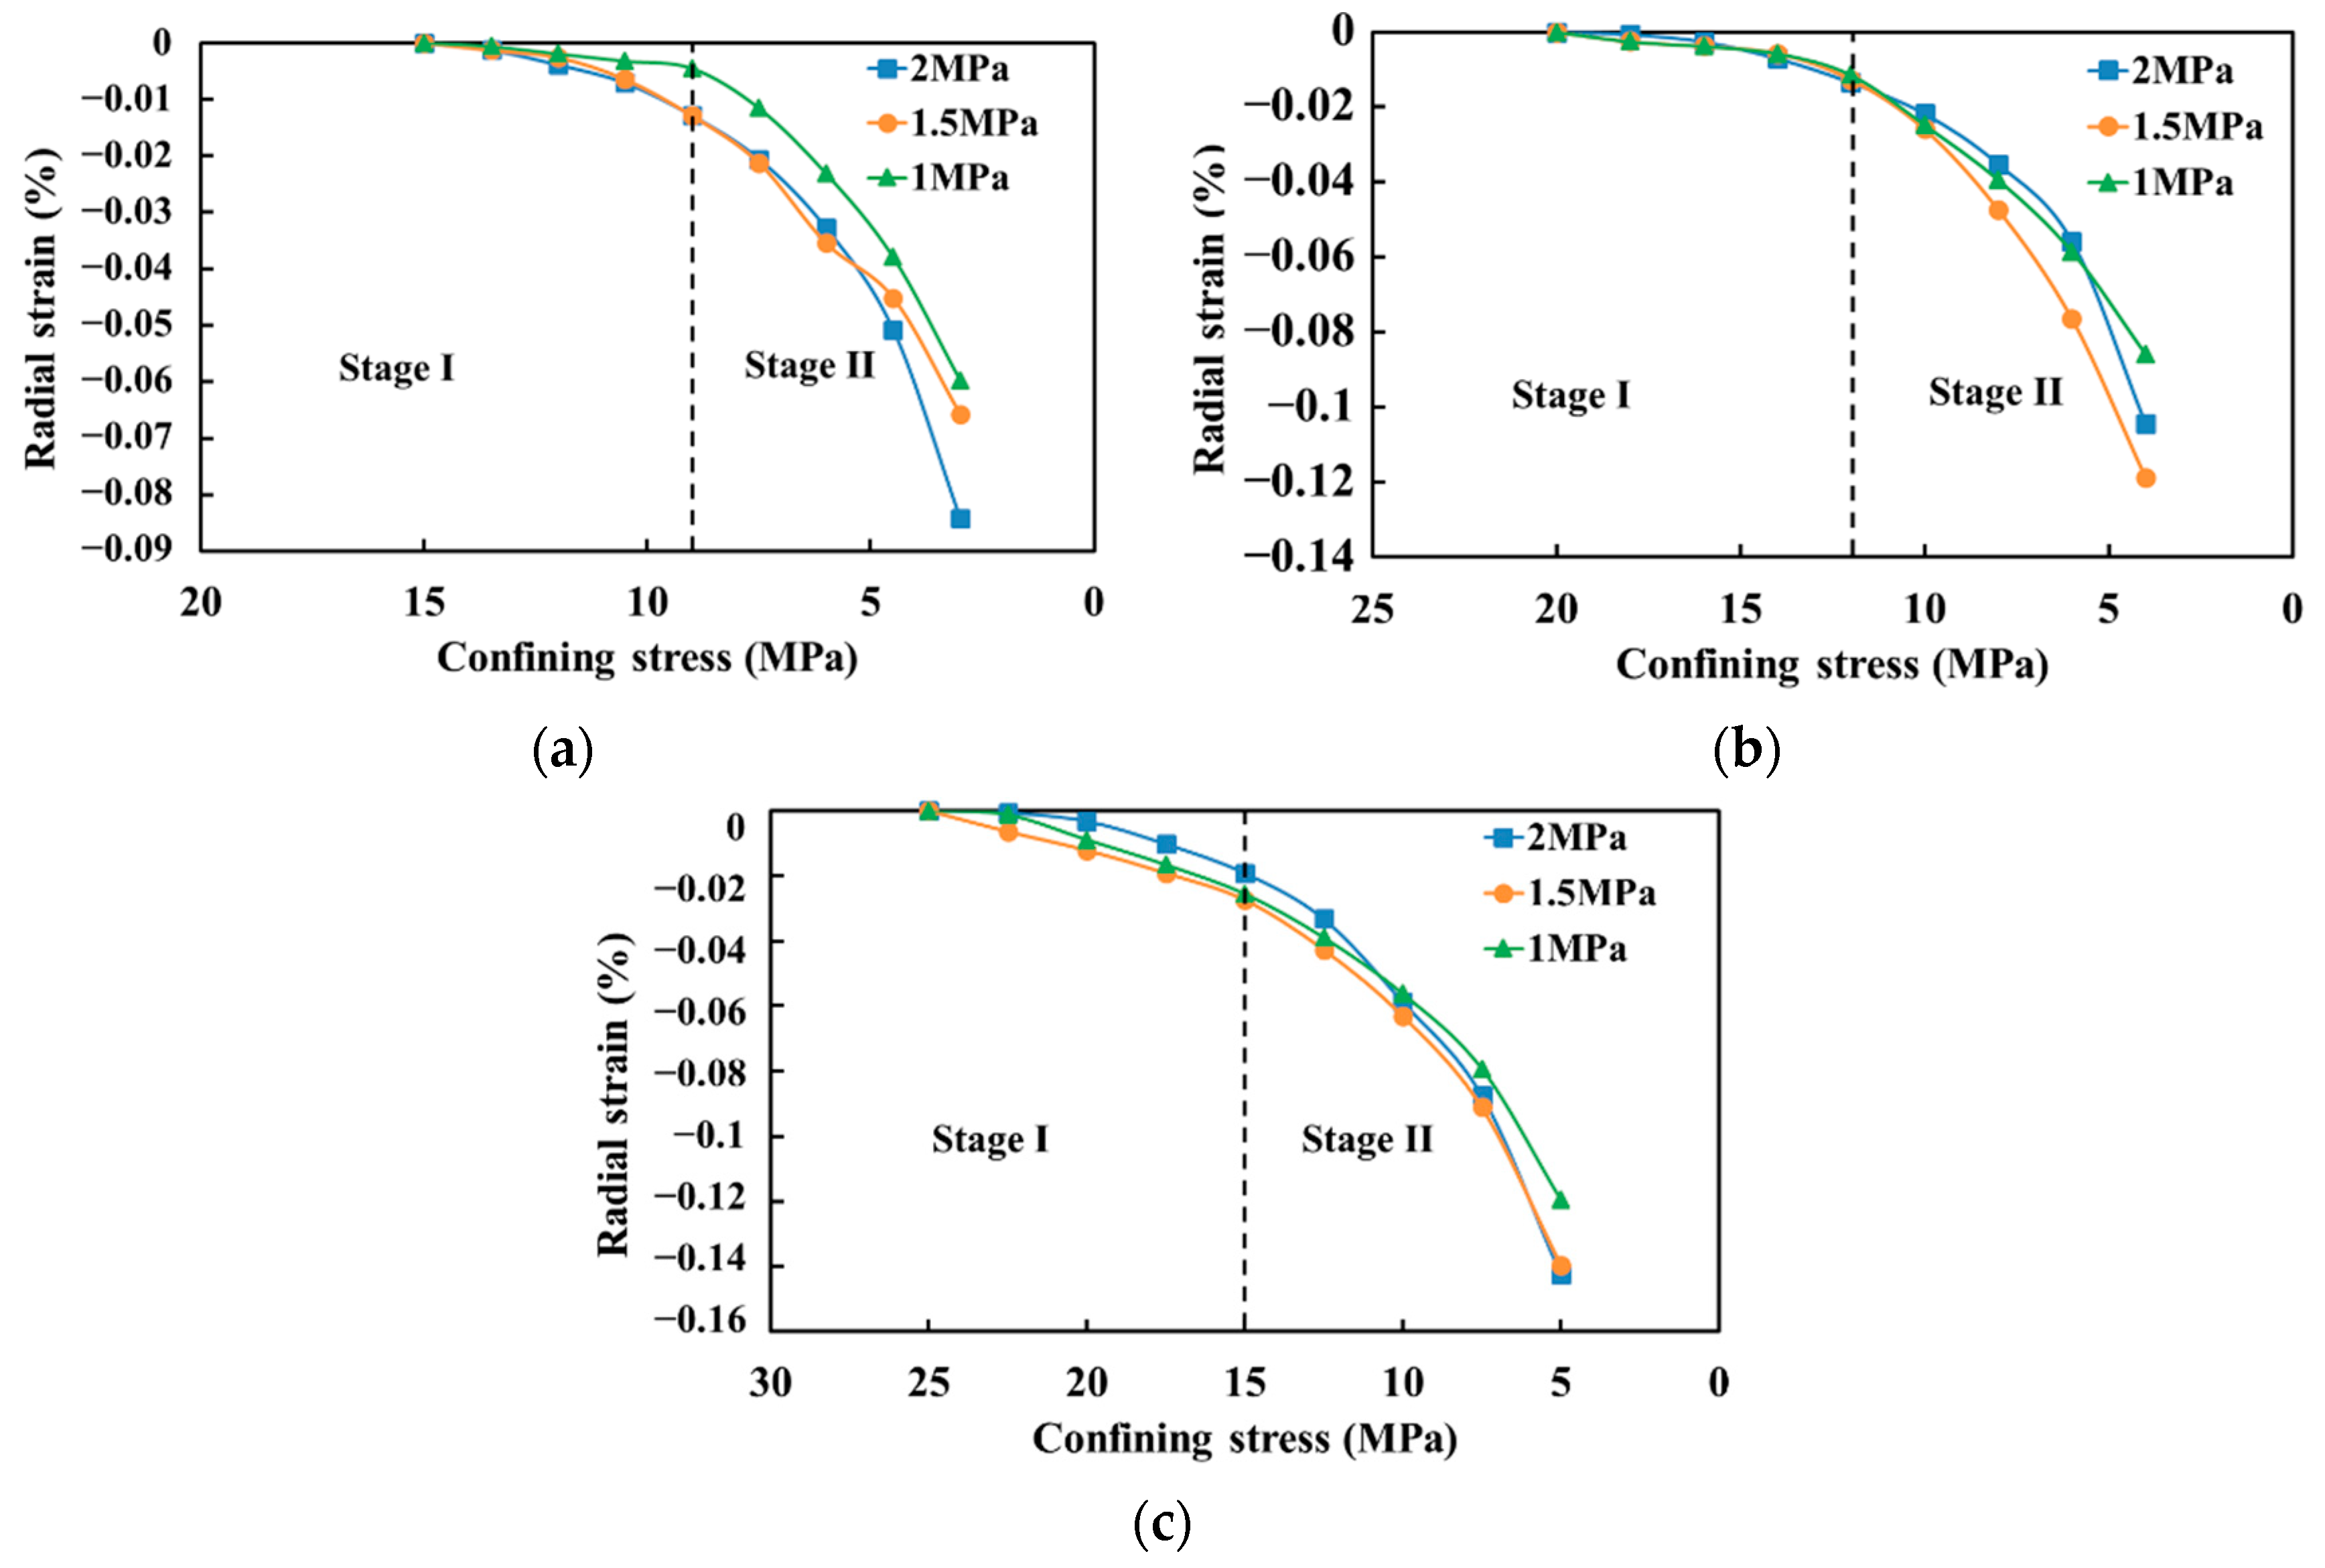
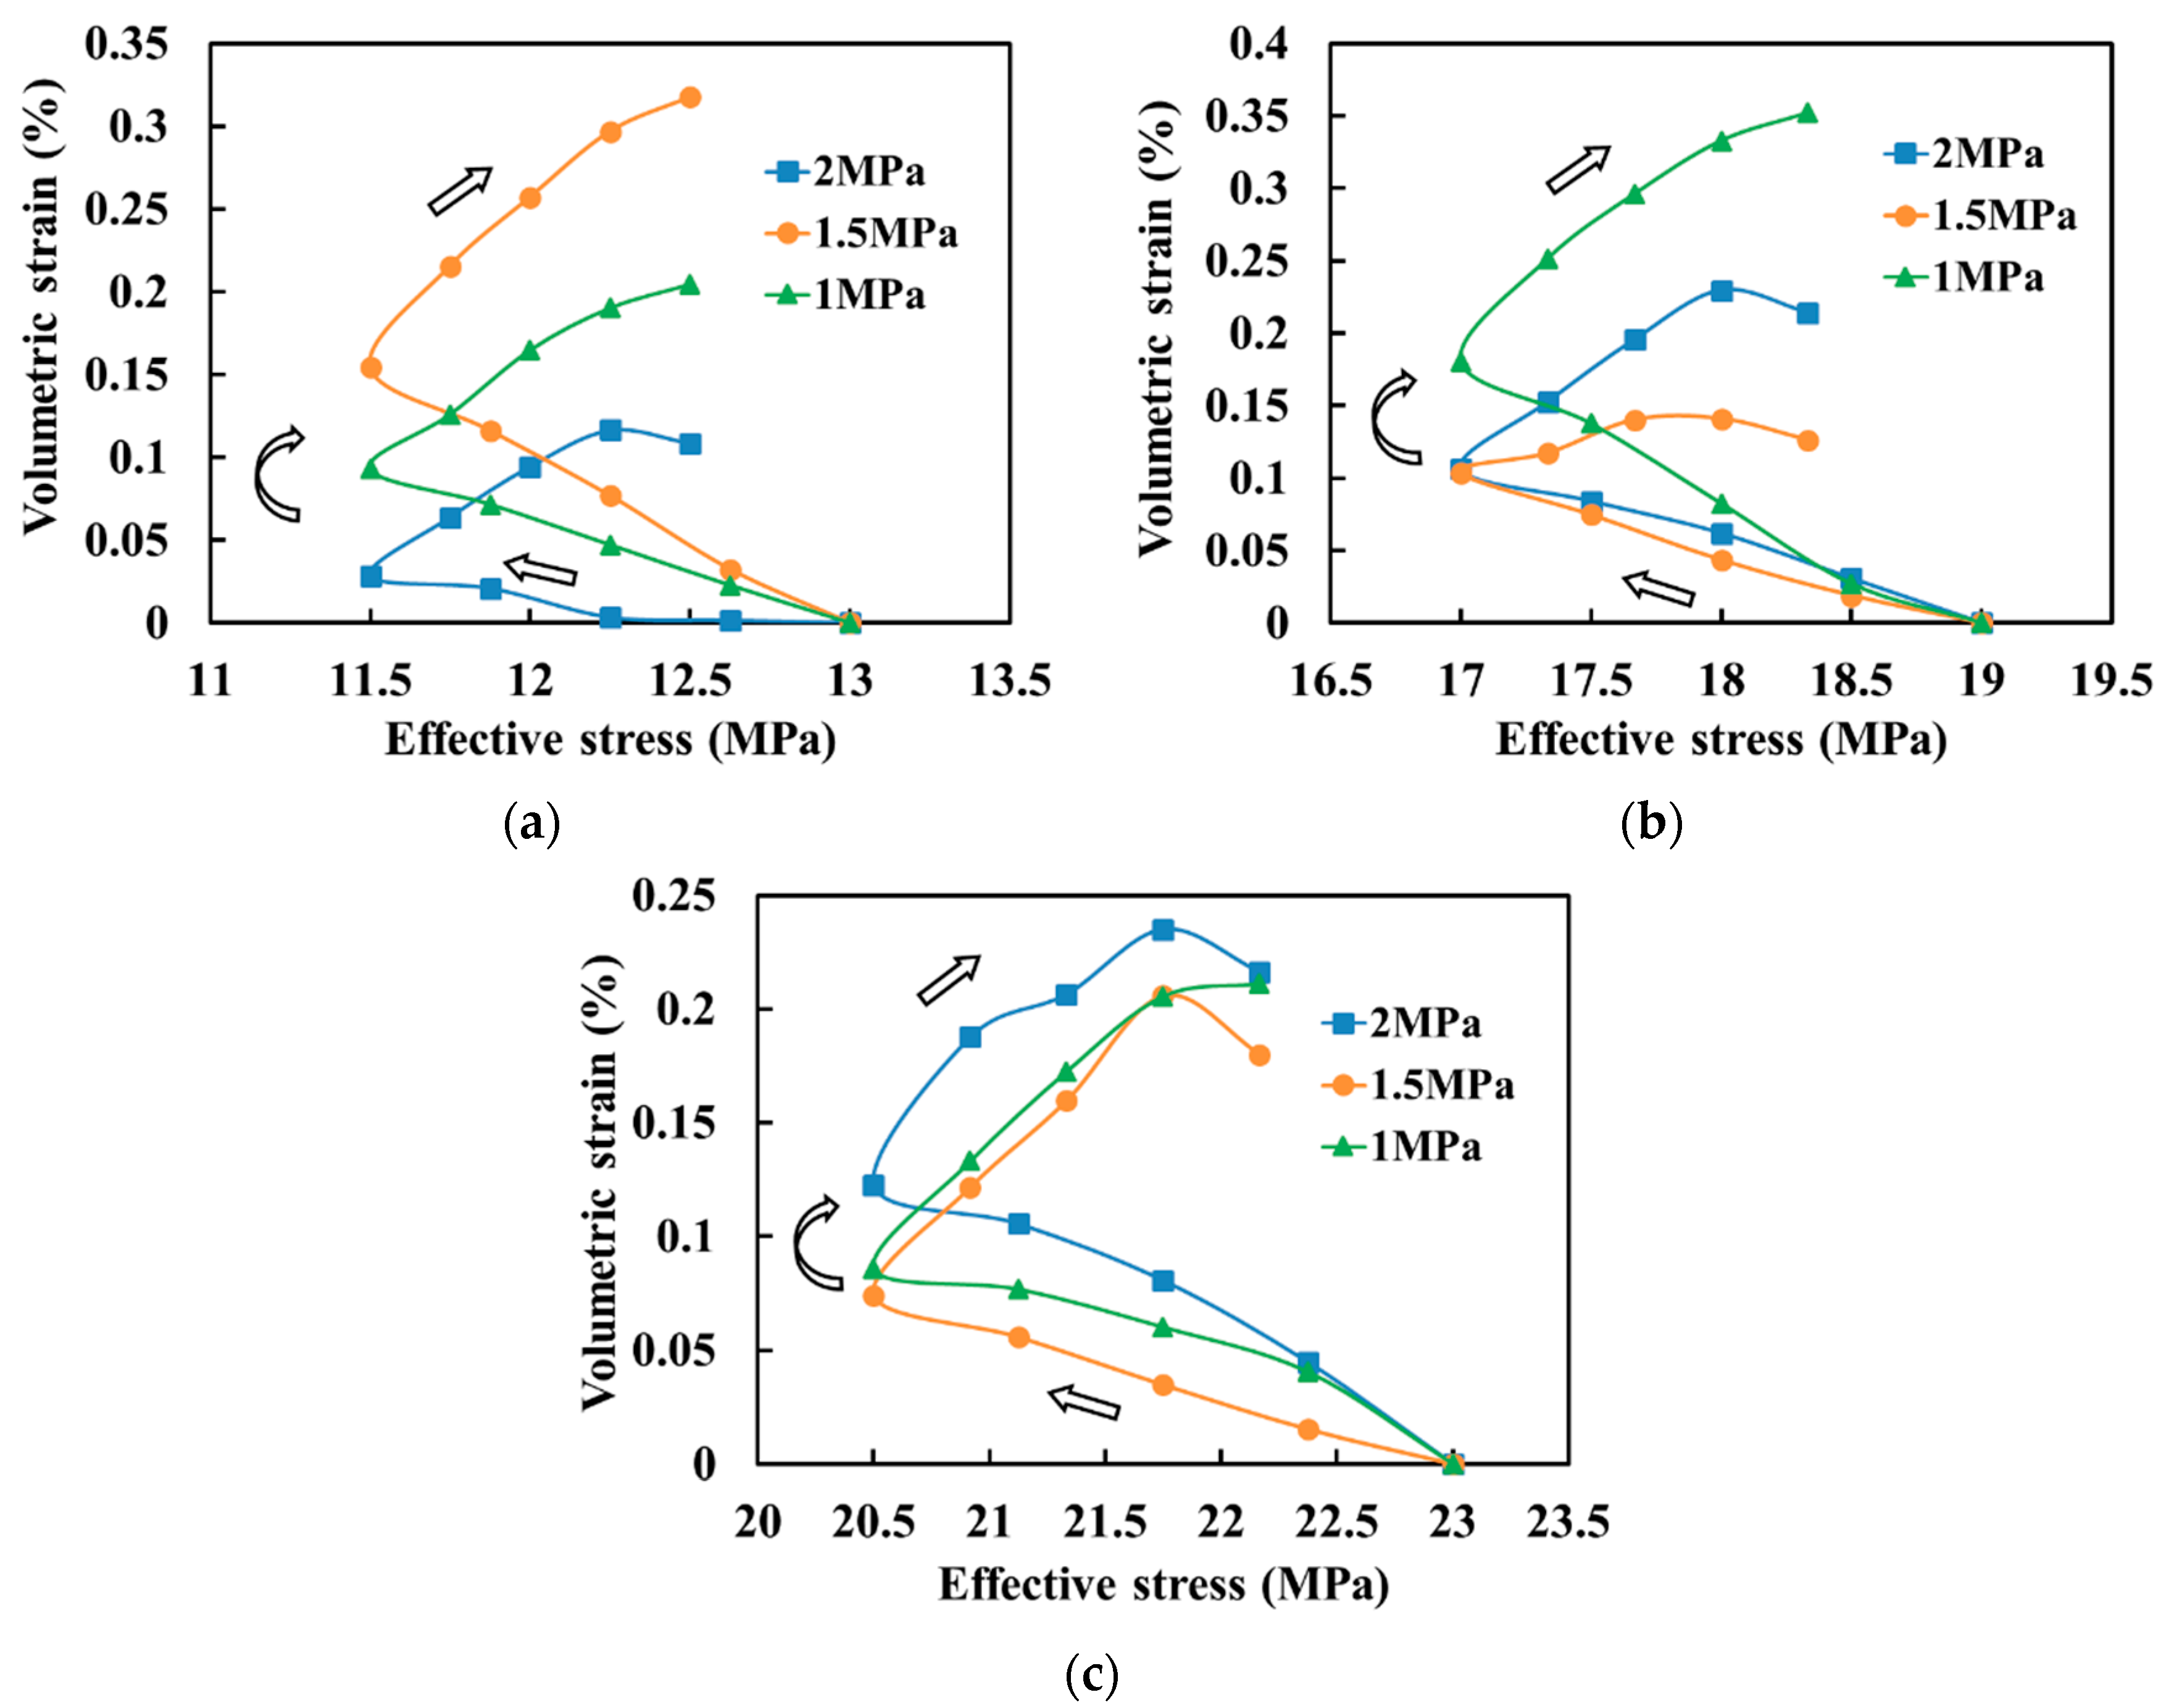
where εv is the volumetric strain, ε1 is the axial strain, and ε3 is the radial strain. The mechanical deformation characteristics of the sandstone samples under the mining stress path at Stages I and II are shown in Figure 4, Figure 5 and Figure 6. As shown in Figure 4, Figure 5 and Figure 6, the variation tendency of the axial strain, the radial strain, and the volumetric strain of sandstone under different load conditions of the axial stress, confining stress, and effective stress are approximately similar, respectively. The axial strain of the sandstone shows a linear growth trend with the increase in the axial stress, and the growth rates of Stage I and Stage II remain unchanged (Figure 4). For the radial strain, it presents an exponential function growth trend with the unloading of the confining stress, and the growth rate of Stage II is significantly higher than that of Stage I (Figure 5). As for the volumetric strain of sandstone, its trend with the variation of effective stress roughly depicts a transverse “V” symmetrical distribution, which corresponds to the reduction in the effective stress at Stage I and the increase in the effective stress at Stage II (Figure 6: the arrow in the figure indicates the stress path of the effective stress). In detail, at the end of the loading process in Stage II, the volumetric deformation of sandstone changes from compression to expansion with the increase in initial confining pressure. Under the same initial confining pressure, the influence of mechanical deformation in the sandstone is mainly affected by mining stress compared with pore pressure.
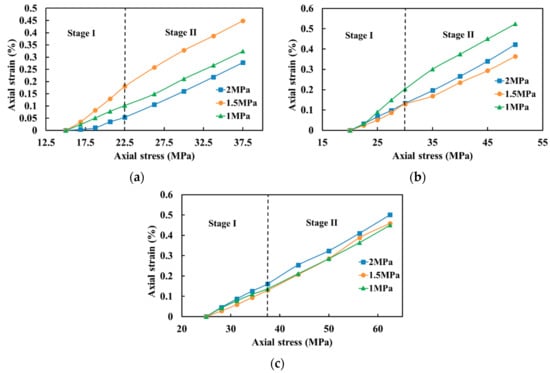
Figure 4.
Axial strain variation of sandstone under different initial confining pressures ((a–c) are the initial confining pressure of 15 MPa, 20 MPa, and 25 MPa, respectively).
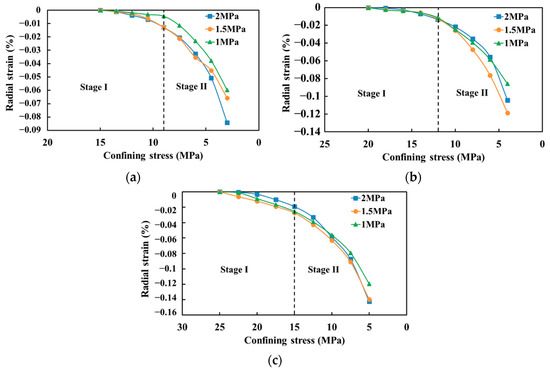
Figure 5.
Radial strain variation of sandstone under different initial confining pressures ((a–c) are the initial confining pressure of 15 MPa, 20 MPa, and 25 MPa, respectively).
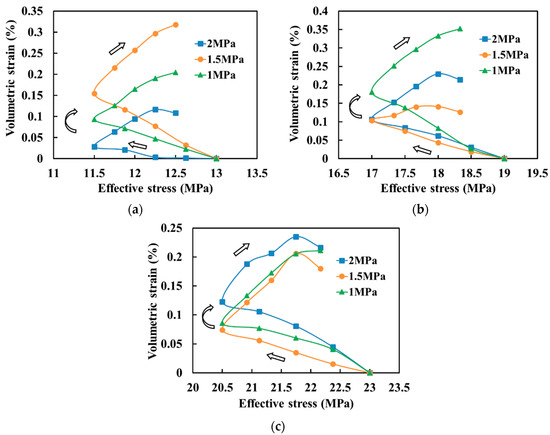
Figure 6.
Volumetric strain variation of sandstone under different initial confining pressures ((a–c) are the initial confining pressure of 15 MPa, 20 MPa, and 25 MPa, respectively).
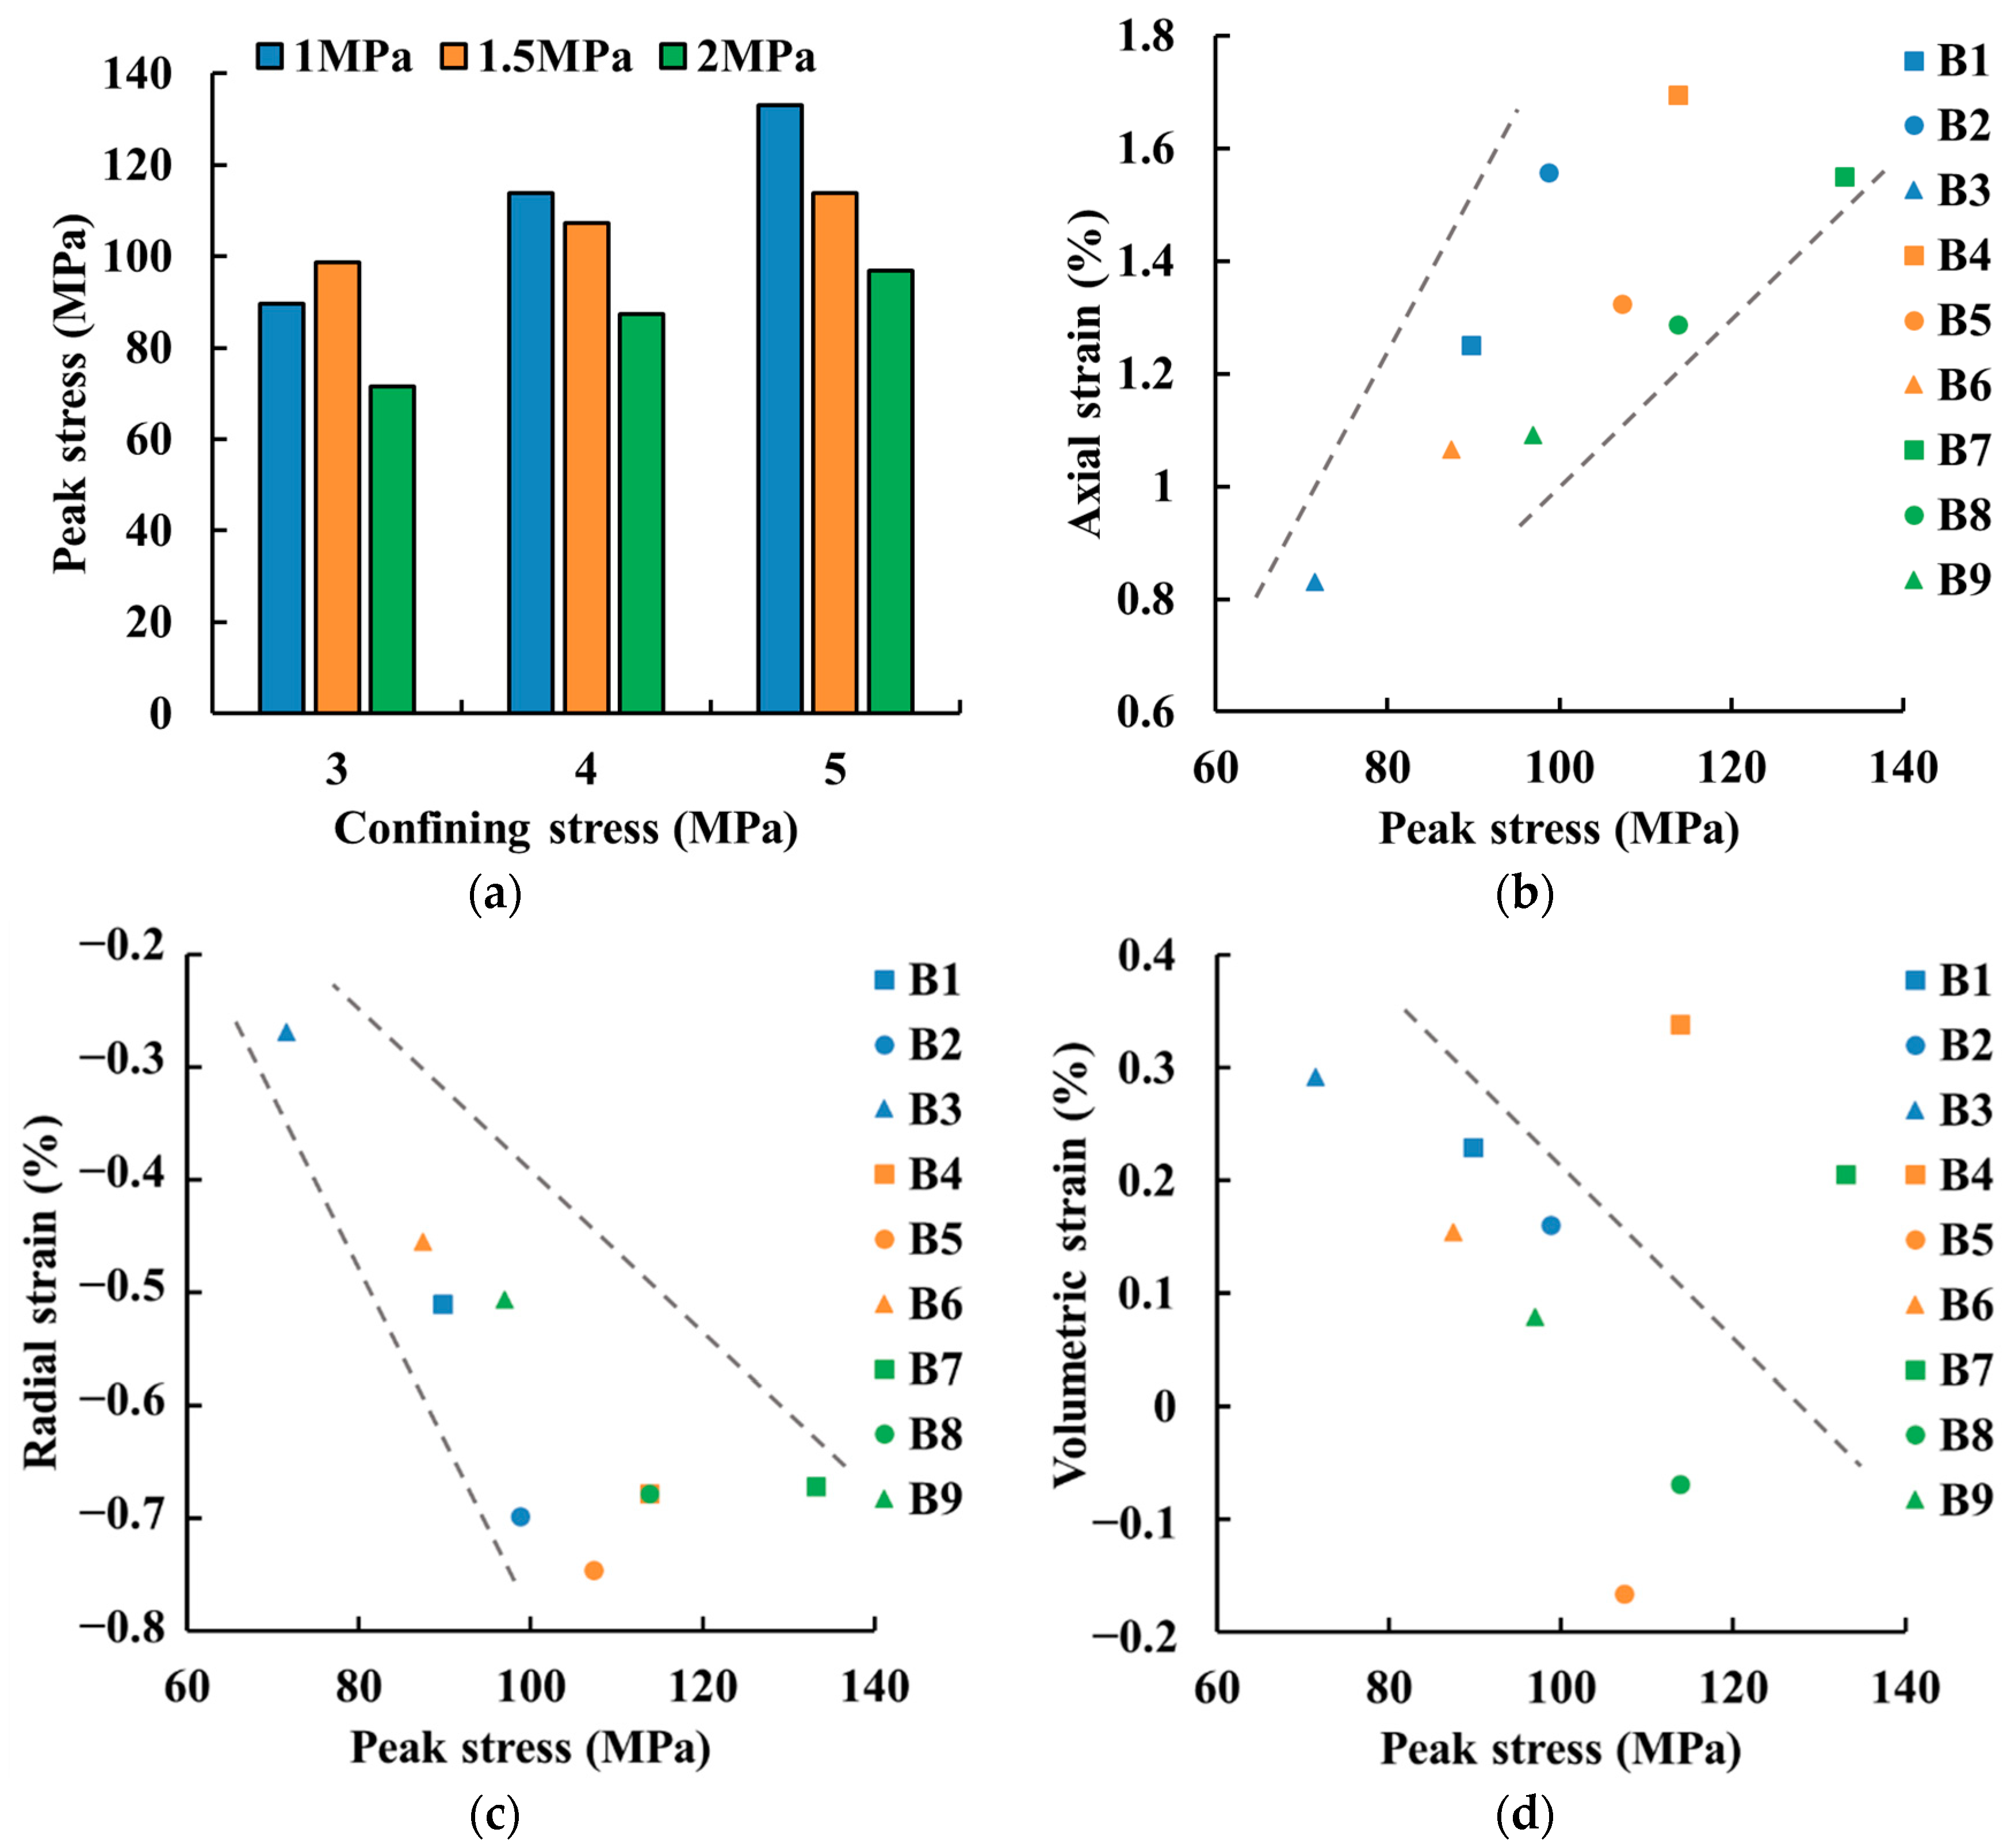
The peak parameters of sandstone, including deformation and permeability parameters, at the peak stress state in Stage III, are listed in Table 2. To intuitively summarize the corresponding effects of initial confining pressure and pore pressure, Figure 7 is drawn by using the data in Table 2. Under the same initial confining pressure, the peak stress of sandstone reduces with the increase in pore pressure, while the peak stress of sandstone increases with the incremental confining pressure under the same pore pressure. The absolute value of both the axial strain and the radial strain increases with the incremental confining pressure. Under the same confining pressure conditions, the volumetric strain at the peak stress state gradually decreases due to the increase in pore pressure. Most sandstone samples still maintain compression at the peak stress state, except for samples B5 and B8, which was significantly different from the coal samples [26]. The mineral composition and pore–fracture structure are the main reasons for this distinction. The sandstone is mainly composed of brittle minerals and is dense, with fewer pores and microcracks resulting in it being hard to deform. Conversely, the coal is composed of ductile minerals and has more microcracks and cleats, so it becomes more easily deformed at low confining stress. Note that the individual difference in samples leads to a slight deviation between the test results and the overall test law.
Table 2.
Information of peak parameters of sandy mudstone sample.

Figure 7.
Peak stress and corresponding deformation of sandstone ((a–d) are the peak strength, corresponding axial, radial, and volumetric strain, respectively).
3.2. Failure Mode of Sandstone under Mining Stress Conditions
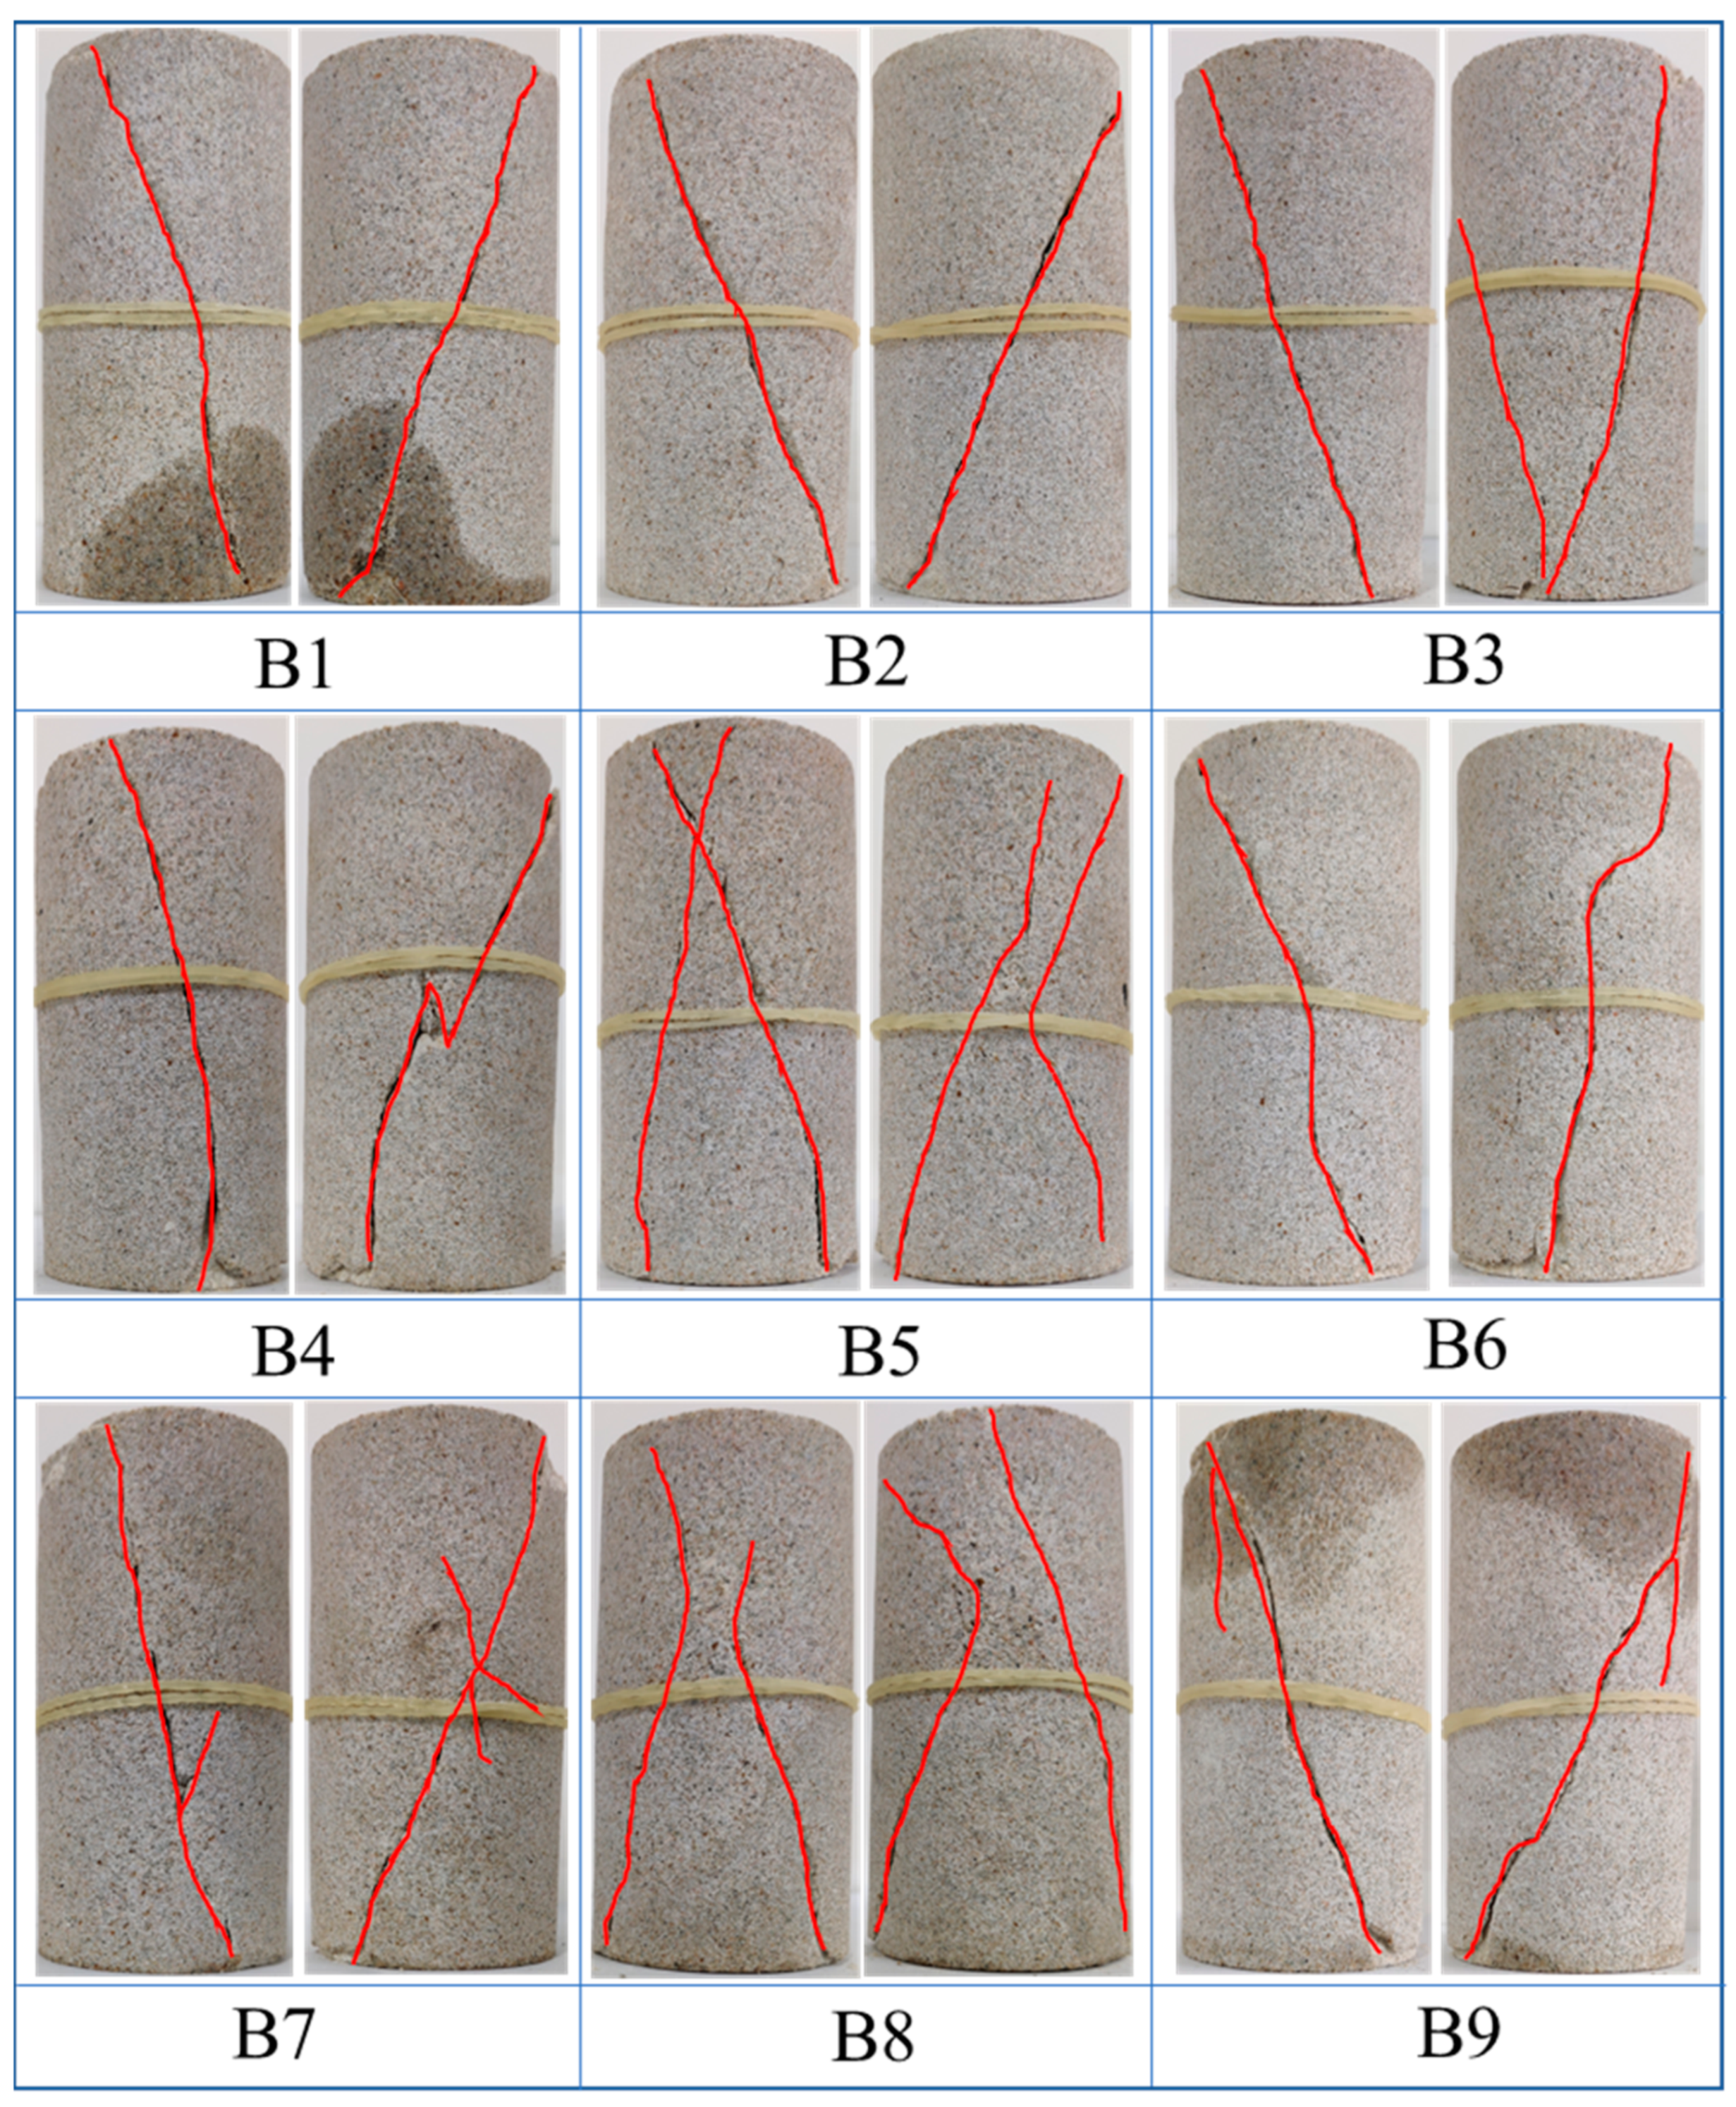
The failure characteristics of the sandstone at Stage III are shown in Figure 8. Overall, after the sandstone undergoes a simulated mining stress loading path, its failure mode at Stage III is mainly a shear failure, because the low confining stress makes the sandstone more brittle, which is manifested as follows: the macroscopic shear fracture pierces through the top and bottom end surfaces of the entire sample, so a part of the samples is in shear–tension failure mode, accompanied by some secondary tensile cracks and shear cracks. Under the same pore pressure, the final fracture morphology of the sandstone tended to be complicated with the increase in initial confining pressure. The overall performance is the transition from shear failure to shear–tension failure, which corresponded to the transformation from a single shear fracture to multiple positive and negative shear fractures, which tend to form an approximate “X”-shaped conjugate shear fracture (samples B5 and B8) or to the main shear fracture followed by a secondary shear–tension fracture (samples B7 and B9). At the same time, the number of fractures developed by the final failure form of the sandstone has a good correspondence with the peak permeability under the same initial confining stress, which represents the greater number of fractures, the better connectivity of the pore–fracture system of the sandstone, the increase in the seepage channel of the fluid, and the improved permeation property, which caused the peak permeability to be larger (samples B3, B5, and B8), indicating that the number of fractures has a significant impact on the permeability of the sandstone.
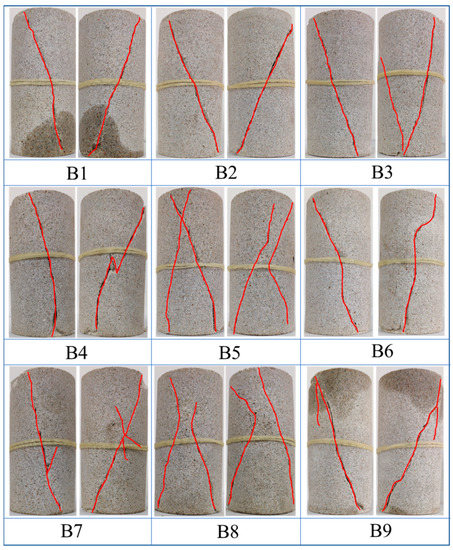
Figure 8.
Mining-induced failure characteristics of sandstone.
3.3. Permeability Evolution of Sandstone under Mining Stress
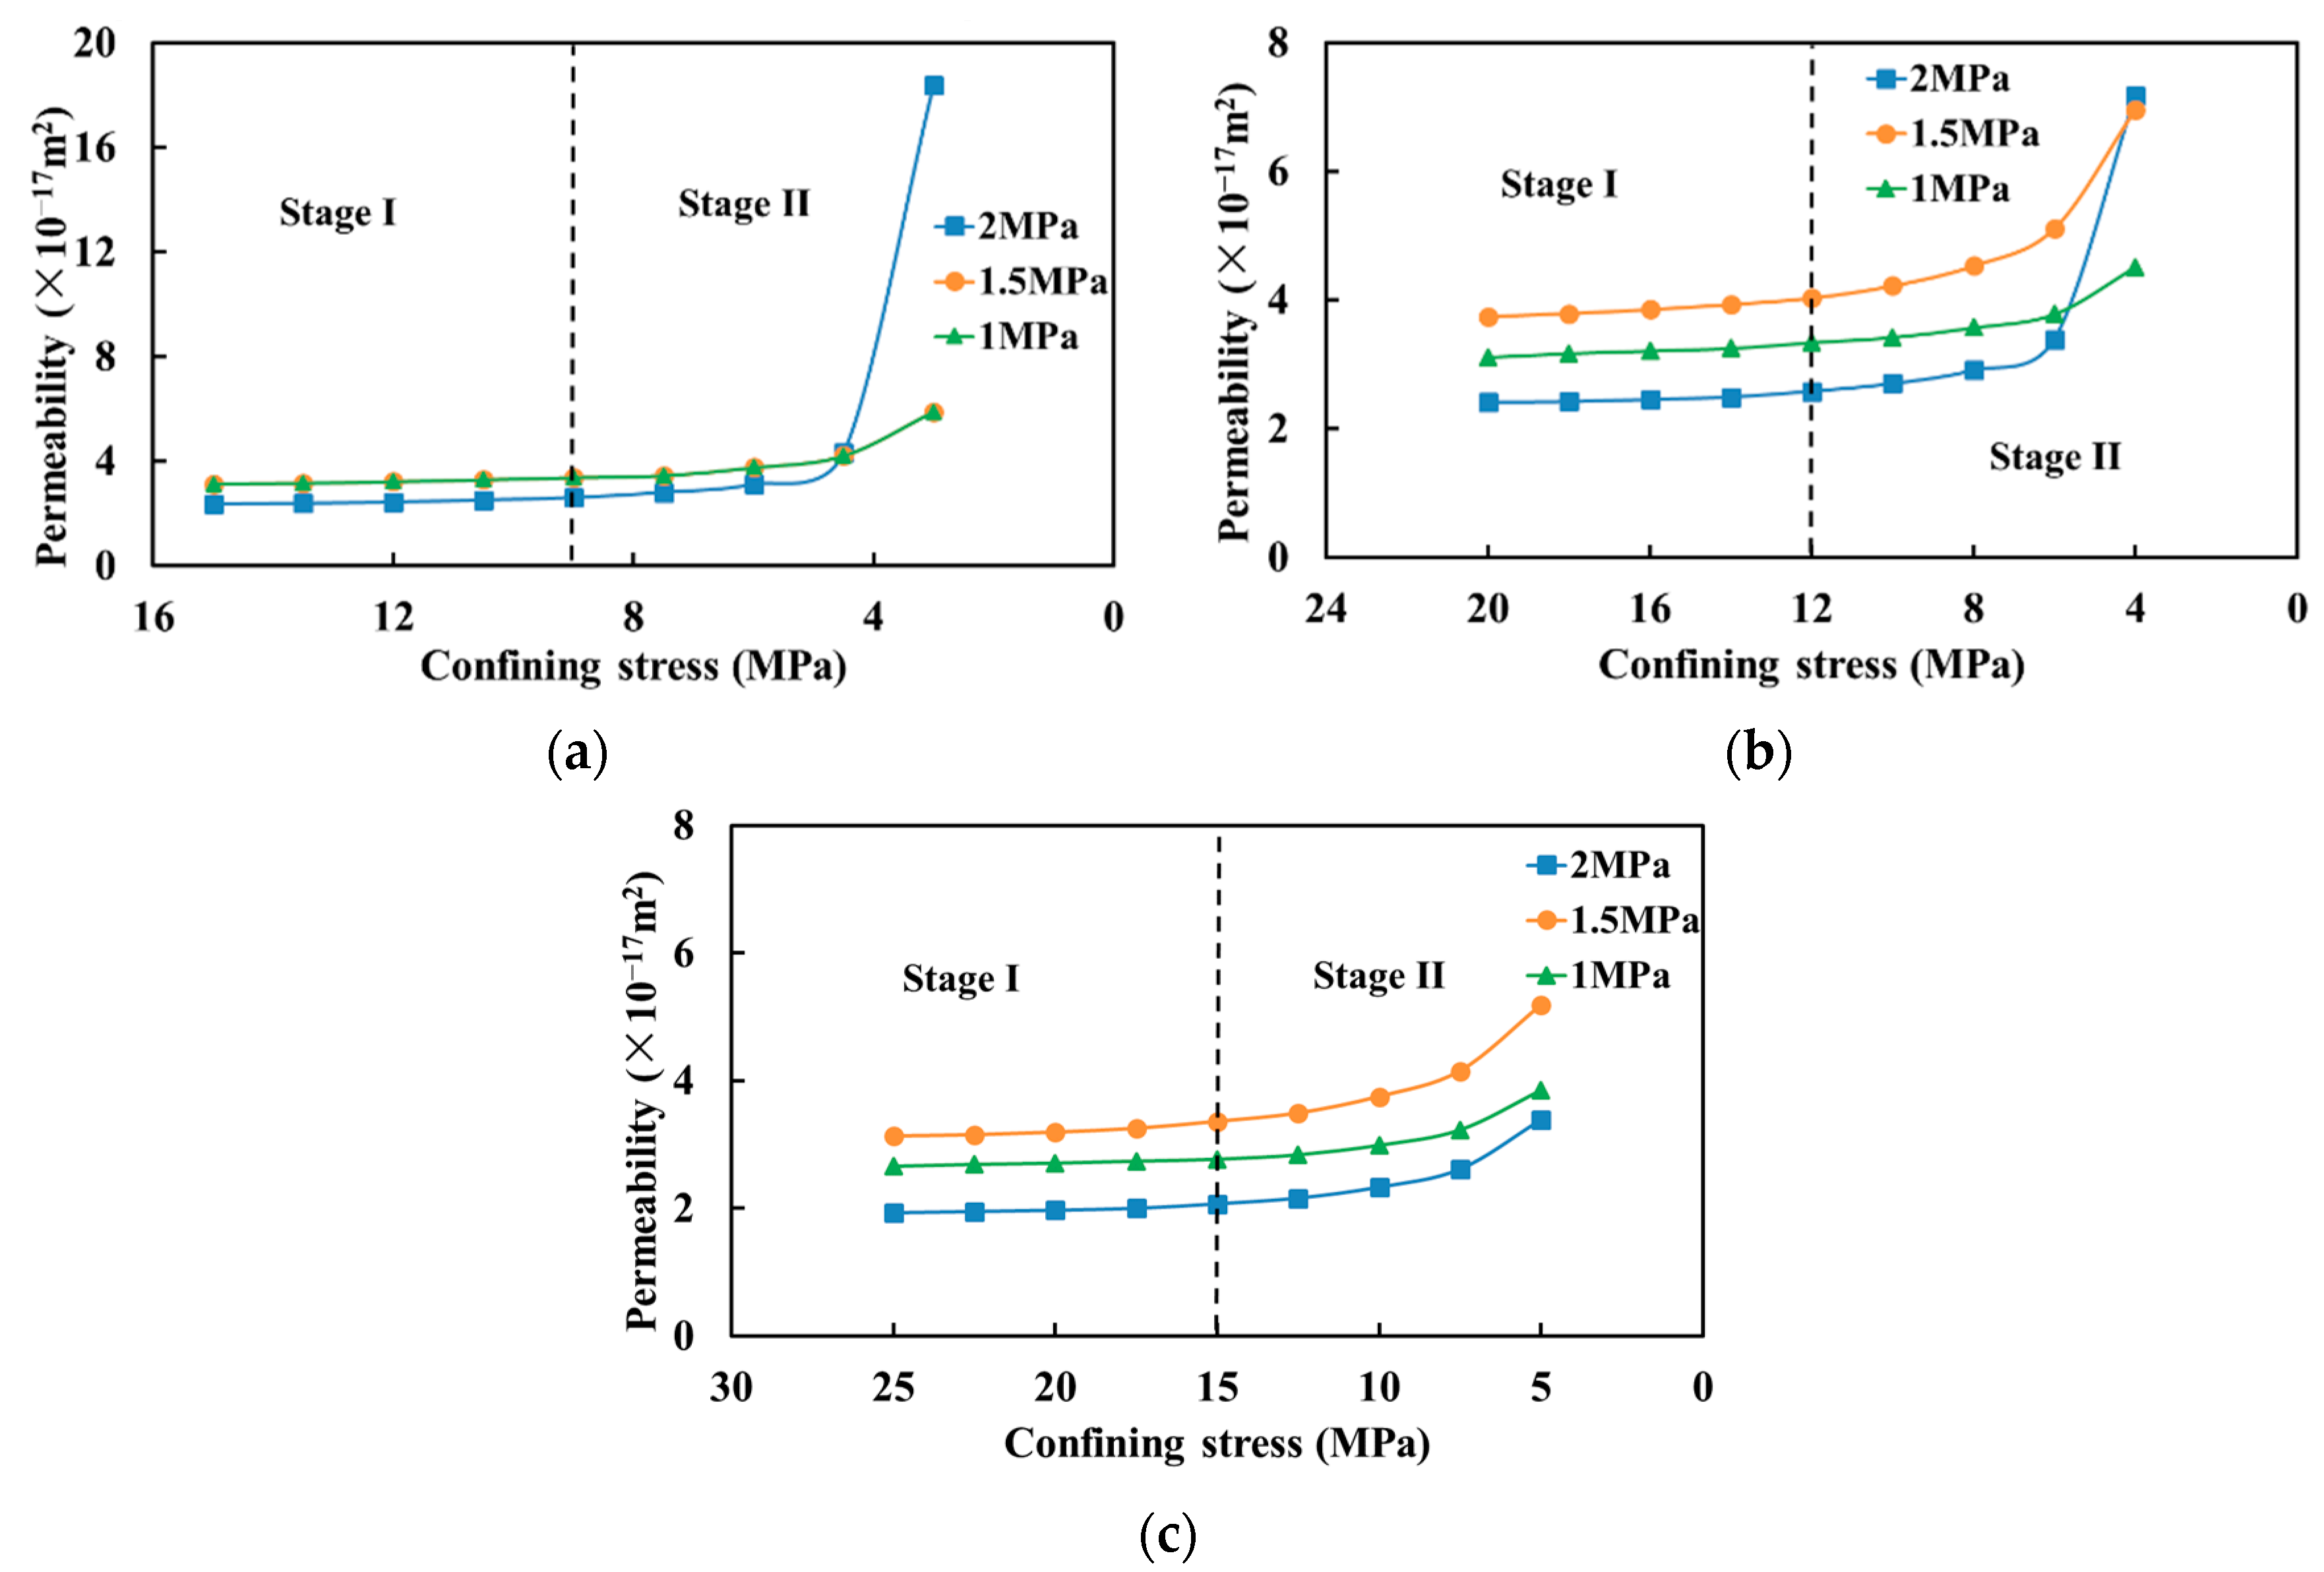
Under the different initial confining stress and pore pressure, the variation characteristics of the permeability of sandstone samples in the mining stress path are shown in Figure 9. It can be seen from Figure 9 that the permeability of sandstone samples, under the same initial confining pressure and pore pressure, presents a gradual increasing trend in the form of exponential function with the axial loading and radial unloading, which are mainly induced by the confining stress relief, also called the stress-relief effect. In addition, the growth rate in Stage II is significantly greater than that in Stage I. This phenomenon suggests that under the mining activities, the impact of radial unloading on the permeability of the sandstone (the seepage direction is axial) is dramatically higher than that of axial loading; the main reason for this is that under the action of simulated mining stress, the unloading of the confining stress leads to the aperture broaden of the seepage channels, which are mainly composed of pores and throats, in the sandstone. At the same time, the loading of the axial stress also contributes to the unloading of the confining stress, which can be also proven by the obvious increase in the permeability of the sandstone in Stage II, further enlarging the radii of the pores and the throats and increasing the flow capacity of the seepage path in the sandstone, which results in a gradual increase in the permeability of the sandstone.
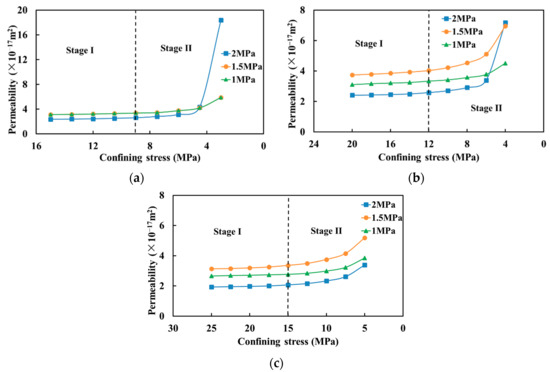
Figure 9.
Permeability variation of sandstone under different initial confining pressures ((a–c) are the initial confining pressure of 15 MPa, 20 MPa, and 25 MPa, respectively).
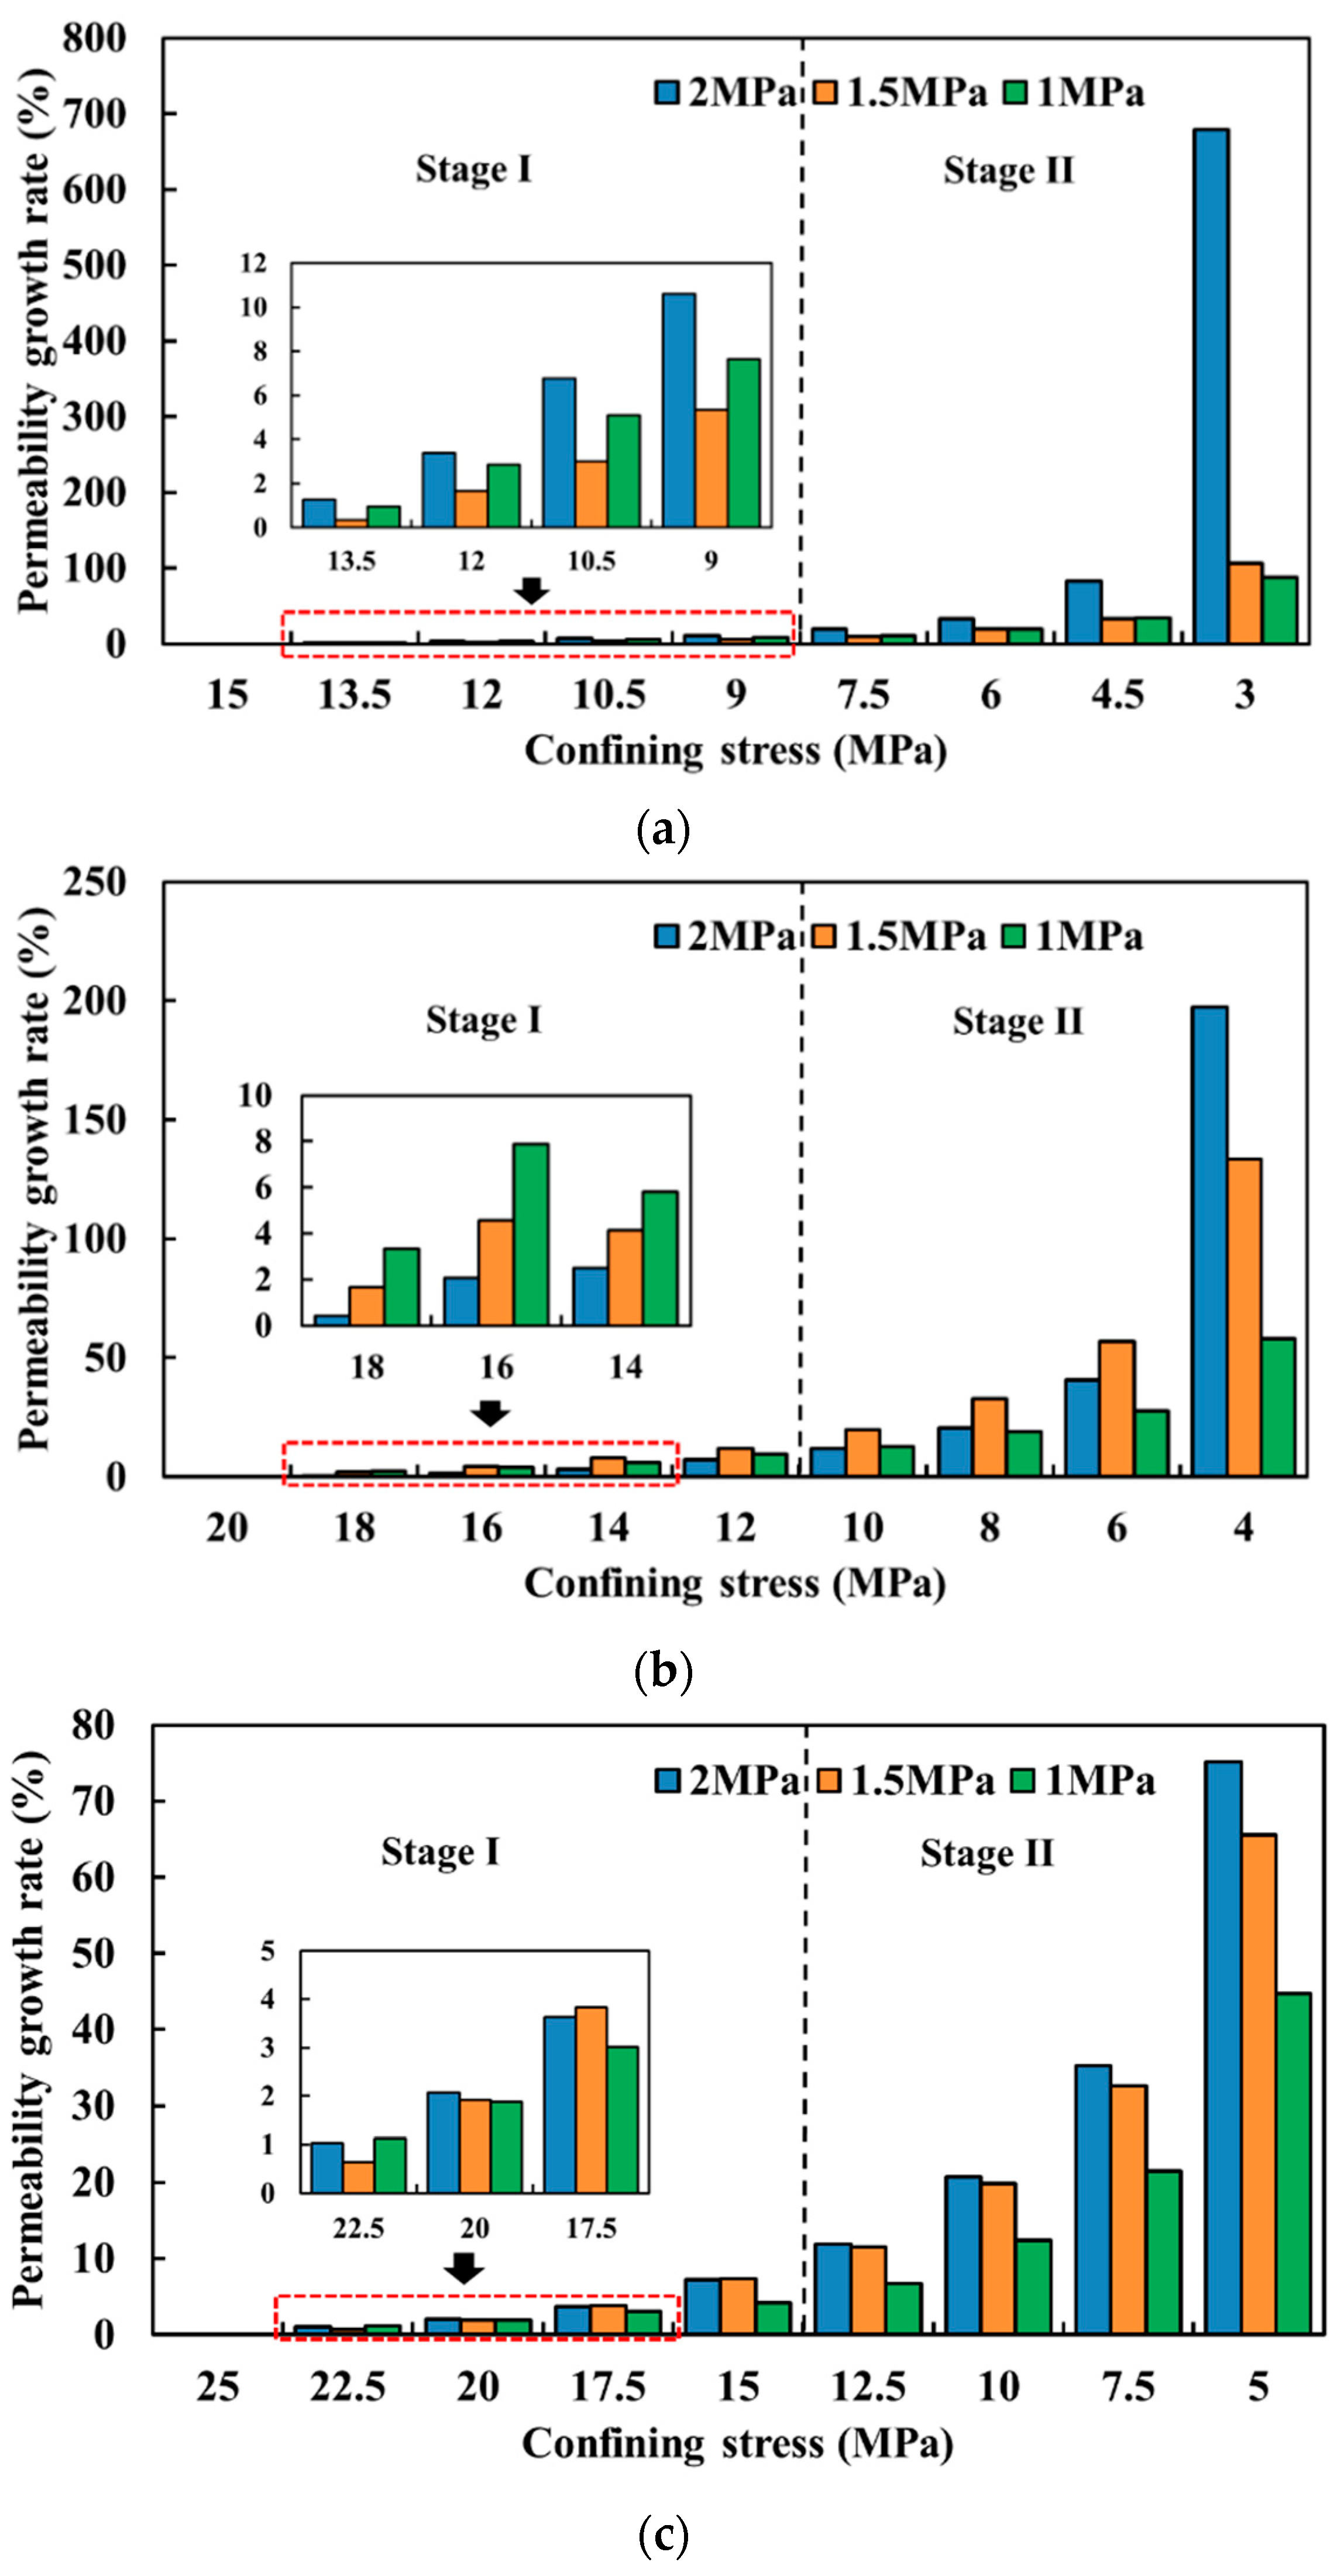
To represent the variation of the permeability of sandstone samples at different loading stages intuitively, the permeability growth rate η is introduced as follows:
where η is the permeability growth rate; ki is the permeability of sandstone, m2; and kini is the initial permeability of sandstone, m2. Under different initial confining pressures and pore pressures, the η of the sandstone samples changed with the mining stress, which is presented in Figure 10. The η of the sandstone samples in Stage I range from 0% to 20%, and the maximum value is 19.92%, indicating that the mining stress in Stage I has a slight impact on the permeability of the sandstone. Once reaching Stage II, the η increases markedly, ranging from 20% to 680%, and the maximum value is 678.81%. With the increasing of the in situ stress, the η of the sandstone samples changes more obviously. When the axial stress was loaded to 2.5 times of the in situ stress, and the confining stress was unloaded to 0.2 times of the in situ stress, the η of the sandstone samples is the largest; this indicates that at the end of Stage II, the sandstone enters the deformation stage of the stable expansion of the cracks, and a large number of new microfractures in the sample germinate and nucleate, connecting and converging with the original seepage channels, so the enlargement of the radii of the original pores and throats finally leads to a sharp increase in the η of the sandstone under this stress state.

Figure 10.
Permeability change ratio variation of sandstone under different initial confining pressures ((a–c) are the initial confining pressure of 15 MPa, 20 MPa, and 25 MPa, respectively).
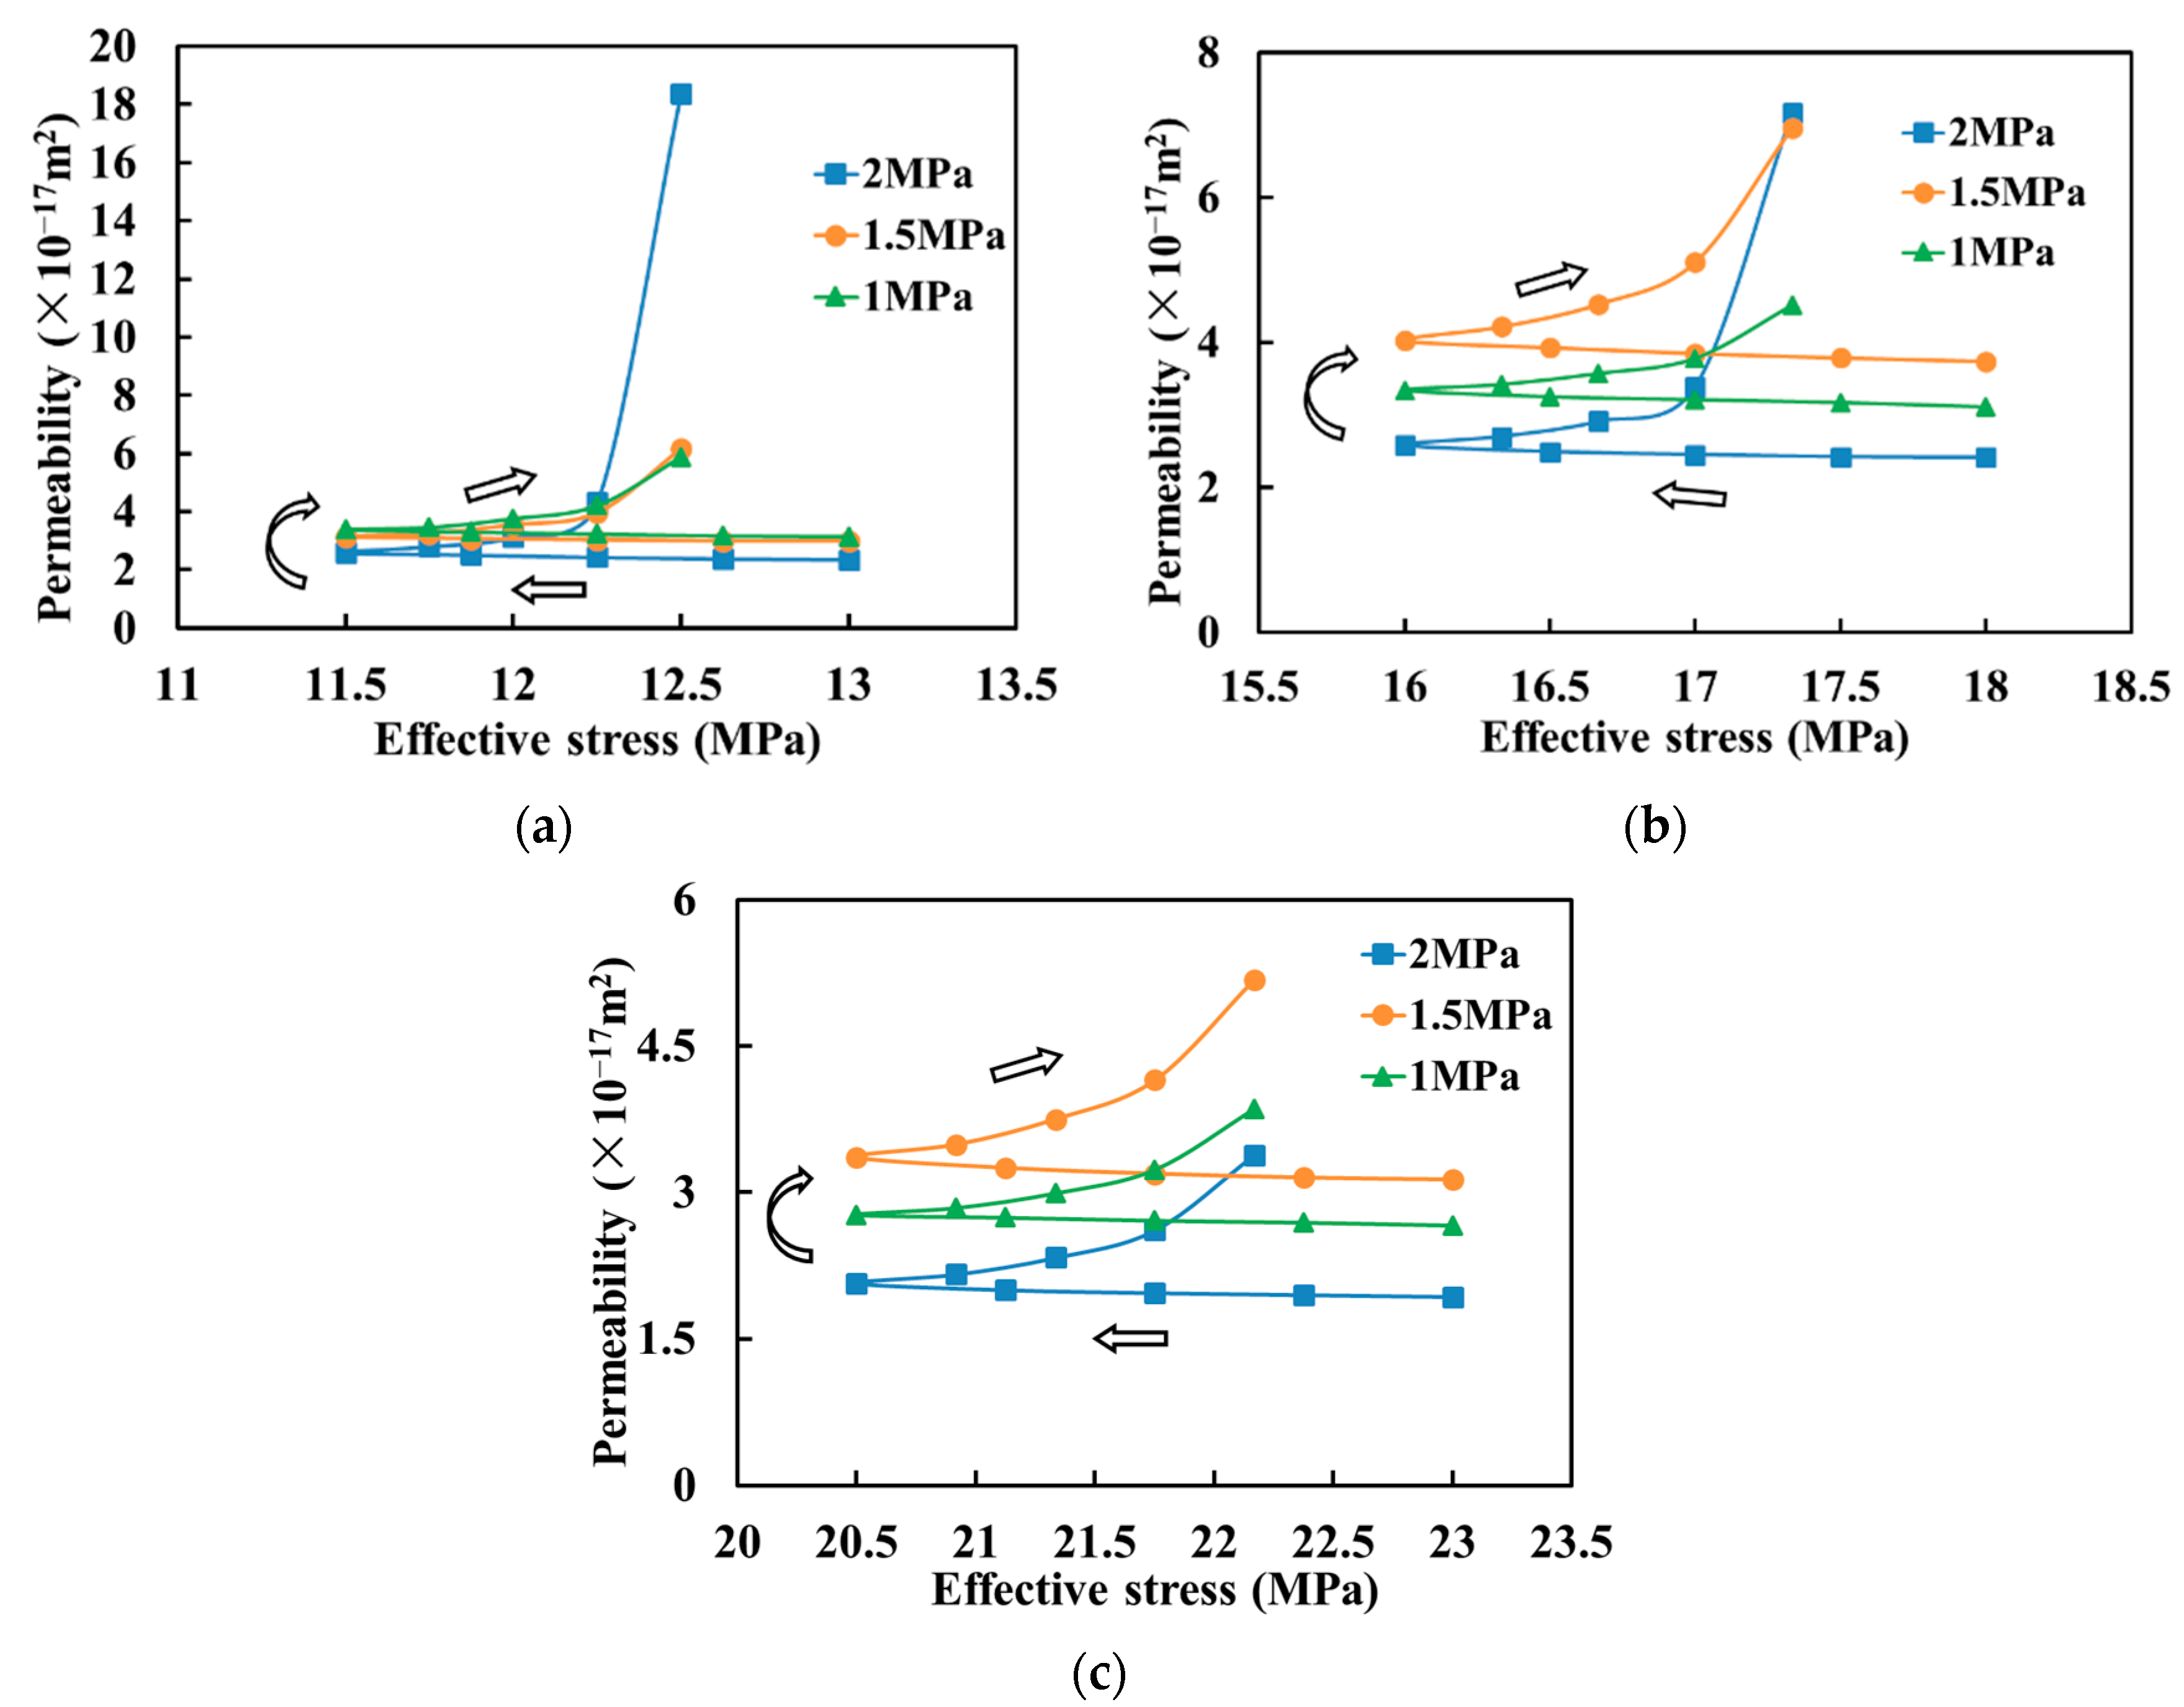
The relationships between the permeability and the effective stress under the different initial confining pressure and pore pressure conditions are shown in Figure 11. Under the action of mining stress, the permeability of the sandstone samples increases linearly with the decrease in the effective stress in Stage I and increases exponentially with the increase in the effective stress in Stage II. It can be concluded that selecting the confining stress can better reflect its relationship with the permeability, compared with the axial stress and the effective stress.
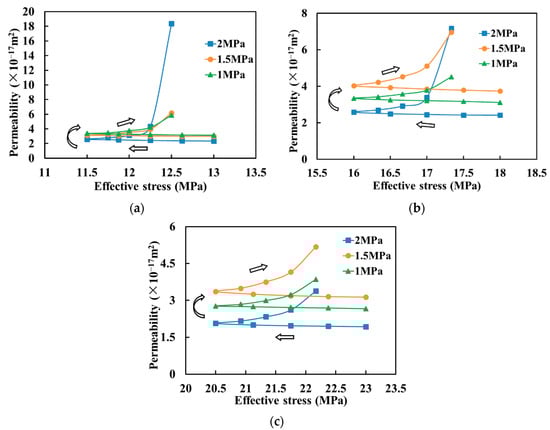
Figure 11.
Permeability variation of sandstone under different effective stresses ((a–c) are the initial confining pressure of 15 MPa, 20 MPa, and 25 MPa, respectively).
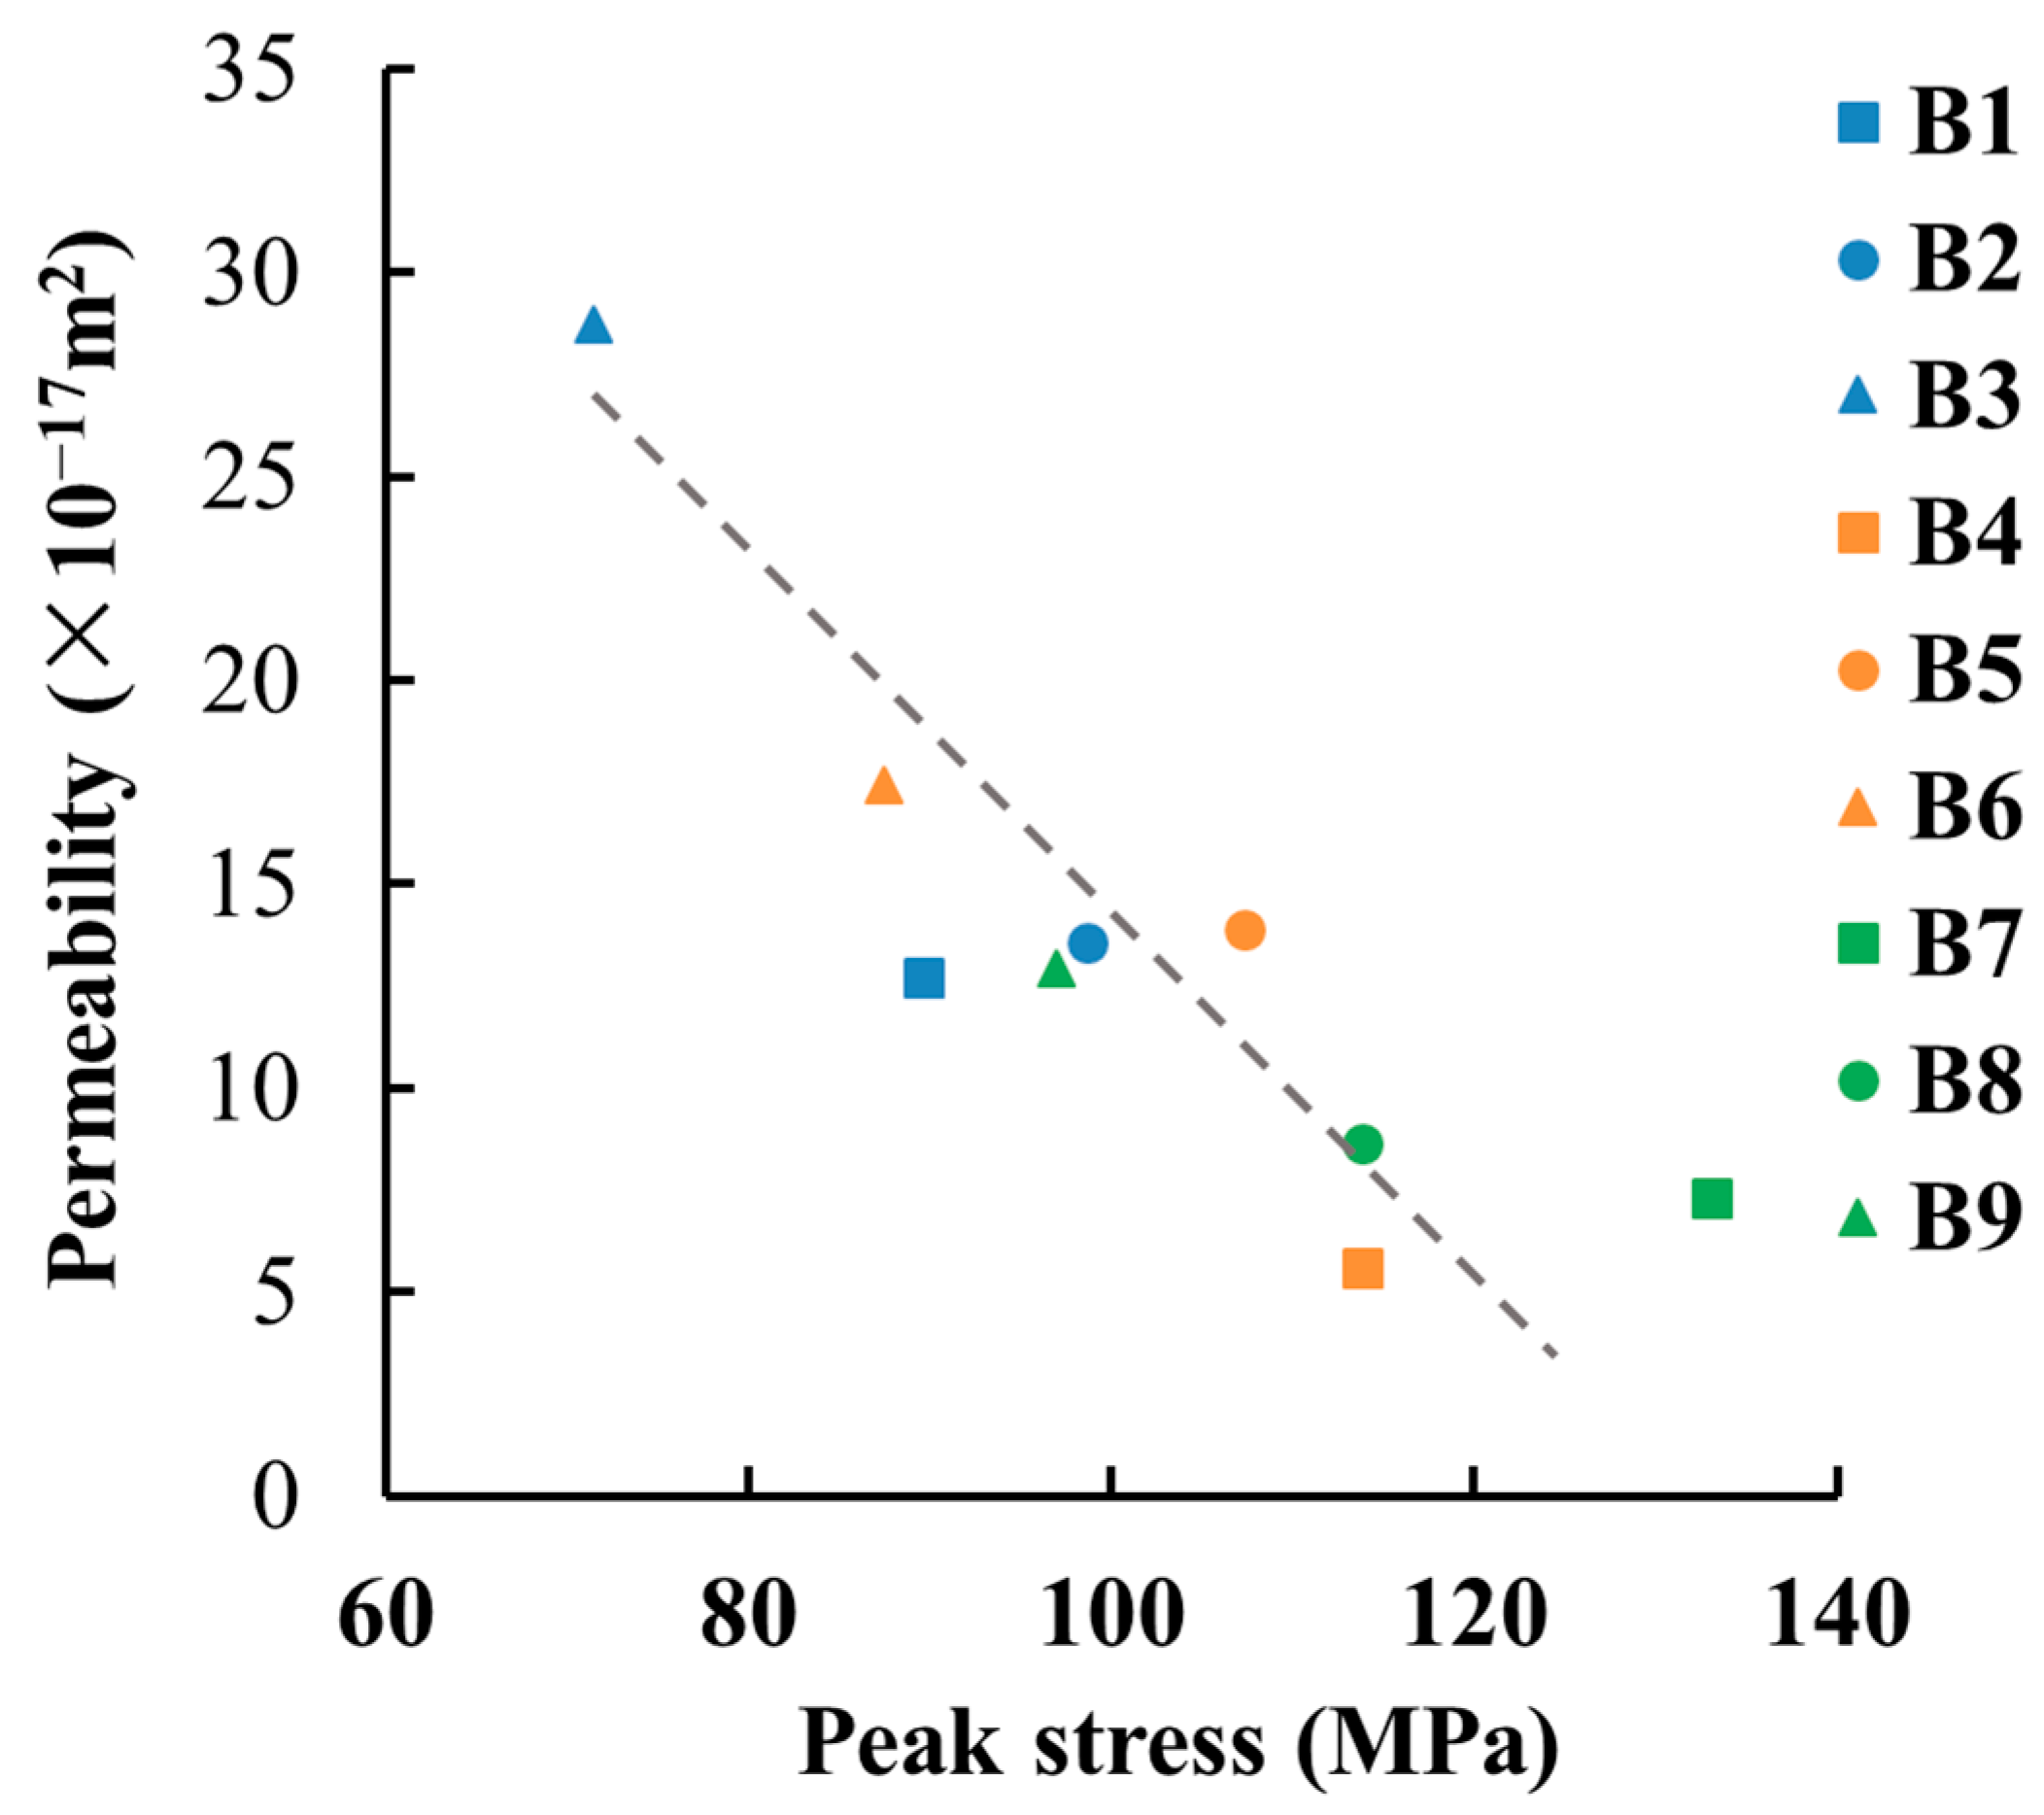
The peak permeability of the sandstone samples in the peak stress state at Stage III is shown in Figure 12. As seen in Figure 12, on the whole, under the same initial confining pressure, the permeability of the sandstone samples at peak stress gradually increased with the increasing pore pressure, while, under the same pore pressure, the permeability of the sandstone samples at peak stress decreased with the increasing initial confining pressure. The permeability of all sandstone samples at peak stress increased by up to one order of magnitude. The influence of the initial confining pressure on the mining-induced seepage behavior of sandstone is stronger than that of the pore pressure.

Figure 12.
Peak stress and corresponding permeability of sandstone.
3.4. Permeability Fitting Model of Sandstone under Mining Stress
The permeability of the rock is a function of the characteristics of rock media, which describes an average property of the ability to transport fluid. As the unloading confining stress is the dominant factor on the permeability change of sandstone in the mining stress path, the permeability is related to the effective confining stress. In Stages I and II of the mining stress path, the sandstone permeability is mainly contributed to by the variation in pore radius because of the change of the effective confining stress. The exponential relationship between the permeability and the effective confining stress is discovered through regression and analysis using the experimental data, which is expressed as Equation (5).
where ki is the sandstone permeability, m2; k0 is the initial sandstone permeability, m2; A and B are fitting parameters; σc is the effective confining stress, MPa; and σc0 is the initial effective confining stress, MPa.
In this study, furthermore, the effective confining stress σc can be calculated by the following equation:
where ν is the Poisson’s ratio of sandstone, with a value of 0.02 obtained by the mechanical tests.
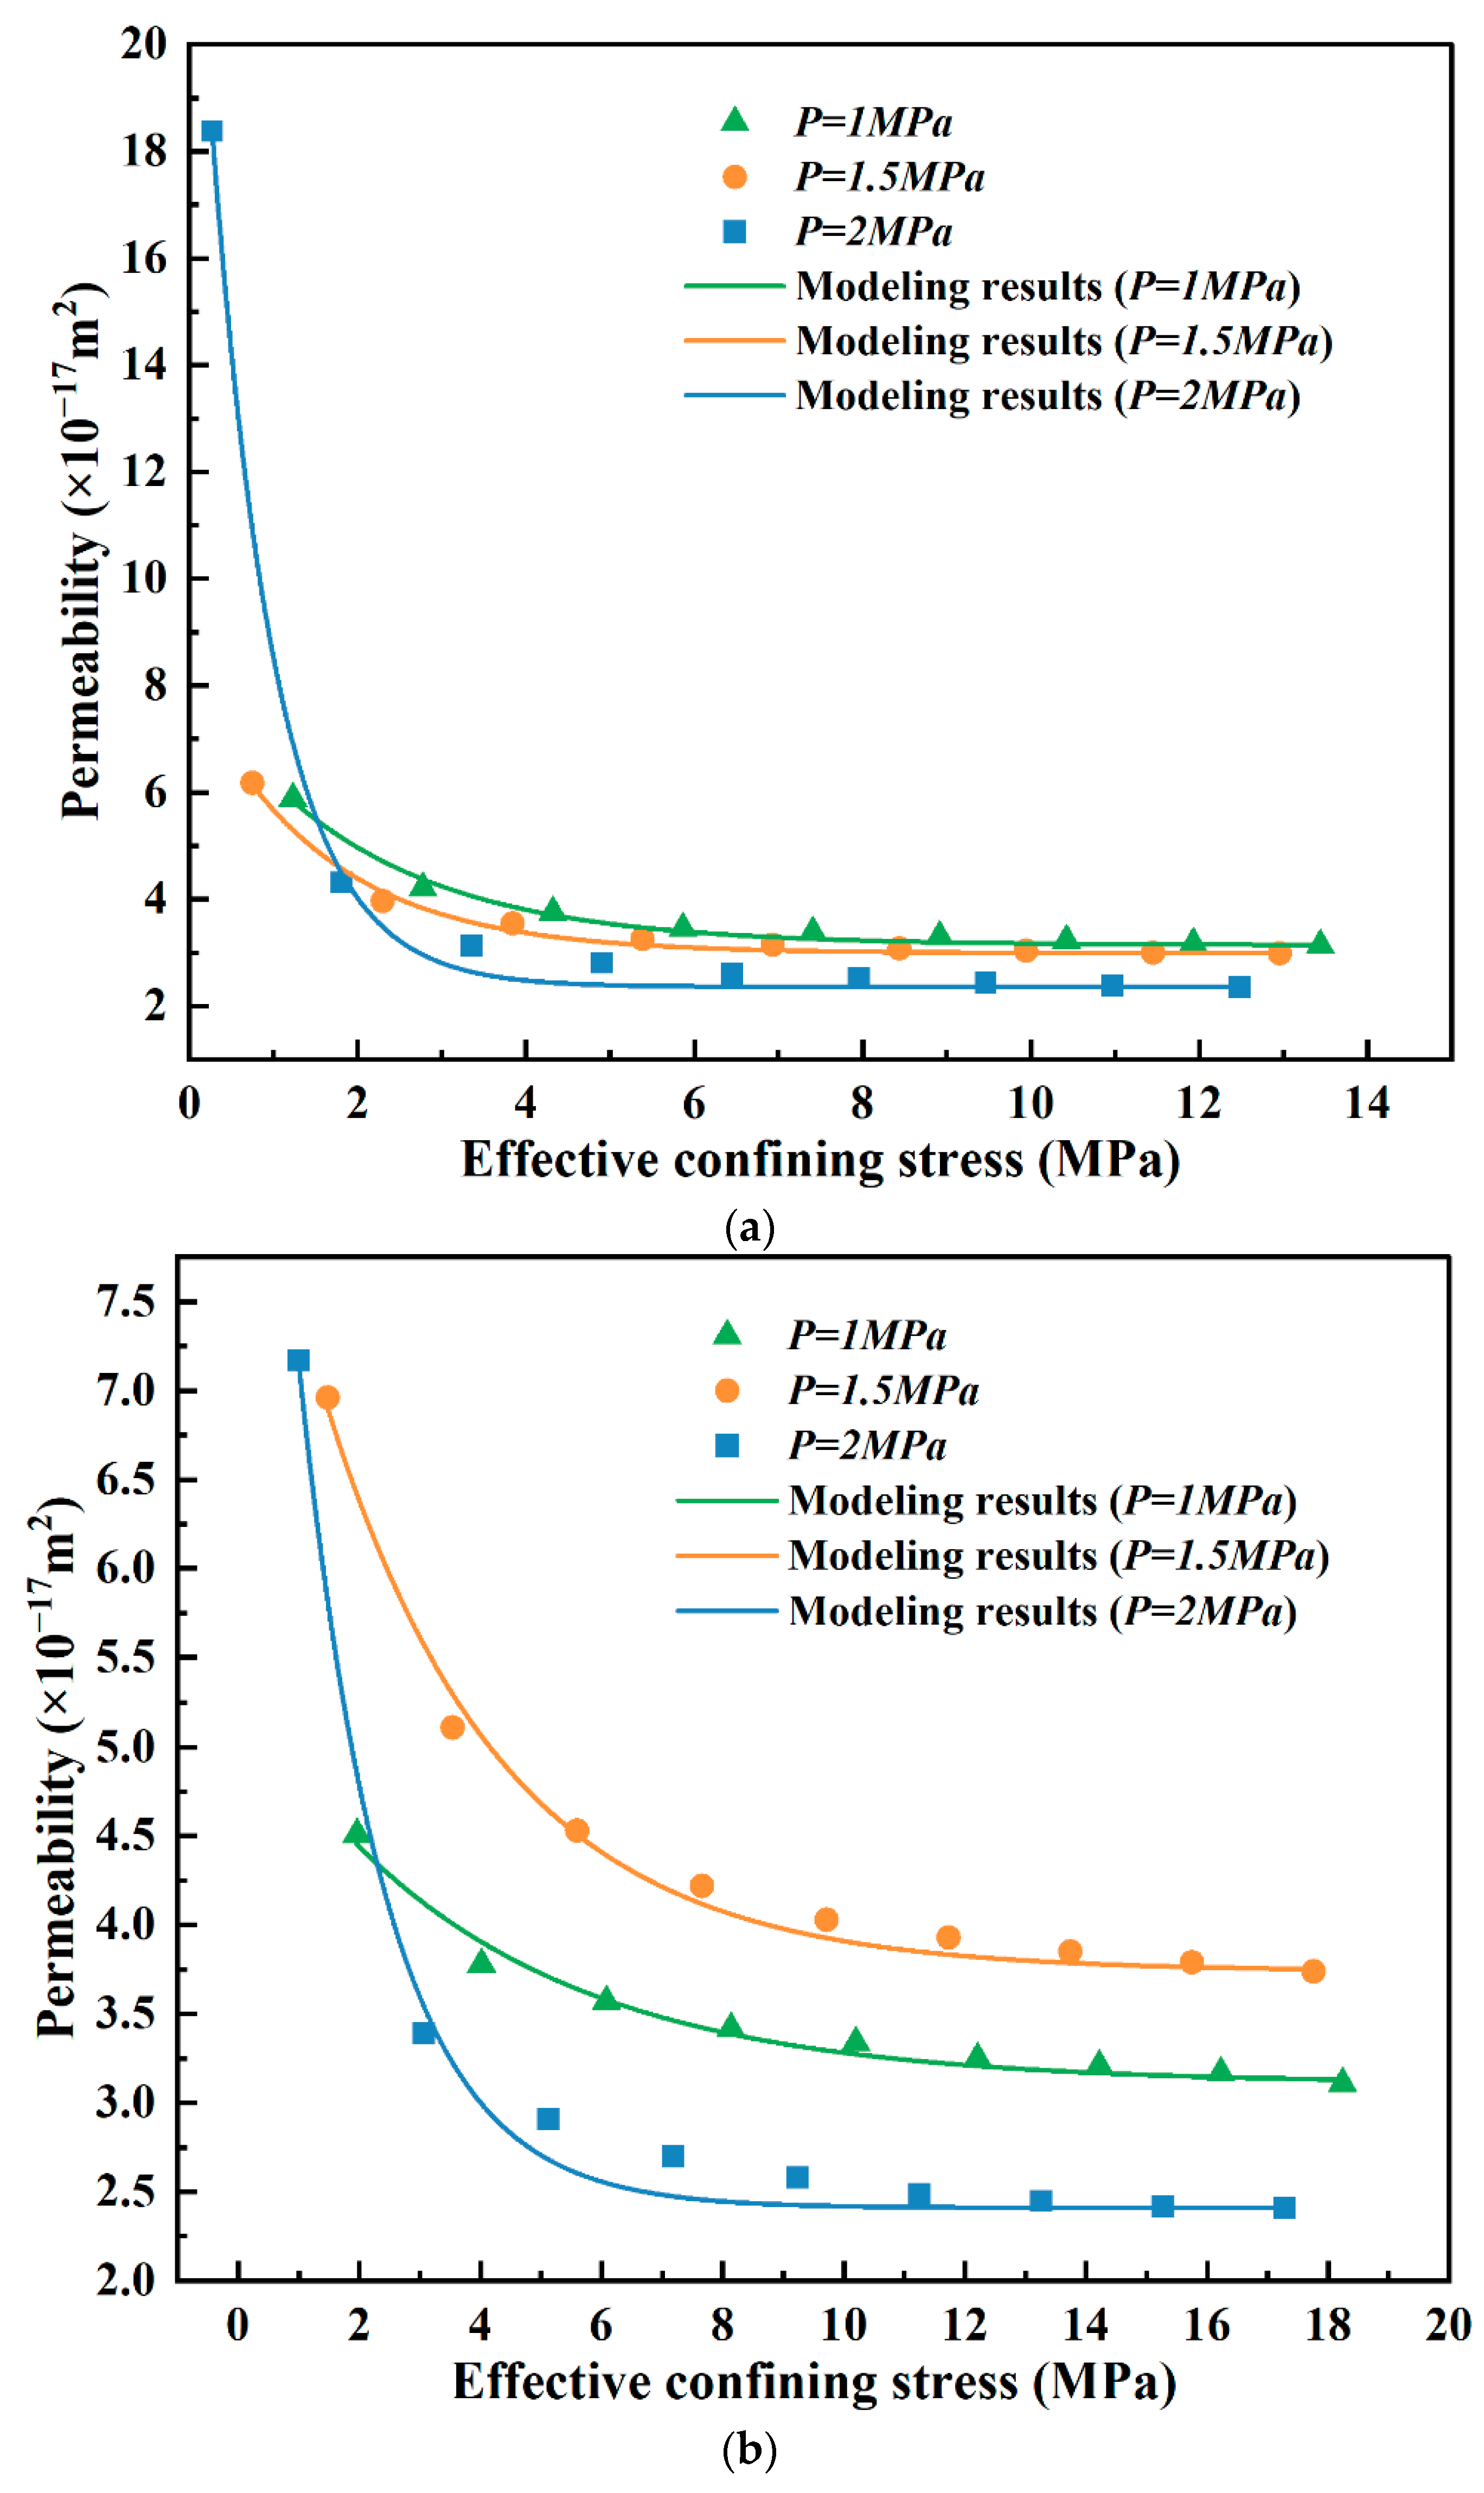
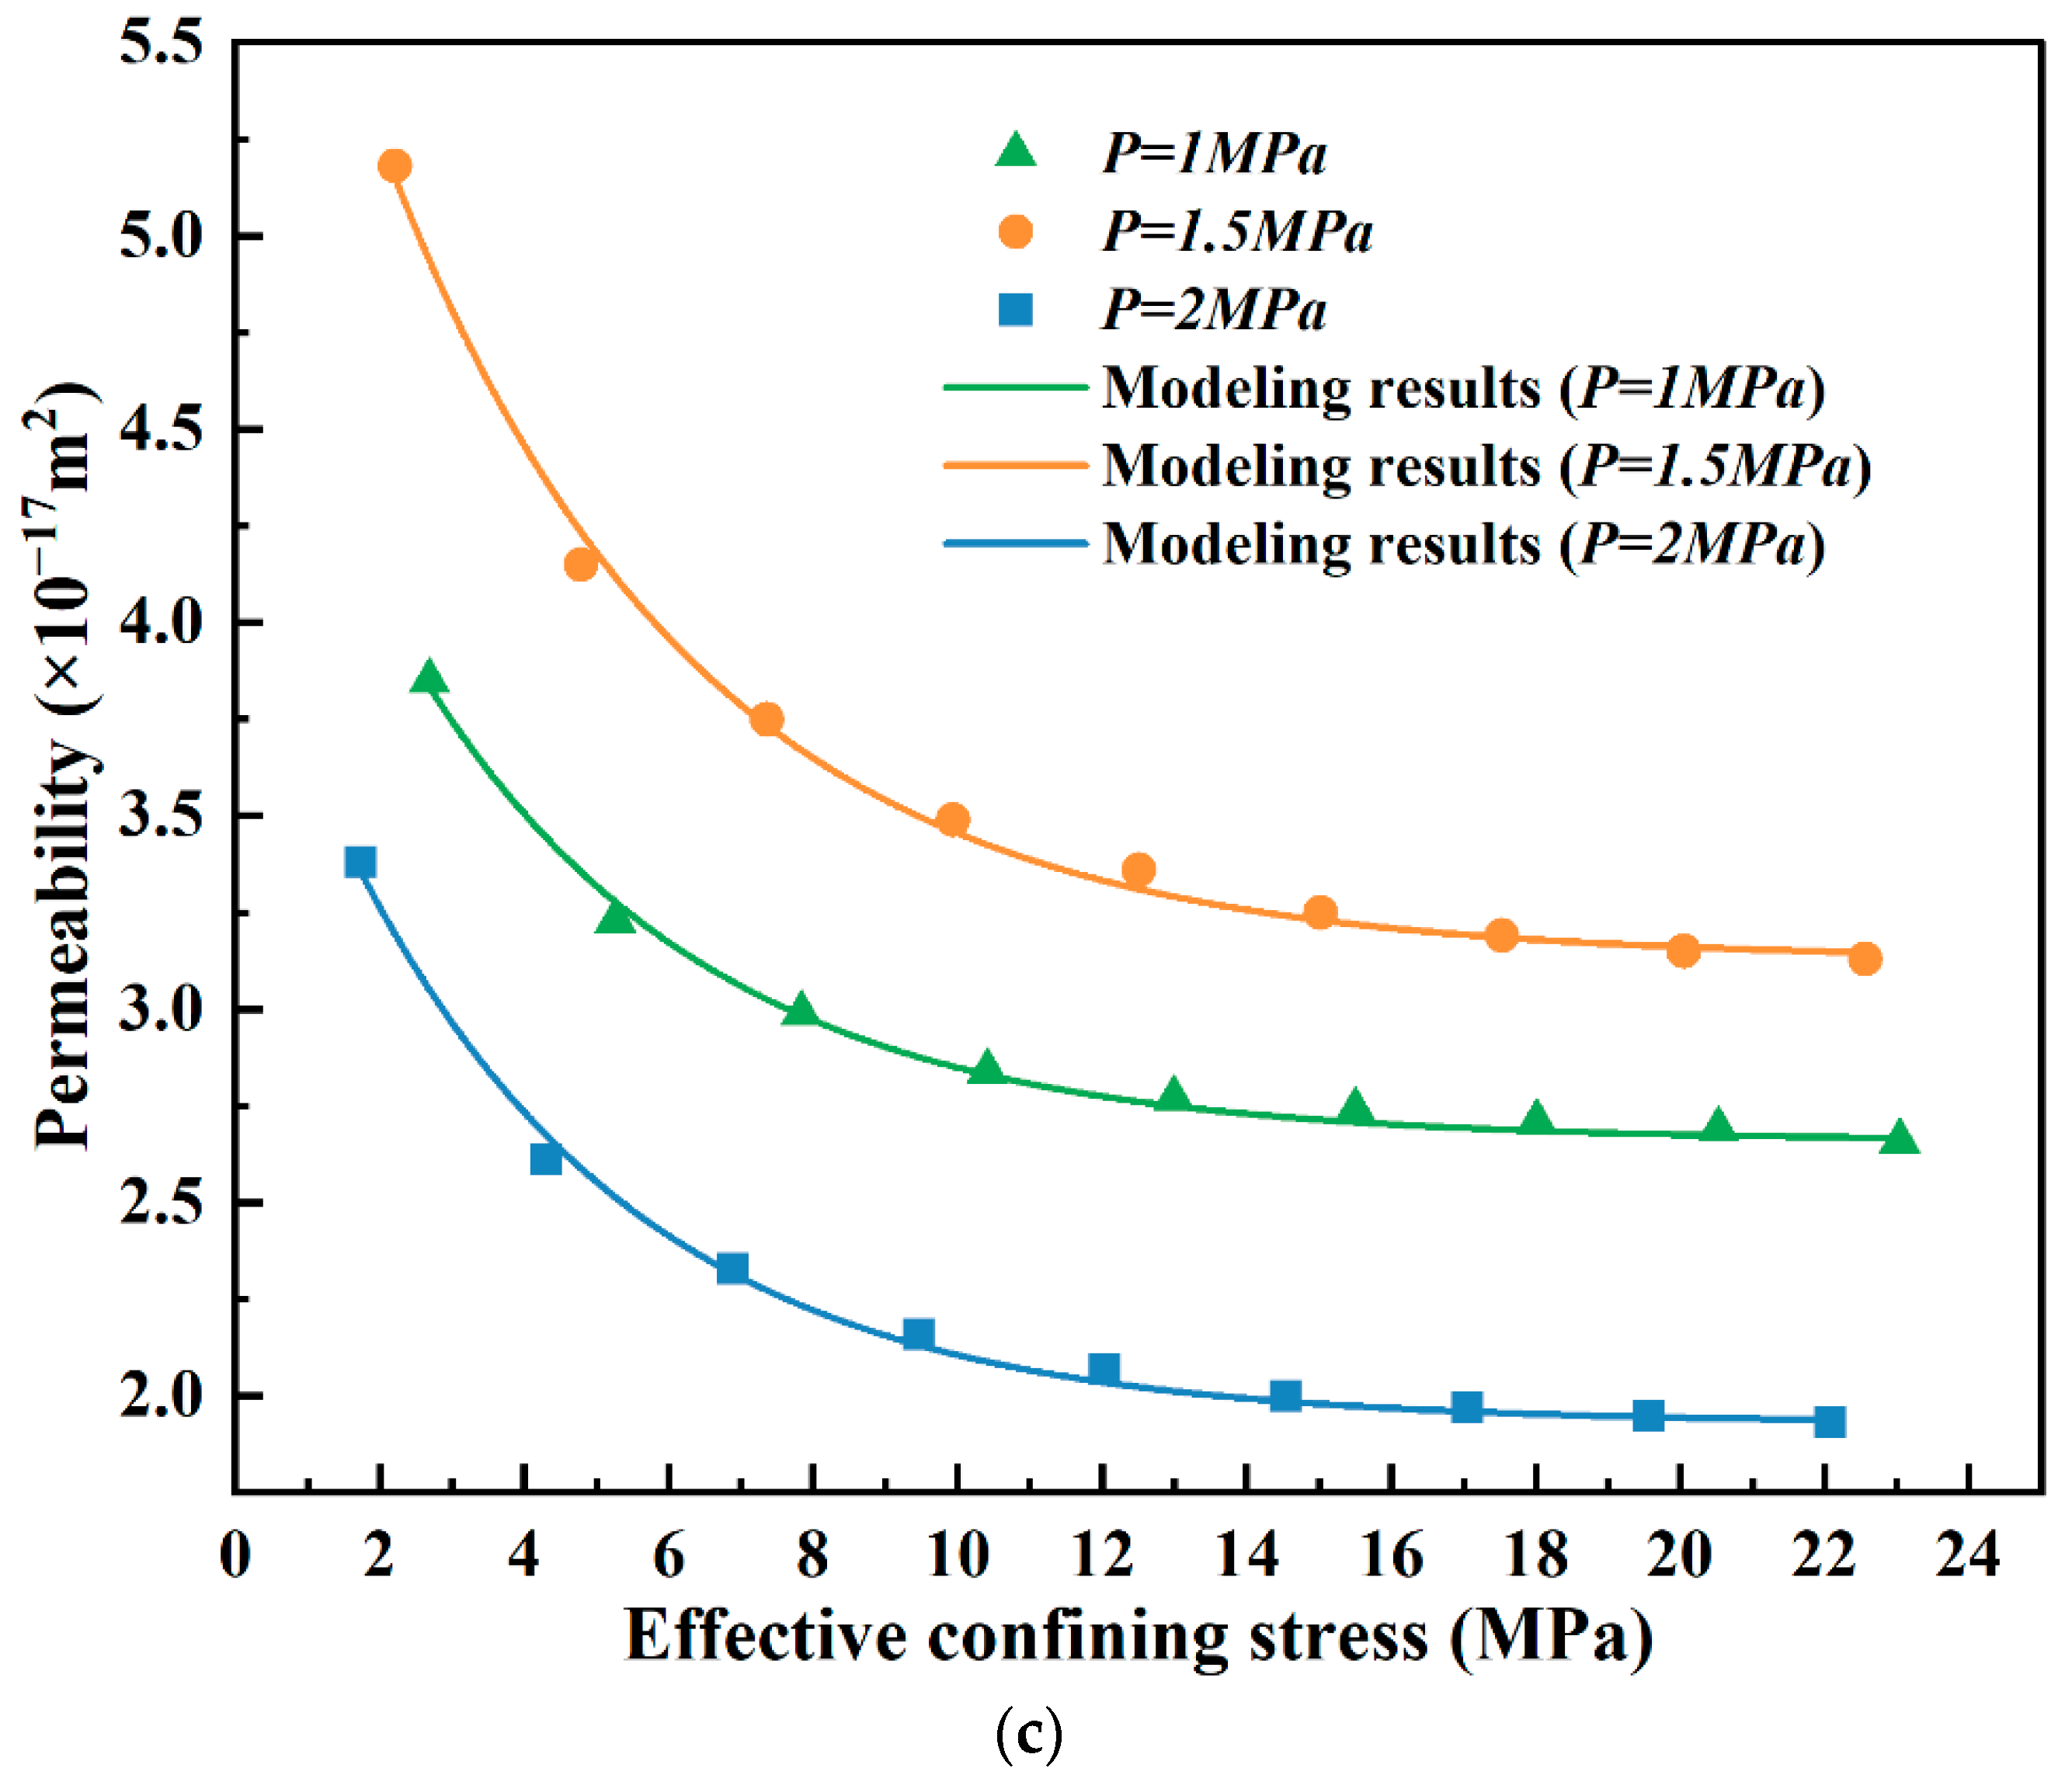
To verify the mentioned permeability fitting model, the theoretical permeabilities acquired using Equation (5) are compared with the testing permeability data for the sandstone in the simulated mining stress path (see Figure 13). In addition, the corresponding fitting parameters used in the model are listed in Table 3. Figure 13 shows that the permeability of sandstone increases slightly with the decrease in effective confining stress in Stage I of mining stress. In Stage II of mining stress, the permeability grows rapidly with the decrease in effective confining stress. It can be clearly obtained from Figure 13 that the analytical permeability results attained from the exponential function fit well with experimental results based on the original experimental permeability data of sandstone, with the R-square value exceeding 0.98, which indicates that the fitting model can fully capture the permeability evolution for sandstone under the mining stress state. Table 3 illustrates that the permeability model coefficient A has a large variation span, varying from 1.8 × 10⁻⁶ to 0.21, while that of B ranges from 0.23 to 1.32. The fitting accuracy increases with increasing in situ stress and pore pressure. Notably, the discovered fitting permeability model is validated with data from sandstone samples under the mining stress state only. Whether this model can be employed on other rocks requires further investigation. Moreover, its physical significance also needs further derivation.
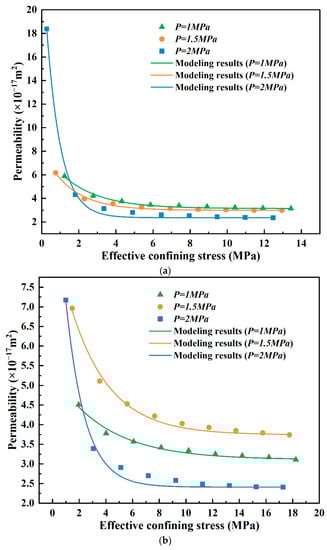
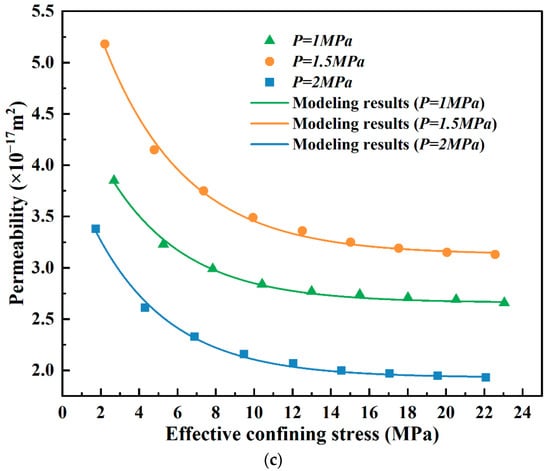
Figure 13.
Permeability of the sandstone samples under different effective confining stresses and pore pressures, and modeling results from the proposed model in this study ((a–c) are the initial confining pressure of 15 MPa, 20 MPa, and 25 MPa, respectively).
Table 3.
Parameters used for data fitting.
4. Conclusions
In this study, a series of mechanical–seepage coupling experiments were conducted, considering the mining stress paths. The response of permeability and mechanical properties was observed. A fitting exponential permeability model was proposed for sandstone. The main conclusions are given as follows:
- (1)
- In the imitated mining stress path, the variation tendency of the axial strain, the radial strain, and the volumetric strain for sandstone show a linear growth trend, an exponential function growth trend, and a transverse “V” symmetrical distribution, respectively. Under the same in situ stress, the mechanical deformation in sandstone is more sensitive to mining stress than to pore pressure.
- (2)
- Most sandstone samples maintain compression state at the peak stress condition due to the mineral composition and pore–fracture structure. The absolute value of both the axial strain and the radial strain at the peak stress state increases with the incremental confining pressure. Under the same in situ stress, the volumetric strain at the peak stress gradually decreases, which is caused by the increased pore pressure. The failure mode of sandstone evolved from shear failure to shear–tension failure with the increase in in situ stress, which corresponds to the transformation from a single shear fracture to form an approximate “X”-shaped conjugate shear fracture or to the main shear fracture followed by a secondary shear–tension fracture.
- (3)
- The sandstone permeability, under the same in situ stress and pore pressure, increases exponentially with the mining stress simulated by axial loading and radial unloading. The permeability under a mining stress state was well-characterized by the stress-relief effect.
Author Contributions
Y.L.: Conceptualization, formal analysis, investigation, data curation, writing—original draft. T.Z.: Conceptualization, writing—review and editing, funding acquisition, supervision. J.W.: writing—original draft, visualization. Z.S.: writing—review and editing, supervision. F.W.: visualization, supervision. The manuscript was written through the contributions of all authors. All authors have read and agreed to the published version of the manuscript.
Funding
This paper was supported by the Institute of Energy, Hefei Comprehensive National Science Center (Grant No. 21KZS216); the National Youth Science Foundation (No. 51904011); the Anhui Provincial Natural Science Foundation (No. 1908085QE183); the Open Fund of State Key Laboratory of Mining Response and Disaster Prevention and Control in Deep Coal Mines (Grant No. SKLMRDPC19ZZ05); and the Collaborative Innovation Project of Colleges and Universities in Anhui Province (Grant No. GXXT-2021-019). The APC was funded by the Institute of Energy, Hefei Comprehensive National Science Center (Grant No. 21KZZ508).
Data Availability Statement
Not applicable.
Conflicts of Interest
The authors declare no conflict of interest.
References
- He, M.C.; Xie, H.P.; Peng, S.P.; Jiang, Y.D. Study on rock mechanics in deep mining engineering. Chin. J. Rock Mech. Eng. 2005, 16, 2803–2813. [Google Scholar]
- Xie, H.P.; Ju, Y.; Gao, F.; Gao, M.; Zhang, R. Groundbreaking Theoretical and Technical Conceptualization of Fluidized Mining of Deep Underground Solid Mineral Resources. Tunn. Undergr. Space Technol. 2017, 67, 68–70. [Google Scholar] [CrossRef]
- Xie, H.P. Research framework and anticipated results of deep rock mechanics and mining theory. Adv. Eng. Sci. 2017, 49, 705–713. [Google Scholar]
- Fairhurst, C.E.; Hudson, J.A. Draft ISRM Suggested Method for the Complete Stress-Strain Curve for Intact Rock in Uniaxial Compression. Int. J. Rock Mech. Min. Sci. 1999, 36, 281–289. [Google Scholar]
- Ghabezloo, S.; Sulem, J.; Guédon, S.; Martineau, F. Effective Stress Law for the Permeability of a Limestone. Int. J. Rock Mech. Min. Sci. 2009, 46, 297–306. [Google Scholar] [CrossRef]
- Ghanbarzadeh, S.; Hesse, M.A.; Prodanovi, M.; Gardner, J.E. Deformation-Assisted Fluid Percolation in Rock Salt. Science 2015, 350, 1069–1072. [Google Scholar] [CrossRef] [PubMed]
- Liu, L.; Xu, W.Y.; Wang, H.L.; Wang, R.B.; Wang, W. Experimental Studies on Hydro-Mechanical Properties of Metamorphic Rock under Hydraulic Pressures. Eur. J. Environ. Civ. Eng. 2016, 20, 45–59. [Google Scholar] [CrossRef]
- Liu, J.; Yang, H.; Xiao, Y.; Zhou, X. Macro-Mesoscopic Fracture and Strength Character of Pre-Cracked Granite Under Stress Relaxation Condition. Rock Mech. 2018, 51, 1401–1412. [Google Scholar] [CrossRef]
- Zhang, T.; Liu, Y.; Yang, K.; Tang, M.; Yu, X.; Yu, F. Hydromechanical Coupling Characteristics of the Fractured Sandstone under Cyclic Loading-Unloading. Geofluids 2020, 10, 1–12. [Google Scholar] [CrossRef]
- Zhu, Z.D.; Zhang, A.J.; Xu, W.Y. Experimental research on complete stress-strain process seepage characteristics of brittle rock. Rock Soil Mech. 2002, 23, 55–559. [Google Scholar]
- Wang, H.L.; Xu, W.Y.; Yang, S.Q. Experimental investigation on permeability evolution law during course of deformation and failure of rock specimen. Rock Soil Mech. 2006, 10, 1703–1708. [Google Scholar]
- Yin, G.; Jiang, C.; Wang, J.G.; Xu, J. Combined Effect of Stress, Pore Pressure and Temperature on Methane Permeability in Anthracite Coal: An Experimental Study. Transp. Porous Media 2013, 100, 1–16. [Google Scholar] [CrossRef]
- Wang, W.; Xu, W.Y.; Wang, R.B.; Cao, Y.J.; Wang, H.L.; Feng, S.R. Permeability of dense rock under triaxial compression. Chin. J. Rock Mech. Eng. 2015, 34, 40–47. [Google Scholar]
- Jiang, Z.Q.; Ji, L.J.; Zuo, R.S.; Cao, L.W. Correlativity among rock permeability and strain, stress under servo-control condition. Chin. J. Rock Mech. Eng. 2002, 10, 1442–1446. [Google Scholar]
- Yu, J.; Li, H.; Chen, X.; Cai, Y.Y.; Wu, N.; Mu, K. Triaxial experimental study of associated permeability-deformation of sandstone under hydro-mechanical coupling. Chin. J. Rock Mech. Eng. 2013, 32, 1203–1213. [Google Scholar]
- Wang, J.-A.; Park, H.D. Fluid Permeability of Sedimentary Rocks in a Complete Stress–Strain Process. Eng. Geol. 2002, 63, 291–300. [Google Scholar] [CrossRef]
- Liu, X.; Xu, M.; Wang, K. Mechanism of Permeability Evolution for Reservoir Sandstone with Different Physical Properties. Geofluids 2018, 2018, 5327895. [Google Scholar] [CrossRef]
- Xiao, W.; Zhang, D.; Wang, X. Experimental Study on Progressive Failure Process and Permeability Characteristics of Red Sandstone under Seepage Pressure. Eng. Geol. 2020, 265, 105406. [Google Scholar] [CrossRef]
- Li, M.; Liu, X. Experimental and Numerical Investigation of the Failure Mechanism and Permeability Evolution of Sandstone Based on Hydro-Mechanical Coupling. J. Nat. Gas Sci. Eng. 2021, 95, 104240. [Google Scholar] [CrossRef]
- Kamel, K.E.M.; Gerard, P.; Colliat, J.-B.; Massart, T.J. Modelling Stress-Induced Permeability Alterations in Sandstones Using CT Scan-Based Representations of the Pore Space Morphology. Int. J. Rock Mech. Min. Sci. 2022, 150, 104998. [Google Scholar] [CrossRef]
- Hu, C.; Jia, Y.; Duan, Z. Pore and Permeability Properties of Reservoir Sandstone under a Uniaxial Compression CT Test. J. Nat. Gas Sci. Eng. 2022, 104, 104666. [Google Scholar] [CrossRef]
- Yang, Y.J.; Song, Y.; Chen, S.J. Test study of coal’s strength and deformation characteristics under triaxial compression. J. China Coal Soc. 2006, 31, 150–153. [Google Scholar]
- Li, X.S.; Yi, G.Z.; Zhao, H.B.; Wang, W.Z.; Jing, X.F. Experimental study of mechanical properties of outburst coal containing gas under triaxial compression. Chin. J. Rock Mech. Eng. 2010, 29, 3350–3358. [Google Scholar]
- Zhang, Z.; Zhang, R.; Xie, H.; Gao, M. The Relationships among Stress, Effective Porosity and Permeability of Coal Considering the Distribution of Natural Fractures: Theoretical and Experimental Analyses. Environ. Earth Sci. 2015, 73, 5997–6007. [Google Scholar] [CrossRef]
- Xie, H.P.; Zhou, H.W.; Liu, J.F.; Gao, F.; Zhang, R.; Xue, D.J.; Zhang, Y. Mining-induced mechanical behavior in coal seams under different mining layouts. J. China Coal Soc. 2011, 36, 1067–1074. [Google Scholar]
- Xie, H.P.; Zhang, Z.T.; Gao, F.; Zhang, R.; Gao, M.Z.; Liu, J.F. Stress-fracture-seepage field behavior of coal under different mining layouts. J. China Coal Soc. 2016, 41, 2405–2417. [Google Scholar]
- Zuo, J.P.; Liu, L.F.; Zhou, H.W.; Huang, Y.M. Deformation failure mechanism and analysis of rock under different mining condition. J. China Coal Soc. 2013, 38, 1319–1324. [Google Scholar]
- Xia, B.W.; Liu, S.W.; Ou, C.N.; Gao, Y.G. Experimental study on mechanical properties of sandstone with single fracture under fully-mechanized top-coal caving mining stress path. Coal Sci. Tech. 2022, 50, 95–105. [Google Scholar]
- Liu, Y.; Zhang, T.; Ma, Y.K.; Song, S.B.; Tang, M.; Li, Y.F. Deformation behavior and damage-induced permeability evolution of sandy mudstone under triaxial stress. Nat. Hazards 2022, 1–21. [Google Scholar] [CrossRef]
- Chen, D.; Pan, Z.; Shi, J.Q.; Si, G.; Ye, Z.; Zhang, J. A novel approach for modelling coal permeability during transition from elastic to post-failure state using a modified logistic growth function. Int. J. Coal Geol. 2016, 163, 132–139. [Google Scholar] [CrossRef]
Publisher’s Note: MDPI stays neutral with regard to jurisdictional claims in published maps and institutional affiliations. |
© 2022 by the authors. Licensee MDPI, Basel, Switzerland. This article is an open access article distributed under the terms and conditions of the Creative Commons Attribution (CC BY) license (https://creativecommons.org/licenses/by/4.0/).