Article

Influences of Clay Mineral and Organic Matter on Nanoscale Pore Structures of the Cretaceous Lacustrine Shales in the Songliao Basin, Northeast China

1
South China Sea Institute of Planning and Environmental Research, State Oceanic Administration, Guangzhou 510300, China
2
State Key Laboratory of Organic Geochemistry, Guangzhou Institute of Geochemistry, CAS, Guangzhou 510640, China
3
The Key Laboratory of Ministry of Education for Beibu Gulf Environment Change and Resources Use, Nanning Normal University, Nanning 530001, China
*
Author to whom correspondence should be addressed.
Energies 2022, 15(19), 7075; https://doi.org/10.3390/en15197075
Submission received: 1 September 2022 / Revised: 17 September 2022 / Accepted: 23 September 2022 / Published: 26 September 2022
(This article belongs to the Special Issue Hydrocarbon Accumulation Process and Mechanism)

Abstract

:
The Cretaceous lacustrine shales of the Qingshankou Formation (K2qn) from the Songliao Basin are recognized as a potential shale oil reservoir in China. Pore structure of shale within the oil window could be significantly influenced by several factors, including mineral and organic matter (OM) compositions. For a better understanding of the factors controlling the pore structure of these shales, 15 core shales from the K2qn were subjected to low-pressure N2 adsorption measurement for both the initial and solvent extracted samples, and the relationships between shale compositions and pore structure parameters were discussed. The results show that the average specific surface area (SSA) and pore volume (PV) increase from 10.14 m2/g to 29.74 m2/g and from 0.0276 cm3/g to 0.0554 cm3/g respectively after extraction, which suggests that the nanopores in these shales could be significantly occupied by the soluble OM, especially for the pores smaller than 10 nm in size. For the extracted samples, the good positive correlations between the SSA and the illite/smectite (I/S) content indicate that a significant amount of small pores are associated with this mineral, while the overall positive correlations between the PVs with the I/S and OM contents suggest that I/S mineral and organic matter (kerogen) have contributed most to pores lager than 10 nm. It is assessed that OM pores contribute approximately 16% to total PV of these shales. Our results will improve the understanding of pore characterization of the clay- and OM-rich lacustrine shales and provide some implications for shale oil accumulation in the Songliao Basin.

1. Introduction

With the depletion of conventional petroleum resources, the exploration targets have recently been extended to the unconventional shale oil and gas reservoirs in China [1,2]. As shale oil and gas are mainly restored in the pores of the shale matrix, there are many recent studies that investigate the pore characteristics of shales in both North America and China [3,4,5,6,7]. The pore networks in shales could be directly observed by scanning electron microscopy (SEM) to define the pore types associated with different shale compositions, and be quantitatively characterized by N2 adsorption experiments to measure the pore structure in nanometer scale [8]. The mercury intrusion porosimetry is questionable in nanopores measurement of shale due to the compression effect at high-pressure stage [9]. Pore type could be classified as interparticle (interP), intraparticle (intraP) mineral pores, and intraP OM pores [3]. The fracture is not considered in this study, and we focus on the matrix-related pore networks of nanometer scale in shale. Pore structure is generally characterized by specific surface area (SSA), pore volume (PV), and pore size distribution (PSD) [6]. Both pore type and pore structure have significant influence on the accumulation of shale oil and gas. For example, the OM pores in the shale reservoirs are generally hydrophobic and have great sorption and storage capacity for oil and gas [10,11,12,13], while the interP mineral pores are largely hydrophilic and both pore water and shale oil are concomitantly stored in this type of pore [14,15,16]. The positive correlation between methane adsorption amount and SSA indicate that small pores are an important control on gas adsorption [17,18], while the positive correlation between residual oil content and pore size and PV indicate that large pores is advantage for the storage and production of shale oil [19,20].
The pore characteristics of shale reservoirs vary significantly in different basins and strata, which is primarily controlled by the mineral and OM compositions for shales within oil window [11,21,22,23,24]. The quartz-rich layers in Barnett Shale contain abundance of intraP pores as hollow central chambers in sponge spicules, which may play an important role for the storage of hydrocarbons [14,25,26]. The carbonate-rich layers in the Shahejie shale contain abundance of interP pores and dissolution pores associated with carbonate minerals, which is an important storage space for petroleum [19,27]. The pores in clay-rich layers of Silurian Shale from Eastern Europe [11,28] and Triassic Yanchang shale from China [29,30] are controlled by both the clay mineral and OM compositions. Because the Qingshankou shales in the Songliao Basin are mainly clay-and OM- rich mudstone [20], we focus on the influences of clay mineral and OM on the pore structure of shales.
SEM observations reveal the presence of porous floccules associated with clay minerals in both the Barnett and Woodford shale [25]. The positive correlation between clay mineral content and PV of N2 adsorption for the Yanchang shale is primarily related to the present of porous illite/smectite (I/S) mineral [30]. N2 adsorption investigation of both natural shales and pure clay minerals indicate that the I/S mineral contains a characteristic and incompressible 3 nm pore size and form the fundamental textural controlling clay-rich shale pores [28]. OM in shale could be divided into two parts, as kerogen (or solid bitumen) and soluble OM (or residual oil). The pores within kerogen or solid bitumen (OM pores) are mostly formed during thermal maturation and OM transformation [24] and regarded as the primarily storage space for the shale gas reservoirs [31,32,33]. Although OM pore is not the major pore type of shales within the oil window, SEM observations reveal that various types of OM pore occur due to the liquid hydrocarbon generation and expulsion [34]. Both SEM observations and comparison of N2 adsorption pore changes before and after solid OM removal indicate that nonporous solid bitumen in shale of low maturity could infill pores related to the minerals [11,29,35]. The residual oil could also occupy and block the pores in low mature or mature shales then dramatically influence the pore structure, which is indicated by the significantly increase of pores after solvent extraction [24,36]. Plentiful liquid hydrocarbon generation of OM-rich shale within the oil window could result in high fluid pressure in pore and protect pore from compaction during evolution [29]. However, there is still no agreement on the effect of OM infilling on pore size distribution of shale likely due to the significantly variation of pore structure related the different mineral and OM compositions of shales from different basins.
OM-rich Shales in Qingshankou Formation (K2qn) are the major source rocks in the Songliao Basin [37,38,39], and they have also been recognized as potential shale oil reservoirs in recent years [40,41]. There are numbers of studies to investigate the pore characteristics and controlling factors of these shales. For examples, the SEM observations show that most pore types developed in marine shales are present in the K2qn shales [42], but the mineral related pores are more developed than the OM pores [43]. Both N2 adsorption and mercury intrusion experiments indicate that the mesopores (2~50 nm) contribute the most part of PV and there are poor correlations between the pore structure parameters and the shale compositions [20,44]. The hydrous pyrolysis samples of the K2qn shale show a significant increase of PV and SSA of micropores (<2 nm) after extraction, suggesting that liquid hydrocarbons are mainly stored in micropores [36]. However, this conclusion is controversy with the good linear correlation between the shale oil content and the pore size, which suggested that shale oil mainly exists in macropores (>50 nm) [20,45]. Therefore, the relationships between pore structure parameters and shale compositions are still unclear in terms of the influence of residual oil, and the extent to which the clay mineral and OM compositions influence the pore structures of these lacustrine K2qn shales. In this study, 15 core samples of K2qn shales from six boreholes in the central depression of the Songliao Basin were subjected to geochemical analysis and pore structure characterization before and after solvent extraction, aiming to discuss the relationships between shale compositions and pore structure parameters, and assess the influence of clay mineral and OM on the pore structure. The results will improve our understanding of pore networks of these lacustrine shale and assessment of shale oil occurrence in the Songliao Basin.

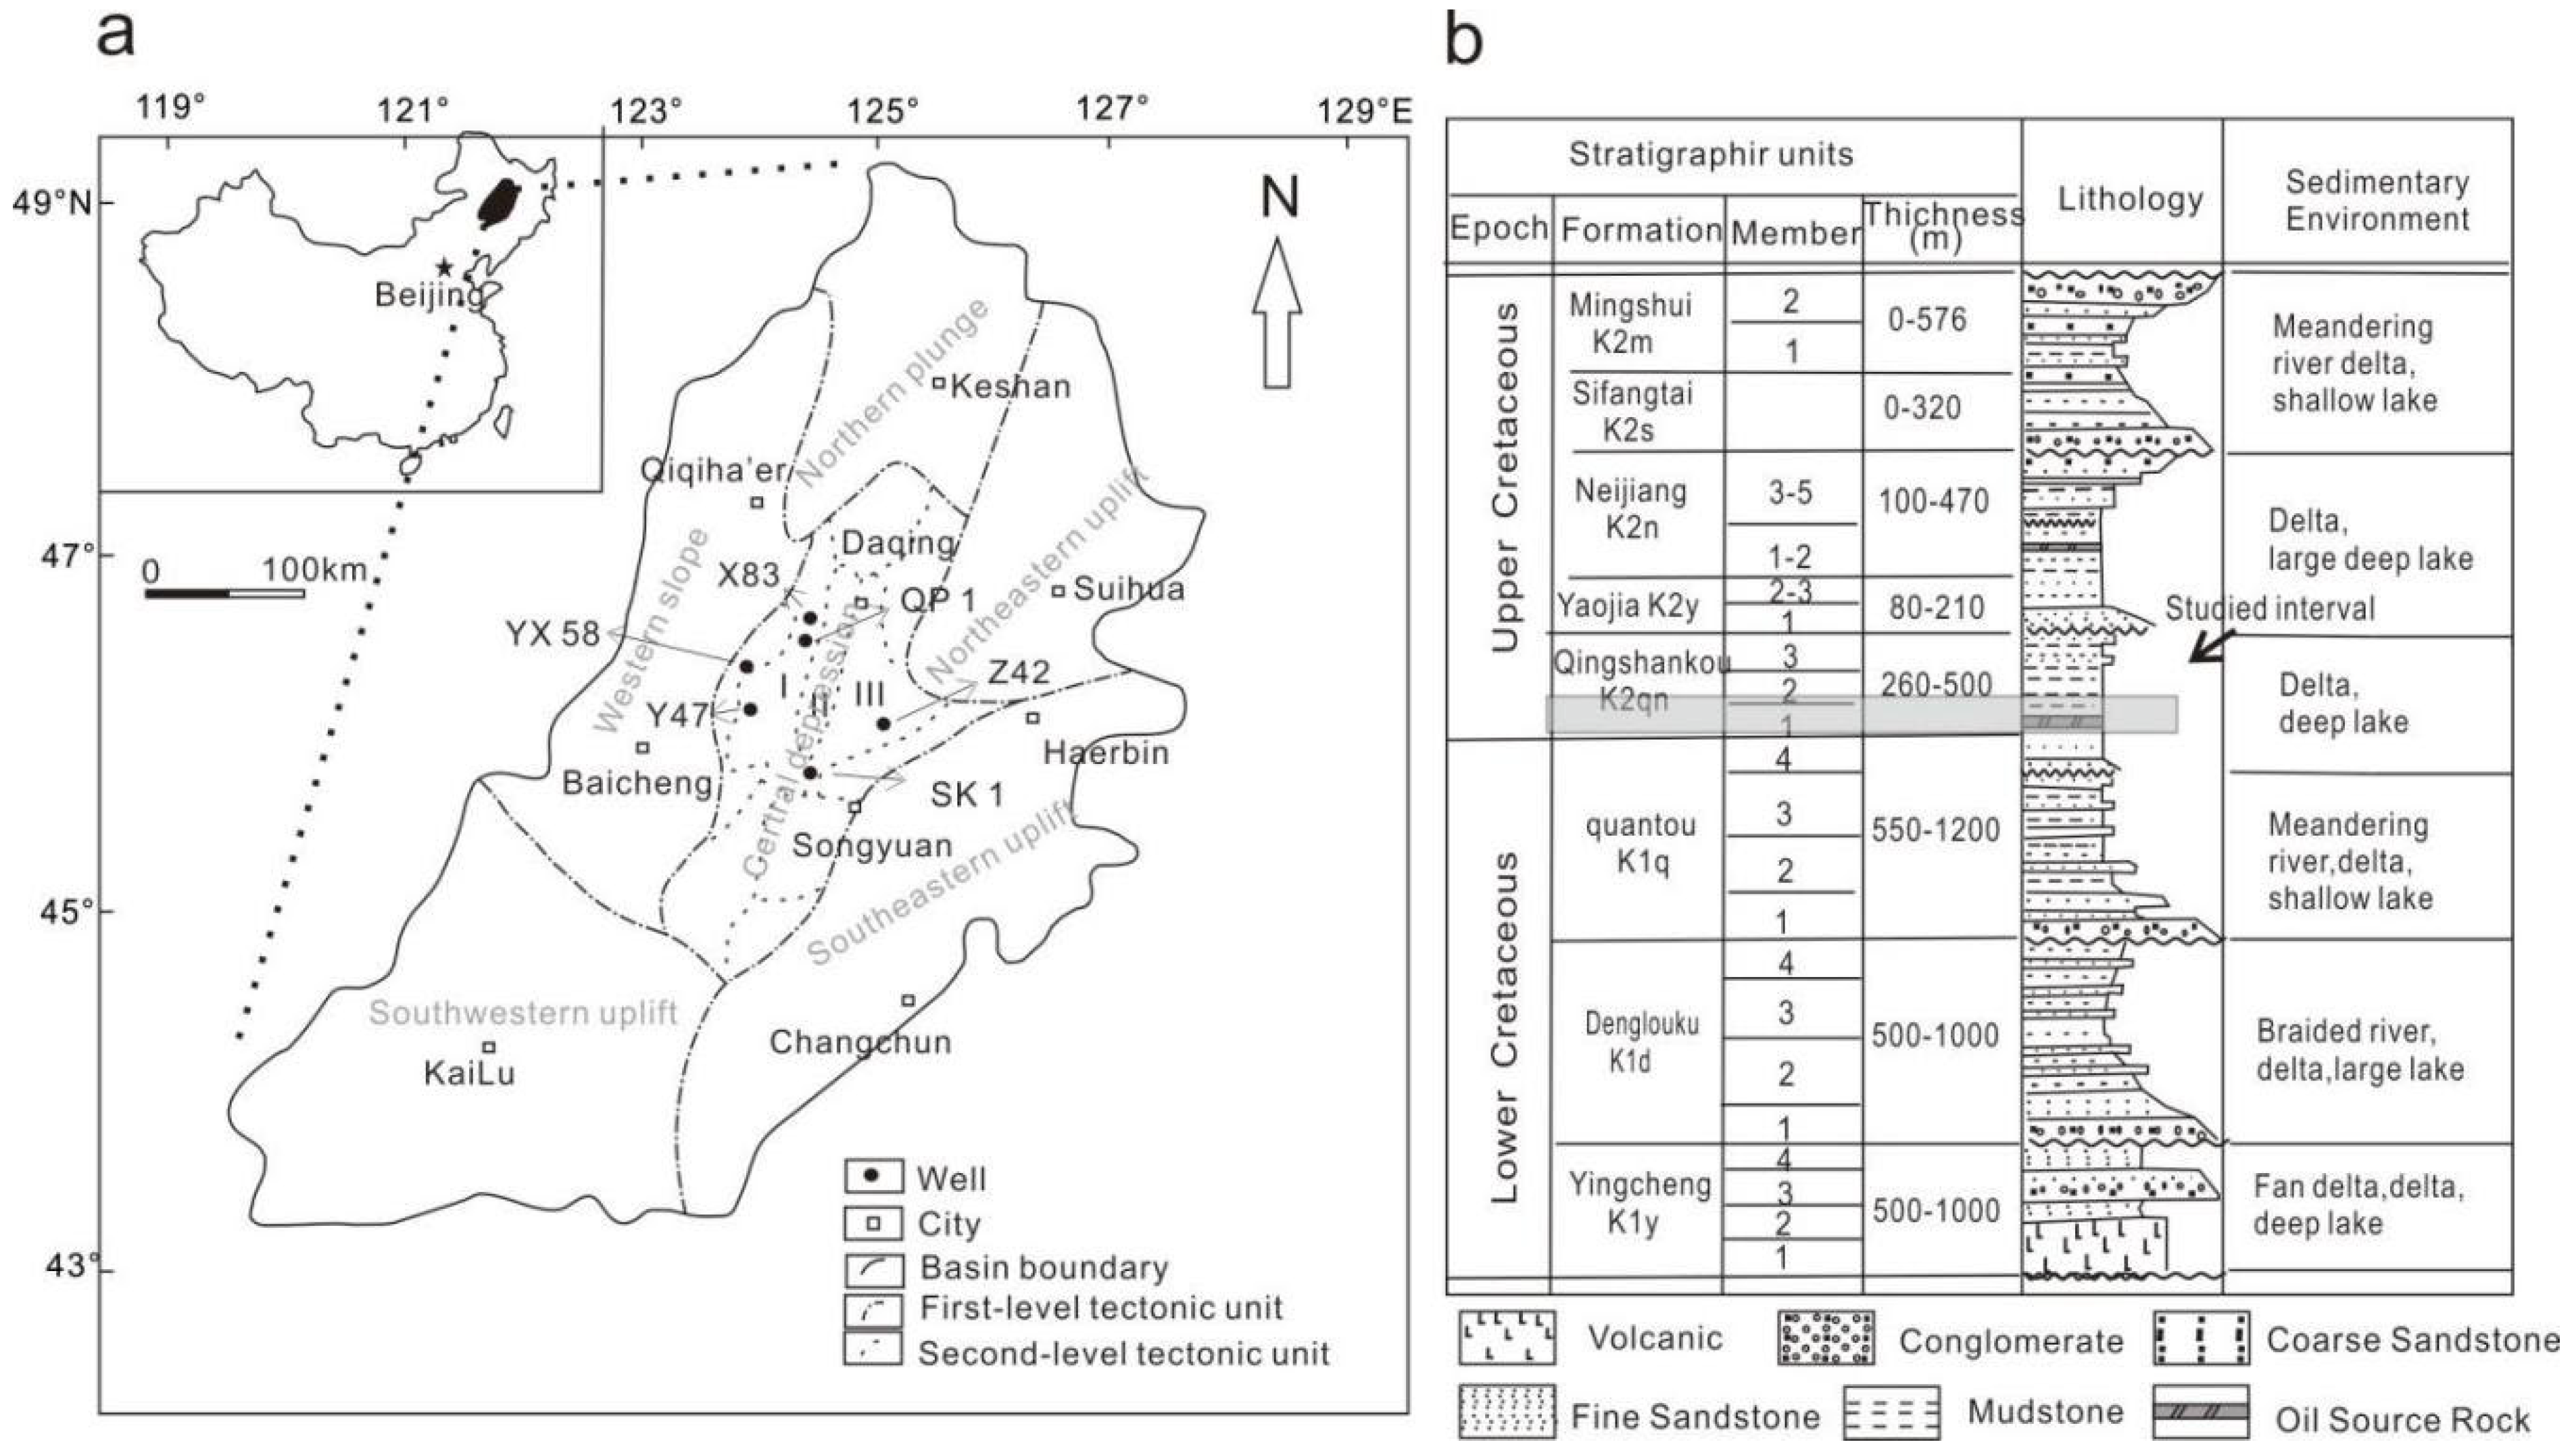
2. Geologic Background

Songliao Basin is the largest Mesozoic-Cenozoic oil and gas producing basin in northeast China. The basin is generally divided into six structural units based on its regional basement and sedimentary strata (Figure 1a) [46]. The central depression region contains Jurassic to Neogene terrigenous sedimentary rocks about 10 km thick (Figure 1b). It is a typical composite basin type with several fault-block basins on the lower part and a depression basin on the upper part. During the depression period, the environment was characterized by a large lake in the basin center rimmed by delta, fluvial and floodplain. The K2qn was developed during the depression period in the Late Cretaceous, and consists of deep and semi-deep lake facies of thick mudstones and laminated shales, which is widely distributed in the central depression and the southeastern uplift zones [38,47]. The K2qn shales contain high abundance OM of type I, which were primarily derived from algal-microbial mats, due to high primary productivity and favorable preservation conditions [39], and influenced by periodic marine incursion events [48]. The Ro values of K2qn shales are between 0.8% and 1.3% in the central depression zone, which is mainly within the oil window [37].

3. Samples and Experiments

15 core samples were collected from six boreholes located in the Qijia-Gulong and Sanzhao Sags of the central depression (Figure 1a). These K2qn samples are primarily laminated black shales, and be considered from the same clay-rich shale facies from the low part of K2qn. Analyzing the shale samples from similar sedimentary facies but from different locations will also enable us to study the relationship between shale compositions and pore structure parameters with the limited influence of lithofacies. The sampling burial depth information is given in Table 1.
For TOC content, mineral composition and pyrolysis analyses, the shale sample was crushed to 100 mesh (<0.15 mm), and then dried at 80 °C for 24 h under vacuum condition to remove any moisture The TOC content was determined by a Carbon and Sulfur analyzer (CS-230) manufactured by Leco Corporation in the America [49]. The mineral composition was measured using an X-ray diffractometer (Innova-X BTX-II) manufactured by Olympus Corporation in the America [50]. The pyrolysis experiment was performed on Rock-Eval 6 developed by Vinci Technologies in France [20].
The pore morphology and type observation was performed on a FE-SEM instrument (S-4800) for number of typical samples. Before measurement, the sample chip was polished by argon ion beam using a Hitachi Ion Milling System (IM4000) with an acceleration voltage of 3 kV [6]. After that, the polished sample chip was scanned using FE-SEM instrument to obtain the pore topographic variation by secondary electron image and shale compositional variation by backscattered electron image. A low accelerating voltage (1.5 kV) was used to prevent beam damage for the sample without conductive coatings on the polished surface, and the working distance was set as 2 to 6 mm.
Low-pressure N2 adsorption measurement was conducted on Micromeritics ASAP-2460 apparatus. Before analysis, about 3~4 g powdered sample (60–100 mesh) was dried at 110 °C for 12 h under high vacuum to remove any moisture and residual volatiles. This adsorption analysis was conducted for both the initial and solvent extracted samples. The extracted sample was obtained from Soxhlet extraction for 72 h using a 9:1 v/v mixture of dichloromethane and methanol, and the soluble OM is defined as bitumen [51]. The N2 adsorption was carried out under the temperature of liquid nitrogen (−196 °C) and relative equilibrium pressure P/P0 ranges from 0.005 to 1. The SSA was calculated using the Brunauer-Emmette-Teller (BET) method at a relative pressure of 0.05~0.25, and the PV and PSD were obtained using the Barrette-Joynere-Halenda (BJH) method [52].

4. Results

4.1. Geochemical Characterization

The pyrolysis parameter, and content of TOC and soluble OM (SOM) of the 15 shales are listed in Table 1. The TOC content is between 0.94% and 3.84%, with the lowest in sample QP-1 and the highest in sample YX58-10. The hydrogen index (HI) and peak pyrolysis temperature (Tmax) parameter range from 190 to 593 mg/g and 437 to 449 °C respectively, except the sample Y47-2, indicating a type I OM within the oil window. The lower HI of samples from Core Y47 is due to the further thermal degradation of OM at higher maturity of the larger buried depth. The lowest Tmax value of sample Y47-2 (420 °C) seems to contradict with largest buried depth and maturity. This is likely caused by a part of free hydrocarbon (S1) being carried over into pyrolysis hydrocarbon (S2) by OM adsorption, resulting in an unreliable Tmax value for maturity assessment [14]. The SOM content displays a good linear correlation with the S1 parameter (Figure 2), indicating that residual oil was effectively removed by Soxhlet extraction for the 15 shale samples.

4.2. Mineral Composition

The mineral compositions of the K2qn shales are listed in Table 2. Illite/smectite (I/S) clay mineral is the major mineral component and is between 31.9 wt% and 50.8 wt%, with an average content of 41.6 wt%. Quartz and feldspar are the other two important minerals with contents varying from 15.3 to 24.4 wt% and 16.5 to 30.7 wt%, respectively. The chlorite and carbonate minerals range from 0 to 14.2 wt% and 0 to 9.9 wt%, respectively. Pyrite present in most shales with content less than 2.0 wt%. These K2qn samples are thus clay-rich argillaceous shales, which is similar to the shales from the Kimmeridge Clay Formation in England with an average clay content about 53% [53], but significantly different with the calcareous shale from the Eagle Ford Formation in America with an average calcite content about 47.7% [5].

4.3. Pore Type

The pore types in the K2qn shales are modified from the pore classification suggested the previous study [3]. The FE-SEM images of typical samples in Figure 3 show that there is two major types of matrix-related pores in these shales, as I/S mineral associated pores (I/S pores) and OM associated pores (OM pores). The I/S pores include the interP and intraP pores between and within this mineral, which appear to be linear and triangular in shape, and their size vary from nanoscale to microscale (Figure 3a–c). These I/S pores form the fundamental texture of pore networks and were mostly infilled with OM. The OM pores are heterogeneity and vary significantly in terms of shape, distribution and development. These OM pores appear to be isolated rounded shape in the center of the OM particle and shrinkage pores in the boundary of the OM with size larger than 100 nm (Figure 3d), or be homogenized distribution within the whole OM particle with size smaller than 50 nm (Figure 3e), or sponge-like pores within certain parts of the OM particle with size smaller than 50 nm (Figure 3f).

4.4. Pore Structure before and after Extraction

The N2 sorption and desorption isotherms of the typical shales are presented in Figure 4. Both the initial and extracted samples show similar isotherm types. The isotherm type could be defined as a composite of types I(b), II, and IV(a) [54], indicating a large range of PSD. The type I(b) isothern at a relative low-pressure stage (P/P0 < 0.01) is due to the micropore filling of the microporous solids. The type II isothern is the result of unrestricted monolayer-multilayer adsorption up to high-pressure stage (P/P0 > 0.95) and indicates the presence of macropores. The type IV(a) isothern is accompanied by hysteresis due to the capillary condensation and indicates the presence of mesopores. The hysteresis loops of the isotherms could be classified as type H3 [55,56], indicating a slit-shaped pores associated with the I/S mineral (Figure 3a–c). Compared with the initial samples, the extracted samples show larger sorption amount at both low pressure stage and high-pressure stage, indicating a large increase of SSA and PV after solvent extraction.
The PSD between 1.7 and 270 nm calculated using the BJH method of typical shales are presented in Figure 5. The plots of dV/dlog (D) versus pore diameter show significant difference of PSD between the initial and extracted samples. Overall, the extracted sample show a larger PV in any size ranges than that of the initial samples. The PSD of these shales could be divided into two pore size ranges, as the small pores (<10 nm) and large pores (>10 nm). The initial samples show unimodal PSD with a prominent volume come from large pores. The extracted samples show bimodal PSD with a significant volume come from small pores. The PSD shapes of the small pores for all the extracted samples are basically the same, with a pore-size maxima at 3 nm. The increase of the small pores is the most obvious changes of the PSDs between the initial and extracted samples for the 15 shales.
The pore structure parameters determined by the N2 sorption curves data are tabulated in Table 3. Both PV and SSA increase significantly after solvent extraction, but the average pore diameter (APD) reduces for most shale samples. The SSA of the initial and extracted samples range from 3.49 to 20.86 m2/g (average 10.14 m2/g) and 8.37 to 57.96 m2/g (average 29.74 m2/g), respectively. The PV of the initial and extracted samples range from 0.0142 to 0.0373 cm3/g (average 0.0276 cm3/g) and 0.0245 to 0.1147 cm3/g (average 0.0554 cm3/g), respectively. The APD of the initial and extracted samples range from 6.26 to 21.95 nm (average 11.37 nm) and 5.69 to 10.27 nm (average 7.89 nm), respectively. The APD shows clear negative correlations with SSA for both the initial and extracted samples (Figure 6a), but poor correlations with the PV (Figure 6b), indicating that the SSA mainly comes from the small pores, and total PV comes from both the large pores and the small pores.

5. Discussion

There is no clear correlation between the pore structure parameters and maturity (indicated by the HI or burial depth), likely due to the small range of maturity within the oil window. As the 15 K2qn shales are all belong to the same shale facies, we inferred that the mineralogy and OM composition (bitumen and kerogen) must play a dominated role in the development of the pore structure of the K2qn shales. Therefore, the relationships between shale compositions and pore structures were discussed below in detail. Considering self-correlation between the pore structure parameters themselves, only the SSA and PV were selected to the correlation analysis.

5.1. Relationships between Mineralogy and Pore Structure

There are no clear correlations between pore structure parameters and mineral contents for the initial samples, but clear correlations appeared for the extracted samples (Figure 7). The different correlations indicate that the bitumen retained in the shale pores could obscure the relationship between mineralogy and pore structure; therefore, the extracted samples should be used to the study of the influence of mineral on the pore structure for the lacustrine shales within the oil window.
The I/S mineral contents show clear positive linear correlations with both the SSA and PV (Figure 7a,b), indicating that this clay mineral is one of the key controlling factors in pore structure of the K2qn shales. The I/S mineral contents show a better correlation with SSA (R2 of 0.8711) than that with PV (R2 of 0.5625), suggesting that the surface area or small pores of the K2qn shales are primarily associated with the I/S mineral. As shown in Figure 5, the PSDs of a pore-size maxima at 3 nm occurred in all the extracted samples, likely due to the present of the I/S mineral [28], and could be considered as a characteristic PSD of I/S pores. The small I/S pores could not be observed by the SEM method directly, but some large I/S pores are revealed by the SEM observation (Figure 3a–c).
Comparing the PSDs of the initial and extracted samples in Figure 5, the significant change is the almost disappearance of small pores (<10 nm) of all the initial samples, likely due to that the liquid hydrocarbons generated from the kerogen in shale preferred to charge into the surrounding small pores [36], or the residual oil was more likely to be retained in the small pores due to surface area sorption [57] and the interaction between I/S mineral and OM [58]. Although both pore water and retained oil could be concomitantly stored in these small mineral pores [16], the low volume of small pores of initial samples in Figure 5 indicate that the pore water is not the major part of liquid stored in these pores, since the pore water was removed from the preparation of N2 adsorption. However, there is a question about whether the bitumen or SOM could infill the I/S pores around the 3 nm in size. In fact, most aliphatic hydrocarbons have molecular size smaller than 1 nm [59], which is the primarily composition of the SOM of the K2qn shales [60]. Therefore, in terms of molecular size of liquid hydrocarbons, parts of SOM could infill the pores around the 3 nm in size. Until now, there has been no direct evidence of proving the minimum pore size for liquid hydrocarbons infilling in shale pores and whether was more likely to be retained in the small I/S pores after expelled from kerogen, and the molecular dynamic simulation could be conducted to investigate this question in further study.
The total contents of quartz and feldspar display loose negative correlations with both the SSA and PV (Figure 7c,d), indicating that these mineral are disadvantage for the development of nanopores in the K2qn shales. These mineral grains are usually in microscale in rounded or sub-rounded shape and surrounded by the clay mineral and OM (Figure 3), which are mainly derived from riverine input [61]. Because the terrigenous minerals do not contain any pores as the biogenic quartz (sponge spicules) in Barnett Shale [14], these nonporous minerals could offset the content of porous I/S mineral and lower the nanopores abundance in the K2qn shales. Some interP pores in microscale between these minerals occurred occasionally, which is beyond the pore size range of N2 adsorption measurement. The carbonates and chlorite show no clear relationships with the pore structure, due to their low contents and minor influence on the shale pores.

5.2. Relationships between OM Composition and Pore Structure

For the initial samples, the correlations between SOM content and pore structure parameter could be used to assess the influence of retained oil on the shale pores [33]. The SOM content shows a clear negative correlation with the SSA (Figure 8a), with a significant reduction at the low content (<6 mg/g), also indicating that hydrocarbons generated in shale preferred to charge into or retain in the small pores as discussed above. The poor correlation between the SOM and PV (Figure 8b) could be related to two reasons. Firstly, some large pores were incompletely infilled with generated oil or the residual oil after hydrocarbon expulsion and evaporation during the sampling and analysis process. Secondly, some large pores beyond the pore size range of N2 adsorption measurement could contain part of SOM.
For the extracted samples, the correlations between SOM content and pore structure parameter could be used to assess the influence of pore structure on shale oil storage. The SOM content shows a better positive correlation with PV than that with SSA (Figure 8a,b), except for sample YX58-10, indicating that large pores and PV is an important factor for controlling shale oil accumulation, which is significantly different from the shale gas accumulation [17]. Although the SOM could prefer to charge into or be retained in the small pores, as discussed above, part of liquid hydrocarbon (movable oil) could be stored in the large pores when the oil content is high as the SOM content exceed 6 mg/g. This conclusion is consistent with previous studies of the shale oil reservoirs from the Shahejie Formation, where petroleum mobility initiated when the petroleum content reaches 7 mg/g and the pore diameter is over 12.1 nm [62]. The exception of sample YX58-10 is likely due to some large pores (microscale) beyond the N2 adsorption measurement also possibly containing residual oil, which has been observed by the SEM for the lacustrine shales within the oil window [19,34].
The TOC include organic carbon from the SOM, solid bitumen, and kerogen [63]; different compositions have different influence on the pore structure of the shales. The negative correlation between TOC content and SSA of the initial samples (Figure 8c) is due to the SOM infilling the small pores mentioned above. The poor correlation between TOC content and SSA of the extracted samples indicates that the solid bitumen or kerogen have little contribution to the surface area, which is significantly different from the pyrobitumen in shale gas reservoirs that contained an abundance of sponge-like nanopores [35,64]. However, the TOC content shows an overall positive correlation with the PV, except of sample QP-2 (Figure 8d), indicating the solid bitumen or kerogen contain numbers of large pores, which is also observed by the SEM (Figure 3d–f). These OM pores are likely related to the liquid hydrocarbon generation and expulsion [34]. We cannot distinguish the solid bitumen from the residual kerogen just from the SEM method, which may have different patterns of OM development [34], and need further study by the in-situ microscopy method, such as the combination using of X-ray microscopy and SEM technology [35]. The exception of sample QP-2 is likely due to the highest I/S mineral content and abundance of I/S pores (Figure 5).

5.3. Quantification of Relative OM Hosted Pore Volume

Both the SEM observation and relationships between the pore structure parameters and shale compositions indicate that the nanoscale pores in the K2qn shales are primarily associated with the I/S mineral and OM compositions, while other framework minerals (mainly quartz and feldspar) show negative contribution to the development of shale pores. Based on the different contributions of the three shale compositions to total PV, a multiple linear regression model of shale PV was modified from the previous study [65] and expressed as:
PV tot = W I / S × V I / S + W FM × V FM + W TOC 0.86 × V TOM
where PVtot is the total pore volume of the extracted sample. WI/S and VI/S are the mass fraction and specific pore volume of I/S mineral, respectively. WFM and VFM are the mass fraction and specific pore volume of framework mineral, respectively. WTOC is the TOC content and VTOM is specific pore volume of OM. Factor of 0.86 is used to convert TOC to TOM content based on a molecular formula (C208H168N4O10) of type I OM within the oil window [66].
The fitted VI/S, VTOM and VFM of the 15 samples are 0.26 cm3/g, 0.88 cm3/g and −0.12 cm3/g respectively. The predicted PVs agree well with the measured PVs (Figure 9a), which confirms the feasibility of this method. The fitted specific PV values of shale compositions are also consistent with the correlation analysis conclusions mentioned above. According to the fitting results, the contribution of OM pores to the total PV of the 15 K2qn shales was assessed, which ranges from 6% to 23% and averaged at 16% (Figure 9b). The poor development of OM pore in the samples QP-1 and YX58-4 is likely due to the low TOC content. Overall, this value of the K2qn shales is relatively lower than that of the marine shales, such as Longmaxi shale (averaged at 37%) and the New Albany shale (averaged at 46%), which are the two important shale gas reservoirs in China and America [65]. This result is consistent with the previous conclusion that the marine shales contain more OM pores than that in lacustrine shales [65], primarily due to the higher maturity of marine shales for the development of OM pores in nanoscale [33]. Nevertheless, the large OM pores in the K2qn shales are likely be an important storage space of liquid hydrocarbon, which should pay more attention in the exploration and development of shale oil in the Songliao Basin.

6. Conclusions

The pore structures of lacustrine shales of the Qingshankou Formation in the Songliao Basin has been investigated for both the initial and solvent extracted samples. The following conclusions have been achieved:
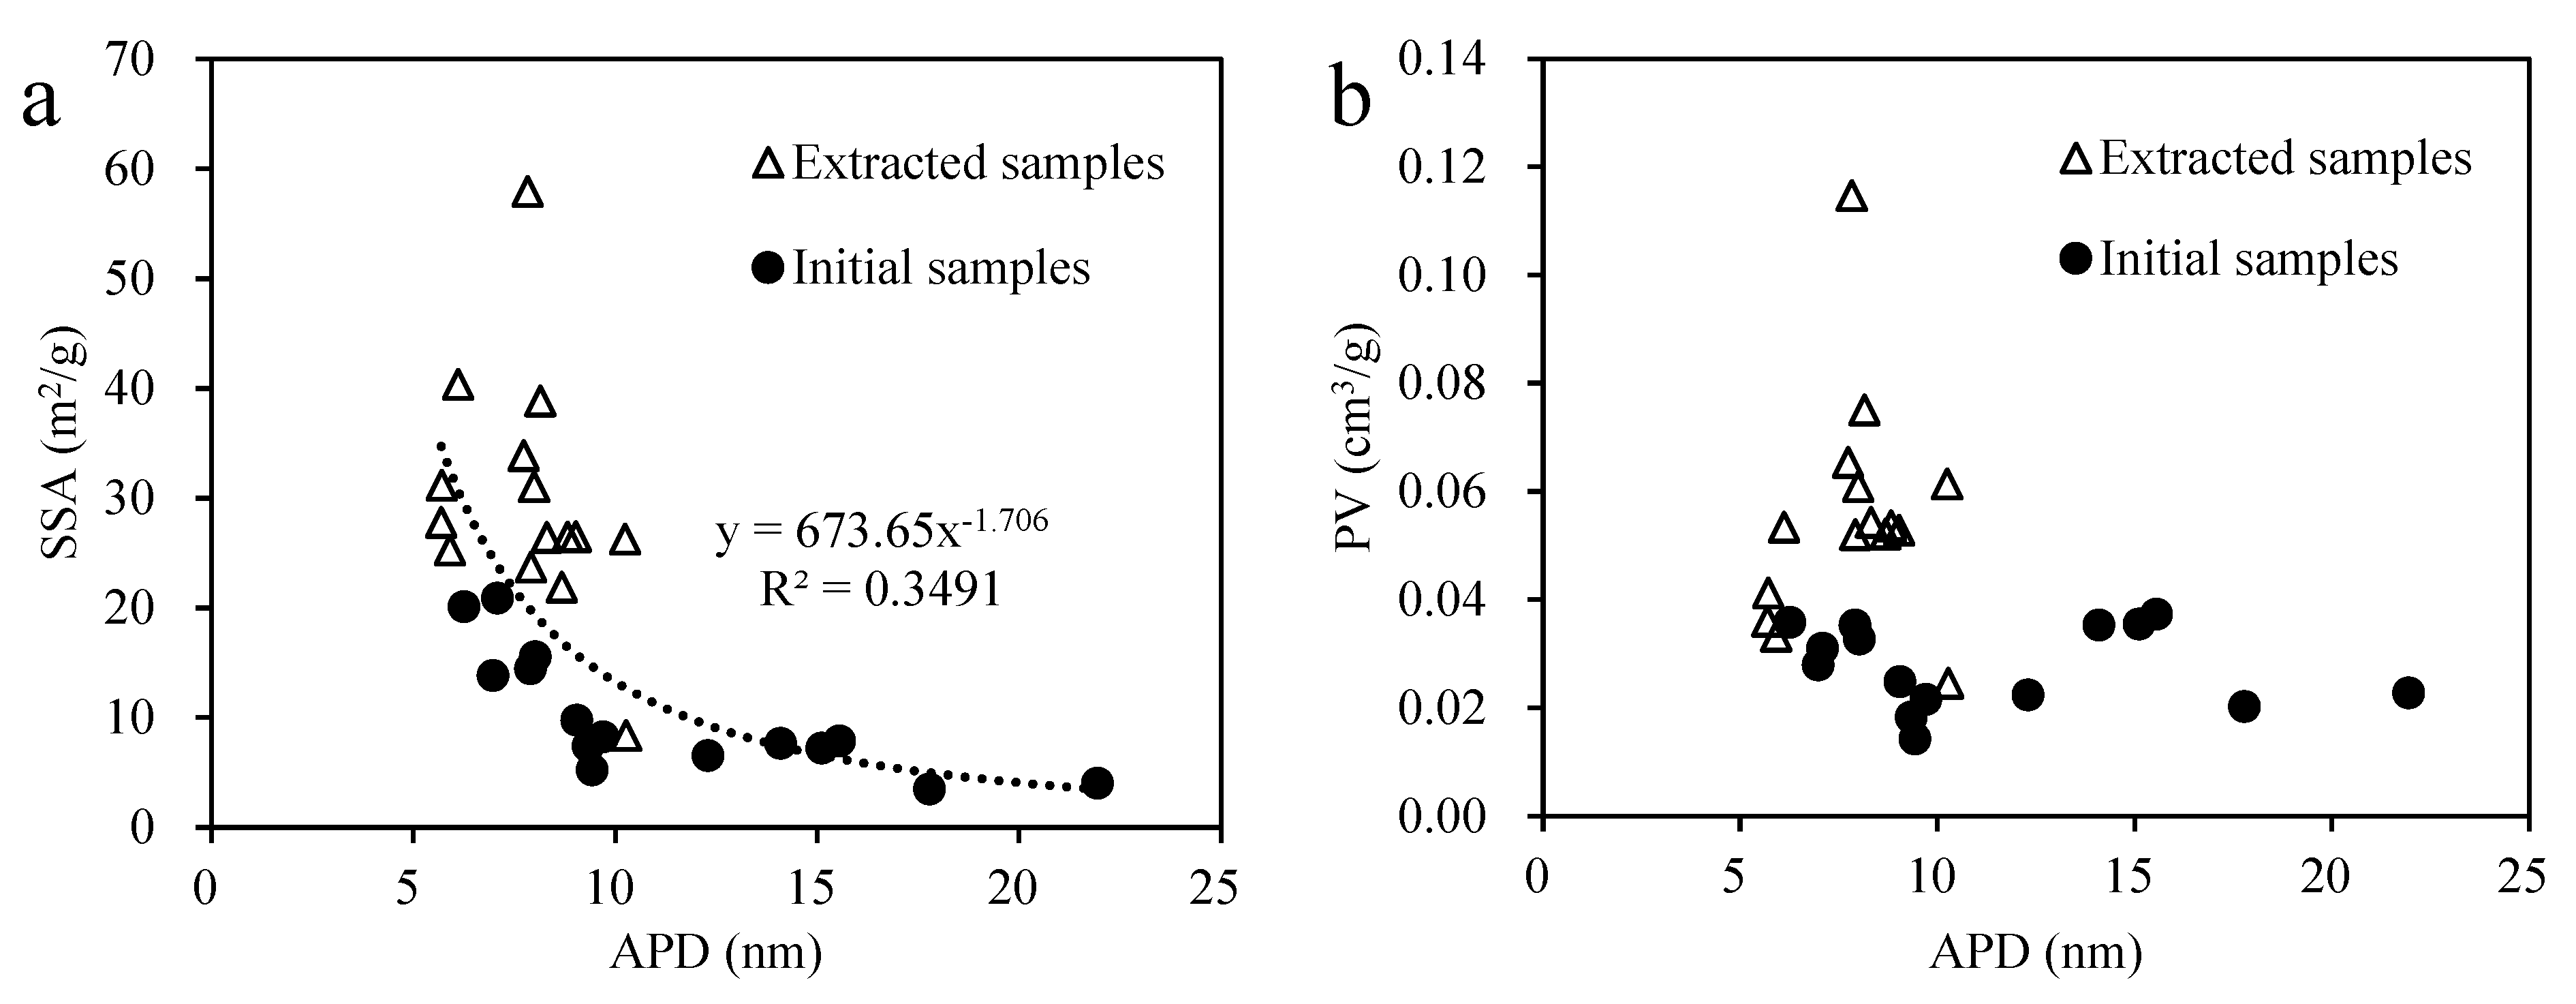
  • After solvent extraction, the average SSA and PV of the 15 K2qn shales increase from 10.14 m2/g to 29.74 m2/g and from 0.0276 cm3/g to 0.0554 cm3/g respectively, indicating that the SOM could significantly occupy the nanopores and obscure the relationship between mineralogy and pore structure.
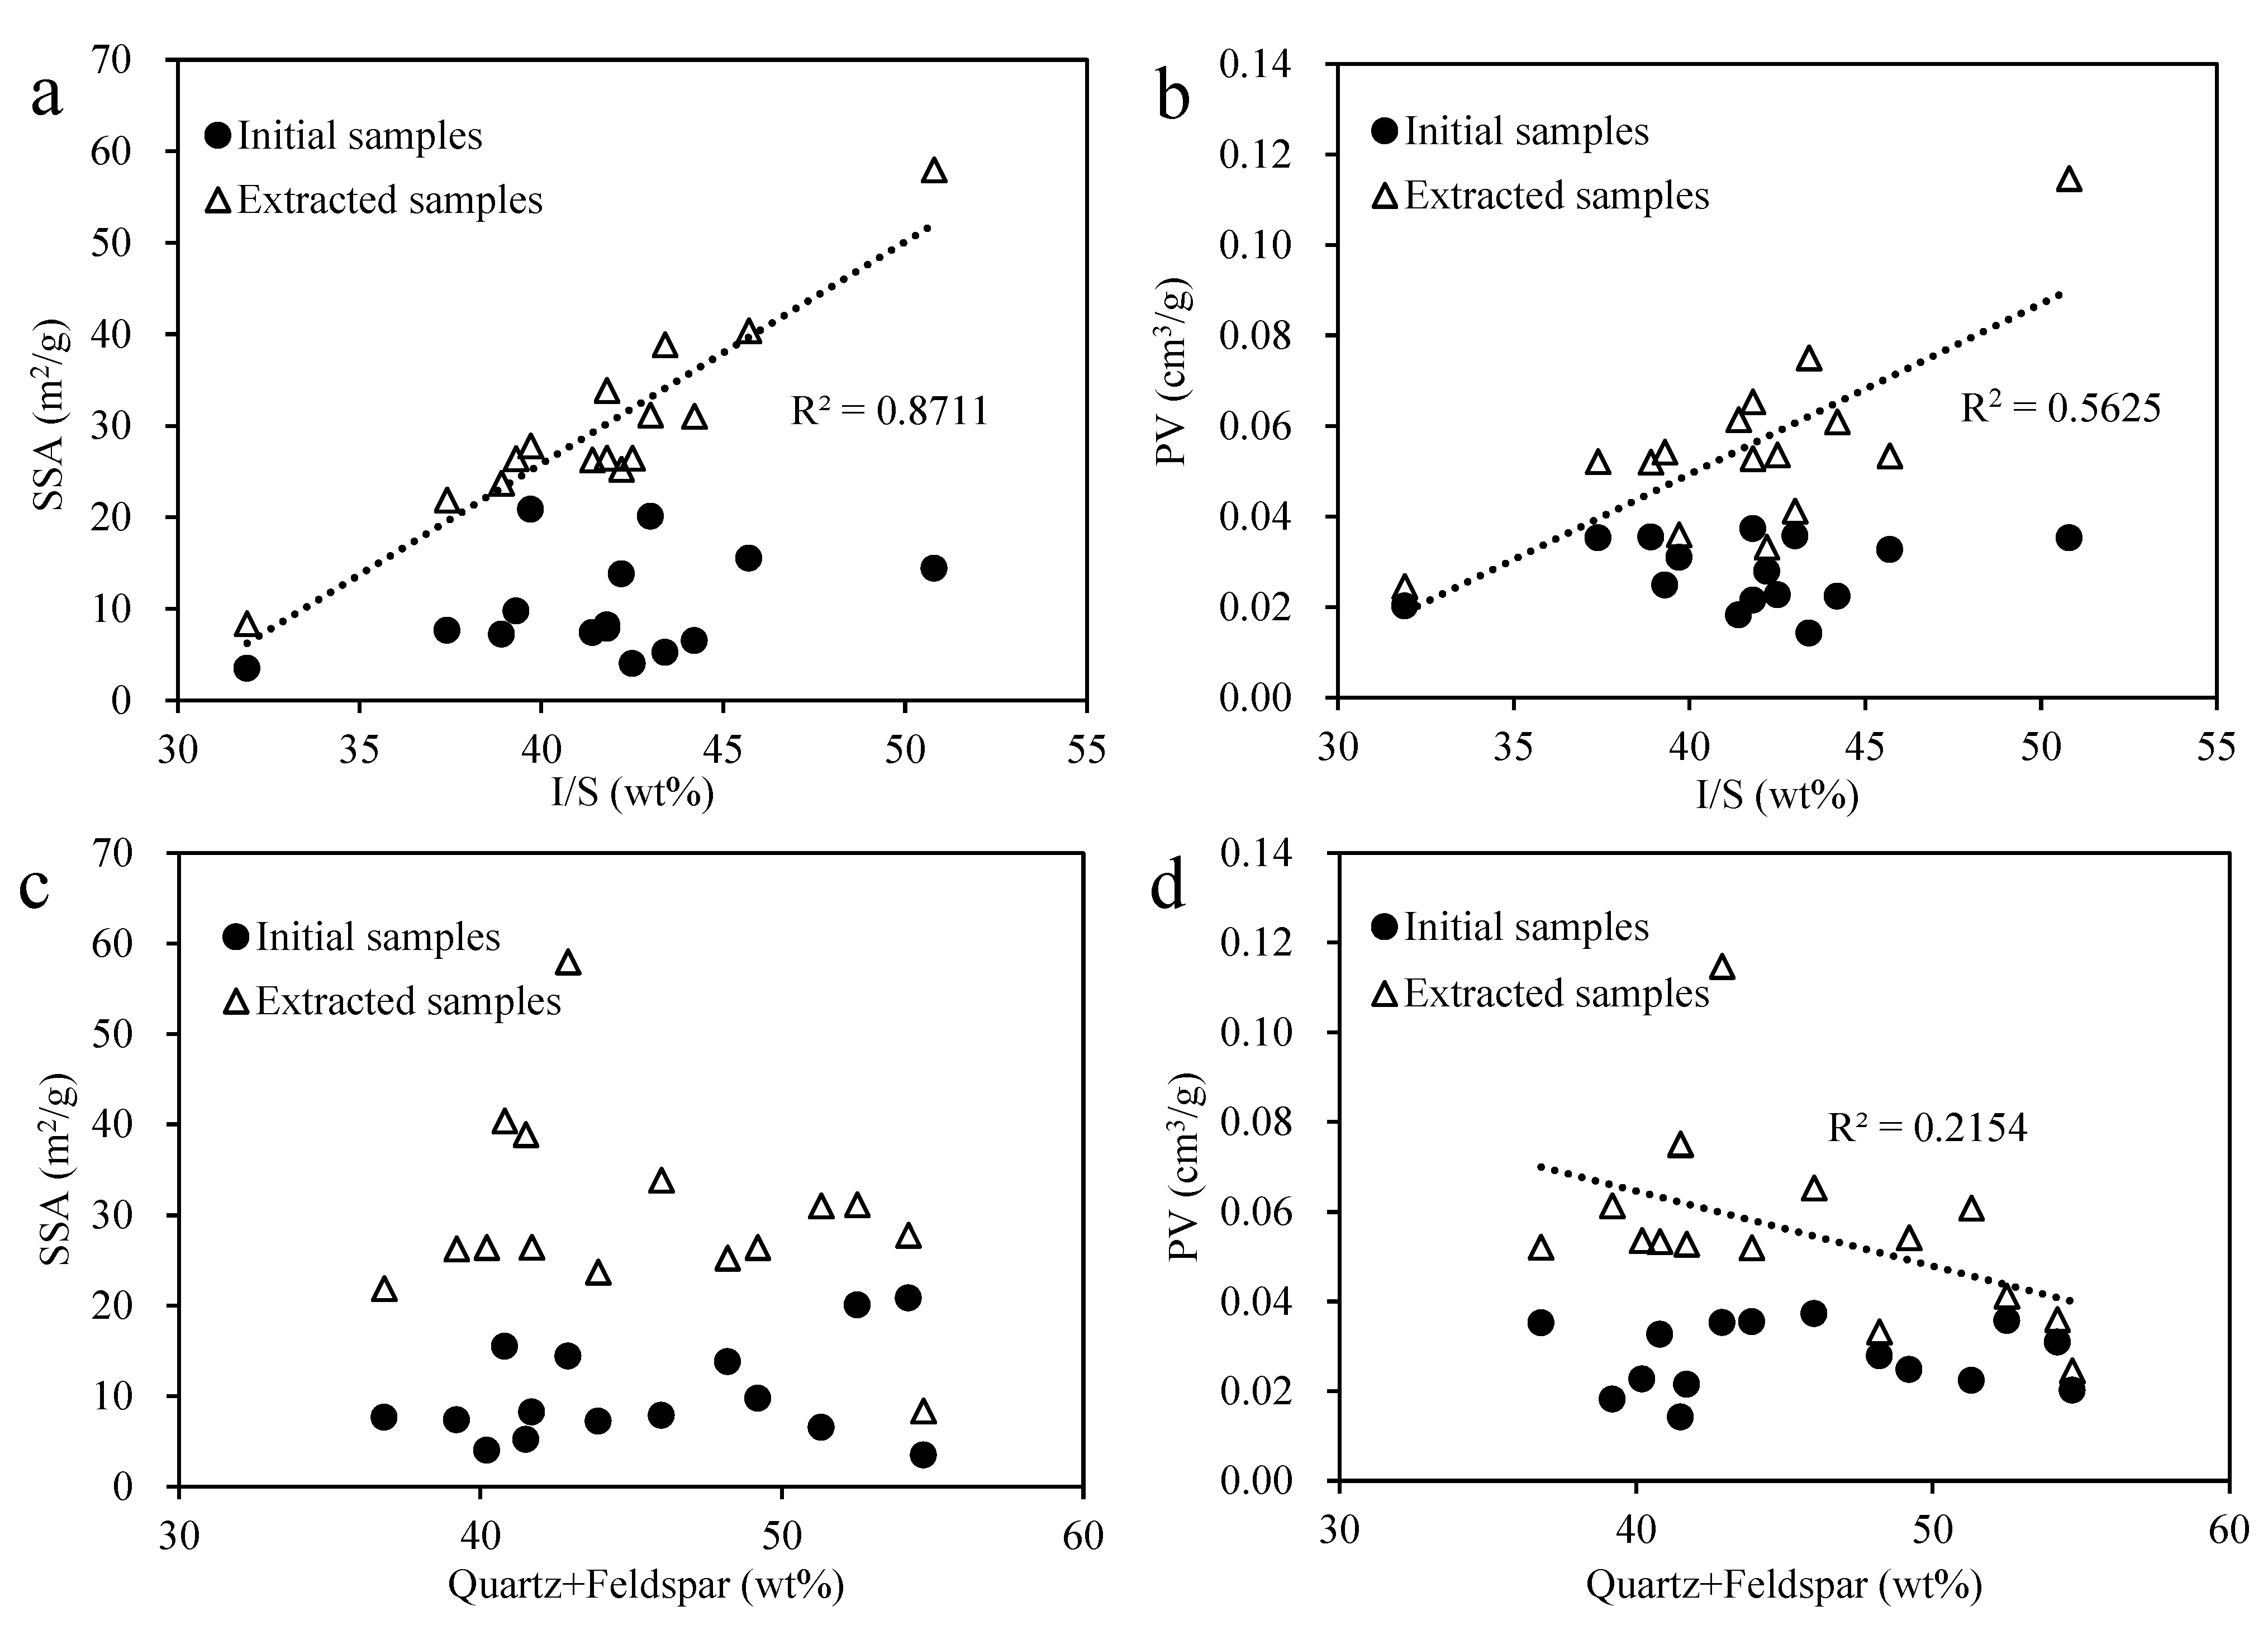
  • The good positive correlations between the I/S content and SSA of the extracted samples indicate that most small pores (<10 nm) of the K2qn shales are associated with I/S mineral. The I/S pores show a characteristic PSD with a pore-size maxima at 3 nm.
  • The SOM displays a clear negative correlation with SSA but no correlation with the PV of the initial shales, indicating that liquid hydrocarbon was more likely to be retained in the small pores. However, the overall positive correlation between the SOM content and PV of the extracted shales indicate that part of liquid hydrocarbon could be stored in the large pores when the oil content is high enough.
  • SEM observation indicates that numbers of large pores associated with OM were developed in these shales. This is also suggested by the overall positive correlation between TOC content and pore volume of the extracted samples.
  • A multiple linear regression model was applied to quantify the contribution of OM pores to the total PV. These K2qn shales show an average percentage of OM about 16%. The large OM pores are likely be an important pore type for the shale oil storage in the Songliao Basin.

Author Contributions

Writing—original draft, W.Z.; Writing—review & editing, Z.S. All authors have read and agreed to the published version of the manuscript.

Funding

This research is financially supported by the State Key Laboratory of Organic Geochemistry fund of SKLOG2020-2 and the Marine Economic Development Project of Guangdong Province of GDNRC2020-050.

Data Availability Statement

Not applicable.

Acknowledgments

The authors would like to thank Xinxing Cao from the Nanning Normal University, for the help on the sample collection.

Conflicts of Interest

The authors declare no conflict of interest.

References

  1. Jia, C.Z. Development challenges and future scientific and technological researches in China’s petroleum industry upstream. Acta Pet. Sin. 2020, 41, 1445–1464. (In Chinese) [Google Scholar]
  2. Jin, Z.J.; Wang, G.P.; Liu, G.X.; Gao, B.; Liu, Q.Y.; Wang, H.L.; Liang, X.P.; Wang, R.Y. Research progress and key scientific issues of continental shale oil in China. Acta Pet. Sin. 2021, 42, 821–835. (In Chinese) [Google Scholar]
  3. Loucks, R.G.; Reed, R.M.; Ruppel, S.C.; Hammes, U. Spectrum of pore types and networks in mudrocks and a descriptive classification for matrix-related mudrock pores. AAPG Bull. 2012, 96, 1071–1098. [Google Scholar] [CrossRef]
  4. Milliken, K.L.; Rudnicki, M.; Awwiller, D.N.; Zhang, T.W. Organic matter-hosted pore system, Marcellus Formation (Devonian), Pennsylvania. AAPG Bull. 2013, 97, 177–200. [Google Scholar] [CrossRef]
  5. Pommer, M.; Milliken, K. Pore types and pore-size distributions across thermal maturity, Eagle Ford Formation, southern Texas. AAPG Bull. 2015, 99, 1713–1744. [Google Scholar] [CrossRef]
  6. Cao, T.T.; Song, Z.G.; Wang, S.B.; Xia, J. Characterization of pore structure and fractal dimension of Paleozoic shales from the northeastern Sichuan Basin, China. J. Nat. Gas Sci. Eng. 2016, 35, 882–895. [Google Scholar] [CrossRef]
  7. Wang, H.J.; Wu, W.; Chen, T.; Yu, J.; Pan, J.N. Pore structure and fractal analysis of shale oil reservoirs: A case study of the Paleogene Shahejie Formation in the Dongying Depression, Bohai Bay, China. J. Pet. Sci. Eng. 2019, 177, 711–723. [Google Scholar] [CrossRef]
  8. Chalmers, G.R.; Bustin, R.M.; Power, I.M. Characterization of gas shale pore systems by porosimetry, pycnometry, surface area, and field emission scanning electron microscopy/transmission electron microscopy image analyses: Examples from the Barnett, Woodford, Haynesville, Marcellus, and Doig units. AAPG Bull. 2012, 96, 1099–1119. [Google Scholar] [CrossRef]
  9. Peng, S.; Zhang, T.W.; Loucks, R.G.; Shultz, J. Application of mercury injection capillary pressure to mudrocks: Conformance and compression corrections. Mar. Pet. Geol. 2017, 88, 30–40. [Google Scholar] [CrossRef]
  10. Ross, D.J.K.; Bustin, R.M. The importance of shale composition and pore structure upon gas storage potential of shale gas reservoirs. Mar. Pet. Geol. 2009, 26, 916–927. [Google Scholar] [CrossRef]
  11. Kuila, U.; McCarty, D.K.; Derkowski, A.; Fischer, T.B.; Topor, T.; Prasad, M. Nano-scale texture and porosity of organic matter and clay minerals in organic-rich mudrocks. Fuel 2014, 135, 359–373. [Google Scholar] [CrossRef]
  12. Kelemen, S.R.; Walters, C.C.; Ertas, D.; Freund, H. Petroleum Expulsion Part 3. A Model of Chemically Driven Fractionation during Expulsion of Petroleum from Kerogen. Energy Fuels 2006, 20, 309–319. [Google Scholar] [CrossRef]
  13. Cheng, P.; Xiao, X.; Fan, Q.; Gao, P. Oil Retention and Its Main Controlling Factors in Lacustrine Shales from the Dongying Sag, Bohai Bay Basin, Eastern China. Energies 2022, 15, 4270. [Google Scholar] [CrossRef]
  14. Han, Y.J.; Mahlstedt, N.; Horsfield, B. The Barnett Shale: Compositional fractionation associated with intraformational petroleum migration, retention, and expulsion. AAPG Bull. 2015, 99, 2173–2202. [Google Scholar] [CrossRef]
  15. Jarvie, D.M. Shale resource systems for oil and gas: Part 2 Shale oil resource systems. In Shale Reservoirs-Giant Resources for the 21st Century: AAPG Memoir; Breye, J.A., Ed.; Worldwide Geochemistry LLC.: Humble, TX, USA, 2012; Volume 97, pp. 89–119. [Google Scholar]
  16. Cheng, P.; Xiao, X.; Tian, H.; Gai, H.; Zhou, Q.; Li, T.; Fan, Q. Differences in the distribution and occurrence phases of pore water in various nanopores of marine-terrestrial transitional shales in the Yangquan area of the northeast Qinshui Basin, China. Mar. Pet. Geol. 2022, 137, 105510. [Google Scholar] [CrossRef]
  17. Yang, F.; Ning, Z.; Liu, H. Fractal characteristics of shales from a shale gas reservoir in the Sichuan Basin, China. Fuel 2014, 115, 378–384. [Google Scholar] [CrossRef]
  18. Xia, J.; Song, Z.G.; Wang, S.B.; Zeng, W.Z. Preliminary study of pore structure and methane sorption capacity of the Lower Cambrian shales from the north Gui-zhou Province. J. Nat. Gas Sci. Eng. 2017, 38, 81–93. [Google Scholar] [CrossRef]
  19. Wang, M.; Ma, R.; Li, J.B.; Lu, S.F.; Li, C.M.; Guo, Z.L.; Li, Z. Occurrence mechanism of lacustrine shale oil in the Paleogene Shahejie Formation of Jiyang Depression, Bohai Bay Basin, China. Pet. Explor. Dev. 2019, 46, 833–846. [Google Scholar] [CrossRef]
  20. Wang, M.; Lu, S.F.; Huang, W.B.; Liu, W. Pore characteristics of lacustrine mudstones from the Cretaceous Qingshankou Formation, Songliao Basin. Interpret. Sub. 2017, 5, T373–T386. [Google Scholar] [CrossRef]
  21. Suarez-Ruiz, I.; Juliao, T.; Suarez-Garcia, F.; Marquez, R.; Ruiz, B. Porosity development and the influence of pore size on the CH4 adsorption capacity of a shale oil reservoir. Int. J. Coal Geol. 2016, 159, 1–17. [Google Scholar] [CrossRef]
  22. Julia, T.; Suarez-Ruiz, I.; Marquez, R.; Ruiz, B. The role of solid bitumen in the development of porosity in shale oil reservoir rocks of the Upper Cretaceous in Colombia. Int. J. Coal Geol. 2015, 147, 126–144. [Google Scholar] [CrossRef]
  23. Chen, J.; Xiao, X.M. Evolution of nanoporosity in organic-rich shales during thermal maturation. Fuel 2014, 124, 173–181. [Google Scholar] [CrossRef]
  24. Mastalerz, M.; Schimmelmann, A.; Drobniak, A.; Chen, Y.Y. Porosity of Devonian and Mississippian New Albany Shale across a maturation gradient: Insights from organic petrology, gas adsorption, and mercury intrusion. AAPG Bull. 2013, 97, 1621–1643. [Google Scholar] [CrossRef]
  25. Slatt, R.M.; O’Brien, N.R. Pore types in the Barnett and Woodford gas shales: Contribution to understanding gas storage and migration pathways in fine-grained rocks. AAPG Bull. 2011, 95, 2017–2030. [Google Scholar] [CrossRef]
  26. Milliken, K.L.; Esch, W.L.; Reed, R.M.; Zhang, T.W. Grain assemblages and strong diagenetic overprinting in siliceous mudrocks, Barnett Shale (Mississippian), Fort Worth Basin, Texas. AAPG Bull. 2012, 96, 1553–1578. [Google Scholar] [CrossRef]
  27. Li, Q.; You, X.L.; Jiang, Z.X.; Zhao, X.Z.; Zhang, R.F. A type of continuous petroleum accumulation system in the Shulu sag, Bohai Bay basin, eastern China. AAPG Bull. 2017, 101, 1791–1811. [Google Scholar] [CrossRef]
  28. Kuila, U.; Prasad, M. Specific surface area and pore-size distribution in clays and shales. Geophys. Prospect. 2013, 61, 341–362. [Google Scholar] [CrossRef]
  29. Li, J.; Zhou, S.; Li, Y.; Ma, Y.; Yang, Y.; Li, C. Effect of organic matter on pore structure of mature lacustrine organic-rich shale: A case study of the Triassic Yanchang shale, Ordos Basin, China. Fuel 2016, 185, 421–431. [Google Scholar] [CrossRef]
  30. Deng, H.C.; Fu, M.Y.; Zhou, W.; Zhang, L.Y.; Xue, X.H.; Li, Y.L.; Wang, D.L. The pores evolution of lacustrine shale induced by smectite-to-illite conversion and hydrocarbon generation: Upper Triassic Yanchang Formation, Ordos Basin, China. J. Pet. Sci. Eng. 2021, 202, 108460. [Google Scholar] [CrossRef]
  31. Curtis, M.E.; Cardott, B.J.; Sondergeld, C.H.; Rai, C.S. Development of organic porosity in the Woodford Shale with increasing thermal maturity. Int. J. Coal Geol. 2012, 103, 26–31. [Google Scholar] [CrossRef]
  32. Loucks, R.G.; Reed, R.M.; Ruppel, S.C.; Jarvie, D.M. Morphology, genesis, and distribution of nanometer-scale pores in siliceous mudstones of the Mississipian Barnett Shale. J. Sediment. Res. 2009, 79, 848–861. [Google Scholar] [CrossRef]
  33. Cao, T.T.; Song, Z.G.; Wang, S.B.; Cao, X.X.; Li, Y.; Xia, J. Characterizing the pore structure in the Silurian and Permian shales of the Sichuan Basin, China. Mar. Pet. Geol. 2015, 61, 140–150. [Google Scholar] [CrossRef]
  34. Guo, H.J.; He, R.L.; Jia, W.L.; Peng, P.; Lei, Y.H.; Luo, X.R.; Wang, X.Z.; Zhang, L.X.; Jiang, C.F. Pore characteristics of lacustrine shale within the oil window in the Upper Triassic Yanchang Formation, southeastern Ordos Basin, China. Mar. Pet. Geol. 2018, 91, 279–296. [Google Scholar] [CrossRef]
  35. Bernard, S.; Wirth, R.; Schreiber, A.; Schulz, H.-M.; Horsfield, B. Formation of nanoporous pyrobitumen residues during maturation of the Barnett Shale (Fort Worth Basin). Int. J. Coal Geol. 2012, 103, 3–11. [Google Scholar] [CrossRef]
  36. Han, H.; Guo, C.; Zhong, N.N.; Pang, P.; Chen, S.J.; Lu, J.G.; Gao, Y. Pore structure evolution of lacustrine shales containing Type I organic matter from the Upper Cretaceous Qingshankou Formation, Songliao Basin, China: A study of artificial samples from hydrous pyrolysis experiments. Mar. Pet. Geol. 2019, 104, 375–388. [Google Scholar] [CrossRef]
  37. Zhou, Y.S.; Littke, R. Numerical simulation of the thermal maturation, oil generation and migration in the Songliao Basin, Northeastern China. Mar. Pet. Geol. 1999, 16, 771–792. [Google Scholar] [CrossRef]
  38. Huang, W.B.; Salad Hersi, O.; Lu, S.F.; Deng, S.W. Quantitative modelling of hydrocarbon expulsion and quality grading of tight oil lacustrine source rocks: Case study of Qingshankou 1 member, central depression, Southern Songliao Basin, China. Mar. Pet. Geol. 2017, 84, 34–48. [Google Scholar] [CrossRef]
  39. Xu, J.; Bechtel, A.; Sachsenhofer, R.F.; Liu, Z.; Gratzer, R.; Meng, Q.; Song, Y. High resolution geochemical analysis of organic matter accumulation in the Qingshankou Formation, Upper Cretaceous, Songliao Basin (NE China). Int. J. Coal Geol. 2015, 141, 23–32. [Google Scholar] [CrossRef]
  40. Liu, C.; Wang, Z.; Guo, Z.; Hong, W.; Dun, C.; Zhang, X.; Li, B.; Wu, L. Enrichment and distribution of shale oil in the Cretaceous Qingshankou Formation, Songliao Basin, Northeast China. Mar. Pet. Geol. 2017, 86, 751–770. [Google Scholar] [CrossRef]
  41. Liu, B.; Wang, H.L.; Fu, X.F.; Bai, Y.F.; Bai, L.H.; Jia, M.C.; He, B. Lithofacies and depositional setting of a highly prospective lacustrine shale oil succession from the Upper Cretaceous Qingshankou Formation in the Gulong sag, northern Songliao Basin, northeast China. AAPG Bull. 2019, 103, 405–432. [Google Scholar] [CrossRef]
  42. Huang, Z.K.; Chen, J.P.; Xue, H.T.; Wang, Y.J.; Wang, M.; Deng, C.P. Microstructural characteristics of the Cretaceous Qingshankou Formation shale, Songliao Basin. Pet. Explor. Dev. 2013, 40, 61–68. [Google Scholar] [CrossRef]
  43. Cao, X.; Gao, Y.; Cui, J.; Han, S.; Kang, L.; Song, S.; Wang, C. Pore Characteristics of Lacustrine Shale Oil Reservoir in the Cretaceous Qingshankou Formation of the Songliao Basin, NE China. Energies 2020, 13, 2027. [Google Scholar] [CrossRef] [Green Version]
  44. Zeng, W.Z.; Zhou, G.Y.; Cao, T.T.; Song, Z.G. Pore structure of the Cretaceous lacustrine shales and shale-oil potential assessment in the Songliao Basin, Northeast China. Interpret. Sub. 2021, 9, T21–T33. [Google Scholar] [CrossRef]
  45. Wang, M.; Yang, J.X.; Wang, Z.W.; Lu, S.F. Nanometer-Scale Pore Characteristics of Lacustrine Shale, Songliao Basin, NE China. PLoS ONE 2015, 10, 1–18. [Google Scholar] [CrossRef] [PubMed]
  46. Feng, Z.Q.; Jia, C.Z.; Xie, X.N.; Zhang, S.; Feng, Z.H.; Cross, T.A. Tectonostratigraphic units and stratigraphic sequences of the nonmarine Songliao Basin, northeast China. Basin Res. 2010, 22, 79–95. [Google Scholar] [CrossRef]
  47. Xu, J.; Liu, Z.; Bechtel, A.; Meng, Q.; Sun, P.; Jia, J.; Cheng, L.; Song, Y. Basin evolution and oil shale deposition during Upper Cretaceous in the Songliao Basin (NE China): Implications from sequence stratigraphy and geochemistry. Int. J. Coal Geol. 2015, 149, 9–23. [Google Scholar] [CrossRef]
  48. Feng, Z.H.; Fang, W.; Wang, X.; Huang, C.Y.; Huo, Q.L.; Zhang, J.H.; Huang, Q.H.; Zhang, L. Microfossils and molecular records in oil shales of the Songliao Basin and implications for paleo-depositional environment. Sci. China Ser. D 2009, 52, 1559–1571. [Google Scholar] [CrossRef]
  49. Wang, S.B.; Song, Z.G.; Cao, T.T.; Song, X. The methane sorption capacity of Paleozoic shales from the Sichuan Basin, China. Mar. Pet. Geol. 2013, 44, 112–119. [Google Scholar] [CrossRef]
  50. Zheng, Y.J.; Liao, Y.H.; Wang, Y.P.; Xiong, Y.Q.; Peng, P.A. Organic geochemical characteristics, mineralogy, petrophysical properties, and shale gas prospects of the Wufeng-Longmaxi shales in Sanquan Town of the Nanchuan District, Chongqing. AAPG Bull. 2018, 102, 2239–2265. [Google Scholar] [CrossRef]
  51. Li, Y.; Xia, J.; Song, Z.G. A comparison study on hydrocarbon composition in bitumens I and II from Lower Cambrian marine shales in Guizhou Province, South China. Fuel 2019, 243, 332–341. [Google Scholar] [CrossRef]
  52. Gregg, S.J.; Sing, K.S.W. Adsorption, Surface Area and Porosity; Academic Press: New York, NY, USA, 1982. [Google Scholar]
  53. Cavelan, A.; Boussafir, M.; Rozenbaum, O.; Laggoun-Defarge, F. Organic petrography and pore structure characterization of low-mature and gas-mature marine organic-rich mudstones: Insights into porosity controls in gas shale systems. Mar. Pet. Geol. 2019, 103, 331–350. [Google Scholar] [CrossRef]
  54. Thommes, M.; Kaneko, K.; Neimark, A.V.; Olivier, J.P.; Rodriguez-Reinoso, F.; Rouquerol, J.; Sing, K.S.W. Physisorption of gases, with special reference to the evaluation of surface area and pore size distribution (IUPAC Technical Report). Pure Appl. Chem. 2015, 87, 1051–1069. [Google Scholar] [CrossRef] [Green Version]
  55. Sing, K.S.W. Reporting physisorption data for gas/solid systems with special reference to the determination of surface area and porosity (Recommendations 1984). Pure Appl. Chem. 1985, 57, 603–619. [Google Scholar] [CrossRef]
  56. Groen, J.C.; Peffer, L.A.A.; Perez-Ramirez, J. Pore size determination in modified micro- and mesoporous materials. Pitfalls and limitations in gas adsorption data analysis. Microporous Mesoporous Mater. 2003, 60, 1–17. [Google Scholar] [CrossRef]
  57. Liang, S.; Wang, J.M.; Liu, Y.K.; Liu, B.; Sun, S.; Shen, A.Q.; Tao, F.Y. Oil Occurrence States in Shale Mixed Inorganic Matter Nanopores. Front. Earth Sci. 2022, 9, 833302. [Google Scholar] [CrossRef]
  58. Li, Y.L.; Cai, J.G.; Wang, X.J.; Hao, Y.Q.; Liu, Q. Smectite-illitization difference of source rocks developed in saline and fresh water environments and its influence on hydrocarbon generation: A study from the Shahejie Formation, Dongying Depression, China. Mar. Pet. Geol. 2017, 80, 349–357. [Google Scholar] [CrossRef]
  59. Nelson, P.H. Pore-throat sizes in sandstones, tight sandstones, and shales. AAPG Bull. 2009, 93, 329–340. [Google Scholar] [CrossRef]
  60. He, W.; Sun, Y.; Guo, W.; Shan, X.; Su, S.; Zheng, S.; Deng, S.; Kang, S.; Zhang, X. Organic Geochemical Characteristics of the Upper Cretaceous Qingshankou Formation Oil Shales in the Fuyu Oilfield, Songliao Basin, China: Implications for Oil-Generation Potential and Depositional Environment. Energies 2019, 12, 4778. [Google Scholar] [CrossRef]
  61. Wei, W.; Zhang, C.; Zhang, S.; Wu, C.; Yang, K. Study on the Cretaceous turbidite and reservoir features in the Qingshankou Formation in northern Songliao Basin, NE China. Mar. Pet. Geol. 2016, 78, 797–806. [Google Scholar] [CrossRef]
  62. Zhu, X.J.; Cai, J.G.; Liu, Q.; Li, Z.; Zhang, X.J. Thresholds of petroleum content and pore diameter for petroleum mobility in shale. AAPG Bull. 2019, 103, 605–617. [Google Scholar] [CrossRef]
  63. Romero-Sarmiento, M.F.; Ducros, M.; Carpentier, B.; Lorant, F.; Cacas, M.C.; Pegaz-Fiornet, S.; Wolf, S.; Rohais, S.; Moretti, I. Quantitative evaluation of TOC, organic porosity and gas retention distribution in a gas shale play using petroleum system modeling: Application to the Mississippian Barnett Shale. Mar. Pet. Geol. 2013, 45, 315–330. [Google Scholar] [CrossRef]
  64. Cardott, B.J.; Landis, C.R.; Curtis, M.E. Post-oil solid bitumen network in the Woodford Shale, USA—A potential primary migration pathway. Int. J. Coal Geol. 2015, 139, 106–113. [Google Scholar] [CrossRef]
  65. Chen, L.; Jiang, Z.X.; Liu, Q.X.; Jiang, S.; Liu, K.Y.; Tan, J.Q.; Gao, F.L. Mechanism of shale gas occurrence: Insights from comparative study on pore structures of marine and lacustrine shales. Mar. Pet. Geol. 2019, 104, 200–216. [Google Scholar] [CrossRef]
  66. Gao, Y.; Zou, Y.R.; Liang, T.; Peng, P.A. Jump in the structure of Type I kerogen revealed from pyrolysis and 13C DP MAS NMR. Org. Geochem. 2017, 112, 105–118. [Google Scholar] [CrossRef]
Figure 1. (a) Structural units of the Songliao Basin and sampling well locations (note: I Qijia-Gulong Sag, II Daqing Anticline, and III Sanzhao Sag); (b) stratigraphic units and studied interval.
Energies 15 07075 g001
Figure 2. Correlation between the soluable OM and free hydrocarbon S1 content.
Energies 15 07075 g002
Figure 3. FE-SEM images of various types of pores. (a) Sample QP-2; (b) Sample X83-6; (c) Sample YX58-10; (d) Sample Z42-2; (e) Sample Y47-5; (f) SampleY47-5.
Energies 15 07075 g003
Figure 4. Low-pressure N2 sorption and desorption isotherms of the initial and extracted samples for the typical K2qn shales.
Energies 15 07075 g004
Figure 5. Plots of dV/dlog (D) versus pore diameter for the PSD of the initial and extracted samples for the typical K2qn shales.
Energies 15 07075 g005
Figure 6. Correlation between the average pore diameter (APD) and (a) specific surface area (SSA) and (b) pore volume (PV).
Energies 15 07075 g006
Figure 7. Correlation between the mineral contents and pore structure parameters. (a) I/S vs. SSA; (b) I/S vs. PV; (c) Quartz + Feldspar vs. SSA; (d) Quartz + Feldspar vs. PV.
Energies 15 07075 g007
Figure 8. Correlation between the OM compositions and pore structure parameters. (a) SOM vs. SSA; (b) SOM vs. PV; (c) TOC vs. SSA; (d) TOC vs. PV.
Energies 15 07075 g008
Figure 9. (a) Correlation between predicted pore volume and measured pore volume; (b) Contribution of OM pore to the total pore volume.
Energies 15 07075 g009
Table 1. TOC, soluble OM contents and pyrolysis parameters of the Qingshankou Formation shales in Songliao Basin.
SampleCoreDepth
(m)
TOC
(wt%)
S1
(mg/g)
S2
(mg/g)
Tmax
(℃)
HI
(mg/g)
SOM
(mg/g)
SK-7SK117092.441.5014.464415934.96
SK-917252.562.3313.794405396.69
SK-1117533.032.7714.124414669.76
Z42-2Z4219682.751.0215.584445673.73
Z42-420053.491.1919.894495704.77
X83-2X8319362.101.0110.654475074.81
X83-420252.370.6912.614465322.59
X83-620762.680.8310.024433743.33
QP-1QP120010.940.642.84372982.73
QP-220942.311.837.964403455.77
YX58-4YX5820311.611.296.044453754.54
YX58-520401.901.908.974454725.48
YX58-1021073.845.7816.4744942914.28
Y47-2Y4723181.952.004.234202175.85
Y47-523602.792.615.294441904.90
Table 2. Mineral compositions of the Qingshankou Formation shales in Songliao Basin.
SampleQuartz
(wt%)
Feldspar
(wt%)
Carbonates
(wt%)
Pyrite
(wt%)
I/S
(wt%)
Chlorite
(wt%)
SK-715.321.59.71.937.414.2
SK-919.424.52.41.838.913.0
SK-1120.125.90.01.741.810.5
Z42-218.121.18.61.941.48.9
Z42-418.423.15.31.443.48.4
X83-223.530.74.61.539.70.0
X83-419.728.57.81.842.20.0
X83-621.427.89.91.639.30.0
QP-124.428.12.71.843.00.0
QP-218.424.54.61.750.80.0
YX58-417.723.16.70.045.76.8
YX58-522.432.31.91.731.99.8
YX58-1023.716.57.60.042.59.7
Y47-223.727.62.71.844.20.0
Y47-517.724.05.81.141.89.6
Note: I/S = llite/smectite.
Table 3. Pore structure parameters of the initial and extracted shale samples.
SampleInitial Shale SamplesExtracted Shale Samples
SSA
(m2/g)
PV
(cm3/g)
ADP
(nm)
SSA
(m2/g)
PV
(cm3/g)
ADP
(nm)
SK-77.640.035314.1021.890.05218.68
SK-97.210.035515.1223.730.05207.91
SK-117.860.037315.5633.890.06547.73
Z42-27.390.01829.3326.280.061410.25
Z42-45.220.01429.4338.870.07518.14
X83-220.860.03107.0927.810.03605.69
X83-413.810.02796.9825.280.03325.91
X83-69.750.02489.0526.440.05438.31
QP-120.090.03576.2631.190.04125.71
QP-214.430.03537.9157.970.11477.83
YX58-415.510.03278.0240.390.05346.11
YX58-53.490.020217.798.370.024510.27
YX58-104.000.022721.9526.450.05368.82
Y47-26.530.022412.3031.040.06097.99
Y47-58.230.02159.7126.480.05289.02
Publisher’s Note: MDPI stays neutral with regard to jurisdictional claims in published maps and institutional affiliations.

