Article

A Comparison of the Geochemical and Stable Carbon Isotopic Characteristics of Extracts Obtained from Source Rocks Using Different Solvents

Research Center for Oil and Gas Resources, Northwest Institute of Eco-Environment and Resources, Chinese Academy of Sciences, Lanzhou 730000, China
*
Author to whom correspondence should be addressed.
Energies 2022, 15(23), 9198; https://doi.org/10.3390/en15239198
Submission received: 25 October 2022 / Revised: 29 November 2022 / Accepted: 2 December 2022 / Published: 4 December 2022
(This article belongs to the Special Issue Hydrocarbon Accumulation Process and Mechanism)

Abstract

:
The choice of the solvent to use in the Soxhlet extraction process dramatically affects the extraction yield. In this work, ten hydrocarbon source rocks were extracted using different solvents, and the chemical compositions of their products were analyzed to assess the extraction efficiency and the differences between fractions. The results indicated that using a mixed dichloromethane (DCM) and methanol (MeOH) reagent instead of the traditional chloroform (TCM) reagent can improve extraction efficiency for all rock types except for coal. The improvement in extraction efficiency was attributed to the contributions of non-hydrocarbon compounds (NOSs). A comparative study of the biomarkers of the fractions extracted using different reagents showed no significant differences in geochemical parameters, such as ∑C22−/∑C23+, Pr/Ph, Pr/nC17, Ph/nC18, OEP1, OEP2, CPI, and hopane distribution. Additionally, the carbon isotopic compositions of the fractions varied by less than 1‰, indicating that the TCM and DCM: MeOH regents did not significantly affect the results of the oil–source correlation.

1. Introduction

Extraction is a sample preparation step in analytical chemistry [1]. Solvent extraction from solid samples, commonly known as solid–liquid extraction, is one of the oldest reliable sample preparation techniques. Soxhlet extraction is a reference extraction technique for some authors and the most widely used process in petroleum geochemistry [2].
Research conducted in the field of organic geochemistry frequently deals with organic matter extracted from sedimentary rocks using single or mixed organic solvents, such as chloroform (TCM) [3], methylene chloride (DCM) [4], methanol (MeOH), DCM-MeOH [5], and methanol–acetone–chloroform (MAC, 23:30:47 by weight) [6]. The data extracted include chloroform bitumen “A” content, total hydrocarbon content, and group compositions, which are critical parameters used to qualitatively and quantitatively analyze source rocks and essential for reservoir evaluation and oil–source correlation studies [7,8,9,10,11]. High-efficiency and high-precision extract yields are required for results to be properly interpreted, and rapid sample extraction is desirable whenever organic geochemical methods are used during petroleum exploration [12]. As the choice of solvent and the methodology used for the extraction process are fundamental and critical factors in geochemical studies, much research has been conducted to examine the effects of sequential extraction and solvent type on biomarker distributions [7,13,14]. Chen et al. (2006) studied the extraction of coal and coal-measures mudstone. They showed significant differences in the group composition and biomarker compound distribution between chloroform extracts of coal and oil from coal measures, which made it very difficult to confirm the oil source of oil-measures crude oil in coal-bearing sedimentary basins [13]. Guo et al. (2000) used CS2:N-methyl-2-pyrrolidinone (NMP), chloroform, and ternary reagents (MAC) as super-polar mixed solvents to extract low-maturity source rocks, finding that the amount of CS2:NMP extracted was two to nine times that of the chloroform and ternary solvents [15]. These previous research results all show that the polarity of the solvent has a decisive effect on the extraction yield and product distribution in the extraction of source rocks. Most researchers perform Soxhlet extraction using conventional solvents, such as TCM, at temperatures near their boiling points [16]. However, TCM has been replaced in many recent studies by different reagents (e.g., DCM:MeOH, v/v = 9:1 [6]; CS2: NMP, v/v = 1:1) [15,16,17,18] due to the restrictions on the use of chloroform reagents. Researchers have had no choice but to gradually start using a mixture of DCM and MeOH to replace chloroform. This solvent change has affected the extracted products’ yields and characteristics. The change in extraction reagents has also introduced many uncertainties into the geochemical analyses of source rocks. Specifically, these uncertainties concern whether the extraction yield will be improved, whether the biomarker characteristics of the extract will change, and whether the stable carbon isotope of the extract will be affected. Unfortunately, few investigations have been conducted into these issues.
In this work, we report the results of experiments designed to evaluate how extraction yields, biomarkers, and stable carbon isotope signatures vary after extraction using different solvents. The saturated hydrocarbon fraction was identified using gas chromatography–mass spectrography (GC-MS), and elemental analyzer–isotope ratio mass spectrometry (EA-IRMS) was used to measure the bulk carbon isotopes of group components.

2. Materials and Methods

2.1. Chemicals and Samples

n-Hexane (analysis grade), methanol (LC grade), dichloromethane (analysis grade), and chloroform (analysis grade) were all purchased from Sigma-Aldrich (St. Louis, MO, USA). A total of ten samples, including coal and source rocks, were selected from different basins in China. Two source rocks were taken from wells He-6 (H-6) and Ji-101 (J-101) in the depression of the Turpan–Hami basin, and two samples were taken at different depths from well Fuye-1 (FY1-4 and FY1-25) in the Ordos basin. The remaining two samples were collected in the Sichuan basin from well Baoye-2 (BY2) and the outcrop (Cam-shale). Samples ZDS-9 and ZDS-16 were collected from the Qiangtang basin, and samples G11-8 and G11-18 were collected from the Qaidam basin. Before extraction, the source rock samples were washed, dried, and ground to <100 mesh. All the samples were analyzed using a Rock-Eval instrument with Rock-Eval parameters. S1, S2, S3, and Tmax values were determined, and then the hydrogen index (HI) and oxygen index (OI) were calculated. The Rock-Eval pyrolysis results for the samples are shown in Table 1.

2.2. Soxhlet Extraction (SE) Procedure

The Soxhlet extraction (SE) method used here was adopted from Parera et al. [19] and further optimized. A thimble containing 50 g of source rock sample was placed in a Soxhlet chamber fitted with a condenser and connected to a round-bottom flask containing 100 mL of mixed dichloromethane: methanol (9:1 v/v) solvent. The solvent flask was refluxed for 72 h at 40 °C. After extraction, the extract was concentrated at low pressure until it was dry.

2.3. Fractionation of the Extracts

The asphaltene fraction produced using different extraction methods was precipitated with n-hexane. The maltene fraction (~20–50 mg) in ~0.3 mL of solvent was absorbed into 0.2 g of silica gel, after which the solvent was removed. The absorbed sample was then added to the top of a glass column 40 cm in height and 1 cm in diameter. It was packed with n-hexane slurry consisting of 3 g of activated silica gel in the lower part of the column and 2 g of activated neutral alumina in the upper part. This mixture was sequentially eluted with the following solvents: (1) 100 mL of n-hexane to elute the saturate fraction, (2) 50 mL of CH2Cl2 to elute the aromatic fraction, and (3) 20 mL of methanol to elute the non-hydrocarbon fraction.

2.4. Gas Chromatography-Mass Spectrometry (GC-MS)

The saturated hydrocarbons extracted from source rocks were analyzed with gas chromatography–mass spectrometry (GC-MS) to determine the samples’ molecular compositions. All GC analyses were carried out using an Agilent 5890A gas chromatograph (Agilent Technologies Inc., California, PA, USA) equipped with a fused silica column (HP-5MS, 30 m × 0.32 mm × 0.25 μm) and coupled with a mass spectrometer (MSD, Agilent 5975C) for saturated hydrocarbon analysis. The carrier gas was helium, with a 1.0 mL/min flow rate. Injections were performed in splitless mode at 280 °C, and the injection volume was 1.0 μL. The GC oven was initially set to a temperature of 80 °C for 3 min, then heated to 280 °C at a rate of 2 °C/min, and then held at that temperature for 30 min.

2.5. Stable Carbon Isotope Analysis

The stable carbon isotope compositions of source rock extracts and fractions were measured using an elemental analyzer (Flash 2000, Thermo-Fisher, Bremen, Germany) coupled with an isotope ratio mass spectrometer (MAT253, Thermo-Fisher, Bremen, Germany) via a combustion interface (GC Combustion III). Helium was used as the carrier gas with a flow rate of 2 mL/min. The isotopic composition is reported here using the δ notation relative to Vienna Pee Dee Belemnite (V-PDB) for carbon isotope ratio traceability. The δ13C values were pre-calibrated against an international standard material (International Atomic Energy Agency, caffeine, IAEA-600, C8H10N4O2, −27.771 ± 0.043‰, V-PDB). In this study, all samples’ stable isotopic compositions were better than ±0.2‰ [20].

3. Results and Discussion

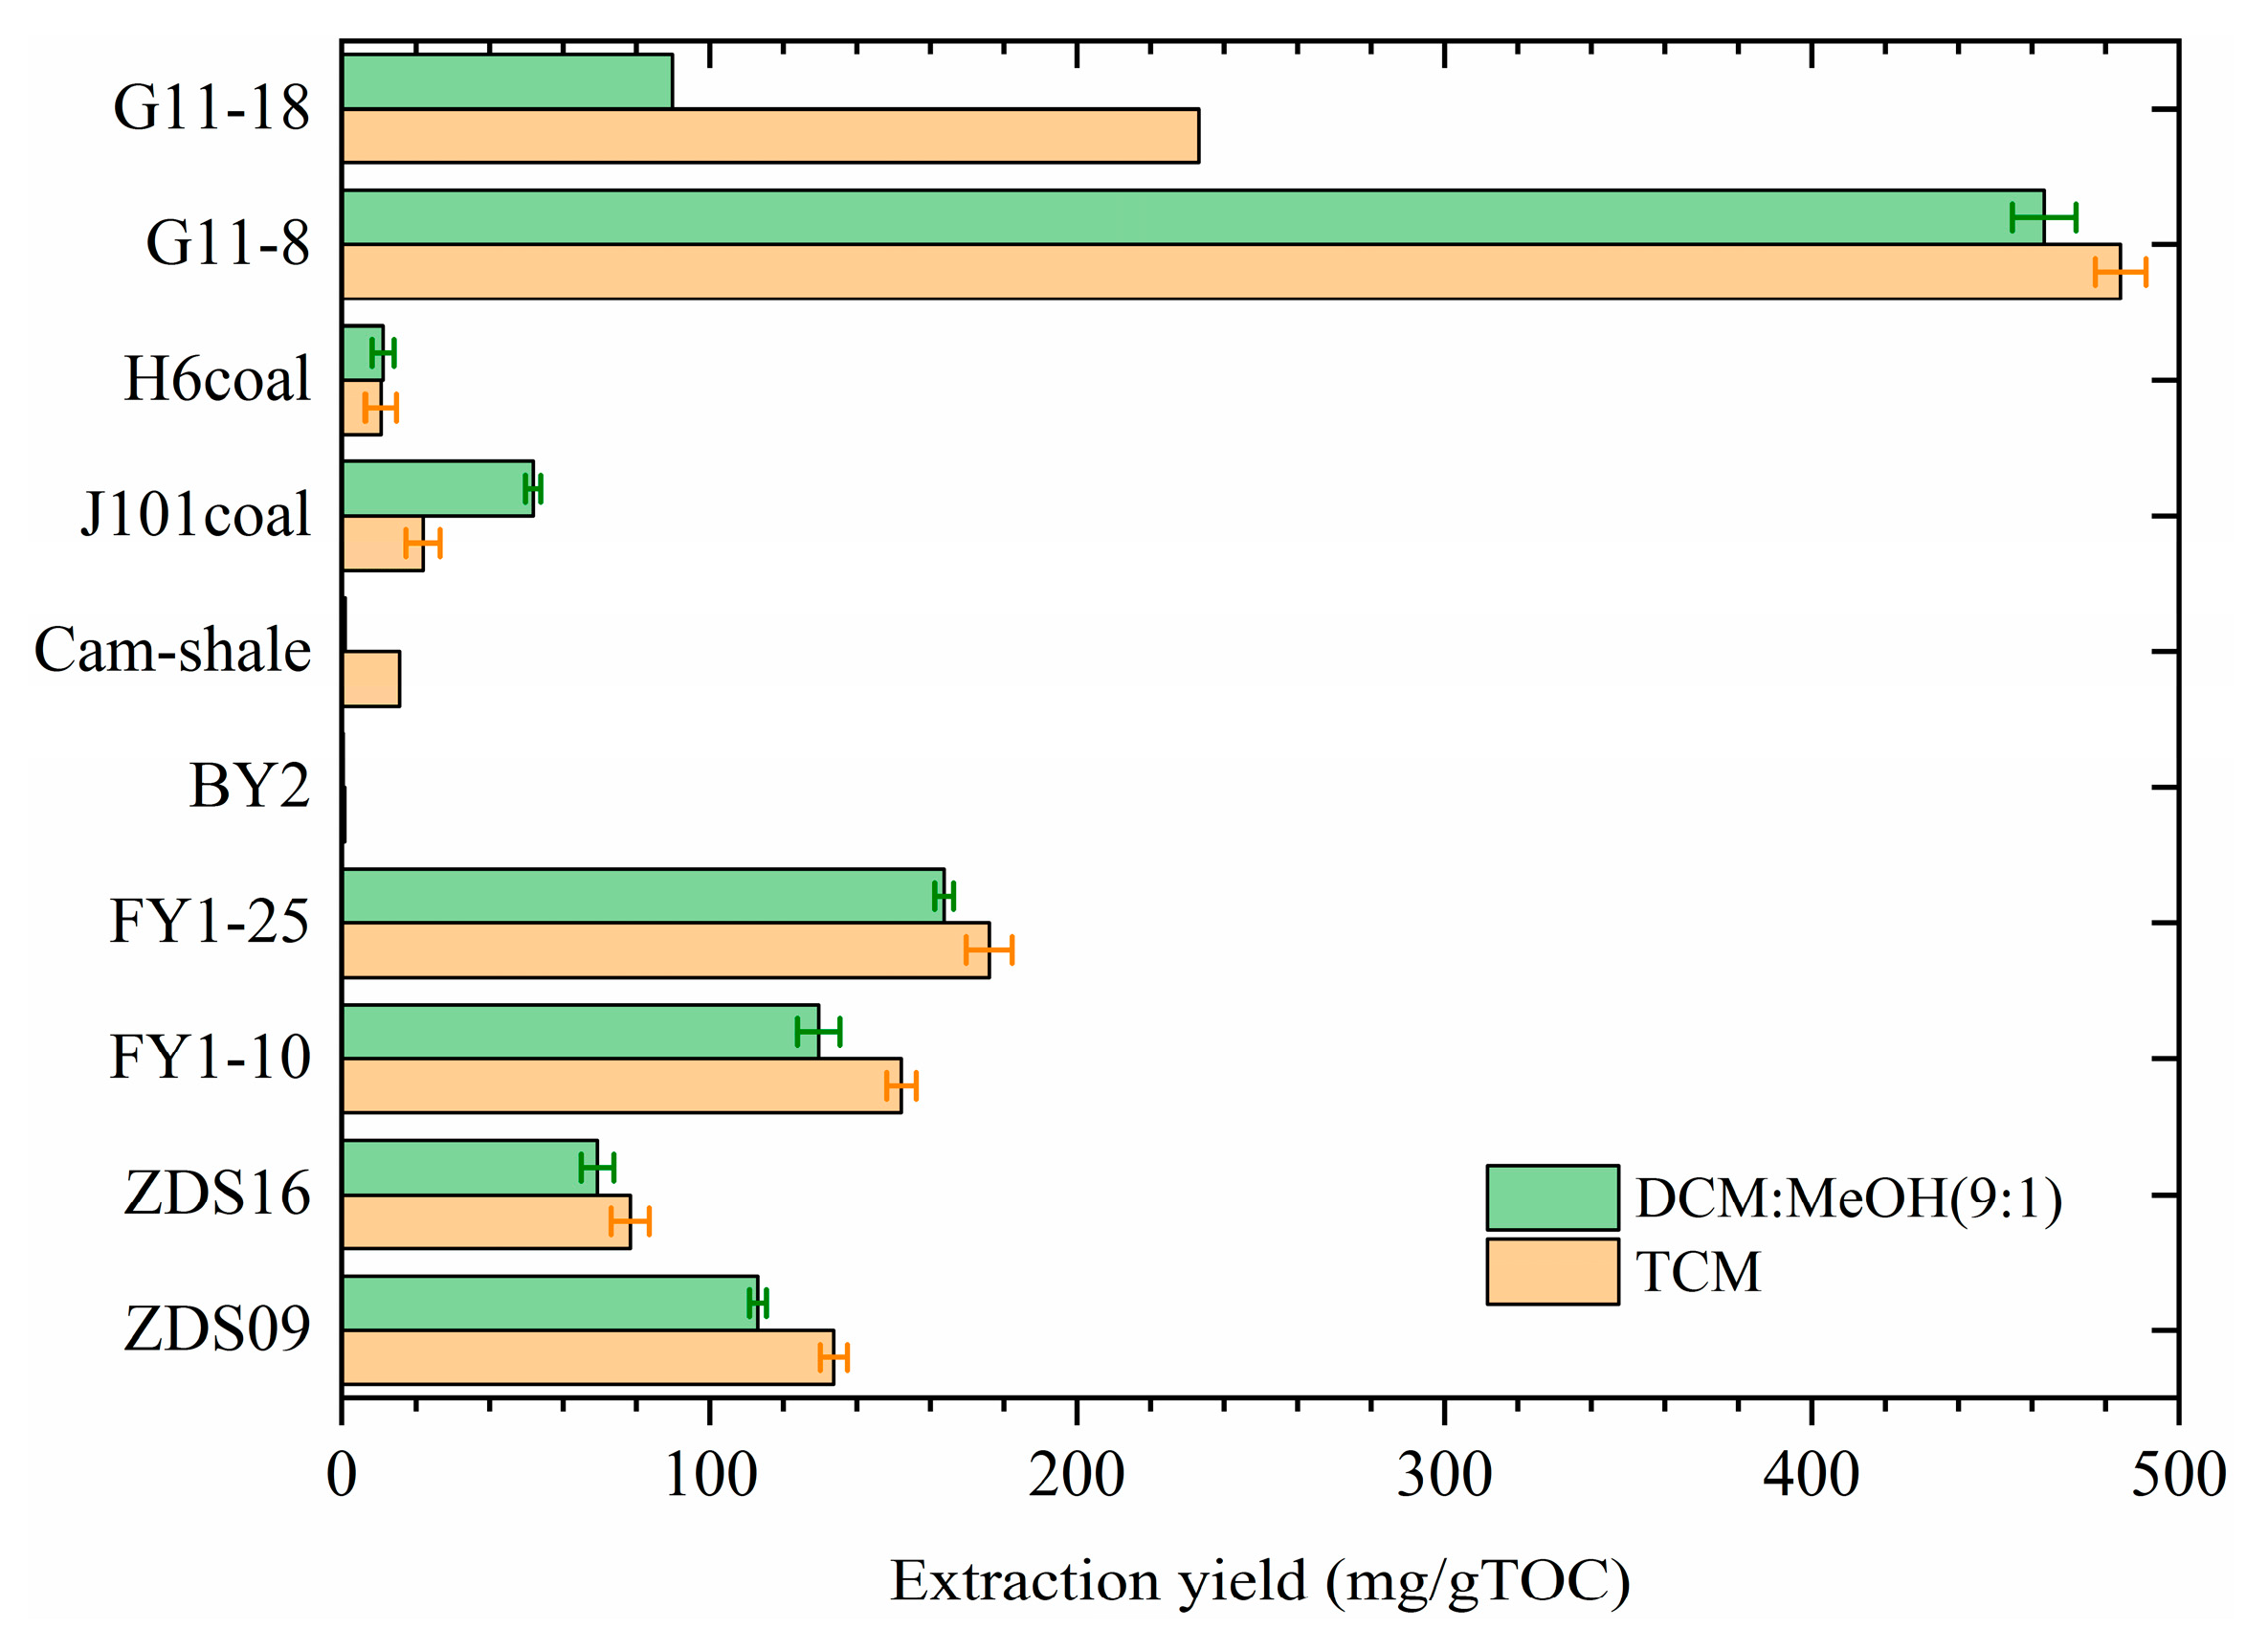
3.1. Extraction Yield and Bulk Composition Comparison

To examine variations in the extracts obtained using different solvents, we fractionated each extract into saturated hydrocarbon, aromatic hydrocarbon, hetero component (NOSs), and asphaltene fractions after quantifying the products. The results for the extraction yield and extract fractionation are shown in Figure 1 and Figure 2.
Figure 1 shows that the extraction yields for each sample when using different solvents were significantly different. The TCM reagent resulted in more products from coal samples, whereas the mixed solvent obtained higher yields from the source rock. Our data show that the properties of a solvent have a significant influence on the yield of the extract; for example, the TCM and mixed DCM: MeOH reagents produced extraction yields of 1.06 and 2.37, respectively, and the mixed DCM:MeOH reagent obtained higher extraction yields for other samples.
After extraction was performed on the source rocks using both reagents, we observed that the group compositional characteristics of the extracts were significantly different in each case. Figure 2 shows that more saturated hydrocarbon fractions (Sat.) were obtained when TCM was used as the extraction reagent and the amounts of heteratomic compounds (NOSs) and asphaltenes (Asph.) were reduced accordingly. There were no significant differences in the extracted aromatic hydrocarbon content with different solvents. We interpreted the differences in extracted group components as being related to differences in each solvent’s polarity. The results of this study are consistent with previous reports [19,21].

3.2. Comparison of Biomarkers

Much geochemical research involves analyzing the origins of various oil sources, which is achieved by correlating the main-peak carbon number, peak type, odd–even dominance, ∑C22−/∑C23+, and other parameters. GC–MS was used to analyze all saturated fractions in the individual samples and reveal the distribution characteristics of the biomarker compounds. Due to differences in the maturity of the source rocks, m/z 217 ions were not detected in the saturated hydrocarbon fractions of the extracts from some of the samples. Therefore, only representative samples were selected for discussion in this study.
Figure 3 shows that the peak type and compound distribution characteristics of the m/z 85 and m/z 191 mass fragments were very similar. When TCM was used as the extraction solvent for sample J101, the carbon number range was C13–C39 and the main peak was nC21 (Table 2); however, when the extraction solvent used for sample J101 was DCM: MeOH, the carbon number range was C14–C35 and the main peak was nC20.
Pristane (Pr) and phytane (Ph) are the essential acyclic isoprenoids used for evaluating redox conditions during source rock deposition. The Pr/Ph ratios can be used to identify specific paleoenvironmental conditions. Other parameters, such as OEP, CPI, Pr/nC17, and Ph/nC18, can also reflect specific geochemical characteristics. In this study, the responses in these parameters were used to determine the effects of extraction reagents on the extracted products of the source rocks [22,23]. The saturates obtained from extractions with different solvents showed negligible differences for all parameters, including ∑C22−/∑C23+, Pr/Ph, Pr/nC17, Ph/nC18, OEP1, OEP2, CPI, and hopane distribution. Table 2 shows that only ∑C22−/∑C23+ exhibited a slight variation after the same sample was extracted with a different solvent, whereas other biomarker parameters showed no significant changes. For example, pretreatment of sample FY1-25 with the TCM reagent produced values of 1.51, 0.15, 0.10, 1.00, 1.03, and 1.07 for the parameters Pr/Ph, Pr/nC17, Ph/nC18, OEP1, OEP2, and CPI, respectively; however, when the extraction reagent was DCM: MeOH, these parameter values were 1.65, 0.16, 0.11, 0.99, 1.05, and 1.10, respectively. These differences were likely related to either the loss of low-mass components during the separation process or differences in the injection volume during the GC–MS analysis.
These experimental results indicate that replacing TCM with DCM: MeOH affects the relative proportions of group components extracted from a source rock but does not affect the distribution characteristics of biomarkers. However, further evaluation of their effects should be undertaken when using solvents with large polarity differences.

3.3. Stable Carbon Isotope of the Extracts and Kerogen

Correlating oil reservoirs with their source rocks is an important objective in hydrocarbon exploration. Isotopic methods that compare the 13C/12C ratios of kerogen, extract, and crude oil can help to identify such relationships [10].
Here, we present a comparative study of the stable carbon isotopes of fractions obtained using different solvents. Isotopic curves were plotted using measured carbon isotope data for all group components (Sat., Arom., NOS, and Asph.), after which the values for kerogen were measured and added to these plots, and linear fits were produced for all data points (Figure 4).
As shown in Figure 4, except for samples ZDS-9, G11-8, and G11-18, pretreatment with different solvents led to the saturated hydrocarbons being most depleted in δ13C and the heavier carbon isotope being most enriched in asphaltenes (Figure 4). The variation trend for the carbon isotopes of group components was consistent with the results of previous studies. However, due to slight changes in the carbon isotopic composition between fractions and the polarity of the two extraction reagents being similar, there were no apparent differences in the carbon isotope values of the group components in some of the samples, which weakly correlated with kerogen. The predicted carbon isotope values of kerogen were in agreement with the measured values from the carbon type-curves of other samples. These results indicate that replacing a chloroform reagent with a mixed dichloromethane and methanol reagent does not significantly affect group components’ carbon isotope test results during pretreatment of source rocks.
Therefore, whether using DCM:MeOH or TCM reagent to extract source rocks, the conclusions reached in the oil–source correlation study using the stable carbon isotopic type-curves method were consistent. The carbon isotopic correlation between fractions and kerogen was not affected.

4. Conclusions

Ten source rocks were pretreated with both DCM:MeOH and TCM reagents in separate experiments, which allowed differences in the geochemical and stable carbon isotopic characteristics of the extracts and fractions to be investigated.
Pretreatment regimes that used different reagents produced significantly different extracts in each case; in particular, the TCM reagent is more suitable for extracting coal samples, while mixed solvents are more suitable for extracting source rock samples. The experimental results also showed that the TCM reagent made it possible to extract more asphaltene, while the DCM: MeOH mixed reagent made it possible to extract more NOSs. A comparative study of the characteristics of the biomarkers and bulk carbon isotope values for the fractions produced by each reagent showed that there were no significant effects on their geochemical parameters, including ΣC22−/ΣC23+, Pr/Ph, Pr/nC17, Ph/nC18, OEP1, OEP2, CPI, and hopane distribution. Additionally, the difference in the carbon isotopic composition of each component was less than 1‰, indicating that TCM and DCM: MeOH do not significantly affect the results of oil–source correlation.

Author Contributions

L.X.: Conceptualization, methodology, investigation, supervision, funding, acquisition, writing—original draft preparation. Y.L.: data curation, validation, software. Z.L.: resources, writing—review and editing. All authors have read and agreed to the published version of the manuscript.

Funding

This research was funded by the National Natural Science Foundation of China (grant numbers 41703013, 41973066, and 41872146).

Data Availability Statement

Not applicable.

Acknowledgments

We are particularly grateful to the editor and reviewers for their comments and suggestions, which substantially improved the manuscript.

Conflicts of Interest

The authors declare no conflict of interest.

References

  1. Chen, S.Y.; Urban, P.L. Online monitoring of Soxhlet extraction by chromatography and mass spectrometry to reveal temporal extract profiles. Anal. Chim. Acta 2015, 881, 74–81. [Google Scholar] [CrossRef] [PubMed]
  2. Luque de Castro, M.D.; Priego-Capote, F. Soxhlet extraction: Past and present panacea. J. Chromatogr. A 2010, 1217, 2383–2389. [Google Scholar] [CrossRef] [PubMed]
  3. Li, Q.Q.; Chen, F.L.; Wu, S.Q.; Zhang, L.; Wang, Y.X.; Xu, S. A simple and effective evaluation method for lacustrine shale oil based on mass balance calculation of Rock-Eval data. Appl. Geochem. 2022, 140, 105287. [Google Scholar] [CrossRef]
  4. Dong, T.; He, S.; Yin, S.Y.; Wang, D.X.; Hou, Y.G.; Guo, J.G. Geochemical characterization of source rocks and crude oils in the Upper Cretaceous Qingshankou Formation, Changling Sag, southern Songliao Basin. Mar. Petrol. Geol. 2015, 64, 173–188. [Google Scholar] [CrossRef]
  5. Han, Y.J.; Poetz, S.; Mahlstedt, N.; Horsfield, B. On the release of acidic NSO compounds from the oil-mature Barnett Shale using different solvents. J. Petrol. Sci. Eng. 2020, 185, 106605. [Google Scholar] [CrossRef]
  6. Zhang, H.; Huang, H.P.; Li, Z.; Liu, M. Oil physical status in lacustrine shale reservoirs–A case study on Eocene Shahejie Formation shales, Dongying Depression, East China. Fuel 2019, 257, 116027. [Google Scholar] [CrossRef]
  7. Hashemi-Nasab, F.S.; Parastar, H. Pattern recognition analysis of gas chromatographic and infrared spectroscopic fingerprints of crude oil for source identification. Microchem. J. 2020, 153, 104326. [Google Scholar] [CrossRef]
  8. Xing, L.T.; Xu, L.; Zhang, P.Z.; Zhang, J.; Wang, P. Organic geochemical characteristics of saline lacustrine source rocks: A case study from the Yingxi area, Qaidam basin, China. Geochem. Int. 2022, 60, 92–108. [Google Scholar] [CrossRef]
  9. Li, Y.; Zhang, J.L.; Liu, Y.; Shen, W.L.; Chang, X.C.; Sun, Z.Q.; Xu, G.C. Organic geochemistry, distribution and hydrocarbon potential of source rocks in the Paleocene, Lishui Sag, East China Sea Shelf Basin. Mar. Petrol. Geol. 2019, 107, 382–396. [Google Scholar] [CrossRef]
  10. Stahl, W.J. Source rock-crude oil correlation by isotopic type-curves. Geochim. Cosmochim. Acta 1978, 42, 1573–1577. [Google Scholar] [CrossRef]
  11. Bjorøy, M.; Hall, K.; Hall, P.B.; Leplat, P.; Loberg, R. Biomarker analysis of oils and source rocks using a thermal extraction-GC-MS. Chem. Geol. 1991, 93, 1–11. [Google Scholar] [CrossRef]
  12. Yang, S.Y.; Qiao, H.G.; Cheng, B.; Hu, Q.H. Solvent extraction efficiency of an Eocene-aged organic-rich lacustrine shale. Mar. Petrol. Geol. 2021, 126, 104941. [Google Scholar] [CrossRef]
  13. Chen, J.P.; Deng, C.P.; Wang, H.T. Biomarker characteristics of extracts from source rocks in coal measures with different polarity solvents. Acta Geol. Sin. 2006, 80, 916–922, (In Chinese with English abstract). [Google Scholar]
  14. Armstroff, A.; Wilkes, H.; Schwarzbauer, J.; Littke, R.; Horsfield, B. Aromatic hydrocarbon biomarkers in terrestrial organic matter of Devonian to Permian age. Palaeogeogr. Palaeocl. 2006, 240, 253–274. [Google Scholar] [CrossRef]
  15. Guo, S.H.; Li, S.Y.; Qin, K.Z. CS2/NMP extraction of immature source rock concentrates. Org. Geochem. 2000, 31, 1783–1795. [Google Scholar]
  16. Lino, M.; Takanohashi, T.; Ohsuga, H.; Toda, K. Extraction of coals with CS2-N-methyl-2-pyrrolidinone mixed solvent at room temperature-Effect of coal rank and synergism of the mixed solvent. Fuel 1988, 67, 1639–1647. [Google Scholar]
  17. White, C.M.; Rohar, P.C.; Veloski, G.A.; Anderson, R.R. Practical notes on the use of N-methyl-2-pyrrolidinone as a solvent for extraction of coal_and coal-related materials. Energ. Fuel 1997, 11, 1105–1106. [Google Scholar] [CrossRef]
  18. Chervenick, S.W.; Smart, R.B. Quantitative analysis of N-methyl-2-pyrrolidinone retained in coal extracts by thermal extraction g.c.-m.s. Fuel 1995, 74, 241–245. [Google Scholar] [CrossRef]
  19. Parera, J.; Santos, F.J.; Galceran, M.T. Microwave-assisted extraction versus Soxhlet extraction for the analysis of short-chain chlorinated alkanes in sediments. J. Chromatogr. A 2004, 1046, 19–26. [Google Scholar]
  20. Li, Z.P.; Wang, X.B.; Li, L.W.; Zhang, M.J.; Tao, M.X.; Xing, L.T.; Cao, C.H.; Xia, Y.Q. Development of new method of δ13C measurement for trace hydrocarbons in natural gas using solid phase micro-extraction coupled to gas chromatography isotope ratio mass spectrometry. J. Chromatogr. A 2014, 1372, 228–235. [Google Scholar] [CrossRef]
  21. Deng, C.P.; Wang, H.T.; Chen, J.P.; Zhang, D.J. Chemical features of extracts from source rocks in coal measures with different polarity solvents. Petrol. Explor. Dev. 2005, 32, 48–52, (In Chinese with English abstract). [Google Scholar]
  22. Duan, Y.; Wu, B.X.; Xu, L.; He, J.X.; Sun, T. Characterisation of n-alkanes and their hydrogen isotopic composition in sediments from Lake Qinghai, China. Org. Geochem. 2011, 42, 720–726. [Google Scholar] [CrossRef]
  23. Yu, S.; Wang, X.L.; Xiang, B.L.; Ren, J.L.; Li, E.T.; Wang, J.; Huang, P.; Wang, G.B.; Xu, H.; Pan, C.C. Molecular and carbon isotopic geochemistry of crude oils and extracts from Permian source rocks in the northwestern and central Junggar Basin, China. Org. Geochem. 2017, 113, 27–42. [Google Scholar] [CrossRef]
Figure 1. Extraction yields of samples using TCM and DCM: MeOH.
Energies 15 09198 g001
Figure 2. The relative contents of fractions with different solvent: (a) TCM, (b) DCM: MeOH.
Energies 15 09198 g002
Figure 3. Gas chromatogram of saturated hydrocarbons in extracts from typical samples with different solvents (m/z 85 and m/z 191 mass fragments of the J101 and ZDS-09 samples, respectively). (a,c,e,g) Treated with TCM; (b,d,f,h) treated with DCM: MeOH.
Energies 15 09198 g003
Figure 4. Stable carbon isotopic type-curves (red and blue indicate that the samples were extracted with DCM: MeOH (9:1/v:v) and TCM, respectively).
Energies 15 09198 g004
Table 1. Total organic carbon (TOC) and pyrolysis data for source rock samples.
SamplesTOC
(%)
TS
(%)
Tmax
(°C)
S1
(mg/g)
S2
(mg/g)
S3
(mg/g)
HIOIPIMINC
(%)
ZSD-091.961.694430.4613.100.1367070.032.54
ZSD-161.201.474430.087.080.24589200.014.53
FY1-251.090.204570.861.680.19155180.341.61
FY1-107.381.204465.2014.160.3019240.270.82
BY-26.863.783850.050.060.15120.461.44
Cam-shale3.392.184440.380.530.291690.423.12
J-101 coal35.470.504291.3890.182.0225460.020.58
He-6 coal80.570.4445310.49141.943.4117640.071.08
G11-80.511.514260.502.640.19522380.161.86
G11-181.621.904300.967.780.35479220.110.93
TOC = total organic carbon; TS = total sulfur; Tmax = maximum peak temperature; S1 = free hydrocarbon content; S2 = pyrolyzed hydrocarbon content; S3 = pyrolyzed inorganic carbon content; HI = hydrocarbon index; OI = oxygen index; PI = production index; MINC = degree of mineral carbonization.
Table 2. Biomarker parameters for saturated hydrocarbons from TCM and DCM: MeOH extraction.
SampleSolventCarbon Number RangeMain Peak∑C22−/
∑C23+
Pr/PhPr/nC17Ph/nC18OEP1OEP2CPI
ZSD-09A 1C13–C39nC210.951.210.730.621.121.151.16
BC14–C35nC201.181.250.790.651.141.211.16
ZSD-16AC12–C39nC250.832.670.550.221.091.271.24
BC13–C36nC230.862.460.550.221.081.331.29
FY1-25AC13–C32nC162.571.510.150.101.001.031.07
BC12–C35nC163.911.650.160.110.991.051.10
FY1-10AC12–C32nC162.861.440.160.110.991.011.07
BC12–C33nC163.041.470.170.121.001.061.08
BY-2AC12–C21nC14n.d.1.270.450.740.90n.d.n.d.
BC14–C21nC16n.d.1.020.330.741.00n.d.n.d.
Cam-shaleAC12–C34nC273.961.080.120.121.011.031.06
BC15–C29nC273.821.050.440.260.691.861.94
J-101 coalAC12–C33nC231.327.692.130.251.001.481.69
BC13–C33nC231.116.862.200.280.971.521.66
He-6 coalAC12–C30nC1610.272.340.040.021.011.221.42
BC13–C29nC177.122.450.040.020.971.091.37
G11-8AC12–C36nC172.300.450.310.701.030.941.00
BC13–C33nC172.350.570.410.781.041.011.05
G11-18AC13–C37nC270.190.291.122.980.981.081.09
BC13–C34nC250.430.311.092.730.981.051.12
1 A, TCM extraction; B, DCM: MeOH (9:1, v:v) extraction. OEP 1 = ( C 15 + 6 C 17 + C 19 ) 4 ( C 16 + C 18 ) , OEP 2 = ( C 25 + 6 C 27 + C 29 ) 4 ( C 26 + C 28 ) , CPI = 1 2 ( C 25 + C 27 + C 29 + C 31 + C 33 C 26 + C 28 + C 30 + C 32 + C 34 + C 25 + C 27 + C 29 + C 31 + C 33 C 24 + C 26 + C 28 + C 30 + C 32 ) .
Publisher’s Note: MDPI stays neutral with regard to jurisdictional claims in published maps and institutional affiliations.

