Article

Experimental Study on Hydraulic Fracture Initiation and Propagation in Hydrated Shale

1
State Key Laboratory of Petroleum Resources and Engineering, China University of Petroleum, Beijing 102249, China
2
Research Institute of Petroleum Exploration and Development, PetroChina Company Limited, Beijing 100083, China
3
China National Logging Corporation, Beijing 100101, China
*
Author to whom correspondence should be addressed.
Energies 2022, 15(19), 7110; https://doi.org/10.3390/en15197110
Submission received: 30 August 2022 / Revised: 22 September 2022 / Accepted: 24 September 2022 / Published: 27 September 2022
(This article belongs to the Special Issue New Progress in Unconventional Oil and Gas Development)

Abstract

:
Shale reservoirs contain a certain amount of clay minerals, which can hydrate through imbibition when in contact with various water-based fluids during drilling and completion. Shale hydration can lead to structural changes in the shale such as the expansion of bedding planes and propagation of microfractures, consequently affecting the initiation and propagation of hydraulic fractures. However, the effect of shale hydration under confining pressure on hydraulic fracture propagation and stimulation effect is still unclear. To this end, a novel experimental method integrating shale hydration and hydraulic fracturing was proposed based on the laboratory triaxial hydraulic fracturing simulation system. This method enables a more realistic simulation of shale hydration and hydraulic fracturing process happening in downhole conditions. The experimental results show that under simulated reservoir conditions, water imbibition increases over time with the imbibition rate reaching its peak within 24 h. The breakdown pressure, number of fractures, and complexity of fractures are positively correlated with imbibition time. The increase in fracture complexity could be attributed to the increase in the number of fractures. In contrast, imbibition pressure (injection pressure for imbibition) has little influence on water imbibition. For specimens under different imbibition pressure, the breakdown pressure and the number of fractures are close, and the complexity of fractures does not change prominently; all are T-shaped fractures. It is believed that the closure of microfractures under confining pressure caused by hydration is the main reason for the increase in breakdown pressure. Higher breakdown pressure means higher net pressure in the wellbore, which facilitates fracture initiation where the breakdown pressure is higher. Therefore, shale hydration is conducive to the initiation of multiple fractures, thus increasing the number and complexity of fractures.

1. Introduction

Shale gas wells generally have no natural productivity and need hydraulic fracturing to break down the reservoir matrix to form a complex fracture network for commercial development [1]. Shale reservoirs often contain a certain amount of clay minerals, which can hydrate when in contact with with water-based fluid during drilling and completion [2]. Previous studies have shown that shale hydration promotes the generation of secondary fractures in shale, thus forming a relatively complex fracture network [3,4]. Therefore, it is of great significance to investigate the hydraulic fracture propagation behavior in hydrated shale under confining pressure for optimization of fracturing design.
Shale hydration in the matrix generally includes two stages: (1) water-based fluid enters shale microfractures and pores through imbibition and convection; (2) hydration occurs when the water-based fluid contacts with clay minerals in the shale matrix. In the first stage, spontaneous imbibition plays a major role. Spontaneous imbibition refers to the process of the wetting phase displacing the non-wetting phase in porous media, and the main driving force is capillary force [5,6]. Shale has very small pore diameters and large capillary force, which can be as high as several hundred psi [7]. Capillary force drives water to enter pores, open bedding planes, and expand natural microfractures in shale. Many studies have been done on shale spontaneous imbibition. Spontaneous imbibition is mainly affected by rock pore properties, fluid properties, and physical and chemical interactions between fluid and rock, including rock porosity, permeability, pore structure, wettability, rock-fluid contact area, fluid viscosity, interfacial tension, initial water saturation, gravity and other factors [8,9]. To date, the imbibition experiment and imbibition mathematical model are two main research techniques for studying imbibition. Handy deduced the relationship between imbibition rate and time using the classical percolation theory and concluded that the square of cumulative imbibition volume was proportional to time, which was supported by experiments [10]. Gupta et al. [11] and Martin et al. [12] also verified this conclusion through experiments. Further considering gravity and properties of rock and fluid, Kewen and Roland [10] theoretically deduced the relationship between imbibition rate and properties of rock and fluid, and used experimental data to verify the theory. The study concluded that the imbibition rate was linearly correlated with the reciprocal of the recovery percent (the ratio of the amount of imbibition to the total volume of pores). At present, spontaneous imbibition is investigated mainly to calculate the water flooding recovery, determine the rock wettability and understand the post-fracturing flowback mechanism of fracturing fluid, etc. [13,14,15].
Water-based fluid enters shale pores or microfractures through imbibition and hydration occurs when it encounters clay minerals. Shale hydration mainly refers to the entry of water molecules into the lamellar layers of expellable clay minerals (such as montmorillonite) to form a diffusive double electric layer, which expands under the action of repulsive force of the double electric layer and osmotic pressure [16,17]. In the field of petroleum engineering, the study of clay hydration initially focused on drilling and water-flooding. Clay hydration leads to wellbore enlargement and even collapse in drilling operations [18,19], while in water flooding, hydration can cause damage to water-sensitive formations, resulting in lower permeability and productivity [20,21]. In recent years, the development of hydraulic fracturing technology for unconventional reservoirs has prompted more and more scholars to study the characteristics of hydration damage in shale formations. Studies have shown that the deformation of montmorillonite and illite/smectite mixed layer under hydration is greater than that of illite and kaolinite [3]. In the absence of confining pressure, hydration causes microfractures in shale to spread, thereby increasing the permeability of the formation and thus increasing productivity [22,23]. On the contrary, under confining pressure, natural microfractures tend to close under hydration [22]. In order to clarify the influence of shale hydration on hydraulic fracturing, it is necessary to conduct the shale hydration experiment followed by the hydraulic fracturing experiment in the same specimen.
At present, the study of shale hydration has made certain progress in the aspects of enhanced oil recovery, wellbore stability, and post-fracturing flowback. However, little has been done on the effect of shale hydration under confining pressure on hydraulic fracture propagation and stimulation effect. The influence of shale hydration on fracture propagation during hydraulic fracturing under high confining pressure is still unclear. Since fracture width, numbers, tortuosity, and distribution, which all relate to fracture propagation, have a great impact on the fracture conductivity and hence the productivity of the formation, investigation of the effects of shale hydration on fracture propagation is necessary for optimization of the hydraulic fracturing design and enhancement of the stimulation effect. Taking the above-mentioned together, we conducted a shale hydration experiment followed by a hydraulic fracturing experiment under simulated formation stress in Longmaxi shale based on a laboratory hydration and fracturing simulation system. Then the effects of shale hydration, including hydration time (duration of the shale hydration) and hydration pressure (pressure applied to the fluid during the hydration experiment), on breakdown pressure, numbers, and morphology of the fractures, and the stimulation effect were studied through CT scanning and pressure analysis, which suggested a link between the two processes. It is expected that the results can provide a reference for the hydraulic fracturing design of shale.

2. Experimental Setup and Methods

2.1. Mineral Composition and Mechanical Properties of Longmaxi Shale

The mineral composition of Longmaxi shale was analyzed through an X-ray diffractometer. Quartz (39.7%) and clay minerals (29.1%) are two dominant minerals of Longmaxi shale in the Changning area. Other minerals include calcite, dolomite, and a small amount of feldspar and pyrite. Illite is the main clay mineral, with a relative content of 72.3%, followed by an illite/smectite mixed layer of 12.4% (relatively), and chlorite of 15.3% (relatively). According to Zhang et al., the illite/smectite mixed layer has a strong hydration potential, so it is feasible to use Longmaxi shale in Changning area for the hydration experiment [2,14]. The comprehensive test system of rock mechanics was used to conduct the triaxial compression test, and the samples for the rock mechanical test were cored in the direction perpendicular to bedding planes. The tested samples are shown in Figure 1. The average Young’s modulus is 25.84 GPa, Poisson’s ratio is 0.23, compressive strength is 135.6 Mpa, tensile strength is 6.1 Mpa, cohesive force is 24.59 Mpa, and the internal friction angle is 33.2°. Those mechanical properties are close to those of downhole cores [24]. The average brittleness index [25] calculated based on energy evolution is 0.44, indicating strong brittleness. The specific results are shown in Table 1.

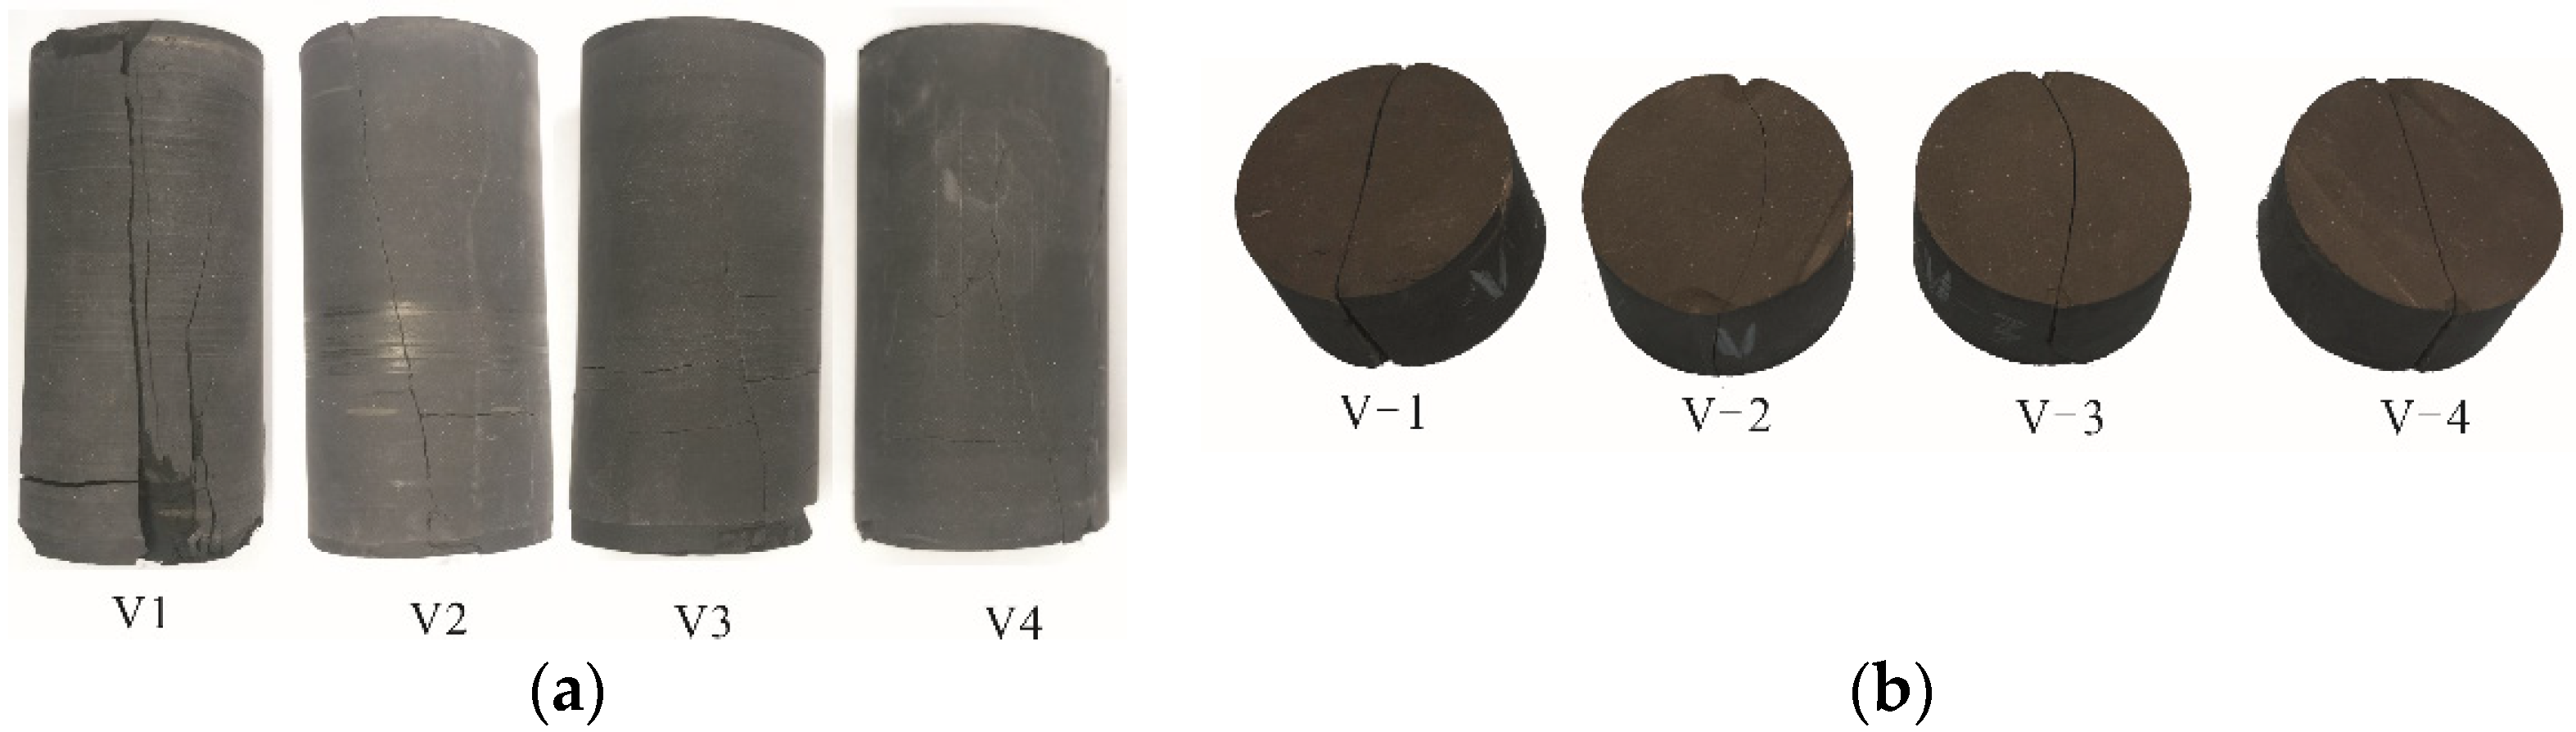
2.2. Specimen Preparation and Experimental Scheme

The specimen for the hydration and hydraulic fracturing experiment was processed from outcrop rocks, which were collected from the same part of an underground pit (20 m below the surface). In this way, the degradation of mechanical parameters caused by weathering could be minimized, and the physical properties of each specimen could be as close as possible. The outcrop rocks were cut into a cuboid of 8 cm × 8 cm × 10 cm with the bedding plane perpendicular to the 8 cm × 8 cm surface by CNC (computer numerical control) and wire cutting machine (model DL7750). In the center of the 8 cm × 8 cm surface, a drill bit with an outer diameter of 1.5 cm was used to drill a blind hole with a depth of 5.3 cm to simulate the horizontal well, as shown in Figure 2a. A steel pipe with an outer diameter of 1.3 cm, an inner diameter of 0.6 cm, and a length of 5.3 cm was used as the casing. The exterior of the steel tube was processed with the shape of screw thread, which increased the contact area between the epoxy resin and the pipe. The casing just acts as a bolt and the bonding strength of the epoxy can be enhanced further. Teflon tape was wound around the casing shoe to simulate the packer. The casing was then fixed in the blind hole 1 cm above the surface of the specimen, so that a 1 cm open hole section was formed at the bottom of the blind hole. The Teflon tape acted as a packer to create an effective barrier between the open hole section and the section above it, thus preventing cementing glue from entering the open hole section. High-strength epoxy resin glue was prepared and injected into the annular of the casing and blind hole to simulate cementing. The completion diagram is shown in Figure 2b. After 48 h of solidification, a specimen for hydration and hydraulic fracturing was ready for use, as shown in Figure 2c. Six shale specimens were prepared by the above method.
According to the actual formation stress of Longmaxi [24] and considering the stress contrast and the performance of the equipment, the maximum horizontal stress (σH) was set as 18 MPa, the minimum horizontal principal stress (σh) was set as 3 MPa, and the vertical stress (σv) was set as 20 MPa. The energy similarity criterion proposed by Savitski and Detournay was used to set the injection parameters.
κ = K t 2 μ 5 Q 3 E 13 1 / 18
where K = 4 2 π 1 / 2 K I C , E = E 1 ν 2 , μ = 12 μ , Q is pumping rate, KIC is the fracture toughness of rock, E is Young’s modulus of rock, ν is Poisson’s ratio, and μ is the viscosity of fracturing fluid. When k ≥ 4, the hydraulic fracture propagates in the toughness-dominated mode. When k is less than or equal to 1, the fracture propagation is viscosity dominated. When 1 < k < 4; the fracture propagates in the transition mode. Since the pumping rate in the field (8–10 m3/min) is much greater than the pumping rate in the experiment (1–200 cm3/min), according to the energy similarity criterion, the fracture in the field propagates in the viscosity-dominated mode, that is, the energy is mainly dissipated in the viscous flow of fracturing fluid during fracturing. Due to the limitations of the experimental equipment, laboratory experiments cannot provide as high a pumping rate as the field, so the fracture propagation in laboratory experiments is generally in the toughness-dominated mode. In this experiment, we focus on the initiation and early-stage propagation of the fracture, during which the fracture propagation is close to the toughness-dominated mode. Thus, the experimental parameters were appropriate in terms of propagation mode.
The six specimens fell into 3 groups. Specimen 1# was used as the control group without hydration. Group 2 consists of specimens 2#, 3#, and 4#, whose hydration pressures were set as 2, 3, and 4 MPa, respectively, to study the influence of hydration pressure. Group 3 includes specimens 3#, 5#, and 6#, and the hydration times of 3#, 5#, and 6# were set as 24, 48, and 72 h, respectively, to study the influence of hydration time. Deionized water was used as the hydration fluid, guar with a viscosity of 100 mPa·s was used as the fracturing fluid, and the injection rate was 5 mL·min−1. The specific experimental scheme is shown in Table 2.

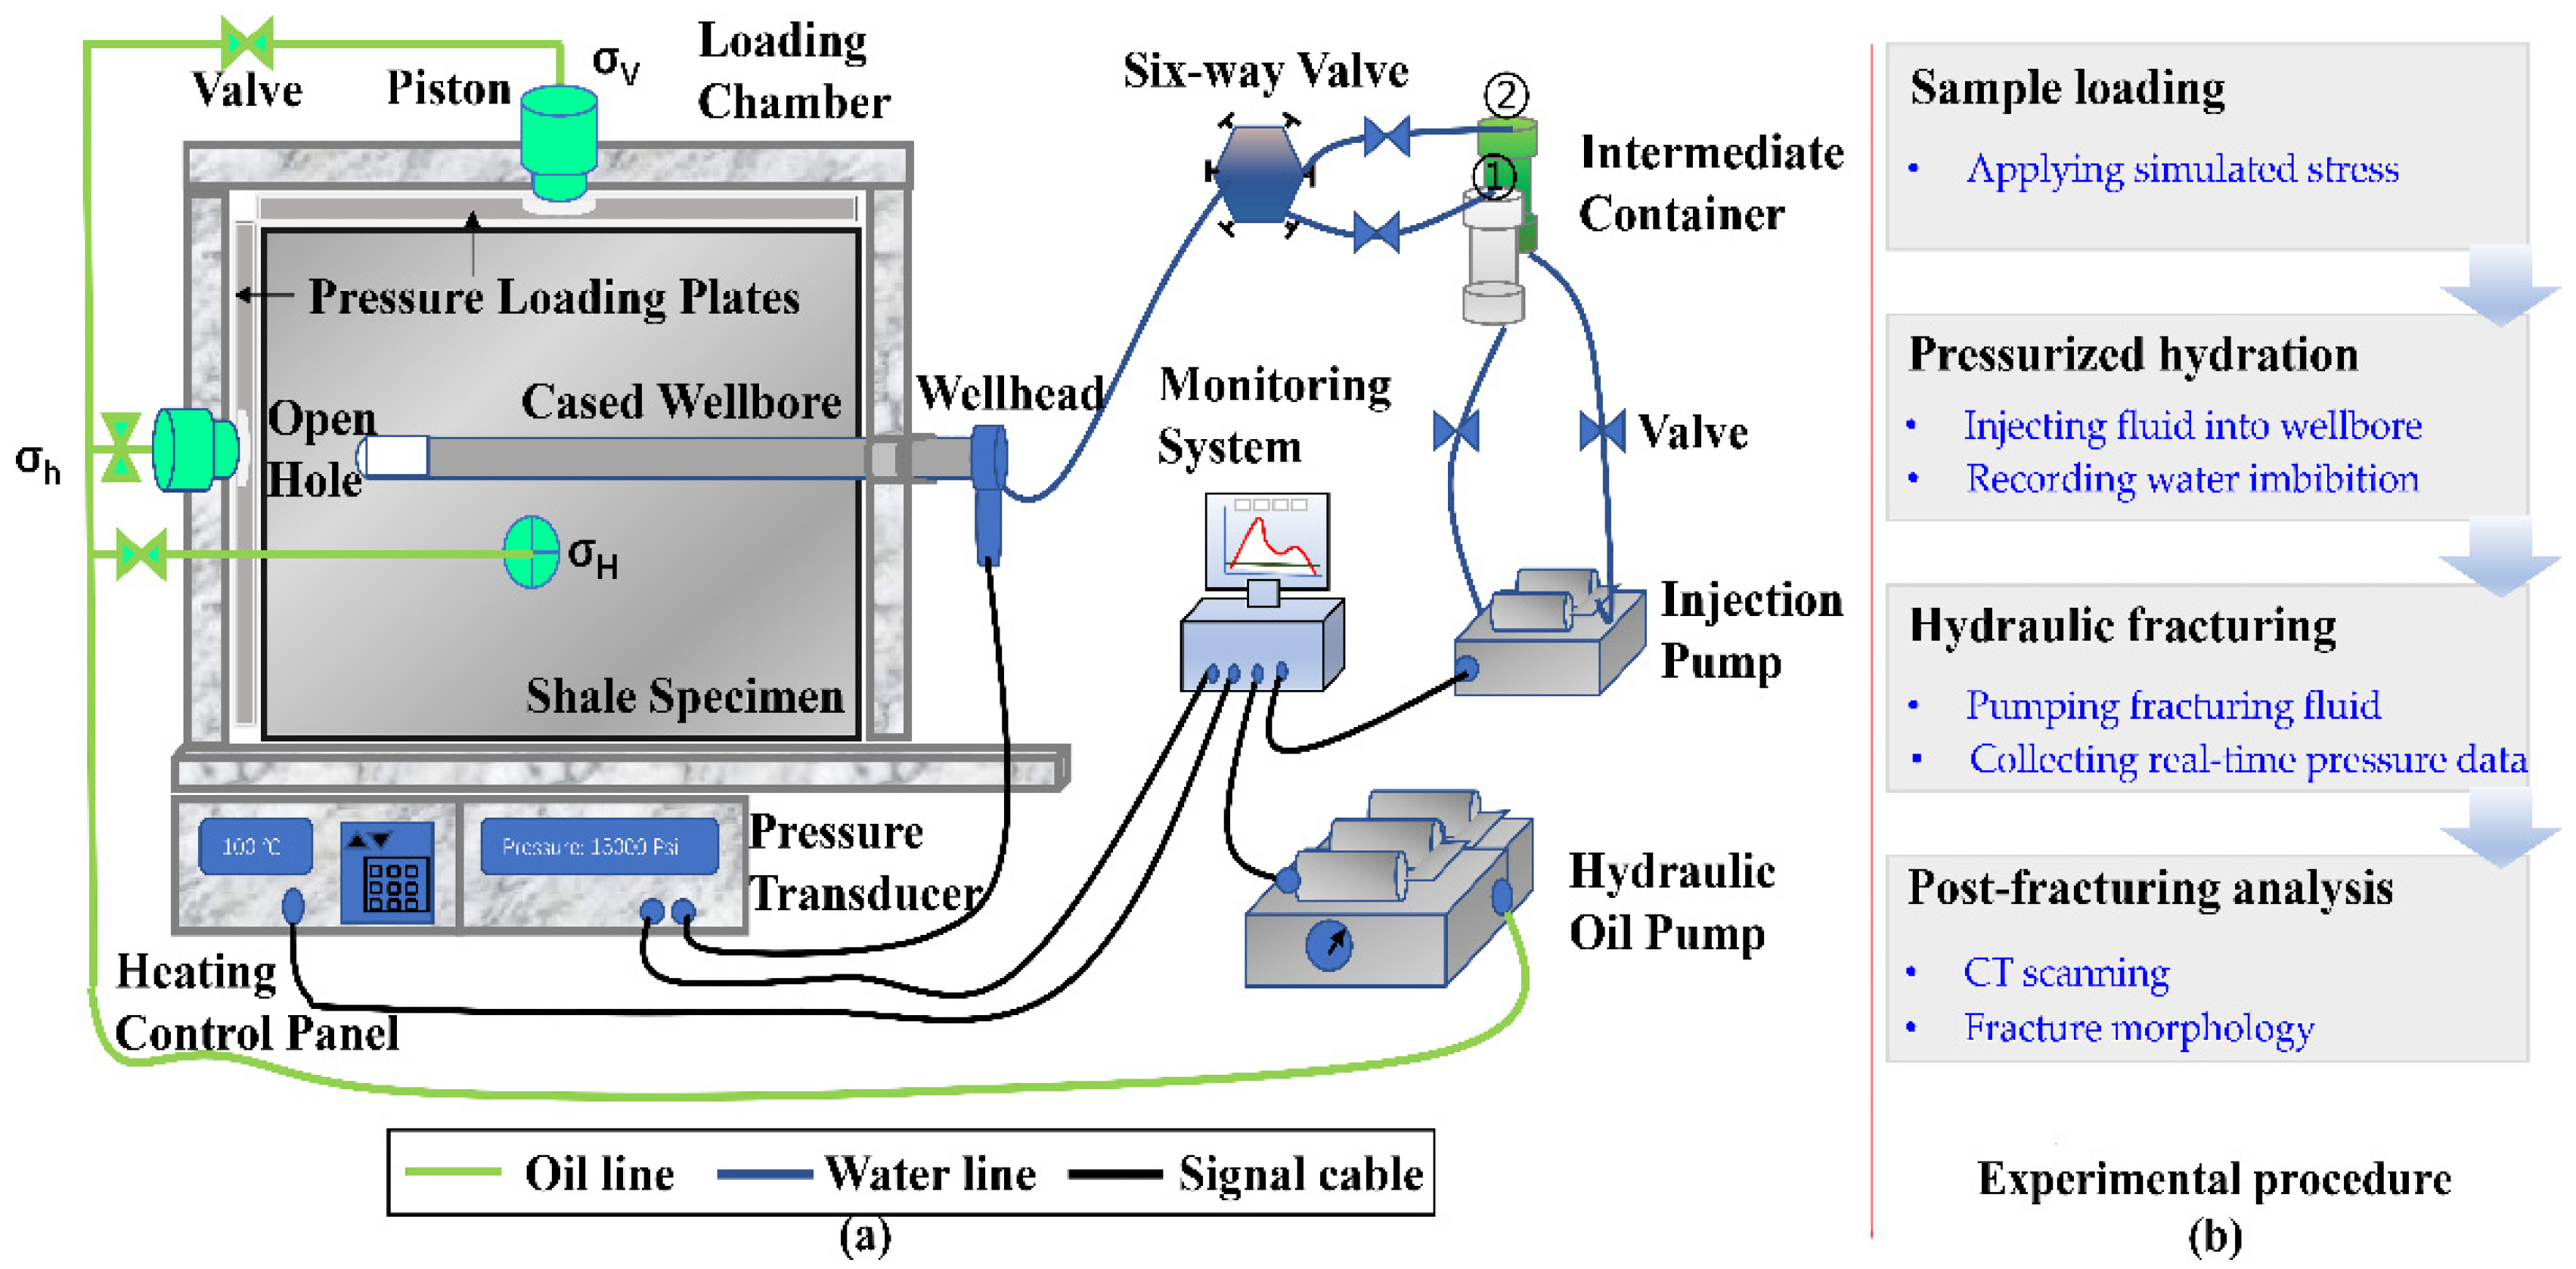
2.3. Experimental Equipment and Procedures

The shale hydration experiment and the hydraulic fracturing experiment were carried out using a set of small-size true triaxial hydraulic fracturing devices, which included the specimen chamber, the hydraulic stress loading system, the injection pump, fracturing fluid intermediate container, data acquisition system, and auxiliary devices, etc. (see Figure 3).
The key procedures of the experiment are as follows:
(1) Sample loading. The specimens are placed into the specimen chamber and the simulated formation stresses are loaded synchronously through the hydraulic stress loading system. Considering horizontal well fracturing, the direction of σh is parallel to the wellbore. σv is perpendicular to the bedding plane, and σH is perpendicular to both aforementioned directions. Apply pressure slowly in all three directions at the same time. When the confining pressure in all directions reaches the set value of σh (3 MPa), close the valve in this direction and continue to apply pressure in the other two directions. Repeat the above steps until the pressure in all three directions has reached the set value.
(2) Pressurized hydration. Add deionized water to the intermediate container ① and open the valve of the six-way valve to the intermediate container ① and the valve between the pump and the intermediate container ①, leaving the other valves closed. The injection pump is set in the constant-pressure mode. Start the pump, and the specimen is pressurized with deionized water. In this process, the real-time water imbibition under constant pressure is recorded by the data acquisition system. When the set hydration time is reached, turn off the injection pump, relieve the pressure, and draw the deionized water out of the wellbore with a syringe.
(3) Hydraulic fracturing. The fracturing fluid is prepared according to the experimental scheme and mixed with the green fluorescent agent to facilitate fracture observation. The fracturing fluid is then poured into the intermediate container ②. When the hydration experiment is over, switch the six-way valve, so that the specimen and the intermediate container ② are connected to the injection pump. When the pressure rises to 1 MPa, turn off the pump and check for leakage. If the pressure does not drop in 3 min, start the pump again. During this period, the data acquisition system collects pressure and other data.
(4) Post-fracturing analysis. At the end of the experiment, close the injection pump and relieve the pressure. Then shut the hydraulic oil pump to unload the specimen from the chamber. Take out the fractured specimen. The fractures inside and outside the sample were comprehensively analyzed through pressure curves, fluorescence agent distribution, and CT scanning.

3. Experimental Results and Analysis

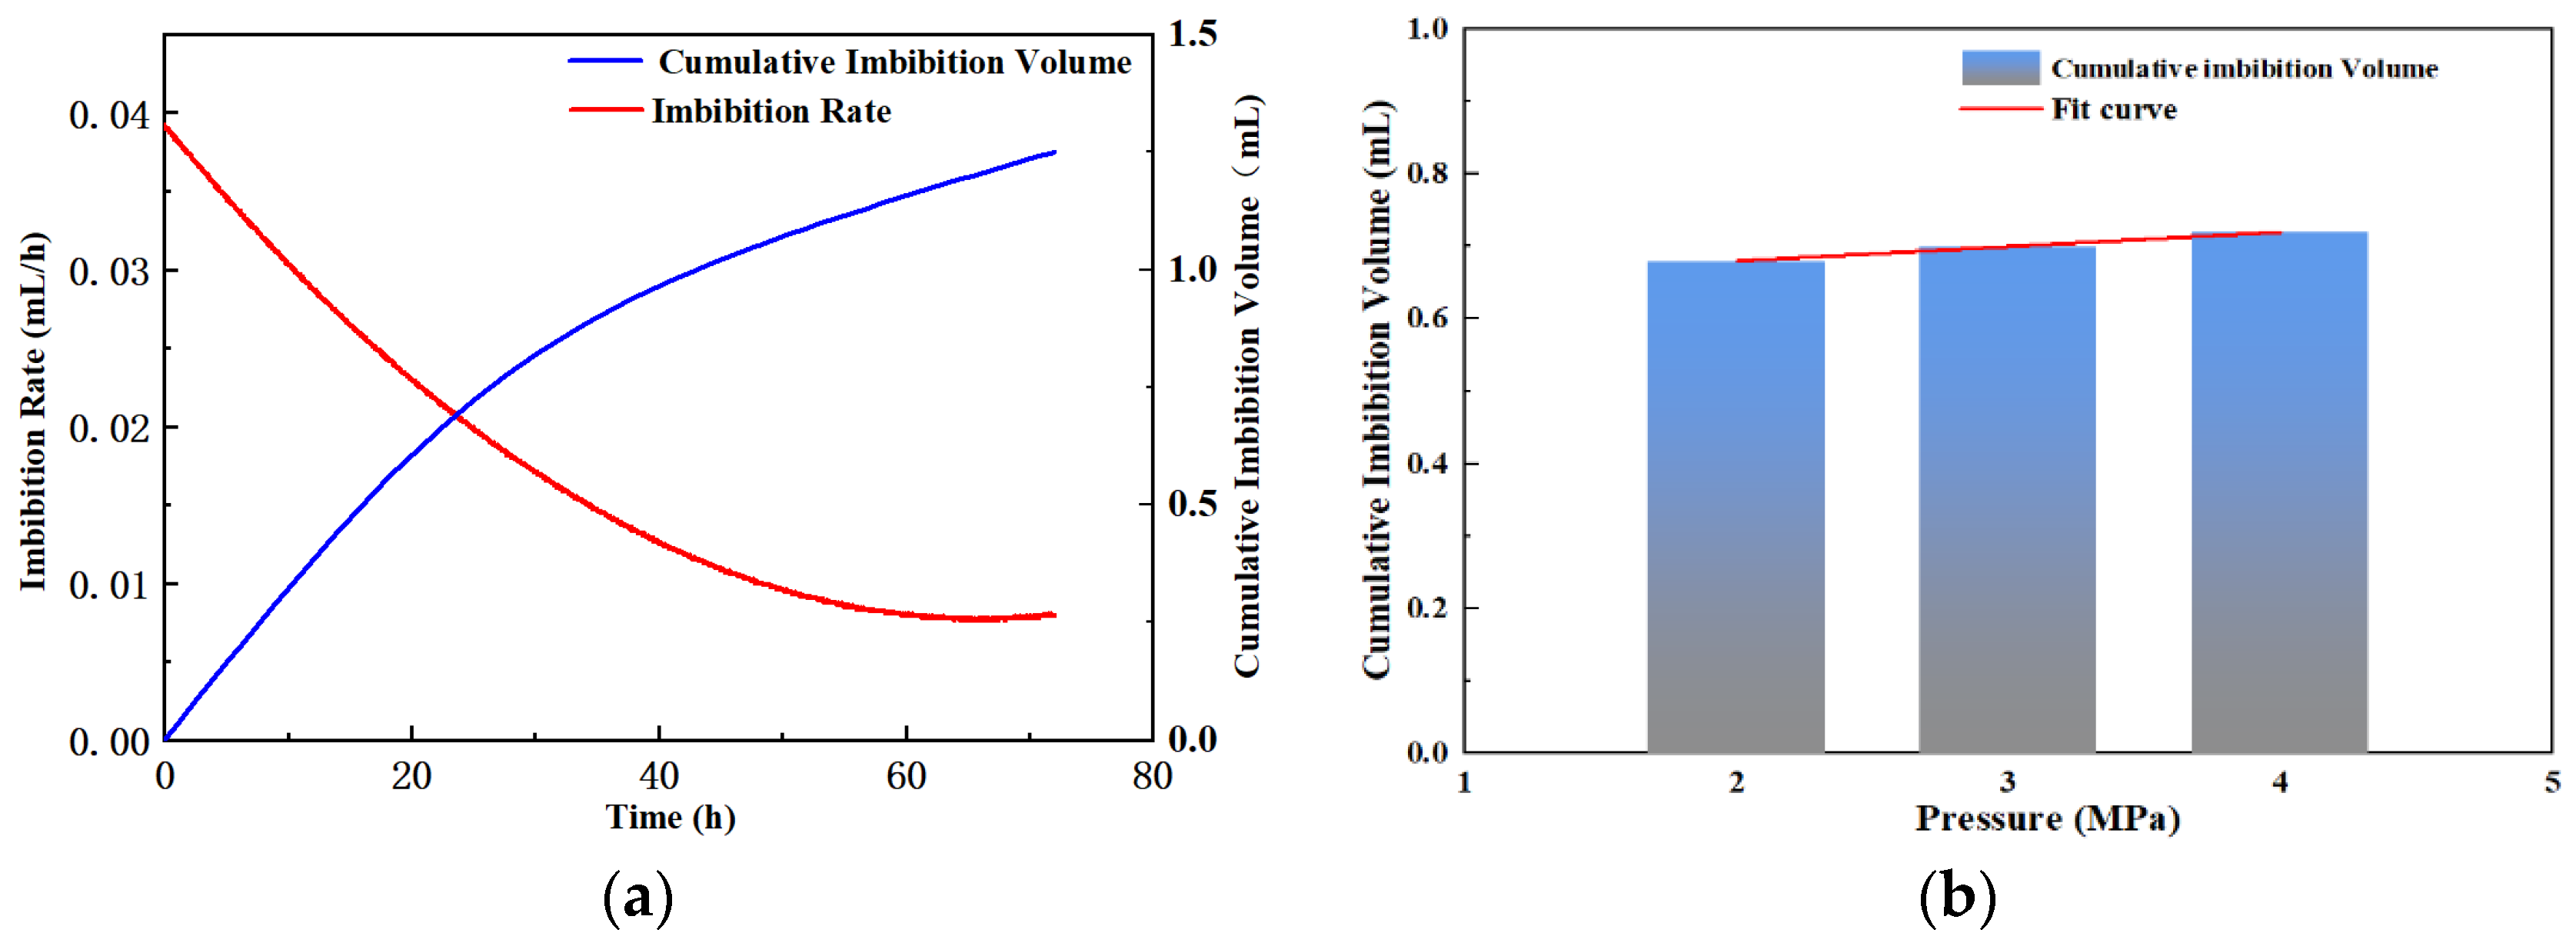
3.1. Water Imbibition Volume

During the hydration, the data acquisition system recorded the accumulated water imbibition in real time. According to the cumulative water imbibition curve (Figure 4a), the water imbibition volume increased with time. The imbibition rate decreased with time and nearly 70% of water was imbibed within 24 h. It is concluded that in the early stage of water imbibition, the liquid first quickly entered the micro-cracks and dents in the surface of the open hole section, so the imbibition rate was relatively high. Then the liquid entered the pores gradually through capillary force. Capillary force is related to water saturation and decreases with the increase of water saturation. Hence, the imbibition rate decreased with time. Studies have also shown that under confining conditions, microfractures in shale tend to close during hydration, so the imbibition rate will further decrease [22]. However, within the same hydration time, considering the influence of hydration pressure on water imbibition volume, there is no obvious correlation between water imbibition and hydration pressure, and the water imbibition volume under different hydration pressure was similar, as shown in Figure 4b. Because the permeability of Longmaxi shale is extremely low (~10 nD), according to Darcy’s law, increasing the injection pressure does little to the water imbibition. The amount of water imbibed into the shale matrix mainly depends on capillary force, so the hydration pressure has a limited contribution to the amount of water imbibed.

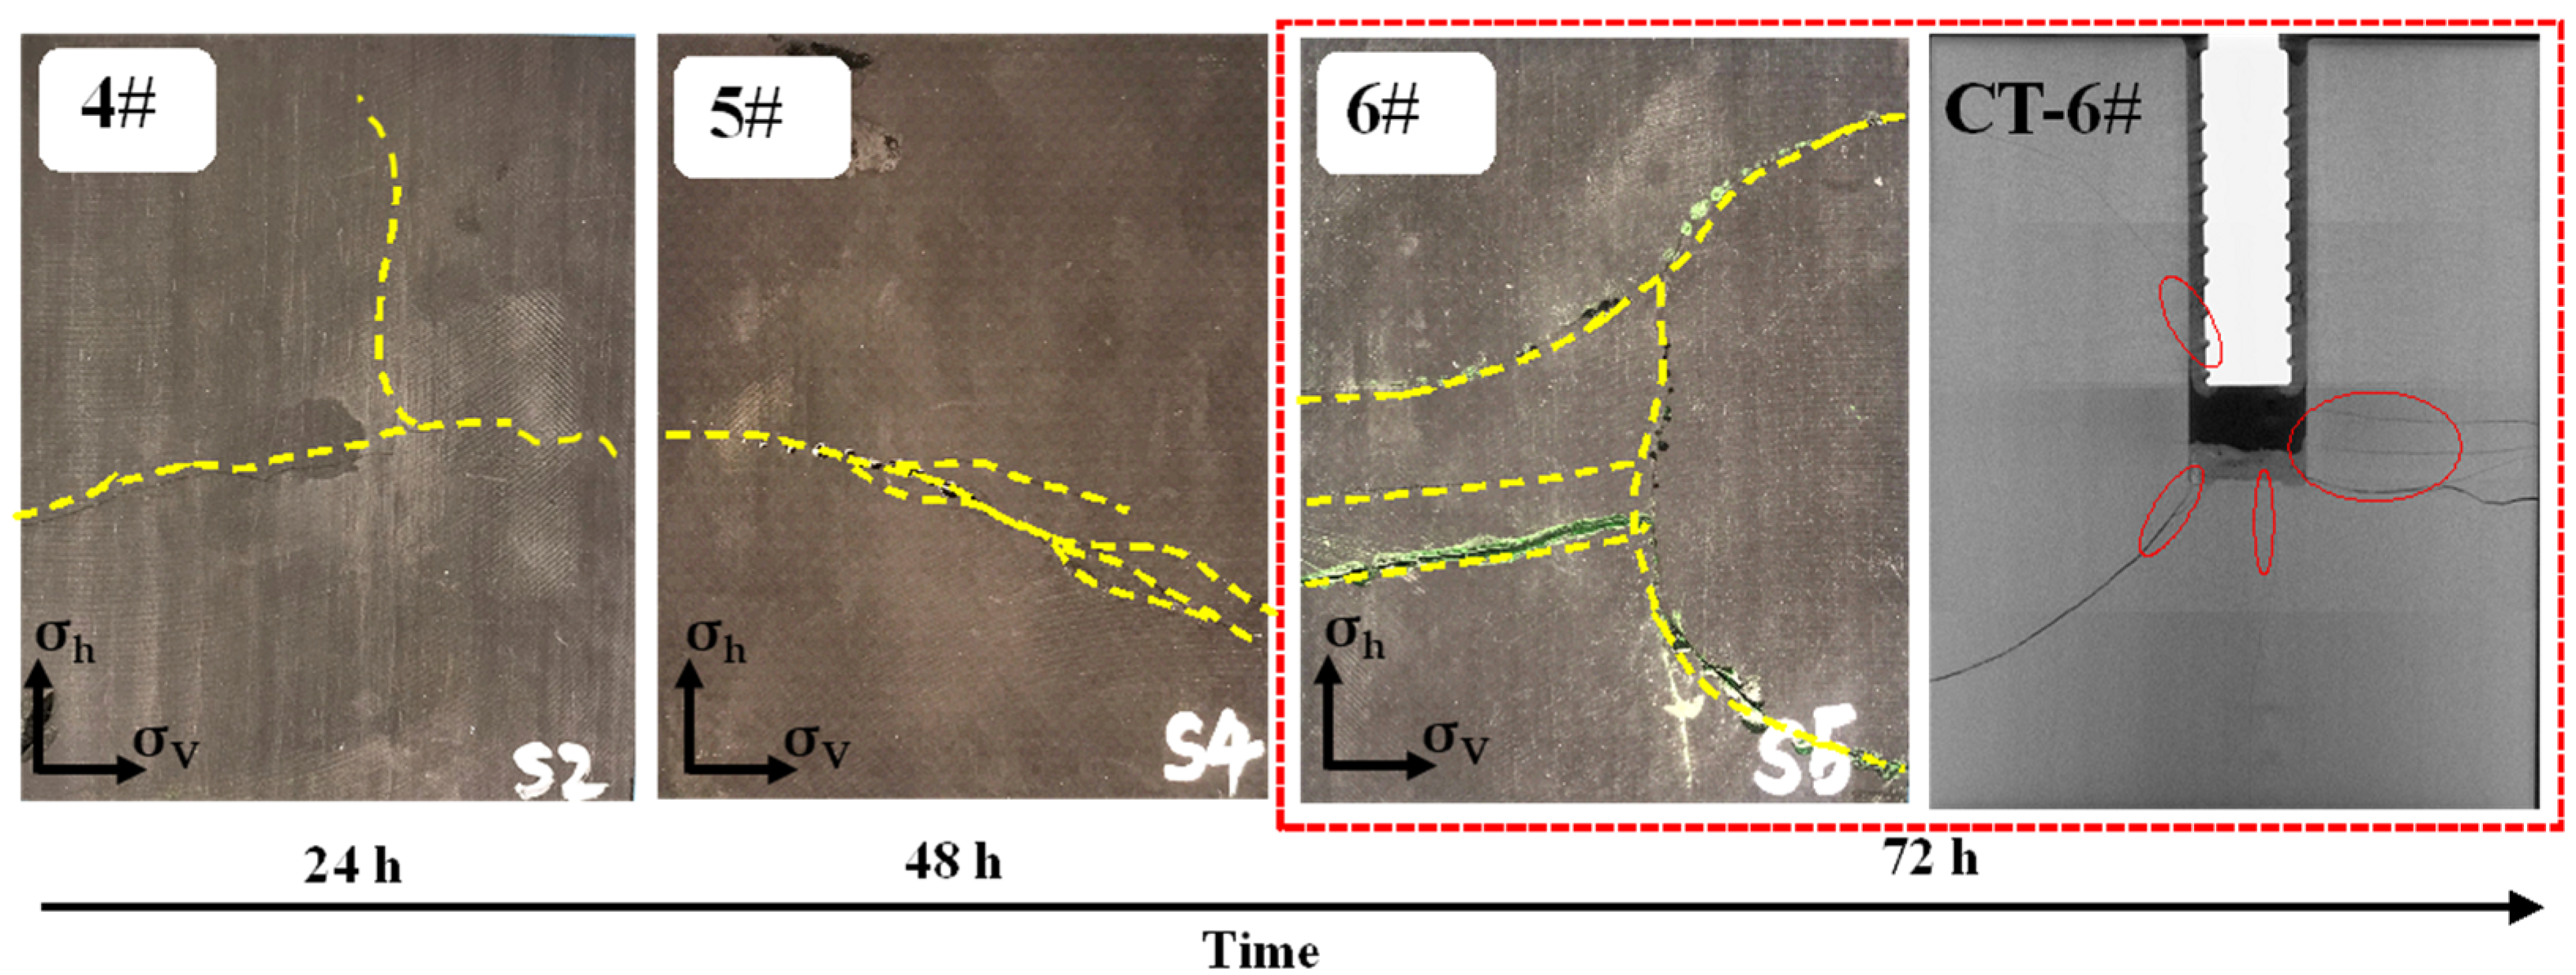
3.2. Fracture Morphologies and Pressure Curves

After fracturing, the fracturing fluid on the surfaces of the specimen was cleaned, and the fracture morphology on the surfaces of the specimen was identified based on the distribution of the fluorescent agent. The internal fracture morphology and the initiation point of the specimen were acquired using a CT scanner (model: GE phoenix v | tome | x m, resolution < 1 μm). Based on the internal and external distribution of the fractures, the overall fracture morphology can be categorized into three types: the simple fracture, the T-shaped fracture, and fracture networks. The fracture morphologies for each specimen are listed in Table 3. All pressure curves showed clear breakdown pressure. Some of the pressure curves fluctuated slightly, with the breakdown pressure ranging between 24.8 MPa and 46.4 MPa. Hydration has a great influence on the breakdown pressure.

3.3. Effect of Shale Hydration on Fracture Morphology and Breakdown Pressure

The effects of hydration pressure and hydration time on fracture initiation and propagation were analyzed based on fracture morphologies, CT scanning, and pressure curves. Specimen 1# was used as the control group, which was not hydrated. A transverse fracture extending along the direction of maximum horizontal principal stress was formed (Figure 5). Compared with the hydrated specimen, the breakdown pressure of specimen 1# is the lowest and the fracture morphology is the simplest. Therefore, it is safe to say that hydration can increase the breakdown pressure and the complexity of fractures to a certain extent. The detailed impact is analyzed as follows.

3.3.1. Effect of the Hydration Pressure

The main driving force of imbibition is capillary force. Hydration pressure can push fluid into the shale matrix as the driving force of percolation. To study the influence of hydration pressure on fracture propagation, specimens 2#, 3#, and 4# were used to carry out fracturing experiments under different hydration pressures. The fracture morphologies of the fractured specimens are shown in Figure 6. After fracturing, a transverse fracture was formed and a bedding plane was activated in all three specimens, showing a T-shaped morphology. The activated bedding plane of specimen 4# was deflected by stress during propagation. The breakdown pressures of specimens 2#, 3#, and 4# were 28.7 MPa, 30.0 MPa, and 27.9 MPa, respectively. Compared with the unhydrated specimen 1#, the breakdown pressures were increased by 3.9 MPa, 4.2 MPa, and 3.1 MPa, respectively, presenting a similar increment. According to Figure 3b, the water imbibition of the three during hydration is also similar, indicating that their hydration degree is similar. Therefore, hydration pressure has little influence on water imbibition during shale hydration. Hence, the increase in breakdown pressure is similar and the resulting fractures are alike in terms of morphology. It is concluded that the Longmaxi shale in Changning area has extremely low permeability and poor pore connectivity, where water imbibition mainly depends on the capillary force. Therefore, the hydration pressure has little effect on the hydration, and increasing the hydration pressure has a limited effect on improving the fracture complexity.

3.3.2. Effect of the Hydration Time

Specimens 4#, 5#, and 6# were used to analyze the role hydration time played in hydraulic fracturing. The hydration pressures of the three specimens were set as 3 MPa, and the hydration time was set as 24 h, 48 h, and 72 h, respectively. The water imbibition, breakdown pressure, and the number of fractures of the three specimens are shown in Table 3, and the fracture morphologies after fracturing of the three specimens are shown in Figure 7. Comprehensive analysis shows that with the increase of hydration time, the amount of water imbibition increases during hydration, and the breakdown pressure also increases significantly. As can be seen from Figure 7, with the increase in hydration time, the number and complexity of fractures on the surfaces of the three specimens also increased accordingly. Specimen 4# formed a T-shaped fracture. Specimen 5# formed three transverse fractures, which merged into one during propagation. There were three transverse fractures and one activated bedding plane on the surface of specimen 6#, and the bedding plane deviated gradually in the direction of maximum horizontal stress. The CT scan of specimen 6# showed that there were 6 fractures initiated in the open hole, with the largest number of fractures and the highest complexity. Through the comparative analysis, it can be seen that the degree of hydration increases with hydration time, and the number of closed microfractures increases under confining pressure, which leads to an increase in breakdown pressure. Higher breakdown pressure results in higher net pressure. Under higher net pressure, the fracture can initiate where the breakdown pressure is higher, which otherwise would not initiate in the low net pressure condition, rendering an increase in the number of fractures. Based on the above analysis, we conclude that increasing hydration time can increase the number and complexity of fractures to a certain extent.

4. Discussions

In this paper, we analyzed the influence of hydration time and hydration pressure on shale hydration and hydraulic fracture propagation behavior by CT scanning and pressure curve analysis through the experiment. According to the experimental results, with the increase of hydration time, the amount of water imbibition during hydration also increases, and the water imbibition rate shows a decreasing trend. After hydration, the breakdown pressure of the specimen increases, which may be attributed to the closure of the microfractures in the open hole section. However, the hydration pressure has little effect on water imbibition and shale hydration, and the possible reason is that the main driving force of shale hydration is capillary force. Due to the extremely low permeability of Longmaxi shale, increasing hydration pressure has little effect on water imbibition.
We also investigated the influence of hydration on the initiation and propagation of hydraulic fractures from a macro perspective. Due to the extremely low permeability and poor pore connectivity of Longmaxi shale in Changning area, the hydration pressure has little effect on shale hydration, and increasing the hydration pressure has a limited effect on improving the fracture complexity. In contrast, the degree of hydration increases with hydration time, resulting in more micro-fractures closure. Consequently, a higher breakdown pressure was obtained, rendering a higher net pressure. In this condition, the fracture can initiate where the breakdown pressure is higher, which otherwise would not initiate in the low net pressure condition. Thus, increasing hydration time can increase the number and complexity of fractures to a certain extent. However, the quantitative analysis and microscopic mechanism still need to be further clarified. In the future, it is necessary to use scanning electron microscopy and other microscopic means to deeply analyze the hydration mechanism, including hydration stress and strain, and quantitative analysis of microfractures under hydration, to make the experimental results more universal. In addition, further study is needed regarding the practical effects of hydration in field operation, for example, reducing the negative effects of hydration such as high operation pressure.

5. Conclusions

We have conducted the hydration experiment and true triaxial hydraulic fracturing experiment successively using Longmaxi shale in Changning area, and the following understandings have been formed:
  • Under confining pressure, the water imbibition volume increases with the hydration time, and the water imbibition rate reaches the peak within 24 h and then slows down.
  • The breakdown pressure, the number of fractures, and the complexity of fractures are positively correlated with hydration time, and the increase in fracture complexity is mainly due to the increase in the number of fractures. The hydration pressure has little effect on the water imbibition during hydration. Under different hydration pressures, the breakdown pressure and the number of fractures are similar, and the complexity of fractures does not change significantly; all are T-shaped fractures.
  • Microfracture closure during hydration is the main reason leading to the increase of breakdown pressure under the action of confining pressure. Higher breakdown pressure is beneficial to activate multiple microfractures in the open hole section, thus increasing the number and complexity of fractures.
  • In the future, it is necessary to use scanning electron microscopy and other microscopic means to analyze the hydration mechanism in depth, including hydration stress and strain, and to quantitatively analyze the activation of microfractures under hydration, in order to make the experimental results more universal.

Author Contributions

Conceptualization, J.M. and Y.Z.; Investigation, B.G. and G.D.; Methodology, G.D.; Data curation, L.Y. and Y.H.; Project administration, Y.Z. and J.M.; Visualization, B.G.; Writing—original draft, B.G.; Writing—review and editing, B.G. and G.D. All authors have read and agreed to the published version of the manuscript.

Funding

This research received no external funding.

Data Availability Statement

Not applicable.

Conflicts of Interest

The authors declare no conflict of interest.

Nomenclature

σhMinimum horizontal principal stress, MPa
σHMaximum horizontal principal stress, MPa
σVVertical stress, MPa
QPumping rate, mL/min
PbBreakdown pressure, MPa
μViscosity of the fracturing fluid, mPa⸱s
EYoung’s modulus, GPa
KICFracture toughness of rock, MPa⸱m1/2
νPoisson’s ratio, dimensionless
tTime, s
CNCComputer numerical control

References

  1. Dong, D.; Zou, C.; Yang, H.; Wang, Y.; Li, X.; Chen, G.; Wang, S.; Lü, Z.; Huang, Y. Progress and prospects of shale gas exploration and development in China. Acta Pet. Sin. 2012, 33 (Suppl. S1), 107–114, 9. [Google Scholar]
  2. Zhang, S.; Sheng, J.J.; Qiu, Z. Water adsorption on kaolinite and illite after polyamine adsorption. J. Pet. Sci. Eng. 2016, 142, 13–20. [Google Scholar] [CrossRef]
  3. Zhang, X.B.; Li, L.; Xu, X.K.; Yang, Y.Y.; Fang, Y.S.; Xiao, Q.; Yang, J. Study on macro-microscopic characteristics of longmaxi shale hydration process. Drill. Prod. Technol. 2022, 44, 115–118, 136. [Google Scholar]
  4. Liu, X.; Xiong, J.; Liang, L. Hydration experiment of hard brittle shale of the longmaxi formation. J. Southwest Pet. Univ. (Sci. Technol. Ed.) 2016, 38, 178–186. [Google Scholar]
  5. Ding, M.; Kantzas, A.; Lastockin, D. Evaluation of gas saturation during water imbibition experiments. J. Can. Pet. Technol. 2006, 45, 29–35. [Google Scholar] [CrossRef]
  6. Dehghanpour, H.; Lan, Q.; Saeed, Y.; Fei, H.; Qi, Z. Spontaneous imbibition of brine and oil in gas shales: Effect of water adsorption and resulting microfractures. Energy Fuels 2013, 27, 3039–3049. [Google Scholar] [CrossRef]
  7. Holditch, S.A. Factors affecting water blocking and gas flow from hydraulically fractured gas wells. J. Pet. Technol. 1979, 31, 1515–1524. [Google Scholar] [CrossRef]
  8. Li, K.; Horne, R.N. An analytical scaling method for spontaneous imbibition in gas/water/rock systems. SPE J. 2004, 9, 322–329. [Google Scholar] [CrossRef]
  9. Peng, S.; Shevchenko, P.; Periwal, P.; Reed, R.M. Water-oil displacement in shale: New insights from a comparative study integrating imbibition tests and multiscale imaging. SPE J. 2021, 26, 3285–3299. [Google Scholar] [CrossRef]
  10. Handy, L.L. Determination of effective capillary pressures for porous media from imbibition data. Trans. AIME 1960, 219, 75–80. [Google Scholar] [CrossRef]
  11. Gupta, A.; Xu, M.; Dehghanpour, H.; Bearinger, D. Experimental investigation for microscale stimulation of shales by water imbibition during the shut-in periods. In Proceedings of the SPE Unconventional Resources Conference, Calgary, AB, Canada, 15–16 February 2017. SPE-185058-MS. [Google Scholar]
  12. Suarez, M.; Rivera, R. Water imbibition in oilfield rocks and applications to oil recovery. J. Propuls. Power 2009, 6, 535–543. [Google Scholar]
  13. Arab, D.; Bryant, S.L.; Torsæter, O.; Kantzas, A. Water flooding of sandstone oil reservoirs: Underlying mechanisms in imbibition vs. drainage displacement. J. Pet. Sci. Eng. 2022, 213, 110379. [Google Scholar] [CrossRef]
  14. Zhang, S.; Qiu, Z.; Huang, W. Water-adsorption properties of Xiazijie montmorillonite intercalated with polyamine. Clay Miner. 2015, 50, 537–548. [Google Scholar] [CrossRef]
  15. Peng, S.; LaManna, J.; Periwal, P.; Shevchenko, P. Water imbibition and oil recovery in shale: Dynamics and mechanisms using integrated centimeter-to-nanometer-scale imaging. SPE Reserv. Eval. Eng. 2022, 1–13. [Google Scholar] [CrossRef]
  16. Al-Arfaj, M.; Al-Osail, M.; Sultan, A. Monitoring imbibition of water into shale pore system: State of the art. In Proceedings of the SPE/IATMI Asia Pacific Oil & Gas Conference & Exhibition, Jakarta, Indonesia, 17–19 October 2017. [Google Scholar]
  17. Liang, D.C. Review on the study of shale hydration mechanism. Drill. Fluid Complet. Fluid 1997, 14, 29–31. [Google Scholar]
  18. Yu, Z.L.; Guo, G.F.; Yu, H.; Li, Q.; Zhang, Y.L. Damage of hydration effect to micropore structure of shale. J. Xi’an Shiyou Univ. (Nat. Sci. Ed.) 2022, 37, 44–50. [Google Scholar]
  19. Lu, Y.H.; Chen, M.; Jin, Y.; Teng, Q.X.; Wu, W.; Liu, X.Q. Experimental study of strength properties of deep mudstone under drilling fluid soaking. Chin. J. Rock Mech. Eng. 2012, 31, 1399–1405. [Google Scholar]
  20. Gray, R. Water-sensitive damage mechanism and injection water source optimization of low permeability sandy conglomerate reservoirs. Pet. Explor. Dev. 2019, 46, 1–11. [Google Scholar]
  21. Michael, W.C.; Ron, E.H.; Russell, G. Minimising clay sensitivity to fresh water following brine influx. In Proceedings of the SPE International Symposium on Formation Damage Control, Lafayette, LA, USA, 15–17 February 2000. SPE-58748-MS. [Google Scholar]
  22. Zhang, S.; Sheng, J.J. Effect of water imbibition on hydration induced fracture and permeability of shale cores. J. Nat. Gas Sci. Eng. 2017, 45, 726–737. [Google Scholar] [CrossRef]
  23. Ma, T.S.; Chen, P. Study of meso-damage characteristics of shale hydration based on CT scanning technology. Pet. Explor. Dev. 2014, 41, 227–233. [Google Scholar] [CrossRef]
  24. Hou, Z.K. Research on Hydraulic Fracturing Tests and Mechanism of Crack Extension of Longmaxi Shale; Chongqing University: Chongqing, China, 2018. [Google Scholar]
  25. Li, N.; Zou, Y.; Zhang, S.; Ma, X.; Zhu, X.; Li, S.; Cao, T. Rock brittleness evaluation based on energy dissipation under triaxial compression. J. Pet. Sci. Eng. 2019, 183, 106349. [Google Scholar] [CrossRef]
Figure 1. Samples for rock mechanical test: (a) after compressive strength test, vertical fractures and bedding planes intersect with each other, forming a complex fracture network; (b) after tensile strength test, the fracture perpendicular to bedding planes are relatively straight.
Energies 15 07110 g001
Figure 2. Specimen preparation for hydration and hydraulic fracturing: (a) drilling blind hole to simulate the wellbore, the right side is a steel pipe used as a casing; (b) schematic diagram of well completion; (c) a specimen for hydration and hydraulic fracturing.
Energies 15 07110 g002
Figure 3. (a) Schematic diagram of the small size true triaxial hydraulic fracturing simulation device and (b) flowchart of the experiment.
Energies 15 07110 g003
Figure 4. Water imbibition during shale hydration: (a) the relationship between cumulative water imbibition and hydration time: the hydration pressure was 3 MPa, and the water imbibition increased with time (b) the relationship between cumulative water imbibition and hydration pressure: when the hydration time was set 24 h, the water imbibition was close under different hydration pressure.
Energies 15 07110 g004
Figure 5. The fracture morphology and pressure curve of specimen 1#.
Energies 15 07110 g005
Figure 6. The fracture morphologies of specimens 2#, 3#, and 4#, which are similar, and all T-shaped.
Energies 15 07110 g006
Figure 7. The fracture morphologies of specimens 4#, 5#, and 6#: the number and complexity of fractures increase with the hydration time.
Energies 15 07110 g007
Table 1. Experimental results of rock mechanics for Longmaxi shale in changing area.
Specimen No.Confining PressureYoung’s Modulus
(GPa)
Poisson’s RatioCompressive Strength (MPa)Tensile Strength
(MPa)
Brittleness Index (Decimals)
V1(V-1)025.740.2460.56.10.48
V2(V-2)2022.750.22112.17.60.45
V3(V-3)4030.730.25 131.9 5.60.44
V4(V-4)6024.140.20 237.85.10.38
Table 2. Experimental scheme.
Specimen
No.
Stress (MPa)
σhHv
Flowrate
(mL·min−1)
Viscosity
(mPa·s)
Imbibition Time
(h)
Imbibition Pressure
(MPa)
1#3-18-25510000
2#242
3#244
4#243
5#483
6#723
Table 3. Experimental scheme.
Specimen No.Number of FracturesHydration Pressure and TimeBreakdown Pressure (MPa)Overall Fracture
Morphology
1#10 MPa, 0 h24.8A transverse fracture along the direction of σH
2#22 MPa, 24 h28.7A transverse fracture along the direction of σH, which activated a bedding plane locally to form a T-shaped fracture
3#24 MPa, 24 h30.0A transverse fracture arrested by a bedding plane, forming a T-shaped fracture
4#23 MPa, 24 h27.9A transverse fracture along the direction of σH, which activated a bedding plane locally to form a T-shaped fracture
5#33 MPa, 48 h40.2Three transverse fractures merging into one during propagation
6#64 MPa, 72 h46.4Three transverse fractures and one bedding plane resulting in a fracture network
Publisher’s Note: MDPI stays neutral with regard to jurisdictional claims in published maps and institutional affiliations.

