
Characterization and Evaluation of Carbonate Reservoir Pore Structure Based on Machine Learning
 ,
,
Abstract
:
1. Introduction
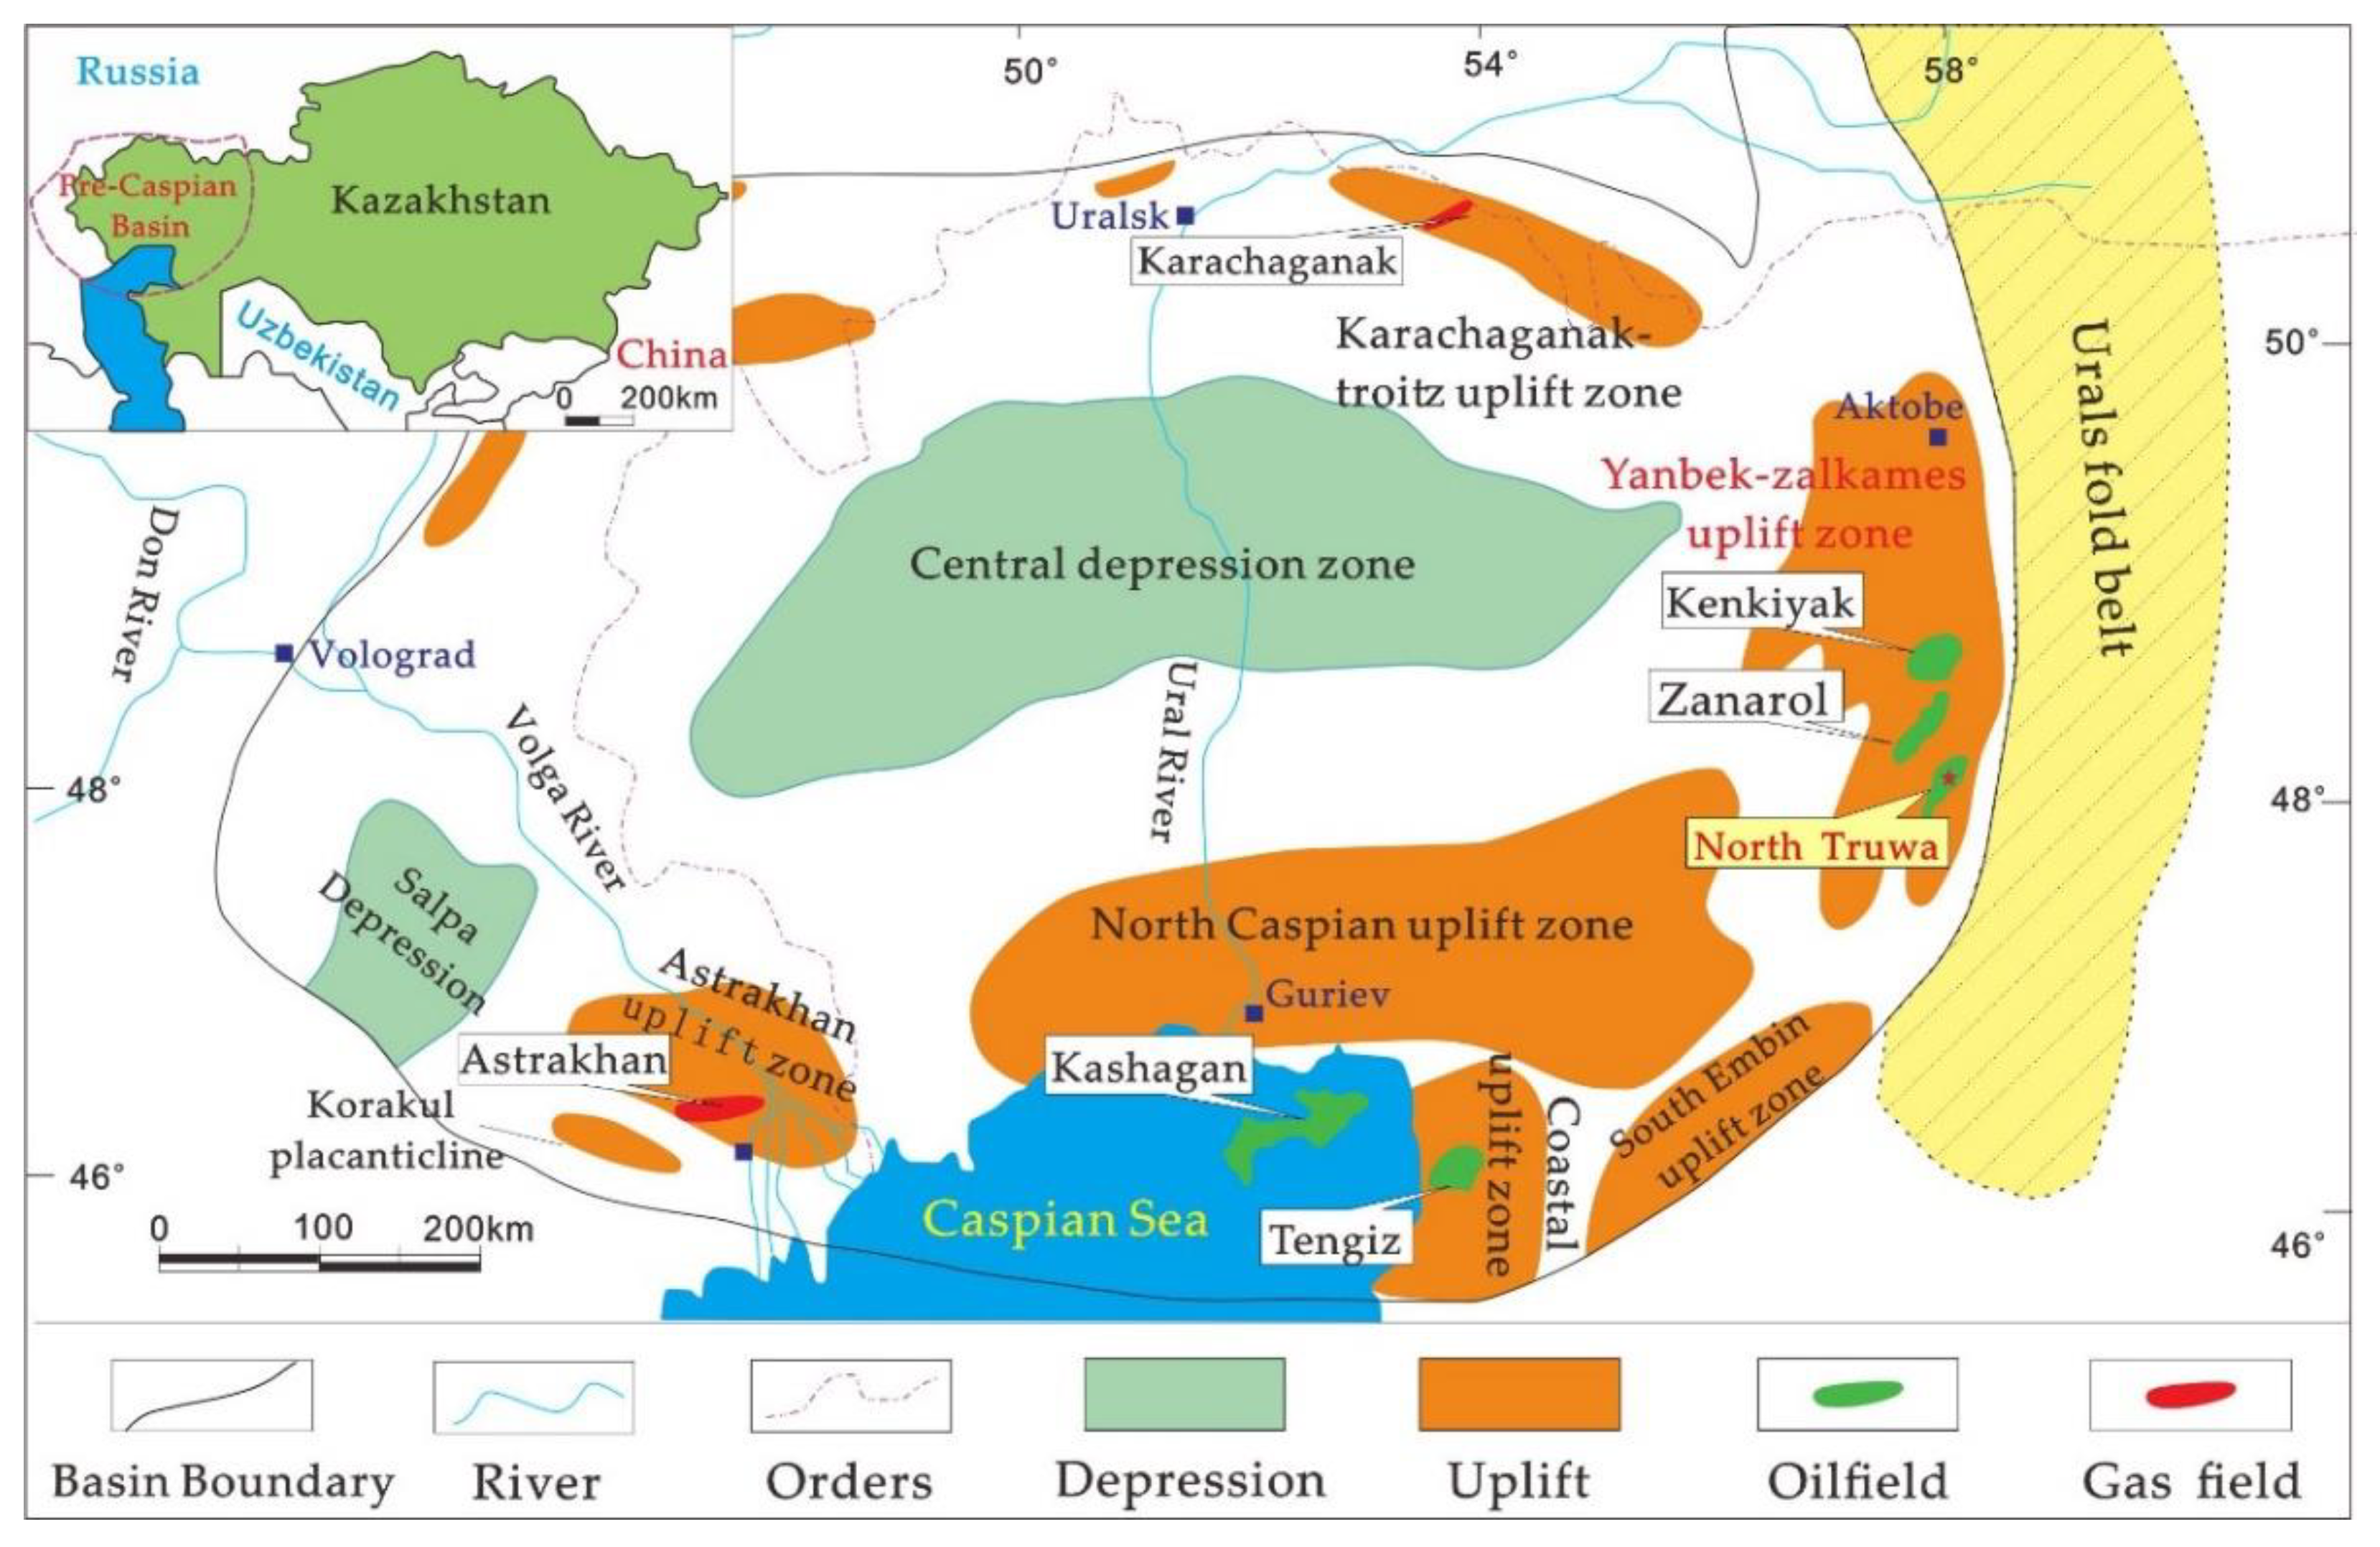
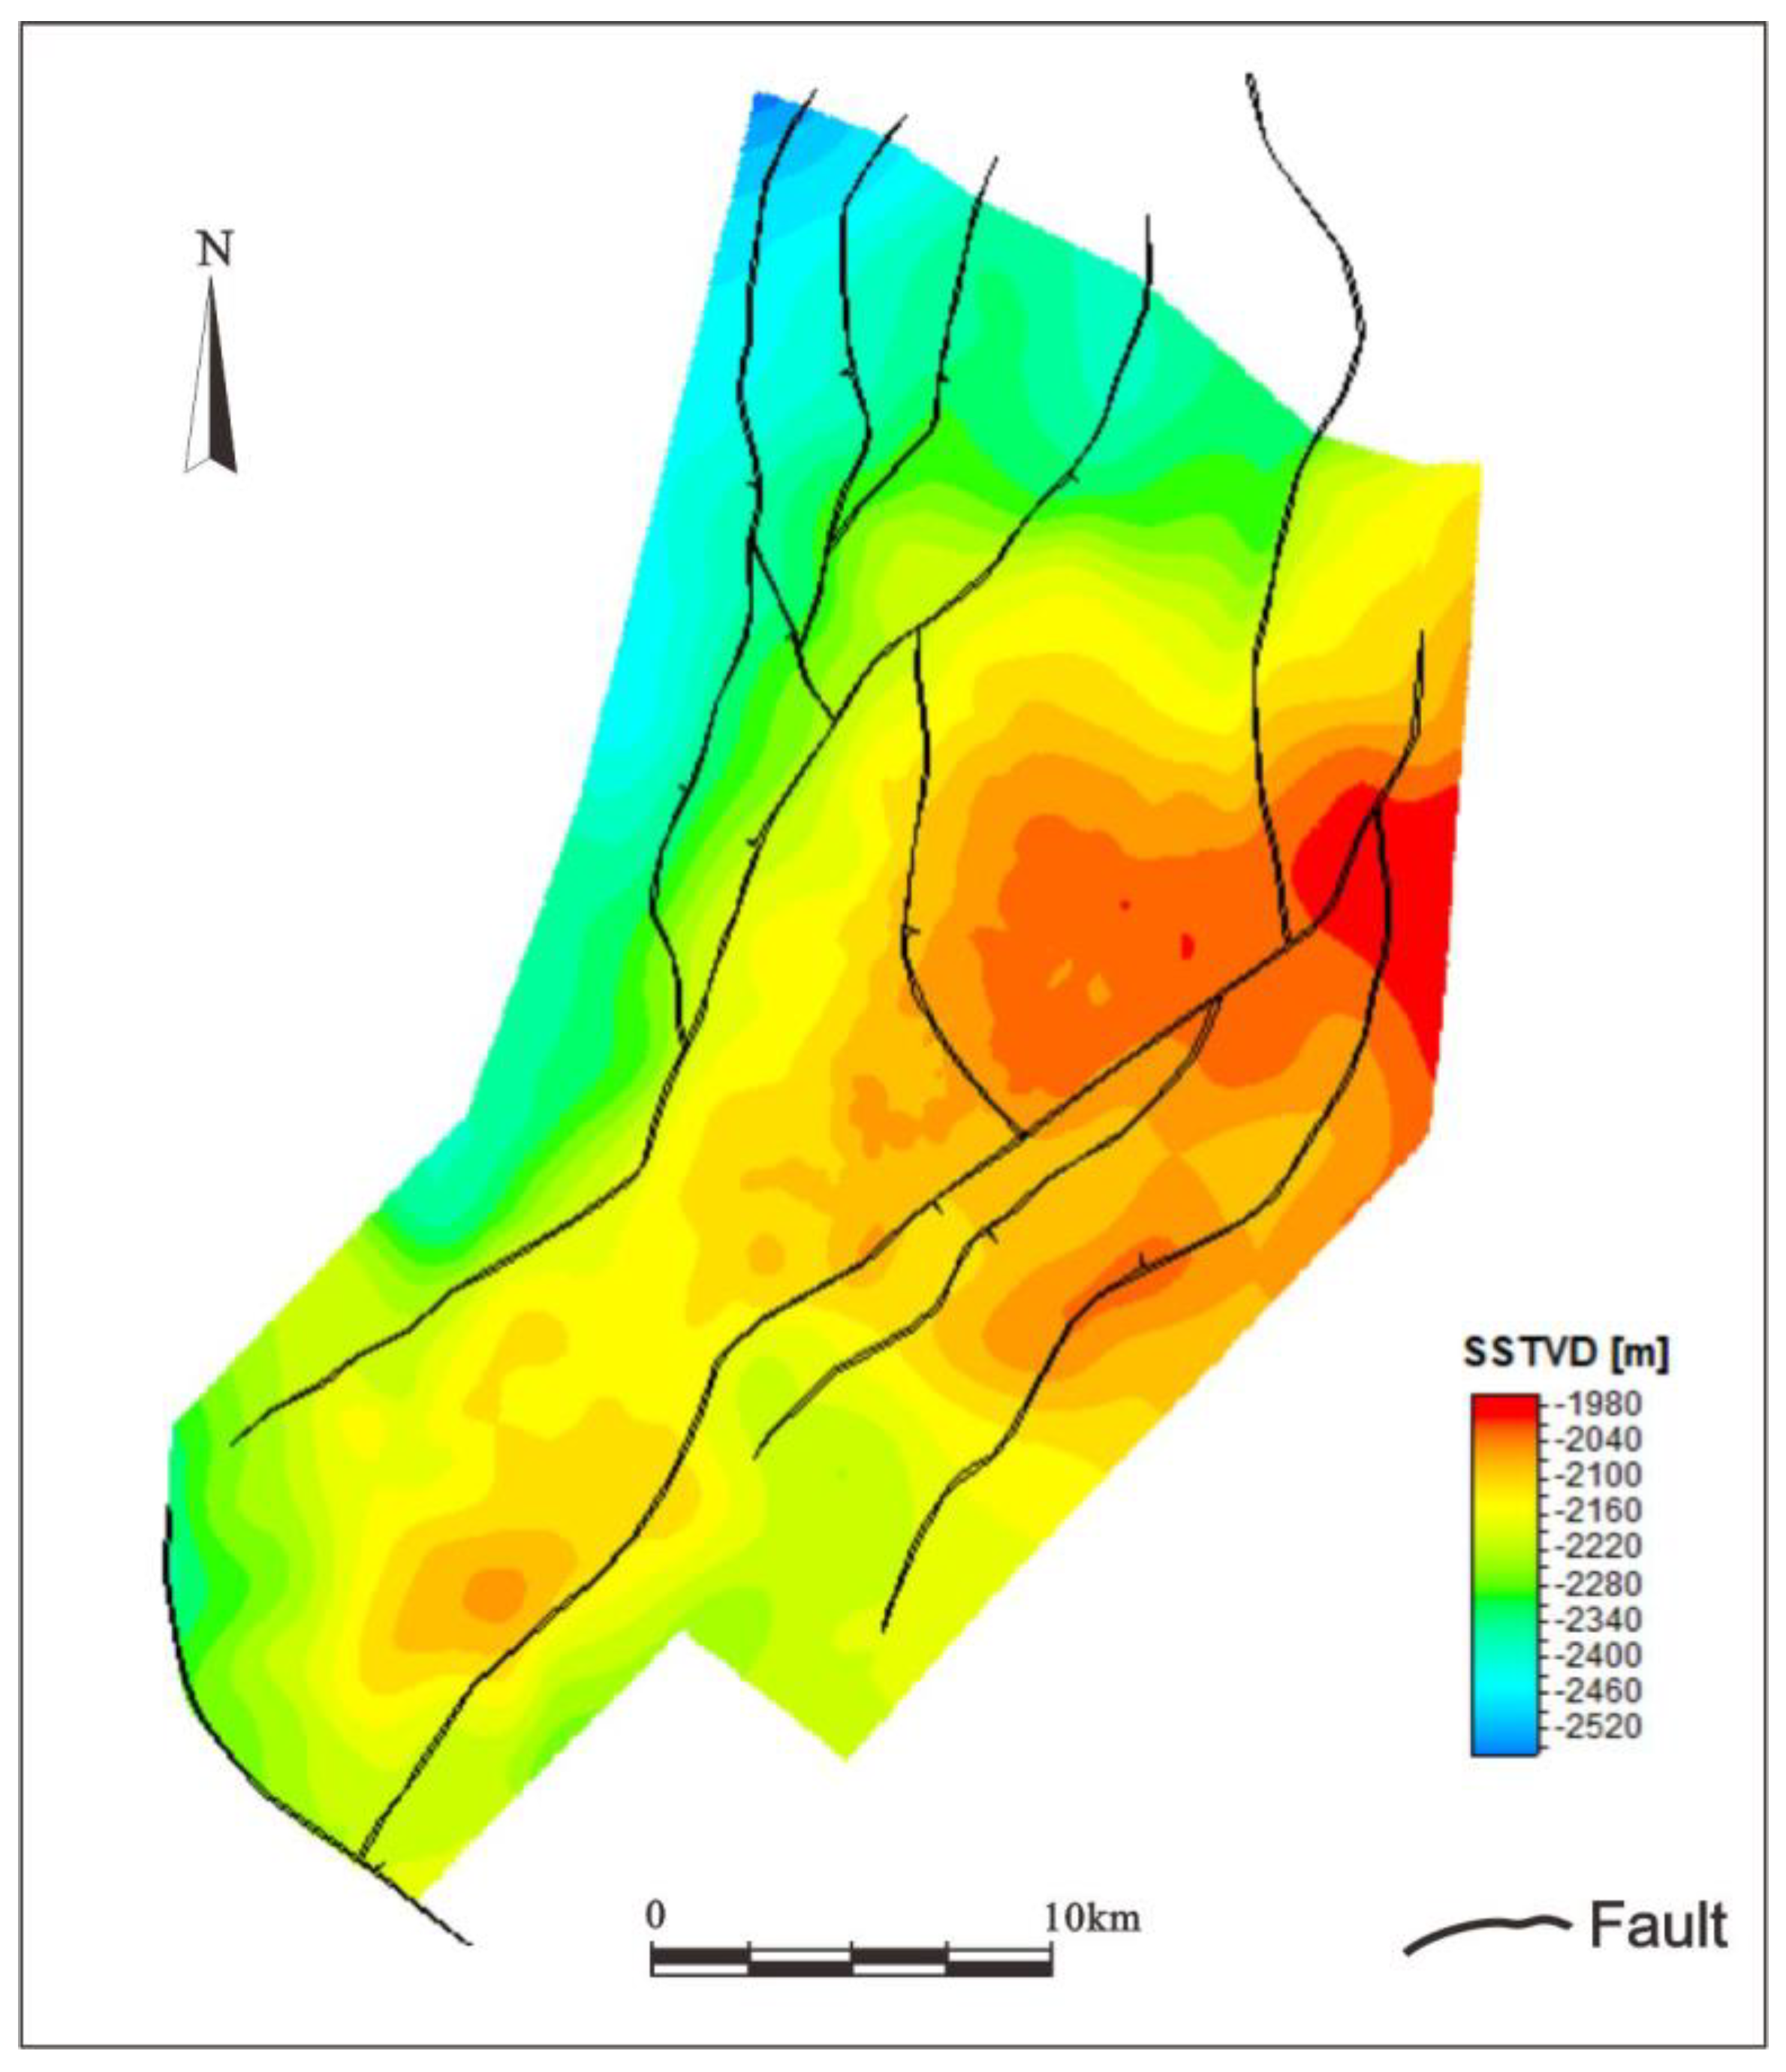
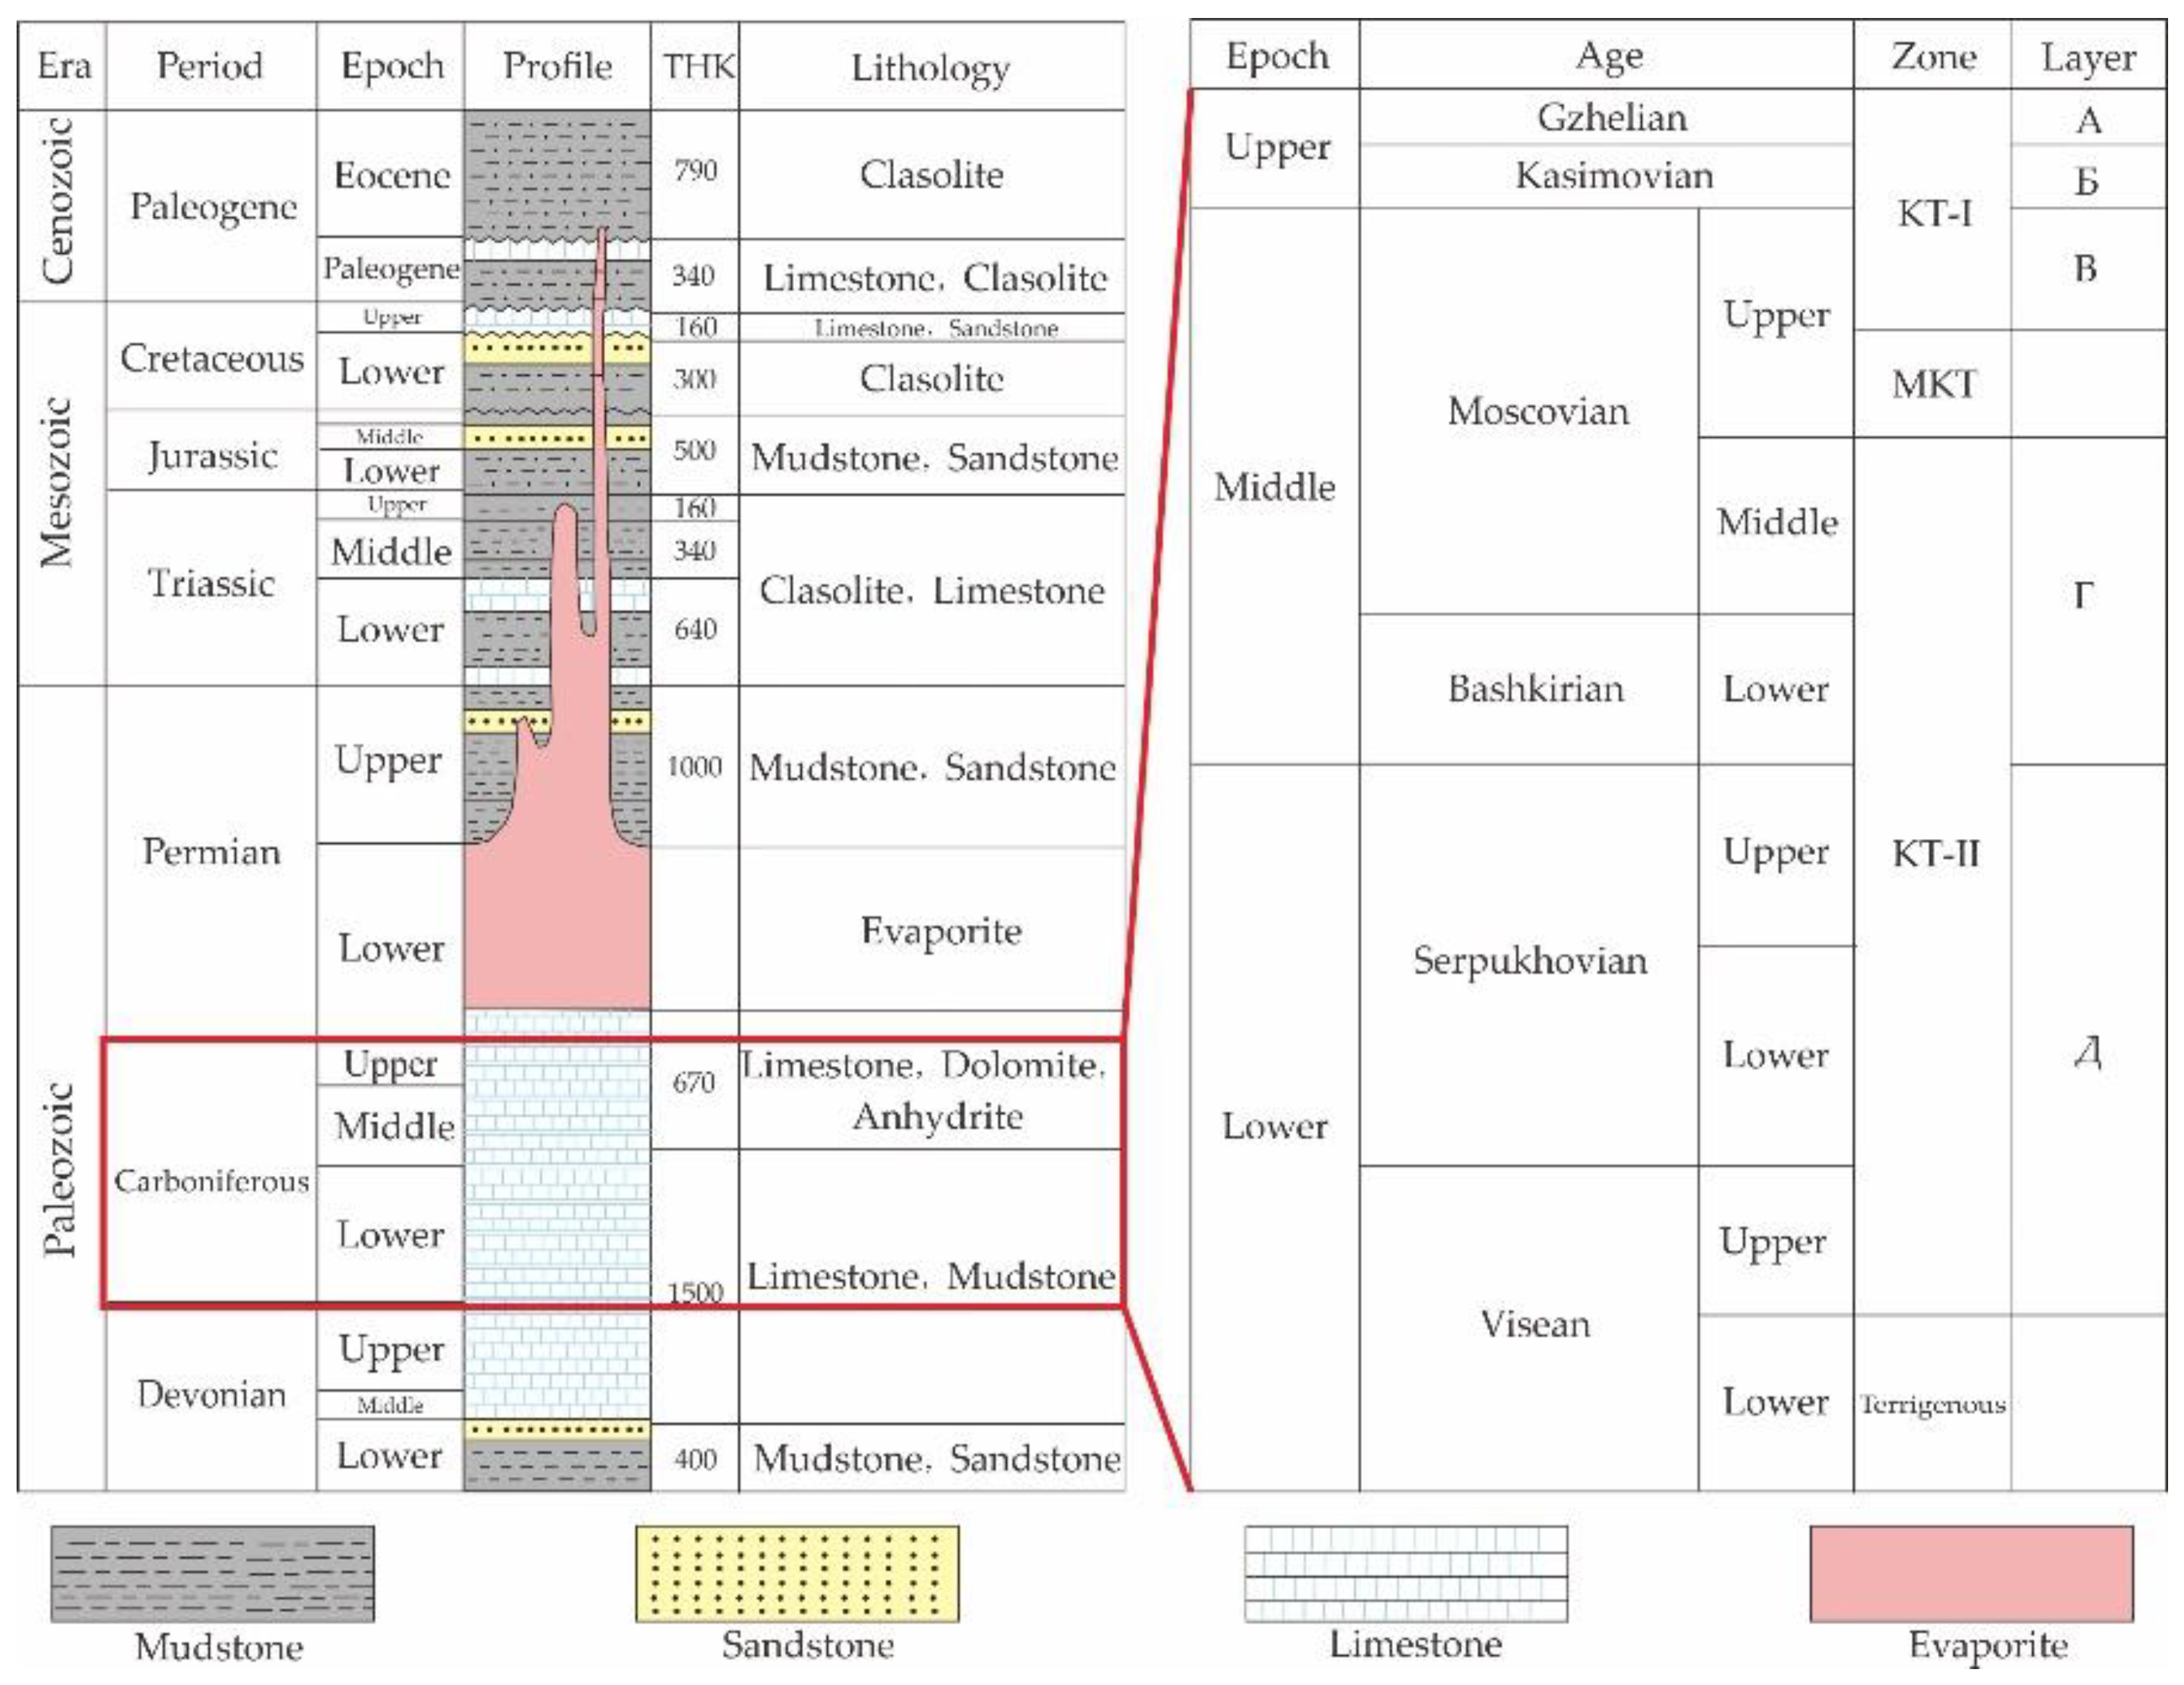
2. Geological Overview of the Study Area
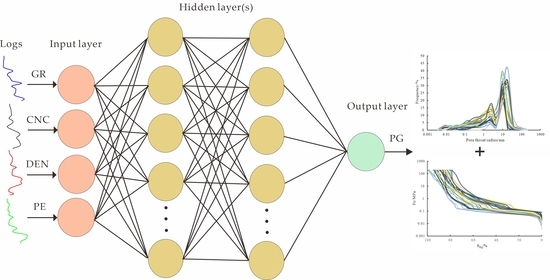
3. Materials and Methods
- 1.
- Network initialization.
- 2.
- Randomly select the kth input sample and the corresponding expected output.
- 3.
- Calculate the input and output of each neuron in the hidden layer.
- 4.
- Calculate the partial derivative δo(k) of the error function to each neuron in the output layer with the expected output and actual output of the network.
- 5.
- Calculate the partial derivative δh(k) of the error function to each neuron in the hidden layer with the connection weight from the hidden layer to the output layer, δo(k) of the output layer and the output of the hidden layer.
- 6.
- Correct the connection weight who(k) with the δo(k) of each neuron in the output layer and the output of each neuron in the hidden layer.
- 7.
- Correct the connection weight with the δh(k) of each neuron in the hidden layer and the input of each neuron in the input layer.
- 8.
- Calculate the global error.
- 9.
- Determine whether the network error meets the requirements. When the error reaches the preset accuracy or the number of learning times exceeds the given maximum number of times, the algorithm ends. Otherwise, select the next learning sample and its corresponding expected output, return to Step 3, and enter the next round of learning.
4. Results
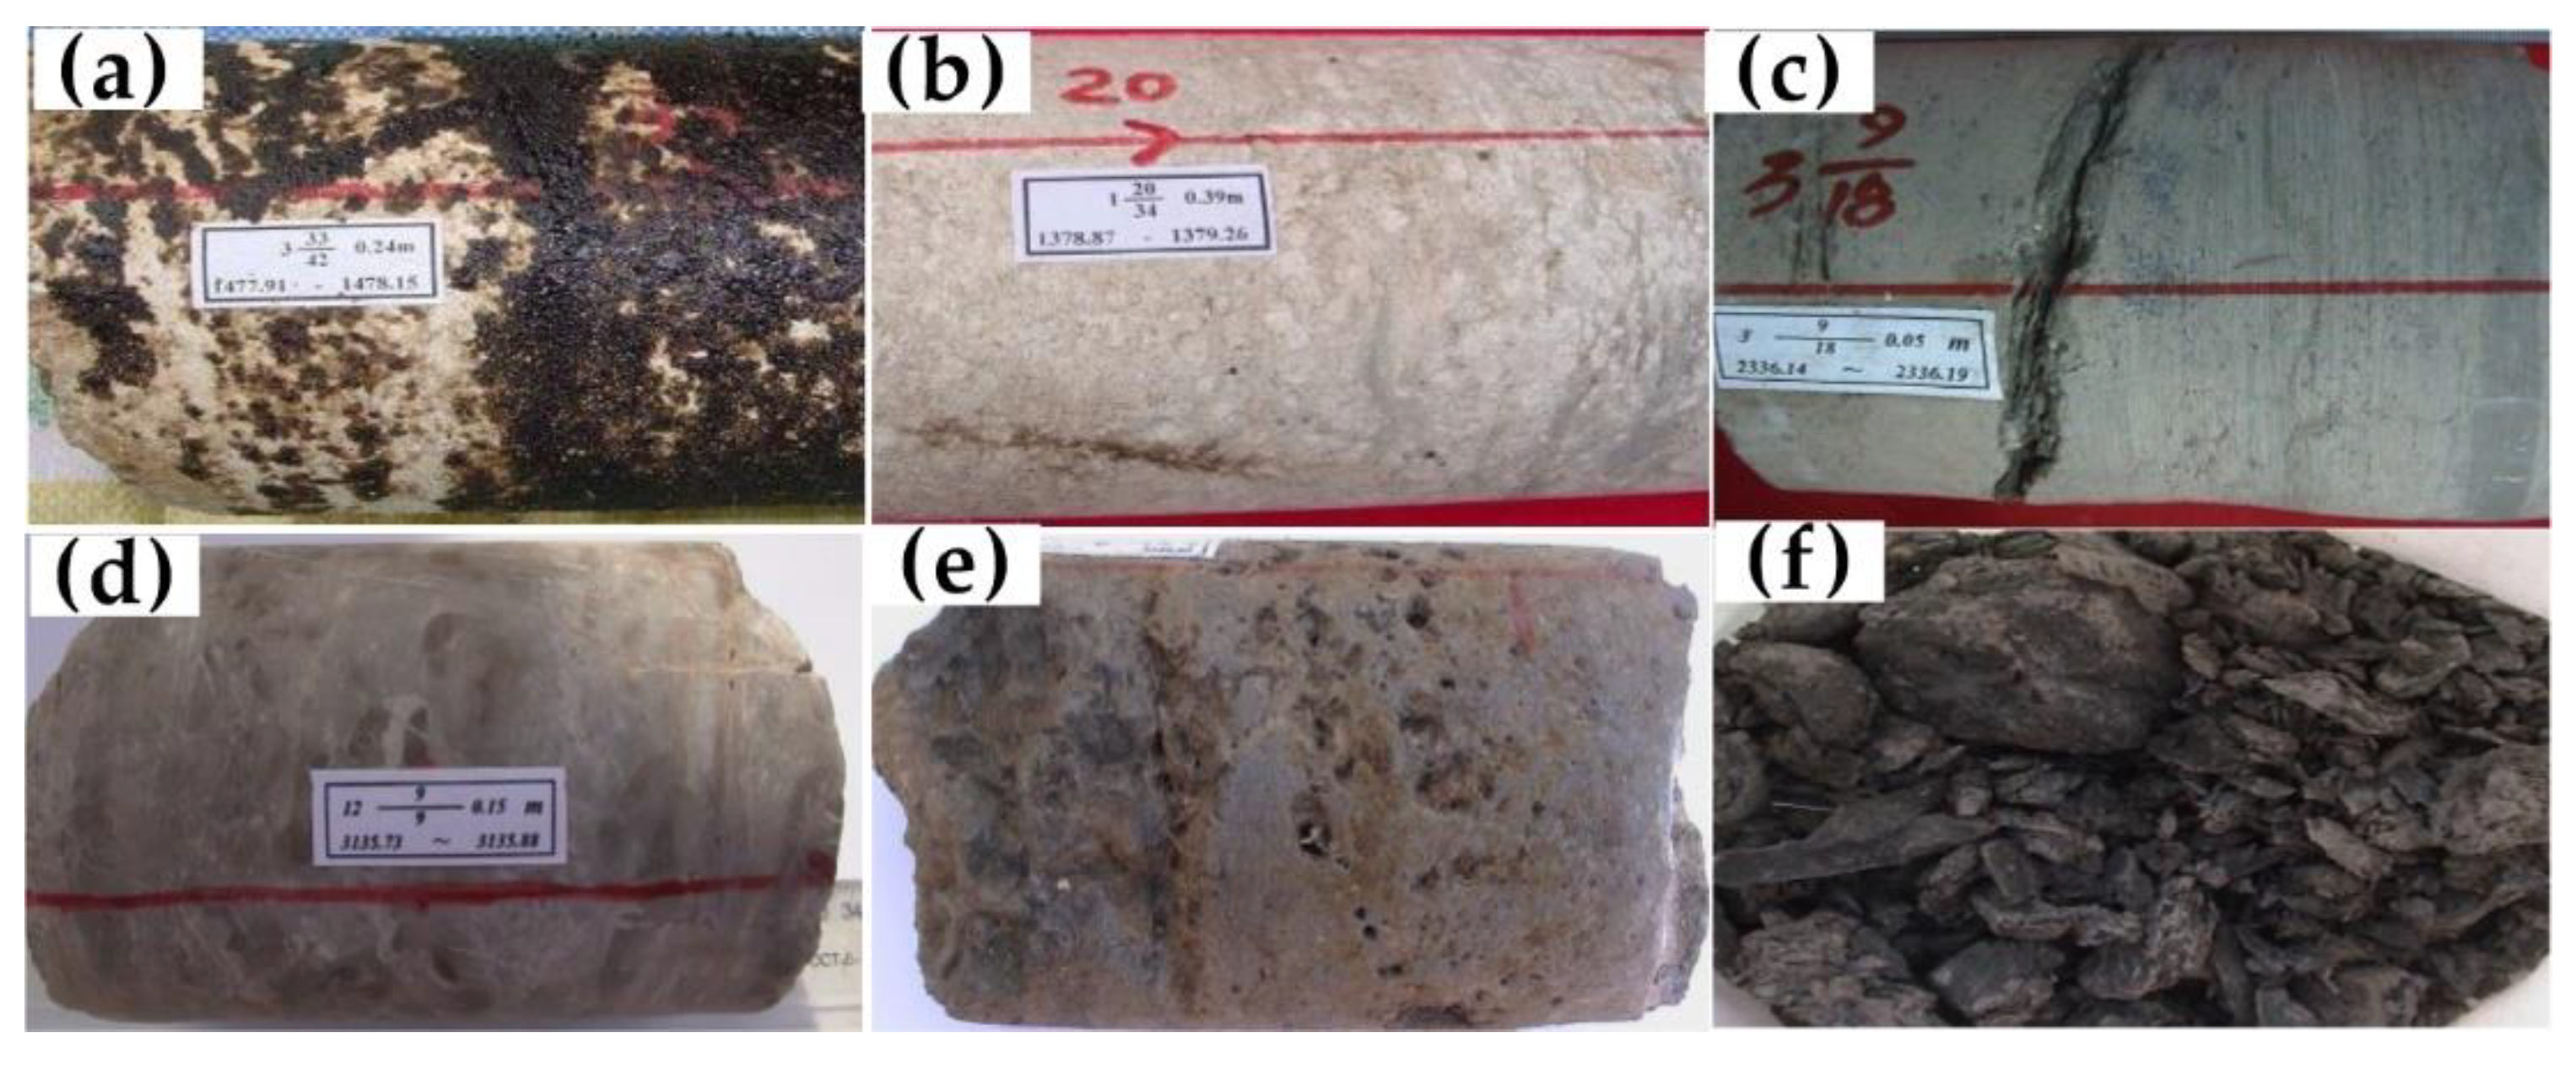
4.1. Petrological Characteristics of Reservoir
4.2. Pores and Throats
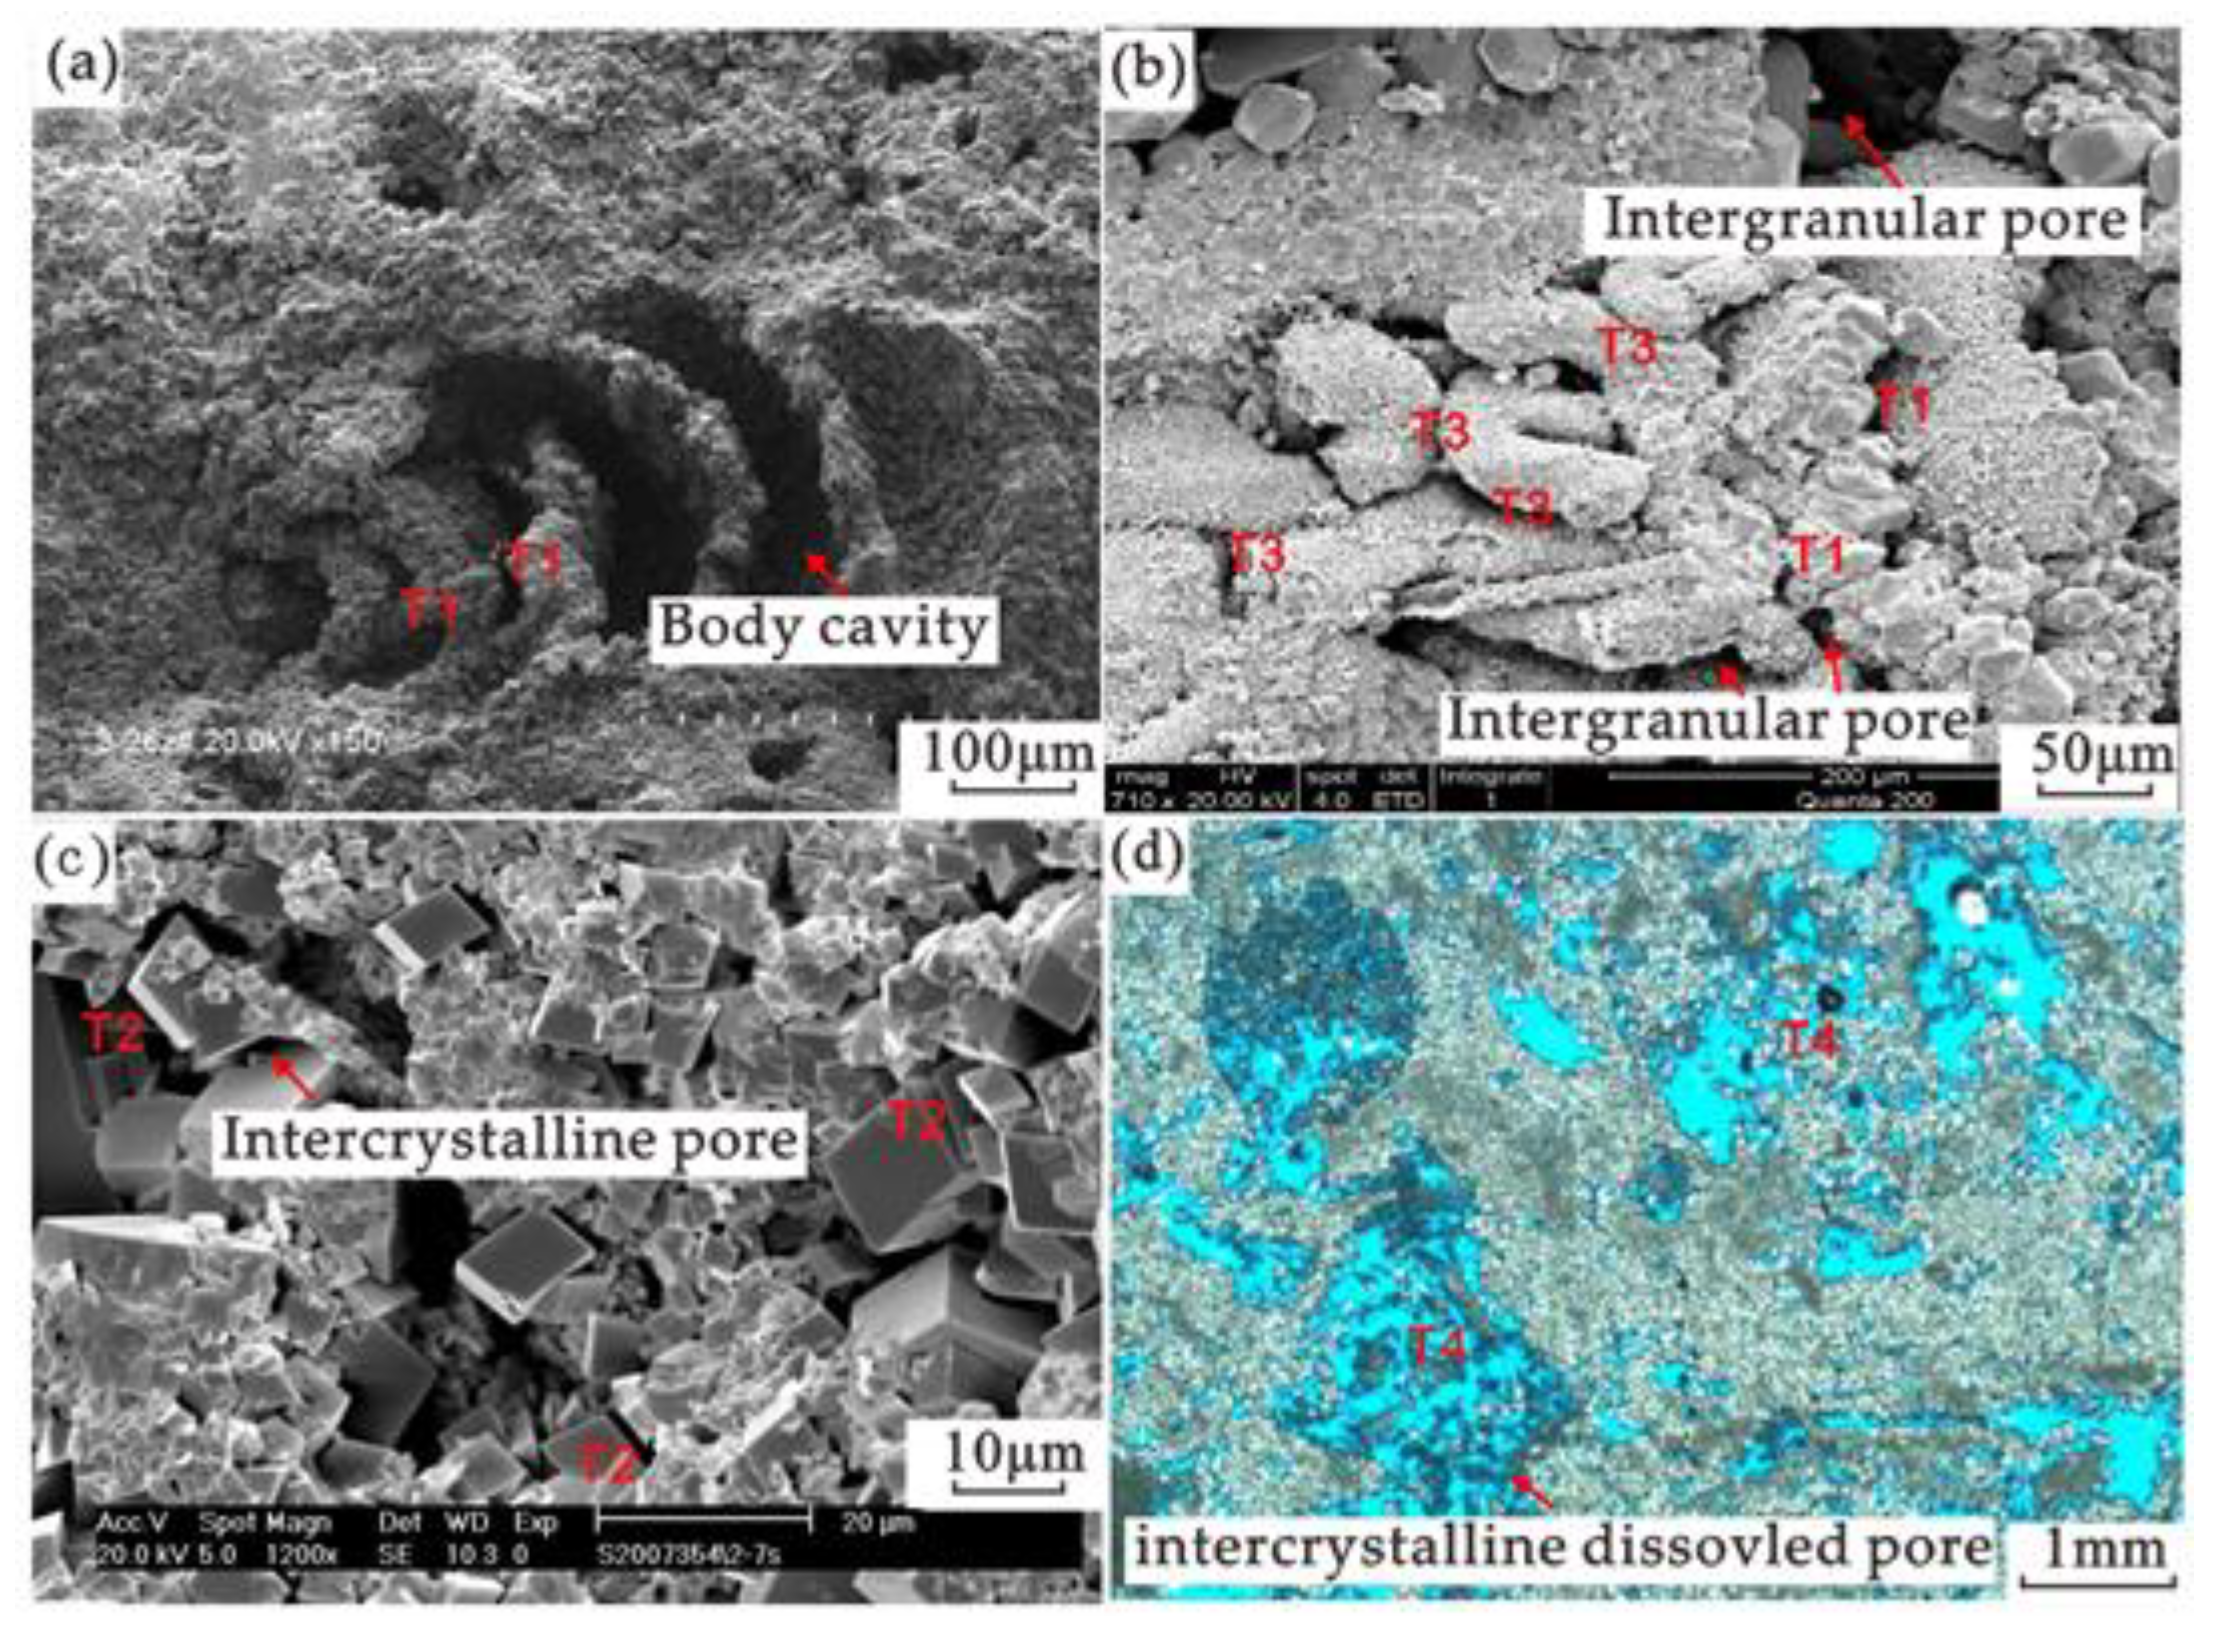
4.2.1. Pore Types and Characteristics
4.2.2. Throat Types and Characteristics
4.3. Pore Structure Types
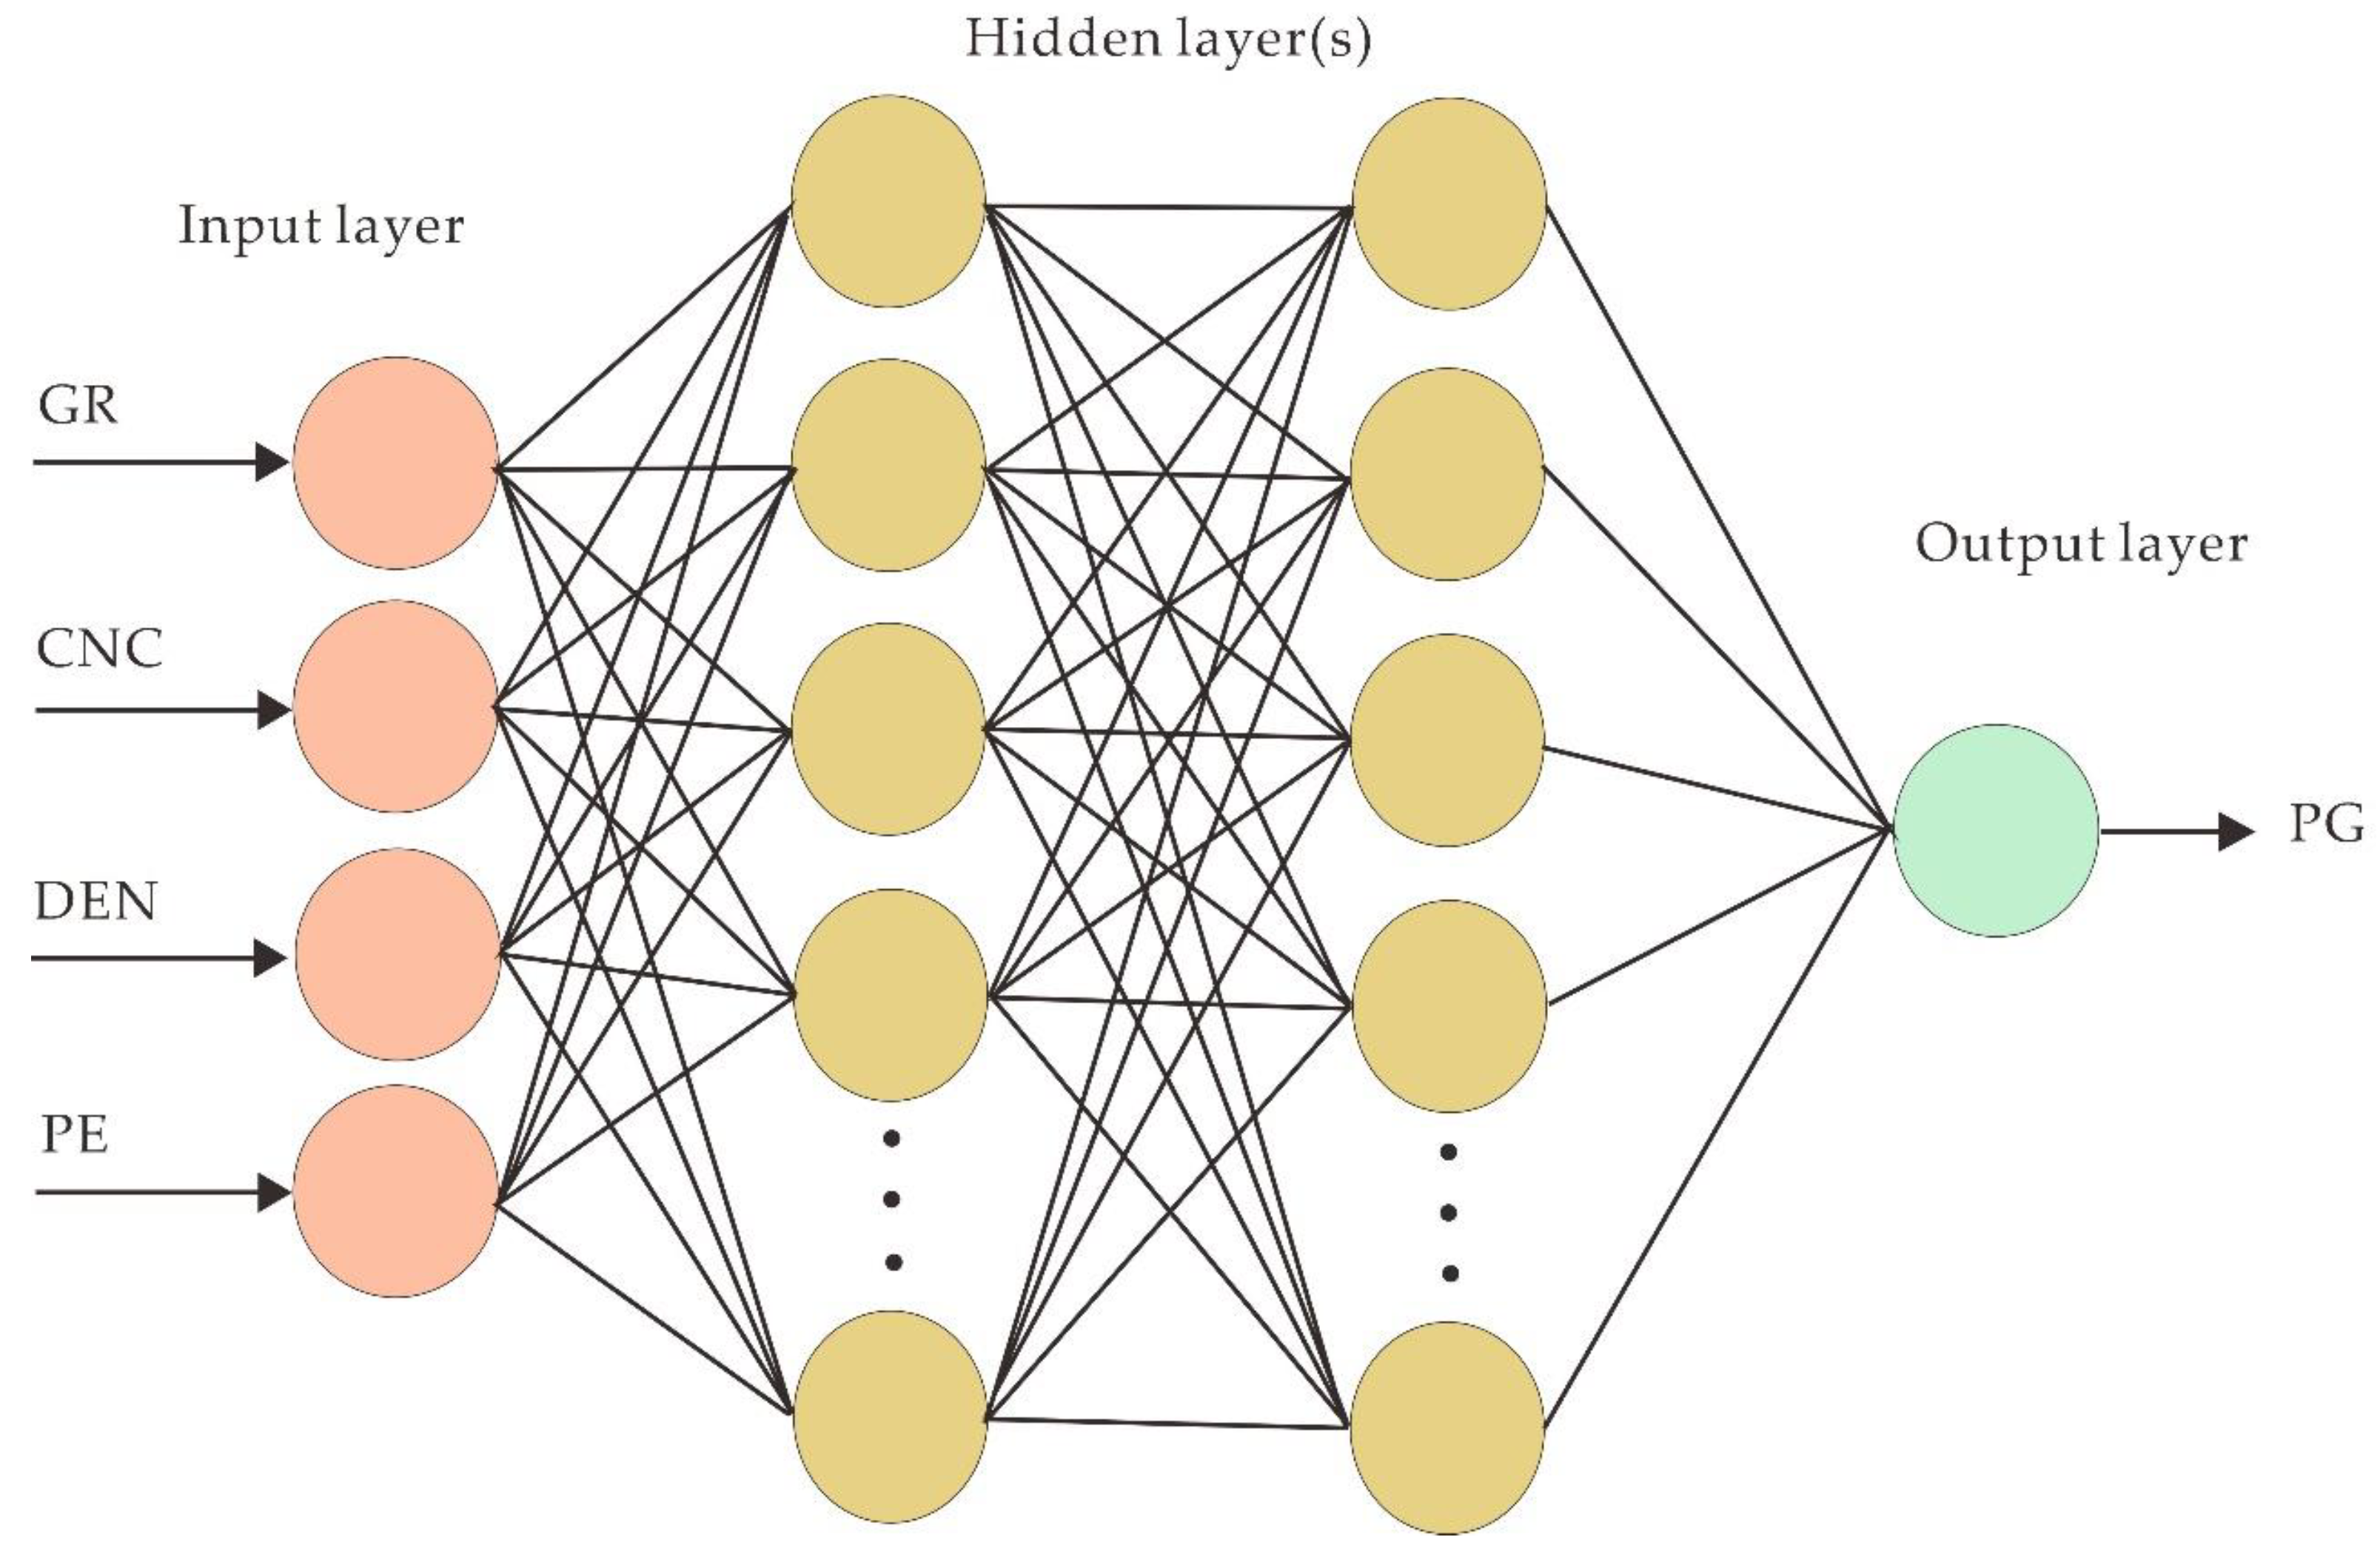
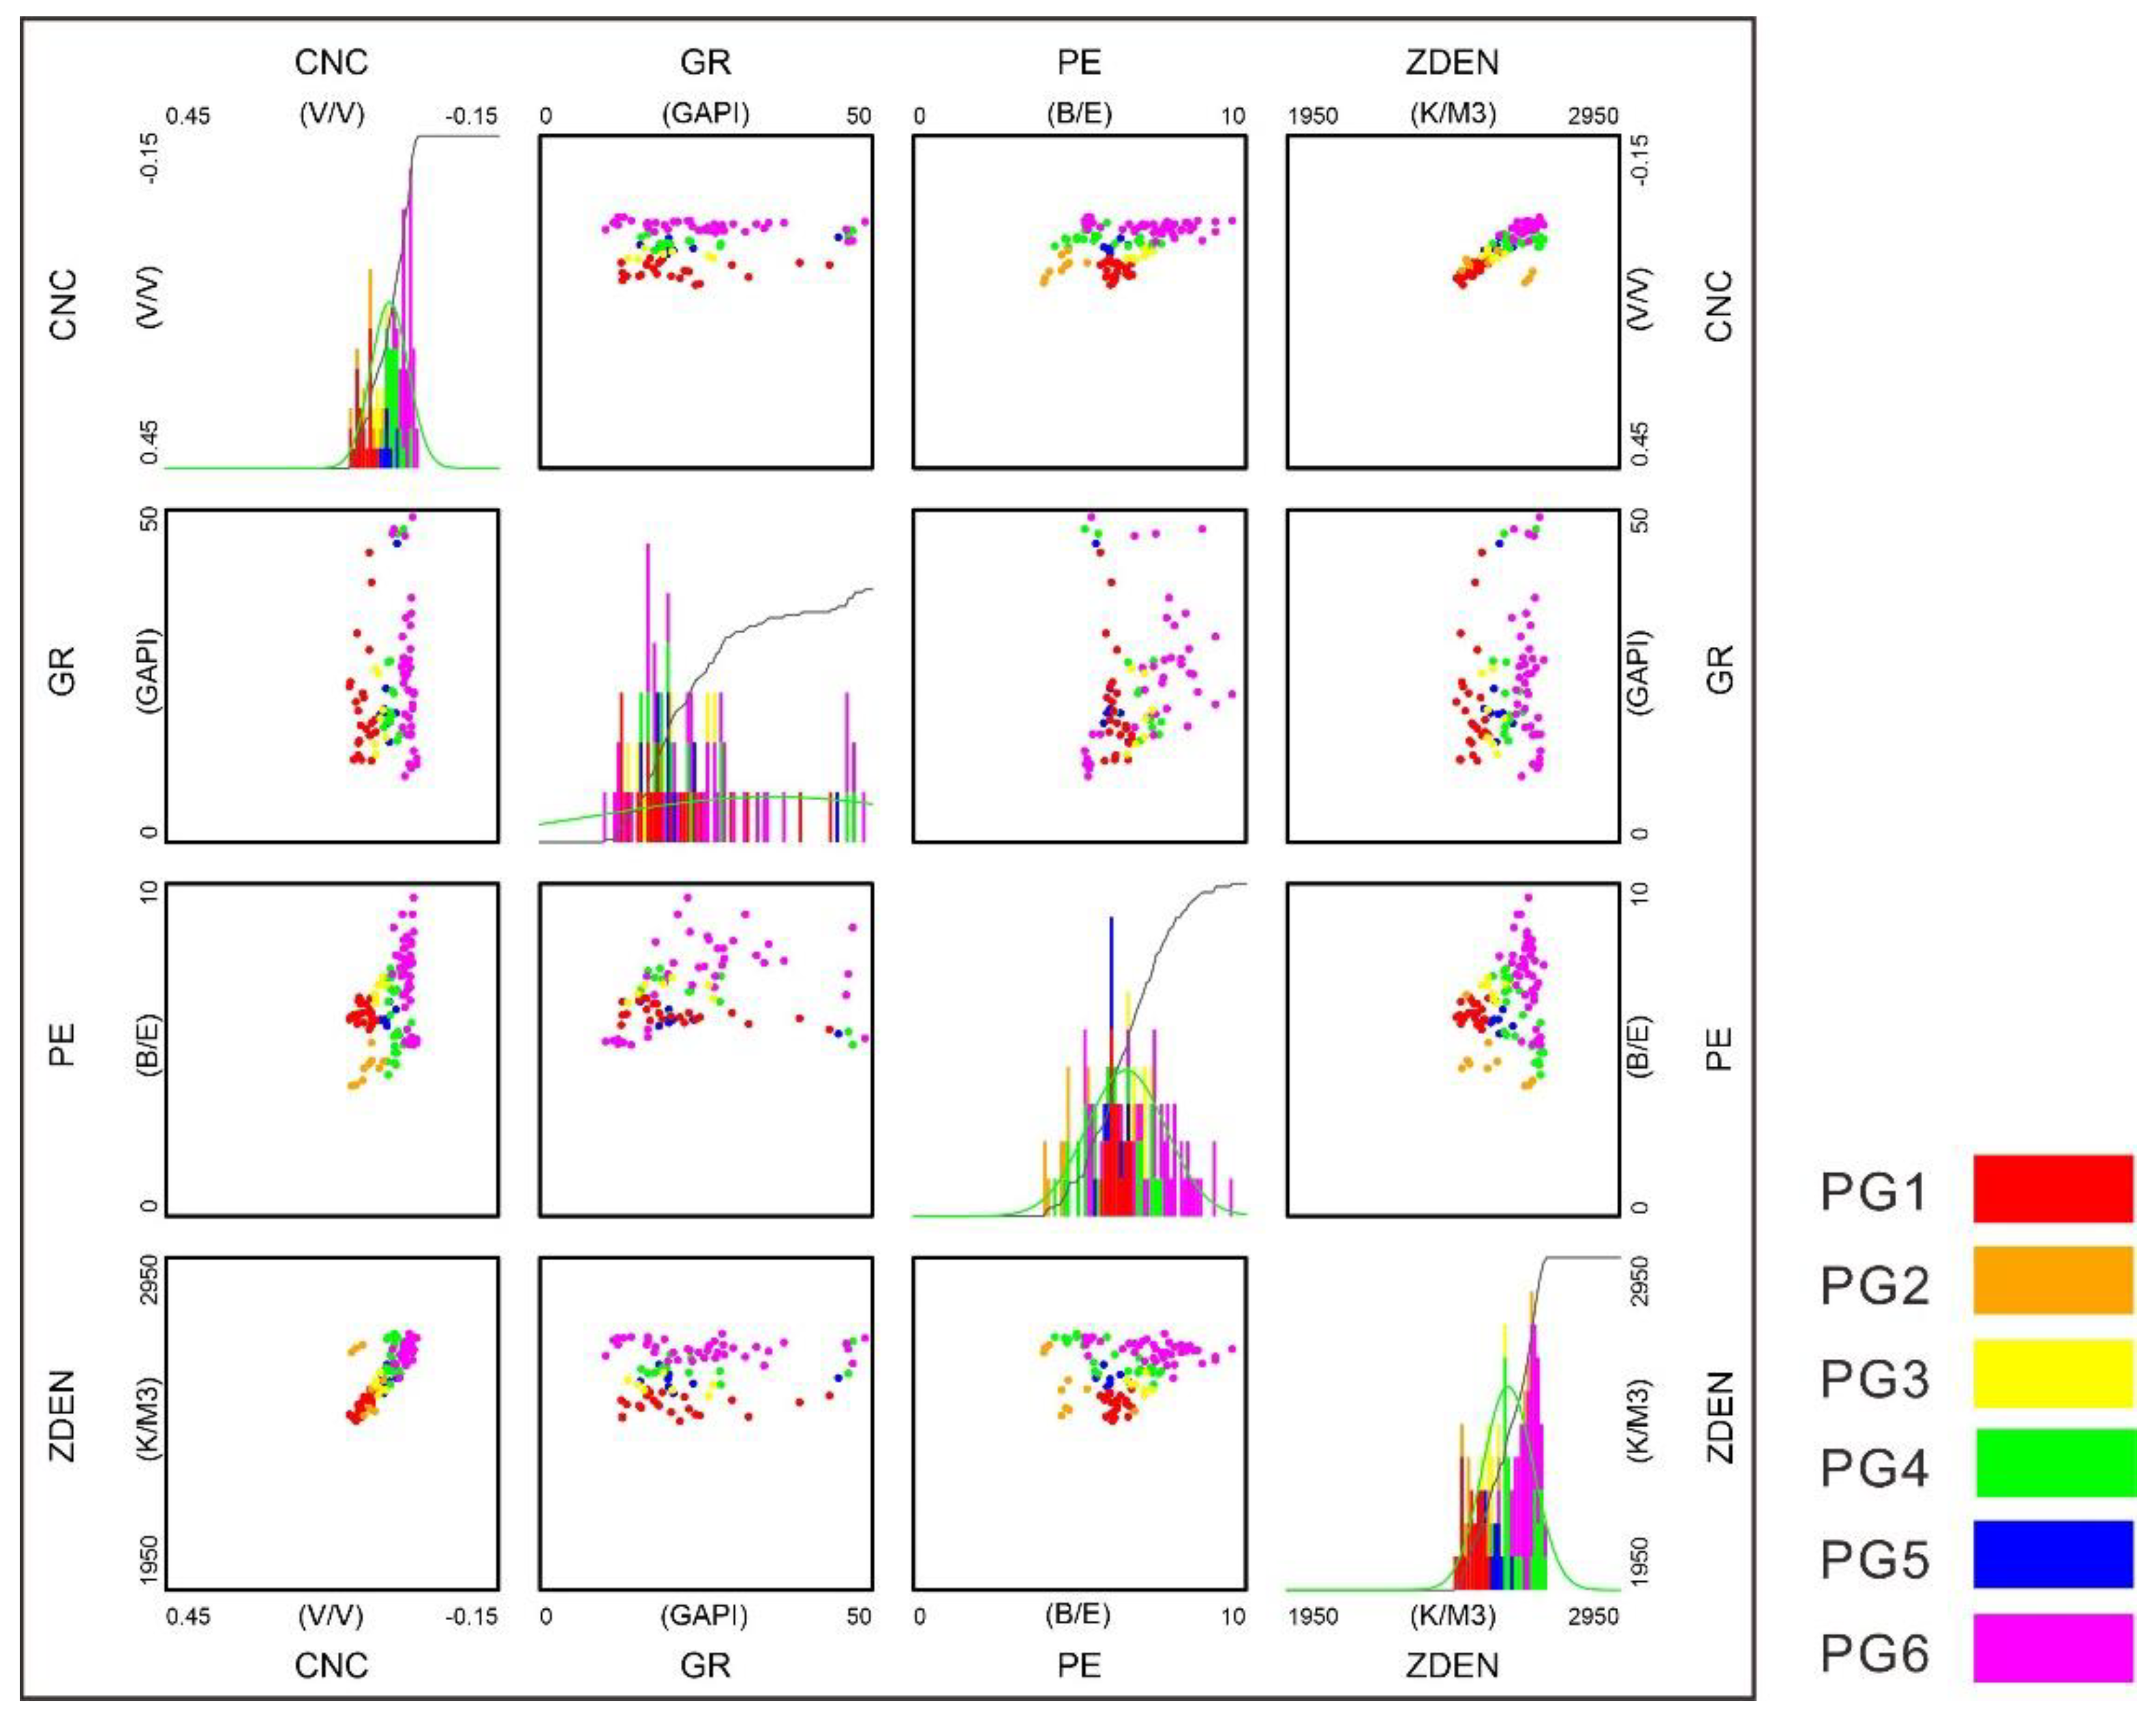
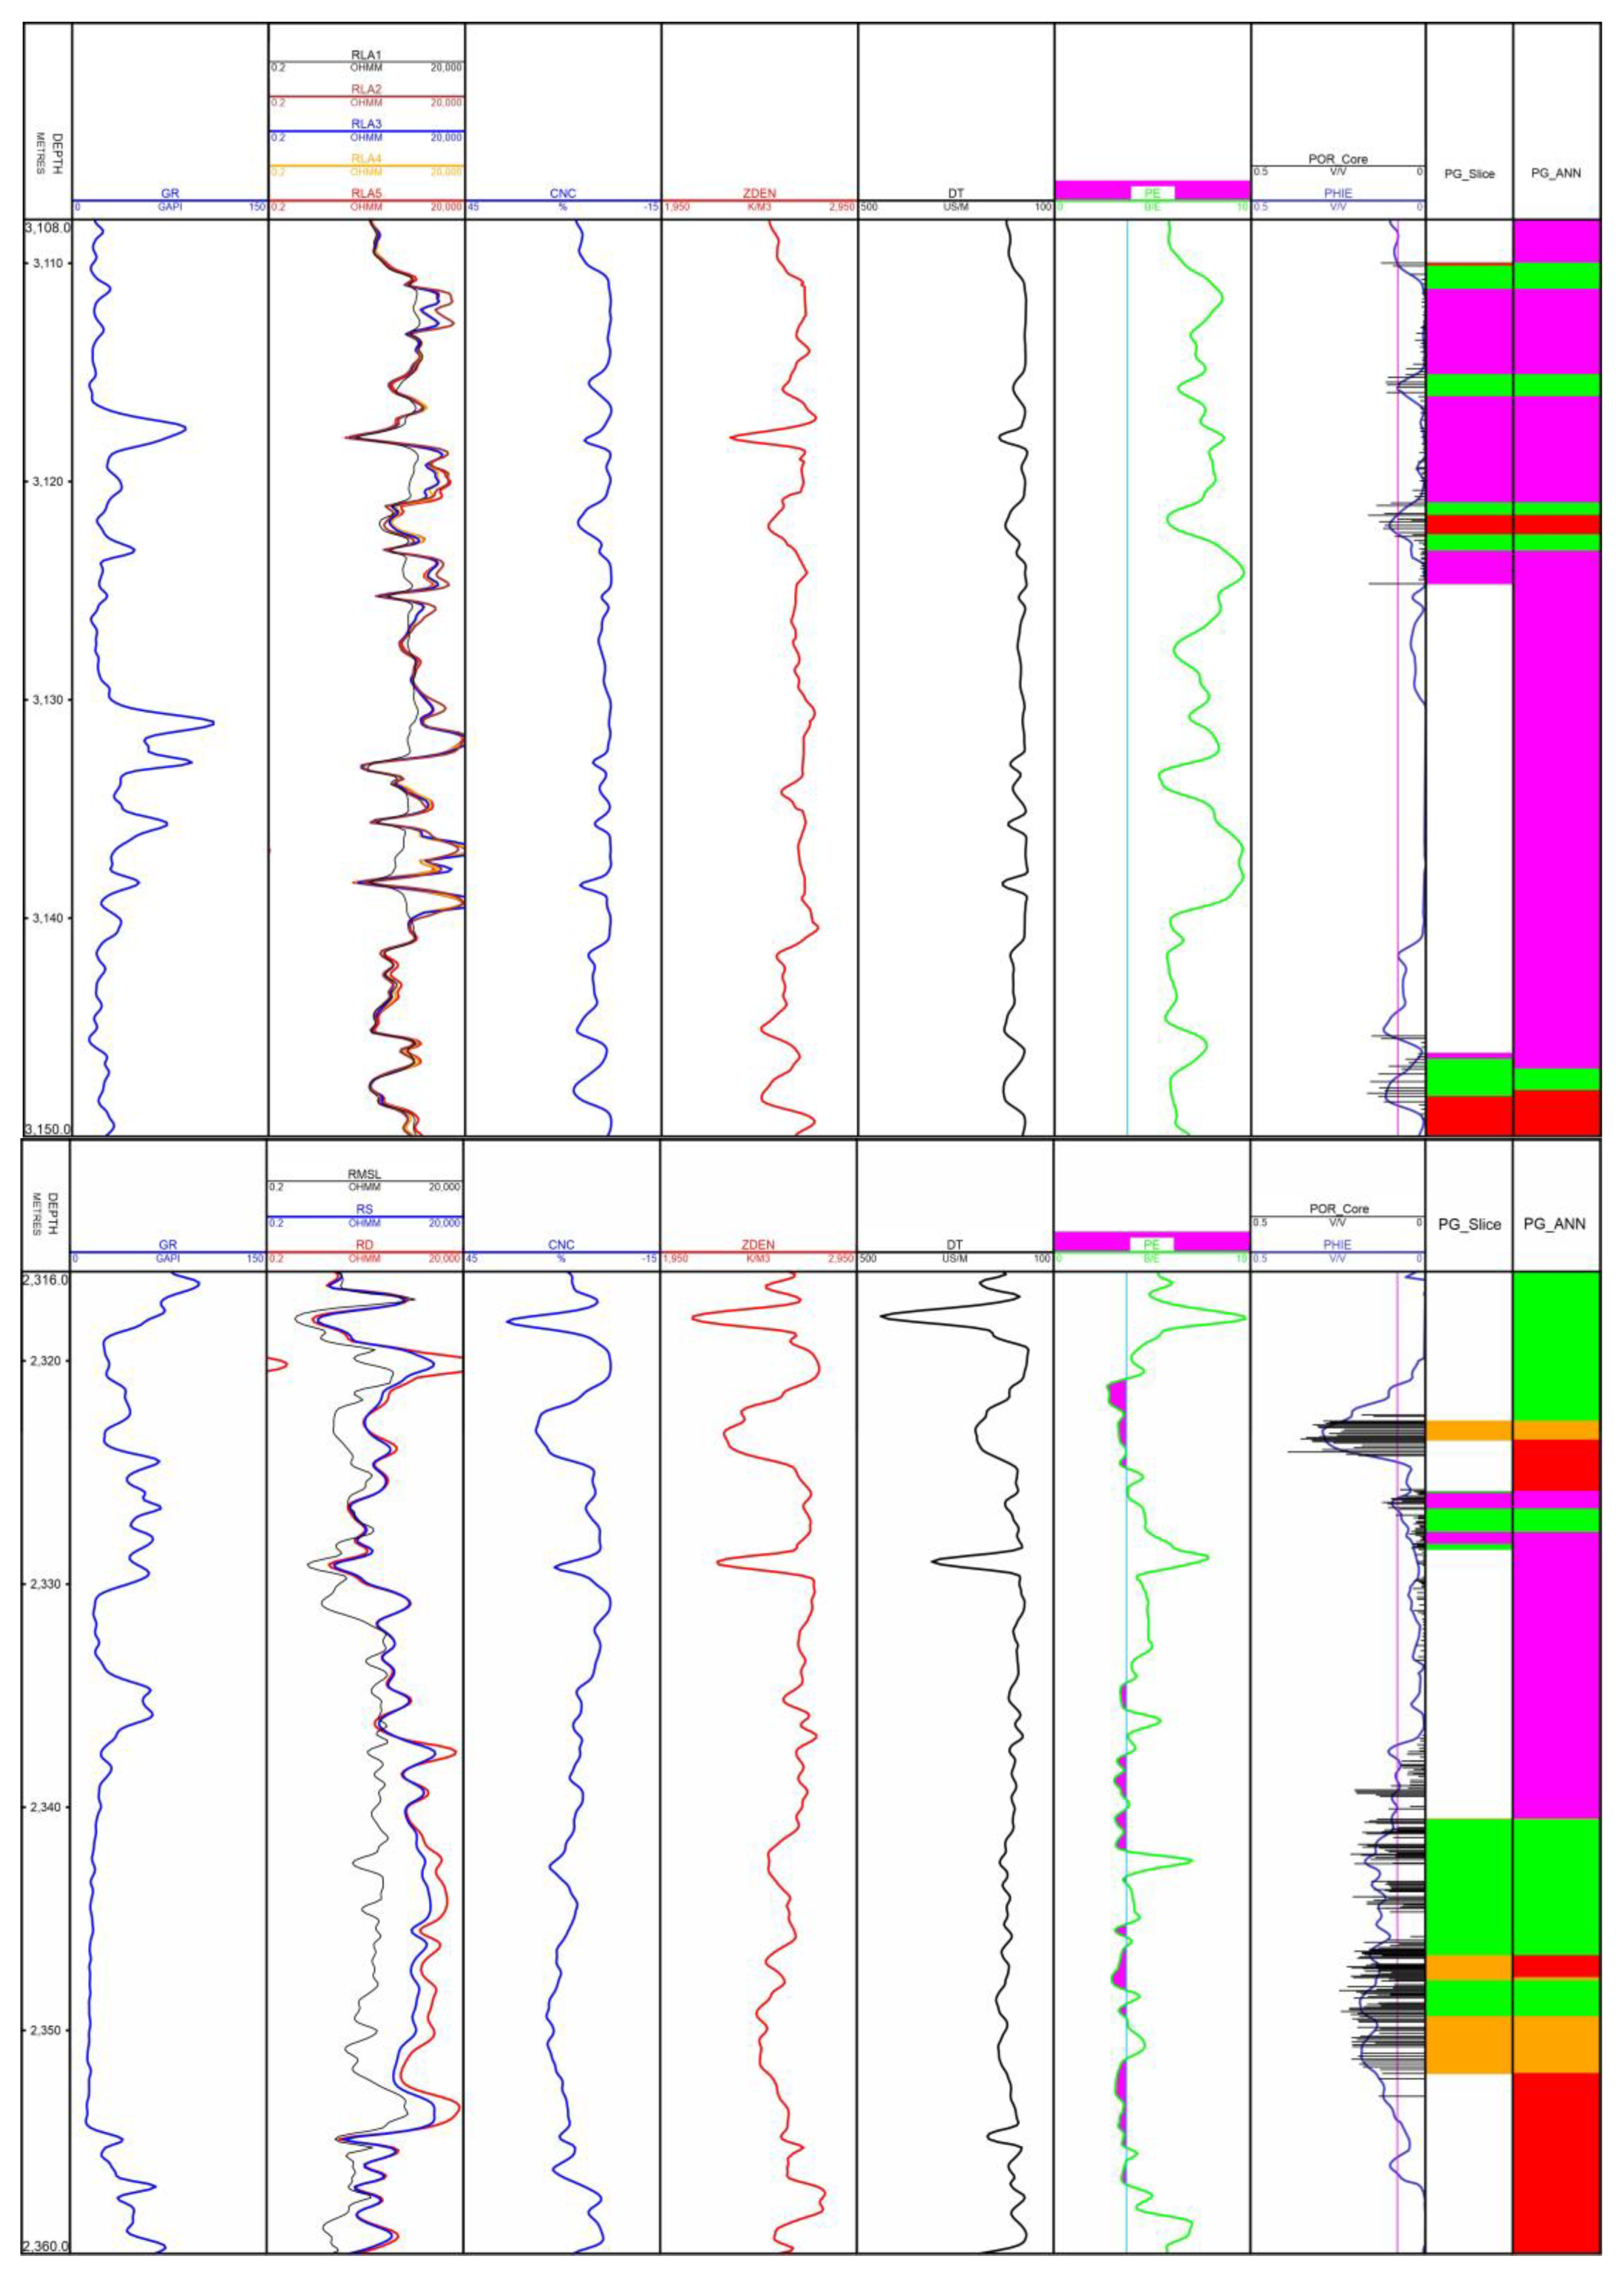
4.4. Identification of Petrophysical Facies Based on Machine Learning Method
5. Discussion
5.1. Causes of Differences in Pore Structure
5.2. Main Controlling Factors of Pore Structure Differences
5.3. Prediction of Reservoir Pore Structure with Machine Learning Method
6. Conclusions
- (1)
- The North Truva Oilfield has diverse lithology, with complex types of pores and throats. Its lithology includes grainstone, packstone, wackestone, grain dolomite, mudstone, siliceous limestone and gypsum. The pores are mainly composed of intergranular dissolved pores, body cavity pores, intercrystalline dissolved pores, shell dissolved pores and crystal mold pores, etc. The throats mainly include pore-reduced throats, sheet throats, tubular throats and network throats. Among them, network throats are a common and special type of throat mainly affected by dissolution in this area. It is formed in the micropores between the fillings, playing a very positive role in improving the seepage capacity of the reservoir.
- (2)
- The petrophysical quantitative characterization facies in the reservoir are classified into 6 types: PG1, PG2, PG3, PG4, PG5, and PG6, according to the mercury injection parameters such as displacement pressure, median pressure, median throat radius, mercury removal efficiency and the shape of the capillary curve. The difference in pore structure is mainly caused by the diversification of pores and throats. They are the results of depositional environment, diagenesis and fracture development. Depositional environment and diagenesis are the main controlling factors for the difference in the reservoir pore structure. The beach environment with high-frequency exposure has a great influence on the development of favorable pore structure.
- (3)
- With the principle of machine learning, the petrophysical facies division structure of mercury injection wells is used as training data. The artificial neural network method (ANN) is then used to establish a petrophysical facies recognition training model. On this basis, the petrophysical facies of each well in the oilfield are predicted, realizing a fine identification of the quantitative characterization of the pore structure of different reservoirs. The application results from the whole block show that the overall identification coincidence rate of this method is up to 89.7%, which effectively improves the accuracy and efficiency of logging identification for the quantitative characterization of pore structures in the reservoir.
- (4)
- On the basis of lithofacies and petrophysical facies, the reservoir can be divided into multiple rock types. Using the rock type identification results of each well, the rock type model of the reservoir can be established, and the heterogeneity of the complex carbonate rock reservoir can be described in detail, which can effectively help the dynamic analysis of oil reservoirs, numerical simulation, the prediction of remaining oil and the adjustment of the development plan.
Author Contributions
Funding
Data Availability Statement
Acknowledgments
Conflicts of Interest
Glossary
| Wkj | the value of feature tk in sample data dj |
| |T| | the number of dimensions of the feature vector |
| P | the final prediction result |
| Si | the ith feature sample in k nearest samples |
| Wi | the weight value corresponding to Si |
References
- Shen, A.J.; Zhao, W.J.; Hu, A.P.; She, M.; Chen, Y.N.; Wang, X.F. Major factors controlling the development of marine carbonate reservoirs. Pet. Explor. Dev. 2015, 42, 545–554. [Google Scholar] [CrossRef]
- He, L.; Zhao, L.; Li, J.X.; Ma, J.; Liu, R.L.; Wang, S.Q.; Zhao, W.Q. Complex porosity and permeability relationship and influencing factors of carbonate reservoir: A case study of plateau facies in Precaspian Basin. Pet. Explor. Dev. 2015, 42, 206–214. [Google Scholar]
- Chen, Y.F.; Cai, D.M.; Fan, Z.F.; Li, K.C.; Ni, J. 3D geologic modeling of dual media in presalt reservoir of Kazakstan. Pet. Explor. Dev. 2008, 35, 492–497. [Google Scholar] [CrossRef]
- Fan, J.S. Reservoir characteristics of carbonate oil and gas fields in the world and main control factors of hydrocarbon accumulation in them. Earth Sci. Front. 2005, 12, 23–30. [Google Scholar]
- Zhao, W.Z.; Shen, A.J.; Hu, S.Y.; Zhang, B.M.; Pan, W.Q.; Zhou, J.G.; Pan, Z.C. Geological conditions and distribution characteristics of Large-scale development of carbonate reservoirs in China. Pet. Explor. Dev. 2012, 39, 1–12. [Google Scholar] [CrossRef]
- Wilson, M.E.J.; Evans, M.J. Sedimentology and diagenesis of Tertiary carbonates on the Mangkalihat Peninsula, Borneo: Implications for subsurface reservoir quality. Mar. Pet. Geol. 2002, 19, 873–900. [Google Scholar] [CrossRef]
- Rong, H.; Jiao, Y.Q.; Wu, L.Q.; Gu, Y.; Zhang, L.Y.; Li, R.; Zeng, F.P. Effects of diagenesis on the acoustic velocity of the Triassic oolitic shoals in the Yudongzi outcrop of Erlangmiao area, Northwest Sichuan Basin. Mar. Pet. Geol. 2012, 23, 542–558. [Google Scholar] [CrossRef]
- Li, W.Q.; Mu, L.X.; Zhao, L.; Li, J.X.; Wang, S.Q.; Fan, Z.F.; Shao, D.L.; Li, C.H.; Shan, F.C.; Zhao, W.Q.; et al. Pore throat structure characteristics of Carboniferous carbonate reservoir in the eastern margin of the Precaspian Basin and its influence on porosity-permeability relationship. Pet. Explor. Dev. 2020, 47, 958–971. [Google Scholar] [CrossRef]
- Ole, P.W.; Giulio, C.; Sima, J.; David, C.P.P. The characteristics of open fractures in carbonate reservoirs and their impact on fluid flow: A discussion. Pet. Geosci. 2016, 22, 91–104. [Google Scholar]
- Esrafili-Dizaji, B.; Rahimpour-Bonab, H. Effects of depositional and diagenetic characteristics on carbonate reservoir quality: A case study from the South Pars gas field in the Persian Gulf. Pet. Geosci. 2009, 15, 325–344. [Google Scholar] [CrossRef]
- Saneifar, M.; Skalinski, M.; Theologou, P.; Kenter, J.; Cuffey, C.; Salazar-Tio, R. Integrated petrophysical rock classification in the Mcelroy Field, West Texas, USA. Petrophysics 2015, 56, 493–510. [Google Scholar]
- Chen, X.J.; Yao, G.Q.; Herrero-Bervera, E.; Cai, J.C.; Zhou, K.; Luo, C.F.; Jiang, P.; Lu, J. A new model of pore structure typing based on fractal geometry. Mar. Pet. Geol. 2018, 98, 291–305. [Google Scholar] [CrossRef]
- Zhang, L.; Cao, C.; Zhang, P.; Shi, L.H.; Guo, F.Z. Pore structure classification and logging response characteristics of turbidite reservoir: A case study on Chang 6 reservoir of Huangling oilfield in Ordos basin. Prog. Geophys. 2020, 35, 693–700. [Google Scholar]
- Yan, J.P.; Wen, D.N.; Li, Z.Z.; Geng, B.; Cai, J.G.; Liang, Q.; Yan, Y. The quantitative evaluation method of low permeable sandstone pore structure based on nuclear magnetic resonance (NMR) logging. Prog. Geophys. 2016, 59, 1543–1552. [Google Scholar]
- Zhang, X.W.; Mao, H.Y.; Xie, C.A.; Tan, J.J.; Lai, F.Q. Logging Evaluation Method for the Tight Sandstone Pore Structure in Biyang Depression. Spec. Oil Gas Reservoirs. 2019, 26, 27–32. [Google Scholar]
- Wang, H.; Kou, Z.H.; Bagdonas, D.A.; Phillips, E.H.W.; Alvarado, V.; Johnson, A.C.; Jiao, Z.S.; McLaughlin, J.F.; Quillinan, S.A. Multiscale petrophysical characterization and flow unit classification of the Minnelusa eolian sandstones. J. Hydrol. 2022, 607. [Google Scholar] [CrossRef]
- Kou, Z.H.; Zhang, D.X.; Chen, Z.T.; Xie, Y.X. Quantitatively determine CO2 geosequestration capacity in depleted shale reservoir: A model considering viscous flow, diffusion, and adsorption. Fuel 2022, 309. [Google Scholar] [CrossRef]
- Wang, H.T.; Kou, Z.H.; Guo, J.J.; Chen, Z.T. A semi-analytical model for the transient pressure behaviors of a multiple fractured well in a coal seam gas reservoir. J. Pet. Sci. Eng. 2021, 198, 108159. [Google Scholar] [CrossRef]
- Chen, L.; Jiang, Z.X.; Liu, K.Y.; Gao, F.L. Quantitative characterization of micropore structure for organic-rich Lower Silurian shale in the Upper Yangtze Platform, South China: Implications for shale gas adsorption capacity. Adv. Geo-Energy Res. 2017, 1, 112–123. [Google Scholar] [CrossRef]
- Zeng, X.; Li, W.Q.; Hou, J.; Zhao, W.Q.; Liu, Y.Y.; Kang, Y.B. Fractal Characteristics of Pore-Throats Structure and Quality Evaluation of Carbonate Reservoirs in Eastern Margin of Pre-Caspian Basin. Energies 2022, 15, 6357. [Google Scholar] [CrossRef]
- Zhao, W.Q.; Zhao, L.; Li, J.J.; Hou, J.; Guo, X.J. Graded Control Technology of Oil Stability and Water Control in Fracture-Pore Carbonate Reservoirs. Geofluids 2022, 2022. [Google Scholar] [CrossRef]
- Wang, Z.; Wang, Y.K.; Luo, M.; Kong, L.H.; Lin, Y.P. Carbonate Depositional Facies Analysis and Reservoir Prediction for Central Block in Pre-Caspian Basin. Adv. Mater. Res. 2013, 2482, 734–737. [Google Scholar] [CrossRef]
- Hou, J.; Lin, Y.P.; Zhao, W.Q.; Luo, M.; Li, J.X.; Wang, S.Q. Logging evaluation of Carboniferous Carbonate Reservoir in North Truva Oilfield, Kazakhstan. Mar. Orig. Pet. Geol. 2022, 27, 103–112. [Google Scholar]
- Hou, J.; Liu, B.B.; Wang, S.Q.; Zhao, W.Q.; Li, J.X.; LIN, Y.P. Characteristics of Carboniferous Marine Carbonate Reservoirs in Eastern Margin of Precaspian Basin. Fresenius Environ. Bull. 2022, 31, 911–921. [Google Scholar]
- Dunham, R.J. Classification of carbonate rocks according to depositional texture. In Classification of Carbonate Rocks: A Symposium; Ham, W.E., Ed.; American Association of Petroleum Geologists Memoir: Tulsa, OK, USA, 1962; Volume 1, pp. 108–121. [Google Scholar]
- Kuang, L.C.; Liu, H.; Ren, Y.L.; Luo, K.; Shi, M.Y.; Su, J.; Li, X. Application and development trend of artificial intelligence in petroleum exploration and development. Pet. Explor. Dev. 2021, 48, 1–11. [Google Scholar] [CrossRef]
- Tang, H.; Meddaugh, W.S.; Toomey, N. Using an artificial-neural-network method to predict carbonate well log facies Successfully. SPE Reservoir Eval. Eng. 2011, 14, 35–44. [Google Scholar] [CrossRef]
- Nouri-Taleghani, M.; Kadkhodaie-llkhchi, A.; Karimi-Khaledi, M. Determining hydraulic flow units using a hybrid neural network and multi-resolution graph-based clustering method: Case study from South Pars Gas Field, Iran. J. Pet. Geol. 2015, 38, 177–191. [Google Scholar] [CrossRef]
- Zhang, D.X.; Chen, Y.T.; Meng, J. Synthetic well logs generation via Recurrent Neural Networks. Pet. Explor. Dev. 2018, 45, 598–607. [Google Scholar] [CrossRef]
- Alpana, B.; Hans, B.H. Determination of facies from well logs using modular neural networks. Pet. Geosci. 2018, 8, 217–228. [Google Scholar]
- Wu, H.L.; Wang, C.; Feng, Z.; Yuan, Y.; Wang, H.F.; Xu, B.S. Adaptive multi-resolution graph-based clustering algorithm for electrofacies analysis. Appl. Geophys. 2020, 17, 13–25+167. [Google Scholar] [CrossRef]
- Tian, Y.; Xu, H.; Zhang, X.Y.; Wang, H.J.; Guo, T.C.; Zhang, L.J.; Gong, X.L. Multi-resolution graph-based clustering analysis for lithofacies identifi cation from well log data: Case study of intraplatform bank gas fi elds, Amu Darya Basin. Appl. Geophys. 2016, 13, 598–607+736. [Google Scholar] [CrossRef]
- Zheng, J.Z.; Zhou, H.Y.; Huang, X.X. Analysis on the basic characteristics of petroleum geology and exploration potential in Kazakhstan. China Pet. Explor. 2009, 80, 80–86. [Google Scholar]
- Liang, S.; Wu, Y.D.; Wang, Y.K.; Wang, Z.; Sheng, S.B. Hydrocarbon accumulation characteristics and main control factors of presalt reservoirs in the eastern margin of the Precaspian Basin. China Pet. Explor. 2020, 4, 80–86. [Google Scholar]
- Zhao, L.; Chen, Y.F.; Ning, Z.F.; Fan, Z.F.; Wu, X.L. Experimental evaluation on stress sensitivity of abnormal high pressure carbonate reservoir: A case study of Kenkyak fracture-pore type low permeability carbonate reservoir in the Precaspian Basin. Pet. Explor. Dev. 2013, 40, 194–200. [Google Scholar] [CrossRef]


| Petrophysical Facies | Pore-throat Radius | Capillary Pressure | Symbol |
|---|---|---|---|
| PG1 | 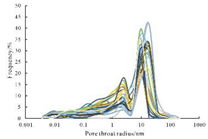 | 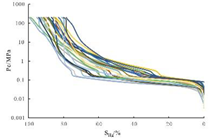 |  |
| PG2 | 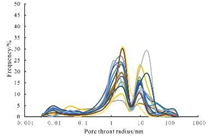 | 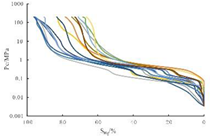 |  |
| PG3 | 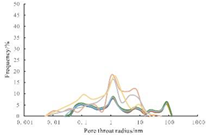 | 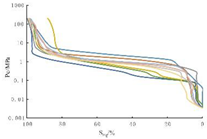 |  |
| PG4 |  | 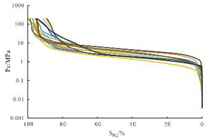 |  |
| PG5 | 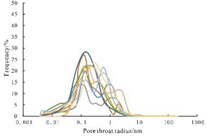 | 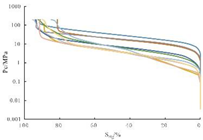 |  |
| PG6 | 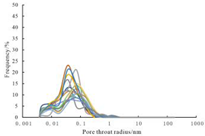 |  |  |
| Well | Depth (m) | Displacement Pressure (MPa) | Median Pressure (MPa) | Median Throat Radius (μm) | Mercury Removal Efficiency (%) | Petrophysical Facies |
|---|---|---|---|---|---|---|
| CT-10 | 2344.88 | 0.62 | 16.34 | 0.04 | 11.34 | PG6 |
| CT-10 | 2345.41 | 0.67 | 14.4 | 0.05 | 4.18 | PG5 |
| CT-10 | 2345.76 | 0.62 | 14.91 | 0.05 | 14.37 | PG5 |
| CT-10 | 2346.11 | 0.19 | 2.3 | 0.32 | 19.44 | PG3 |
| CT-10 | 2346.49 | 0.18 | 2.25 | 0.33 | 5.13 | PG3 |
| CT-10 | 2346.97 | 0.1 | 2.07 | 0.35 | 41.46 | PG4 |
| CT-22 | 2356.03 | 0.0035 | 1.44 | 0.54 | 24.11 | PG1 |
| CT-22 | 2356.15 | 0.0034 | 1.92 | 0.45 | 24.58 | PG1 |
| CT-22 | 2370.10 | 0.0034 | 2.01 | 0.43 | 57.71 | PG2 |
Publisher’s Note: MDPI stays neutral with regard to jurisdictional claims in published maps and institutional affiliations. |
© 2022 by the authors. Licensee MDPI, Basel, Switzerland. This article is an open access article distributed under the terms and conditions of the Creative Commons Attribution (CC BY) license (https://creativecommons.org/licenses/by/4.0/).
Share and Cite
Hou, J.; Zhao, L.; Zeng, X.; Zhao, W.; Chen, Y.; Li, J.; Wang, S.; Wang, J.; Song, H. Characterization and Evaluation of Carbonate Reservoir Pore Structure Based on Machine Learning. Energies 2022, 15, 7126. https://doi.org/10.3390/en15197126
Hou J, Zhao L, Zeng X, Zhao W, Chen Y, Li J, Wang S, Wang J, Song H. Characterization and Evaluation of Carbonate Reservoir Pore Structure Based on Machine Learning. Energies. 2022; 15(19):7126. https://doi.org/10.3390/en15197126
Chicago/Turabian StyleHou, Jue, Lun Zhao, Xing Zeng, Wenqi Zhao, Yefei Chen, Jianxin Li, Shuqin Wang, Jincai Wang, and Heng Song. 2022. "Characterization and Evaluation of Carbonate Reservoir Pore Structure Based on Machine Learning" Energies 15, no. 19: 7126. https://doi.org/10.3390/en15197126