Article

Characterization and Evaluation of Carbonate Reservoir Pore Structure Based on Machine Learning

Institute of Petroleum Exploration & Development, PetroChina, Beijing 100083, China
*
Author to whom correspondence should be addressed.
Energies 2022, 15(19), 7126; https://doi.org/10.3390/en15197126
Submission received: 7 September 2022 / Revised: 23 September 2022 / Accepted: 23 September 2022 / Published: 28 September 2022
(This article belongs to the Special Issue Reservoir Formation Damage Analysis)

Abstract

:
The carboniferous carbonate reservoirs in the North Truva Oilfield have undergone complex sedimentation, diagenesis and tectonic transformation. Various reservoir spaces of pores, caves and fractures, with strong reservoir heterogeneity and diverse pore structures, have been developed. As a result, a quantitative description of the pore structure is difficult, and the accuracy of logging identification and prediction is low. These pose a lot of challenges to reservoir classification and evaluation as well as efficient development of the reservoirs. This study is based on the analysis of core, thin section, scanning electron microscope, high-pressure mercury injection and other data. Six types of petrophysical facies, PG1, PG2, PG3, PG4, PG5, and PG6, were divided according to the displacement pressure, mercury removal efficiency, and median pore-throat radius isobaric mercury parameters, combined with the shape of the capillary pressure curve. The petrophysical facies of the wells with mercury injection data were divided accordingly, and then the machine learning method was applied. The petrophysical facies division results of two mercury injection wells were used as training samples. The artificial neural network (ANN) method was applied to establish a training model of petrophysical facies recognition. Subsequently, the prediction for the petrophysical facies of each well in the oilfield was carried out, and the petrophysical facies division results of other mercury injection wells were applied to verify the prediction. The results show that the overall coincidence rate for identifying petrophysical facies is as high as 89.3%, which can be used for high-precision identification and prediction of petrophysical facies in non-coring wells.

Graphical Abstract

1. Introduction

Carbonate reservoirs play a very important role in oil and gas production in the world, accounting for about 60% of the world’s total oil and gas production [1,2,3,4,5]. Due to the complex sedimentary background and multi-stage diagenetic evolution [6,7,8], carbonate reservoirs generally have poor matrix physical properties, wider pore size distribution, diverse reservoir space types, and complex and irregular pore morphology compared with conventional clastic reservoirs [9]. These features directly affect the seepage capacity and the productivity of the oil and gas reservoir. Quantitative characterization and classification evaluation of microscopic pore structure have become hot issues in the characterization and evaluation of carbonate reservoirs because of their strong heterogeneity and complexity [10]. To do this, there are mainly two approaches at present: core data-based analysis and logging data-based analysis. Saneifar et al. [11] performed Gaussian fitting on the pore-throat distribution curve obtained through mercury injection and divided the reservoir pore structure into macropores, bimodal pores and small pores according to the shape of the fitted curve. Chen et al. [12] proposed a new parameter as an indicator of pore structure based on the fractal theory considering the Kozeny-Carman equation. Zhang Liang et al. [13] applied the logging response parameters such as acoustic transit time, density, neutron, and resistivity to make cross-plots to classify and evaluate different pore structures. Yan Jianping et al. [14] applied radar charts and bubble charts to summarize the logging responses corresponding to each pore structure type and divided the pore structure types qualitatively. Zhang Xinwen et al. [15] combined nuclear magnetic resonance (NMR) logging data with high-pressure mercury injection data to obtain continuous pore structure parameters.
With the application of the studies mentioned above, some scholars have made certain achievements in the characterization and evaluation of reservoir pore structures. However, there are still some deficiencies in existing technical methods due to a wide range of pore sizes, strong heterogeneity, and complex pore structure in carbonate reservoirs. Firstly, the characterization and classification of reservoir pore structures are not detailed enough. They are mostly based on factors such as pore-throat size or pore-throat distribution characteristics, without comprehensively considering the subtle differences in pore structure reflected by multiple factors. Secondly, the classification and evaluation of reservoir pore structure are usually completed through core experiments whereas the core data is usually limited. Logging data is therefore required to predict the type of reservoir pore structure. Most of the existing classification and evaluation work is completed by qualitative methods or linear regression models with rather limited accuracy. Finally, although nuclear magnetic resonance (NMR) logging data is reliable for constructing a pseudo capillary pressure curve for calculating pore structure parameters, it is not a widely-applied conventional logging method. Many old wells and development wells do not have such logging projects. The cost of acquiring nuclear magnetic resonance (NMR) logging data is also too high for large-scale applications. Taking the North Truva Oilfield in the Pre-Caspian Basin as an example and referring to the previous technical ideas in hydrocarbon development [16,17,18,19], in this paper, (1) the pores and throats are studied by cores, cast thin sections and scanning electron microscopy to define the types and criteria of pore configuration. (2) Different petrophysical facies were divided based on mercury injection parameters and shapes of capillary pressure curve shapes. (3) They were then identified and predicted with high precision through machine learning methods for the wells in the oilfield. (4) A complete methodology was established for characterizing and evaluating the pore structure of complex carbonate reservoirs, which is of great significance to the efficient development of such oilfields.

2. Geological Overview of the Study Area

The Pre-Caspian Basin, also known as the North Caspian Basin, is located in the northwest, north and northeast of the Caspian Sea, spanning the territory of Kazakhstan and Russia. The Caspian Basin extends in the EW direction, with a length of 1000 km in the EW direction and a width of up to 650 km in the NS direction. The outline of the basin is approximately oval. It covers an area of 50 × 104 km2, of which about 85% is located in western Kazakhstan and 15% is located in southern Russia. Geotectonically, the Pre-Caspian Basin is located in the southeastern part of the Eastern European platform. It extends to the Ural Hercynian fold belt in the east. It has been a superimposed basin since the Late Proterozoic. The interior of the basin can be further divided into four secondary tectonic units, including the fault terrace belt (north and northwest), the central depression belt, the southeast uplift belt and the southern uplift belt, together with a large number of secondary structural units (Figure 1). The Pre-Caspian Basin is a world-famous super-large hydrocarbon-bearing basin [20,21,22]. So far, a series of large and super-large carbonate oil and gas fields have been discovered under the Permian salt layer, such as Astrakhan, Zanarol, Tengiz, Kenkiyak and Kashagan.
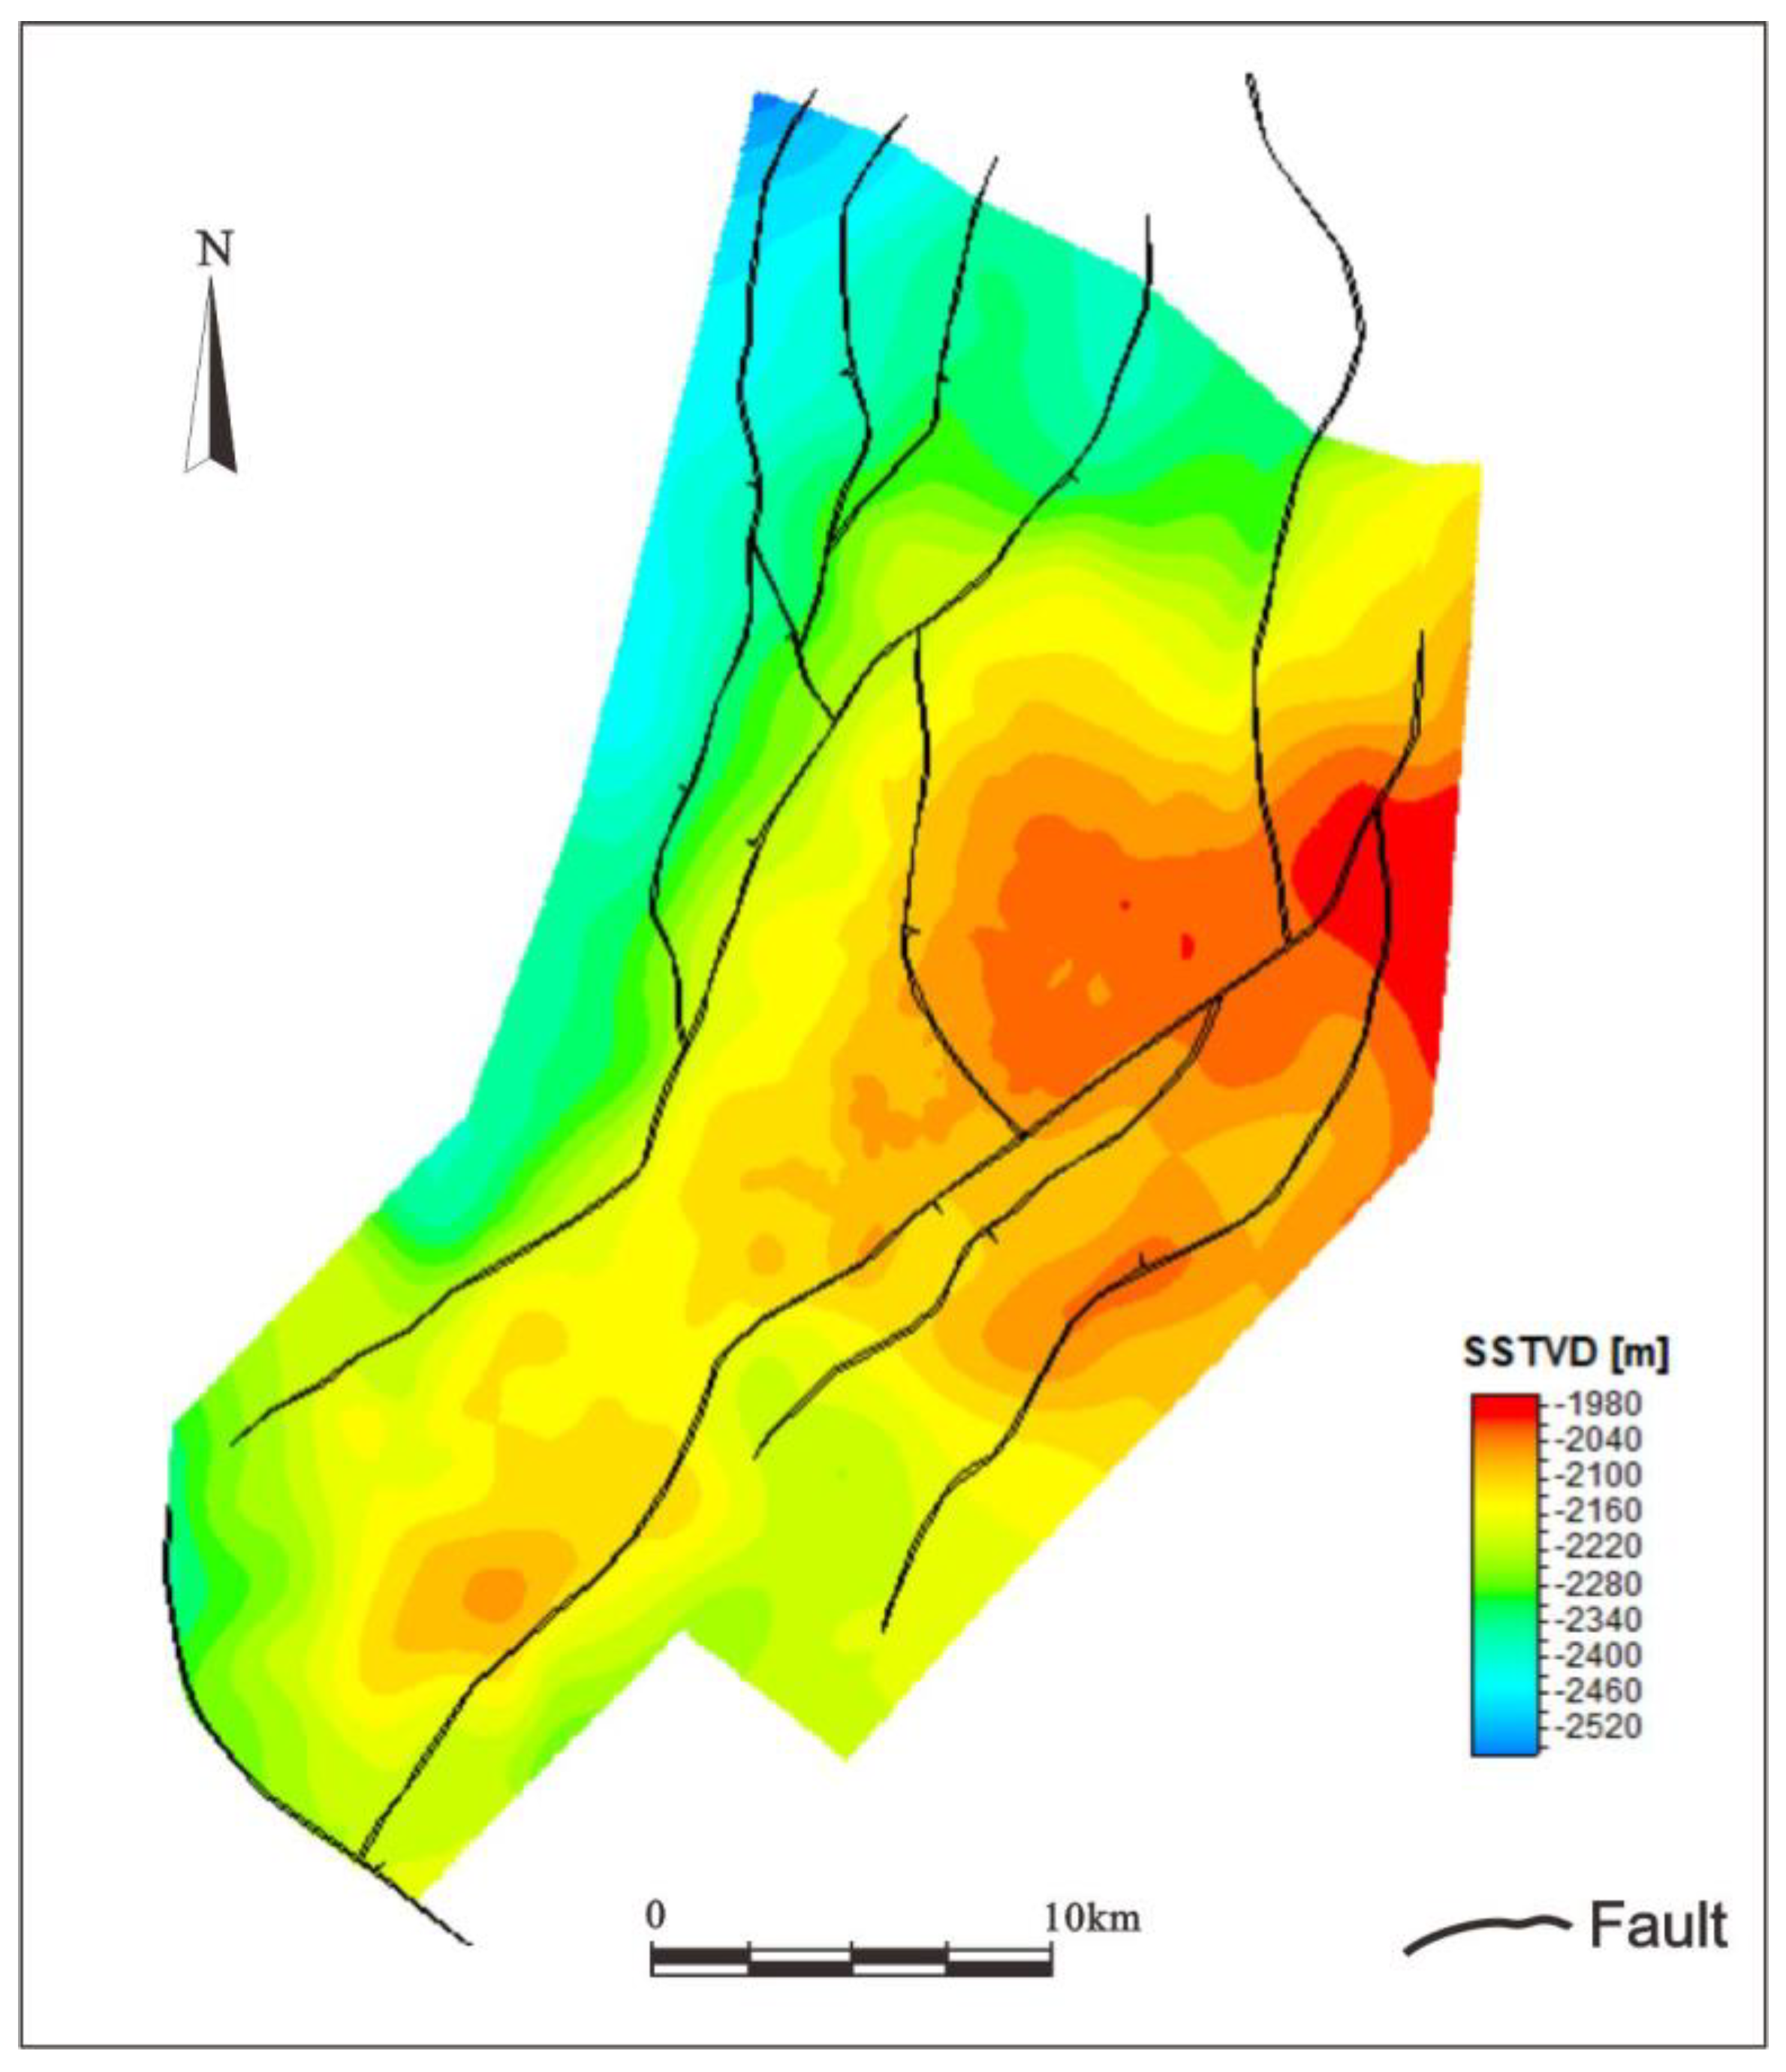
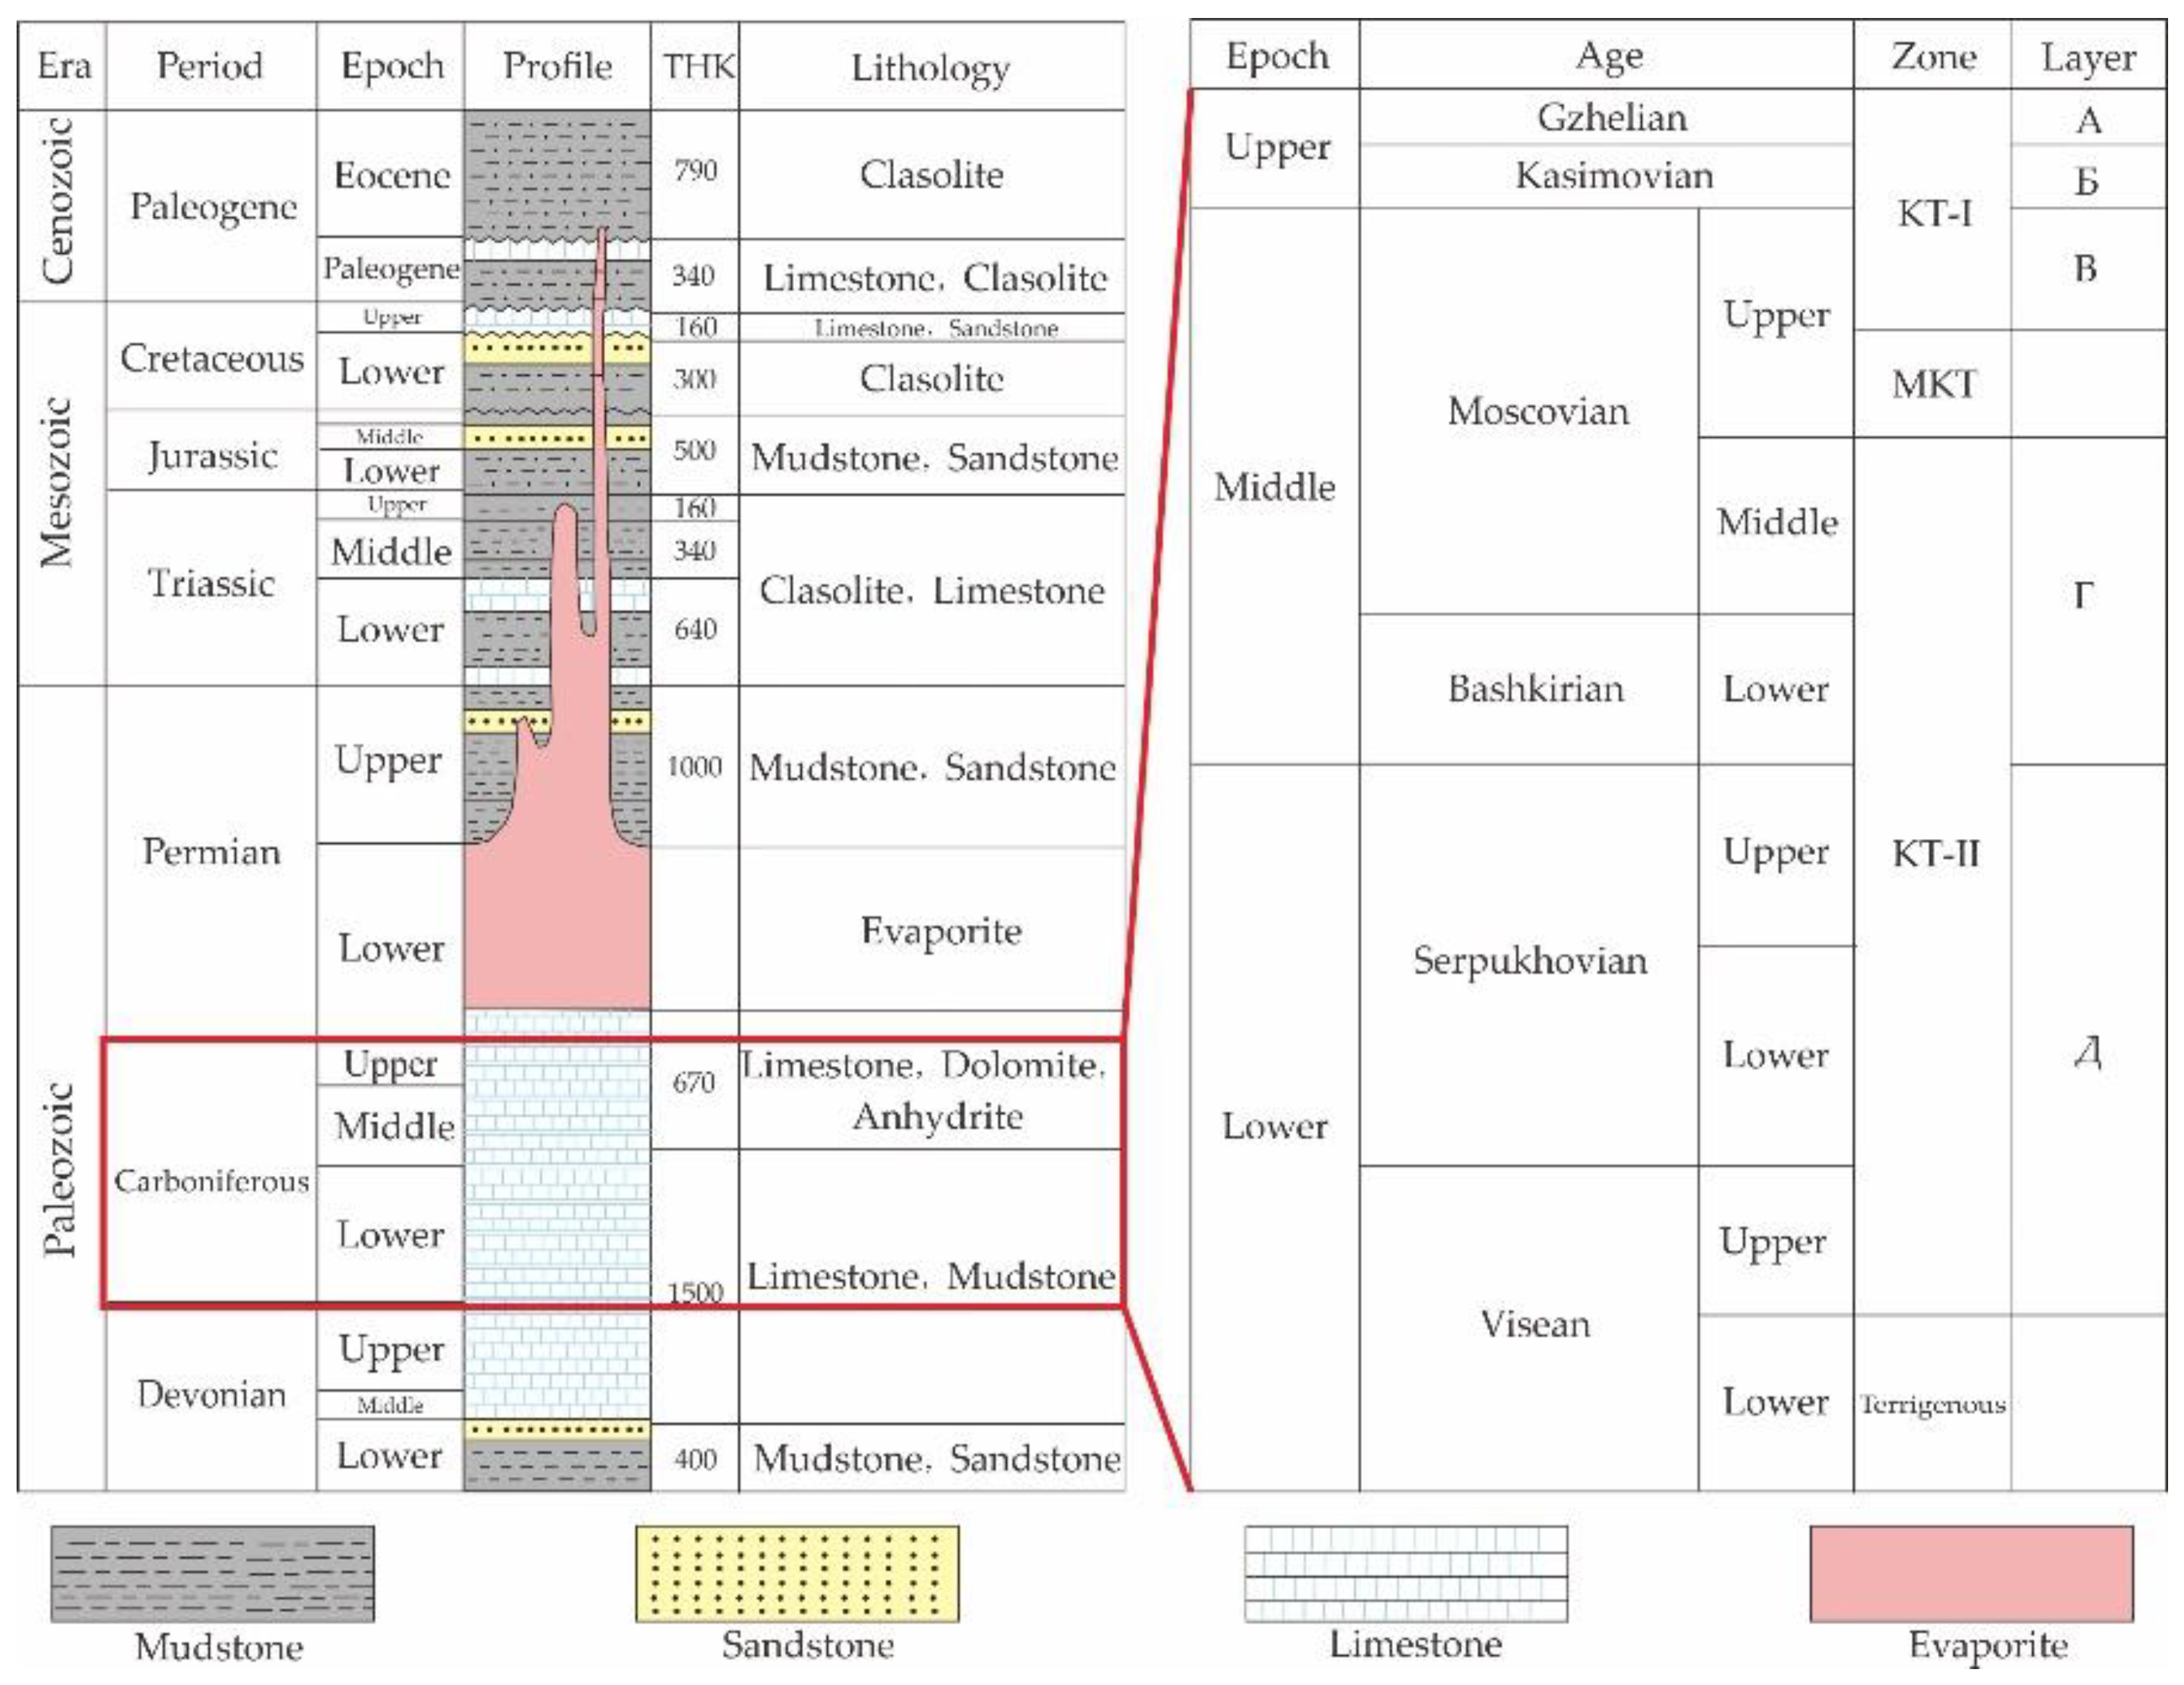
The North Truva Oilfield is located on the eastern margin of the Pre-Caspian Basin and is a large weakly volatile complex carbonate reservoir with a condensate gas cap [23]. The oilfield is located in the central block of the eastern slope of the Yanbek-Zarkames paleo-uplift in the eastern margin of the Pre-Caspian Basin, which is a NE-SW trending faulted anticline [24]; there are 10 faults developed in North Truva Oilfield, mainly in the NE strike. The structure is cut into 10 fault blocks by faults (Figure 2). In the oilfield, the strata revealed by drilling are Quaternary to Devonian. Salt dome structures are developed in the Lower Permian Kungurian Stage. Bounded by the salt deposits, the main oil-bearing layers are located in the Middle-Upper Carboniferous of the Subsalt Carboniferous, including two sets of oil layers named KT-I and KT-II and a terrigenous clastic interlayer with a thickness of about 350 m. The KT-I oil layer is composed of three sublayers: A, Б, and B; and the KT-II oil layer is composed of two sublayers, Г and Д (Figure 3).

3. Materials and Methods

The results of the study on Carboniferous reservoirs in the North Truva Oilfield are mainly from wells CT-4, CT-22, CT-41, CT-52, 5555, 5598, A-4, and A-7, etc. The coring interval covers are sub-layers from A to Г. The study involved the observation of cores, thin section analysis, physical property analysis and mercury injection analysis. The research on the type and morphology of the reservoir space is mainly based on the microstructure analysis of cast thin sections using scanning electron microscopy. The nomenclature of carbonate rocks is based on the classification scheme of Dunham [25] and Folk. The systematic analysis of rock pores, throat types and characteristics were then undertaken, and the quantitative division basis and scheme of the pore structure were determined. Combined with the shape of the capillary pressure curve, six types of petrophysical facies were divided. The method of machine learning was used to identify and predict the petrophysical facies of the reservoir. Finally, the main controlling factors and causes of pore structure differences were analyzed.
Artificial neural networks (ANN) are widely used for classification and recognition. BP ANN is the most widely used network, including the input layer, hidden layer, and output layer. It is a multi-layer feedforward network trained according to the backpropagation (BP) algorithm, whose network learning can store a large number of input and output mode mapping relationships [26,27,28,29,30].
The specific implementation steps of the ANN algorithm are as follows:
1.
Network initialization.
Each connection weight is assigned a random number in the interval (−1, 1), the error function e is set, the calculation precision value ε and the maximum learning times M are given.
2.
Randomly select the kth input sample and the corresponding expected output.
do(k) = [d1(k), d2(k), …, d] q(k)
x(k) = [x1(k), x2(k), …, x] n(k)
3.
Calculate the input and output of each neuron in the hidden layer.
4.
Calculate the partial derivative δo(k) of the error function to each neuron in the output layer with the expected output and actual output of the network.
5.
Calculate the partial derivative δh(k) of the error function to each neuron in the hidden layer with the connection weight from the hidden layer to the output layer, δo(k) of the output layer and the output of the hidden layer.
6.
Correct the connection weight who(k) with the δo(k) of each neuron in the output layer and the output of each neuron in the hidden layer.
7.
Correct the connection weight with the δh(k) of each neuron in the hidden layer and the input of each neuron in the input layer.
8.
Calculate the global error.
E = 1 2 k = 1 m o = 1 q [ d o ( k ) y o ( k ) ] 2
9.
Determine whether the network error meets the requirements. When the error reaches the preset accuracy or the number of learning times exceeds the given maximum number of times, the algorithm ends. Otherwise, select the next learning sample and its corresponding expected output, return to Step 3, and enter the next round of learning.
For the Multi-Resolution Graph-based Clustering (MRGC) method, the similarity between sampling points is measured with the Euclidean distance, and the relation of attracting or being attracted between sampling points is determined based on the Euclidean distance matrix. Considering the adsorption relation between sampling points, the attraction ability of each sampling point to all other sampling points is expressed by the neighbor index (NI), and the sampling point with the maximum NI is taken as the final attraction center. The whole sample set is divided into several attraction sets, and the center of each attraction set is represented by the kernel representative index (KRI). The classification number of each level for the multi-level classification is obtained by the descending sequencing of KRIs, and the final classification result is obtained by the multi-level fusion of attraction sets [31,32].
MRGC adopts the vector space model. For such models, the selected model curve and prediction curve are transformed into several feature component spaces (t1, t2, t3, …, tk), and the values assigned in the curve data to each feature sample are filled into the vector space. The mathematical expression form of the last sample data dj is:
Wj (W1j, W2j, …, Wkj, …, W|T|j)
The sample similarity between the model curve and the prediction curve is measured by the geometric relationship of two vectors. Assuming there are two feature vectors X = (x1, x2,..., x|T|) and Y = (y1, y2,…, y|T|), their similarity is calculated by the Euclidean distance equation, as follows:
sim ( X , Y ) = i = 1 | T | x i y i i = 1 | T | x i 2 · i = 1 | T | y i 2
The distance between the feature vector to be predicted and all feature vectors in the data set can be calculated using Equation (2). The distance is converted into a weight value through the Gaussian function, and the prediction result is compensated by the contribution value based on the specific distance. Each nearest neighboring feature sample is multiplied by the corresponding weight, and all the obtained results are accumulated and then divided by the sum of all weight values, as follows:
P = i = 1 k S i · w i j = 1 k w j
The k-nearest neighbors (KNN) algorithm is one of the simplest methods in machine learning algorithms. Each sample can be represented by its nearest k neighbors. The distance between the sample and all other neighbors is calculated; the k neighbors nearest to the sample are taken; then the class with the largest proportion within these k neighbors is determined. Thus, these samples are of this class. This algorithm requires no learning or training. Based on the classification results of the samples that are obtained using the MRGC method, the lithology can be accurately predicted through the KNN algorithm.
Compared with machine learning methods such as MRGC and KNN, ANN has strong fault tolerance and a self-learning adaptive capability. With suitable and representative learning samples, it can display the advantages of the ANN machine learning method, which is applicable to the prediction of the reservoir pore structure in the North Truva oilfield.

4. Results

4.1. Petrological Characteristics of Reservoir

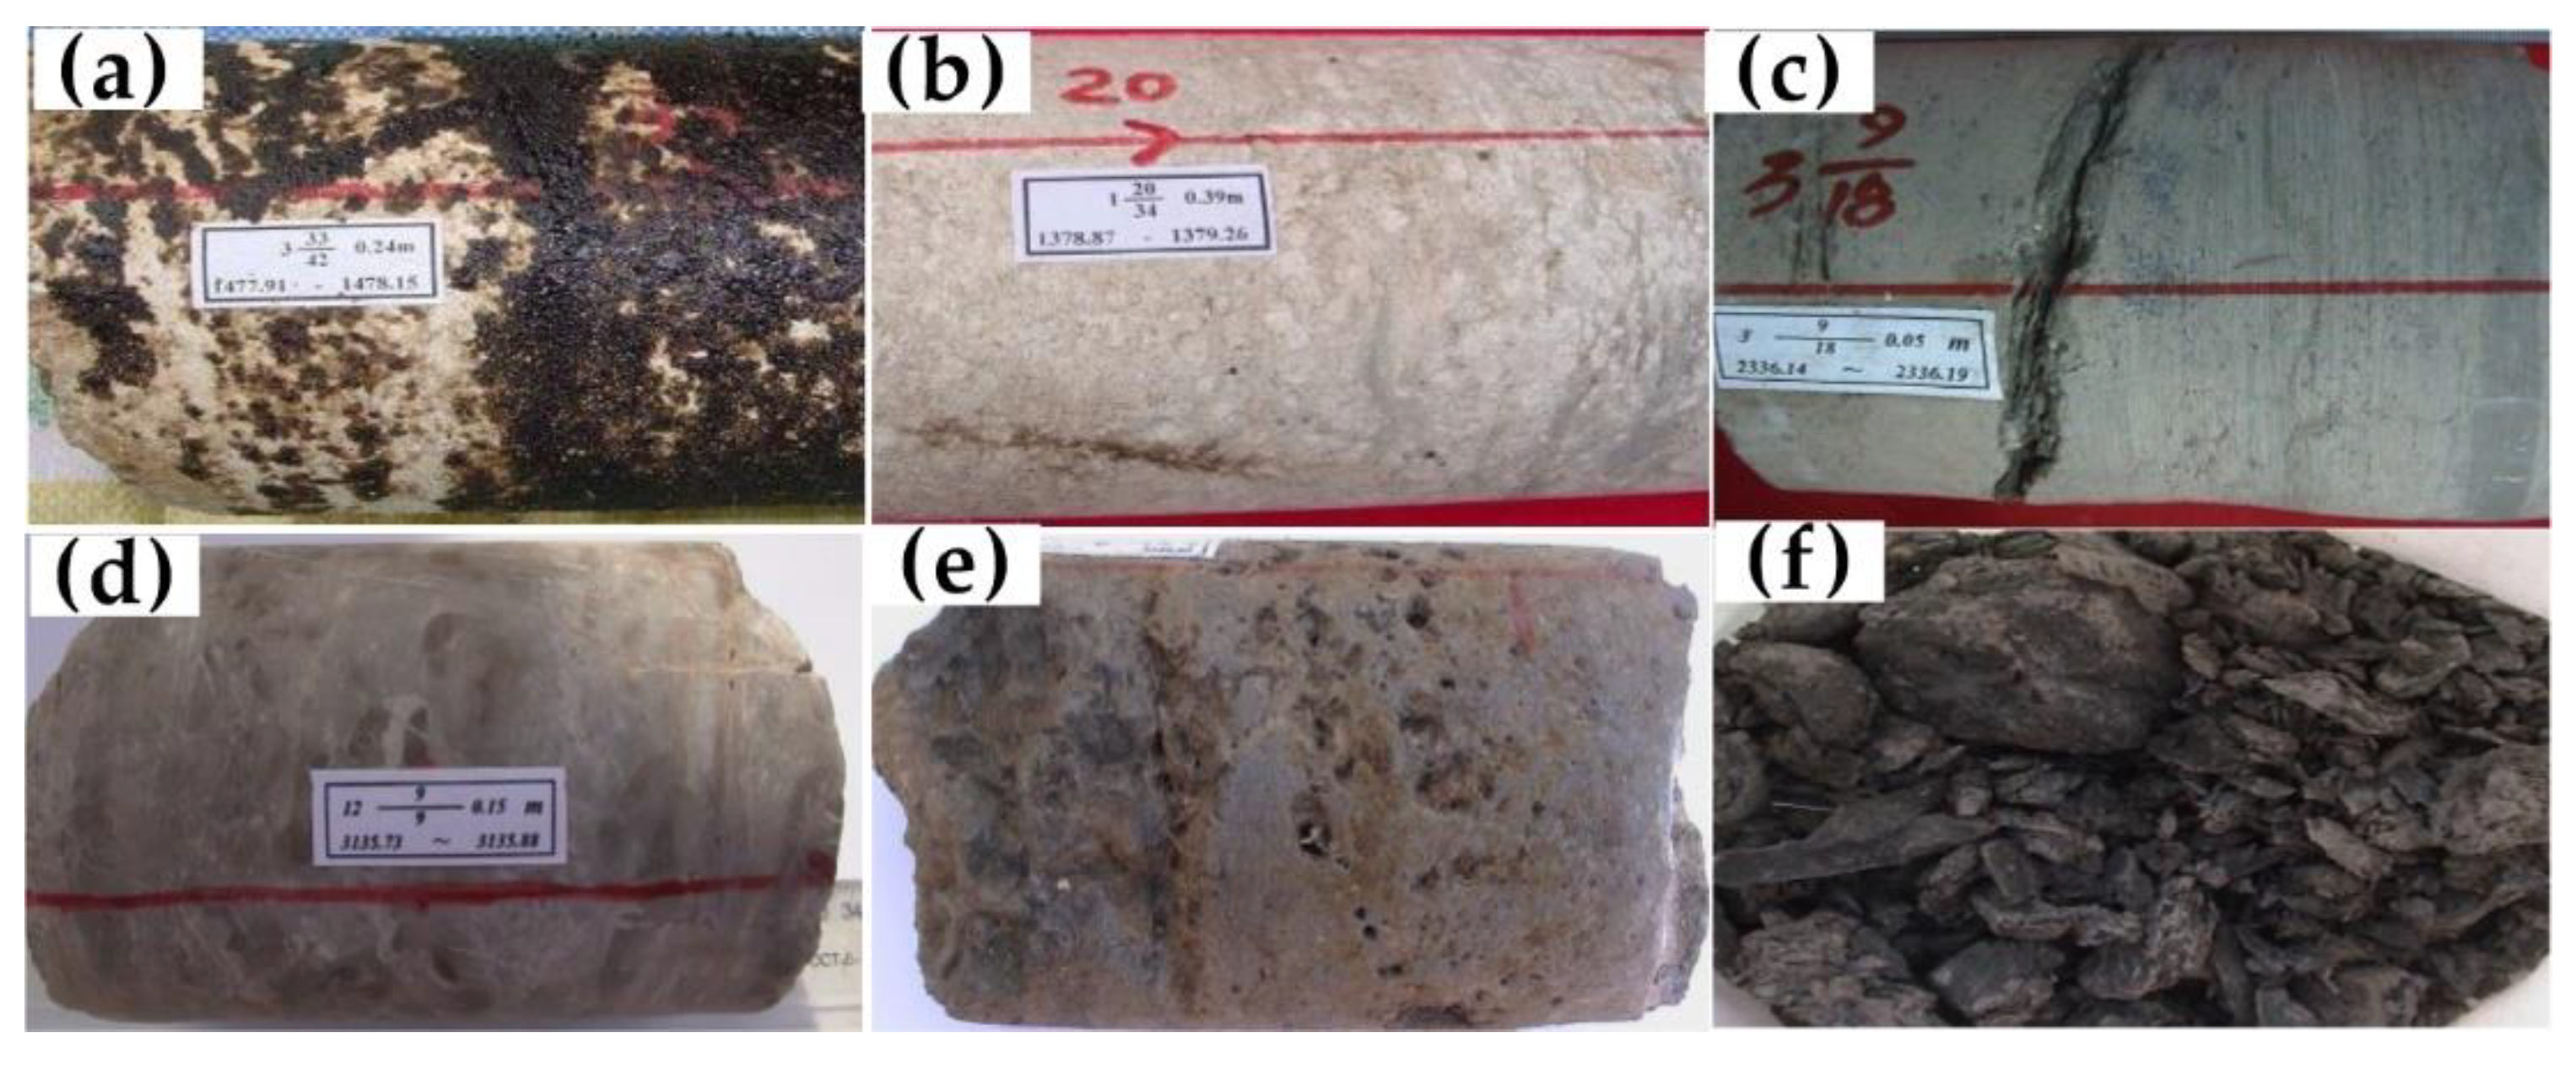
There are many kinds of lithology in the North Truva Oilfield [33,34,35]. Through the analysis of the core, casting thin section, scanning electron microscope, etc., the lithology is divided into four categories: limestone, dolomite, gypsum rock and other rocks (including mudstone, siliceous limestone and migmatite), according to the nomenclature and classification scheme of Dunham and Folk. Specifically, it mainly includes grainstone, packstone, wackestone, grain dolomite, mudstone, siliceous limestone, and gypsum rock (Figure 4). The lithology of the KT-I layer is mainly grainstone, graindolomite, gypsum, and mudstone; its mineral components are mainly calcite and dolomite, with a small number of clay minerals, trace pyrite, kaolinite, fluorite, etc.in some parts. The lithology of the KT-II layer is mainly grainstone, packstone, wackestone, siliceous limestone and mudstone; its mineral composition is calcite, which accounts for more than 90% of the total.

4.2. Pores and Throats

4.2.1. Pore Types and Characteristics

According to the analysis of 1360 casting thin sections and 258 scanning electron microscopes in the reservoir intervals of the research strata, it is recognized that the reservoir pores in the North Truva Oilfield are well developed. There are also vugs and fractures which can be divided into primary pores and secondary pores according to origin. Primary pores refer to those formed during deposition at the contemporaneous or quasi-contemporaneous period, which are mainly controlled by the carbonate rock components, which are generally intergranular dissolved pores and body cavity pores. Secondary pores mainly refer to those formed by dissolution. The common ones include intercrystalline dissolved pores, shell dissolved pores, crystal mold pores, and vugs (dissolved pores with a diameter greater than 2 mm) (Figure 4e). The fractures mainly include structural fractures strongly filled with calcite, dissolution fractures weakly filled with calcite (Figure 4c), pressure-dissolution fractures and diagenetic fractures.
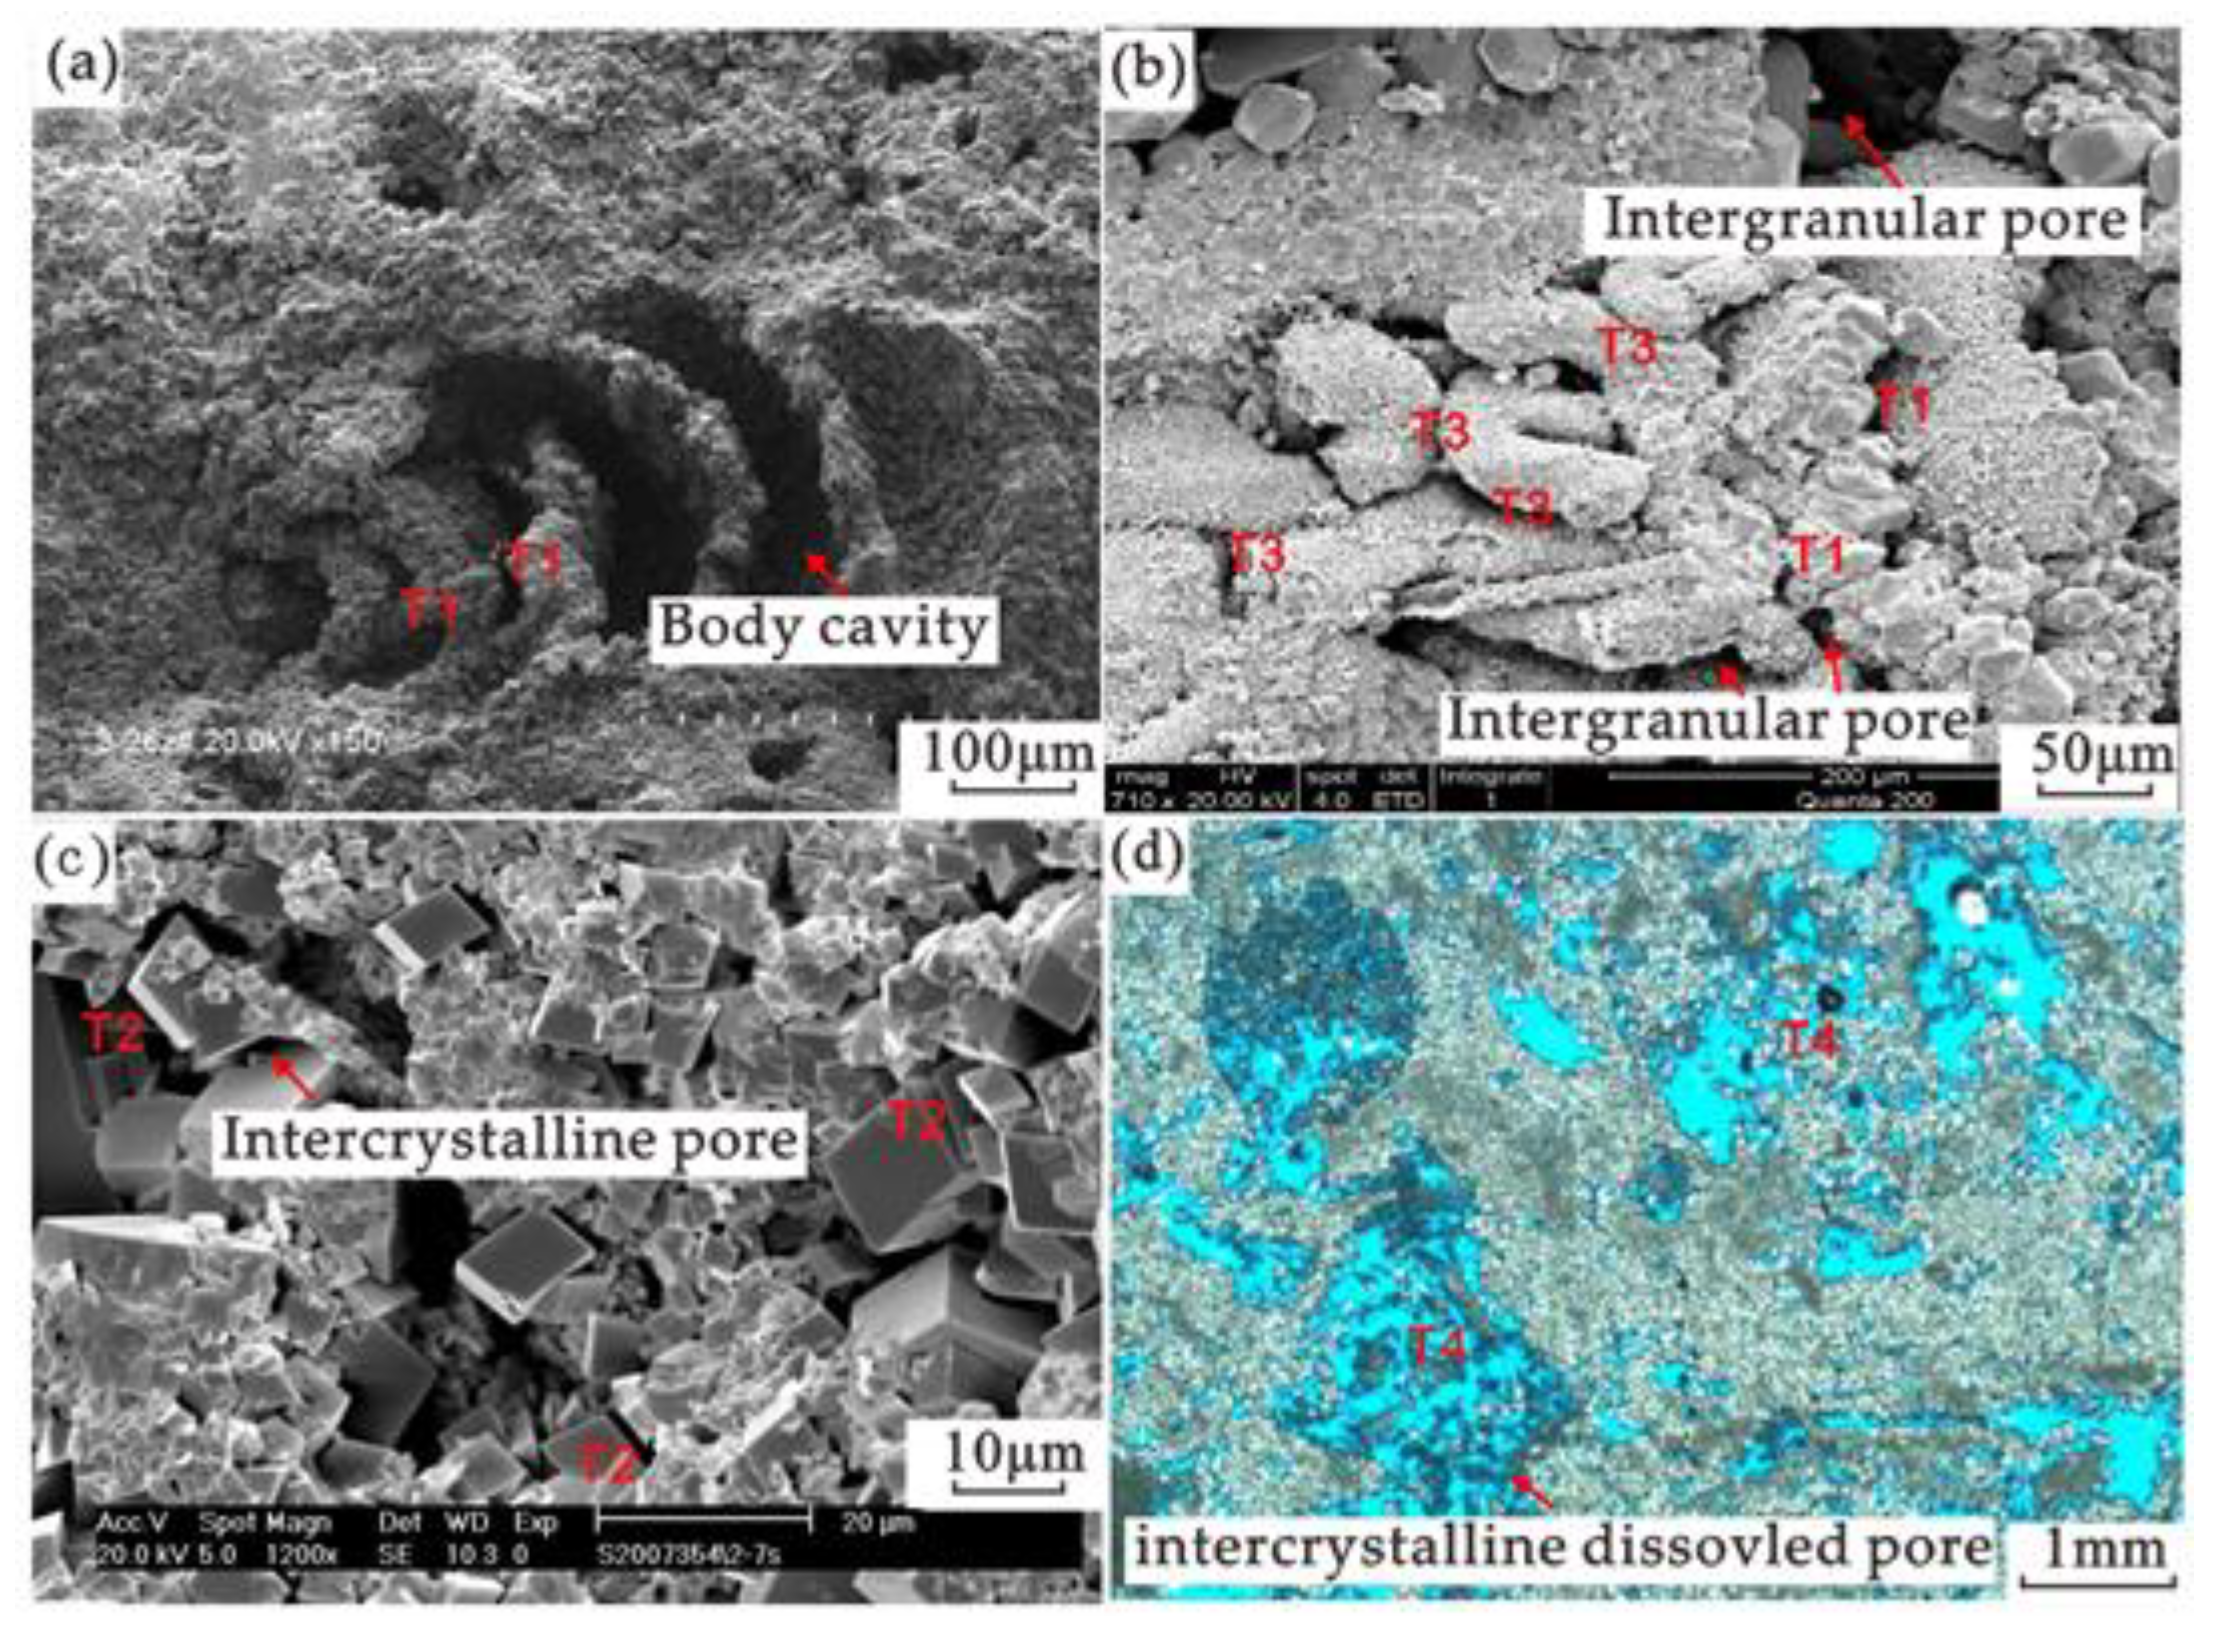
Body cavity pores (Figure 5a) are those in the inner body cavity of the particles after the death and burial of various organisms, mainly developed in foraminifera and flies, with a pore size of 0.1–0.5 mm. Intergranular pores (Figure 5b) are those preserved between carbonate particles after multiple stages of cementation, filling and compaction, and the pore size is generally 0.05–0.2 mm. Intercrystalline pores (Figure 5c) are those mainly present between carbonate rock mineral crystals. Most of them are developed and preserved between well-crystallized dolomite crystals, are polygonal, and the pore size is 0.01–0.2 mm, which is generally smaller than that of crystals. Intercrystalline dissolved pores (Figure 5d) are formed by dissolution and expansion along the intercrystalline pores after the dissolution fluid enters the dolomite intercrystalline pores during the diagenetic stage, with a pore size of 0.1–0.5 mm. Intragranular dissolved pores (Figure 5e) are generated by the partial selective dissolution of the dissolution fluid inside the particle or the biological hard shell, with a pore size of 0.05–0.2 mm. Mold pores (Figure 5f) are those keeping the shape of the original particles formed after the further fabric-selective dissolution of the intragranular pores, with a pore size of 0.05–0.2 mm.

4.2.2. Throat Types and Characteristics

Four types of throats are mainly developed in the vuggy reservoirs of the Carboniferous KT-I layer in the North Truva Oilfield: pore-reduced throat (T1), sheet throat (T2), tubular throat (T3), and network throat (T4). Pore-reduced throats are mainly formed due to the shrinkage of pore space caused by crystal growth or filler filling and are mainly present in intergranular (dissolution) pores and body cavity pores (Figure 6a,b). Sheet throats are mainly developed in graindolomite, which are polyhedral pores connecting dolomite grains. Sheet throats are narrow, mostly between a few microns and a dozen microns (Figure 6c). The tubular throat is a slender, nearly circular tube bundle-shaped throat space formed by incomplete contact between pores, which mainly occurs in intergranular (dissolution) pores (Figure 6b). The network throat connects various pore spaces mainly due to the strong dissolution effect. The network throat is short and thick, with a high coordination number, which can significantly improve the connectivity of the pore space (Figure 6d).

4.3. Pore Structure Types

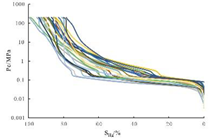
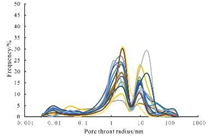
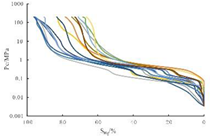
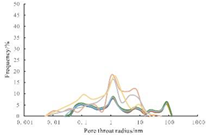
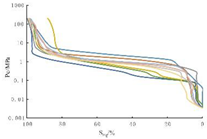
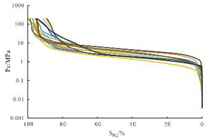
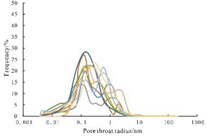
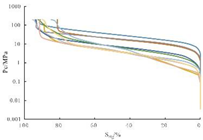
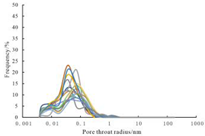
The North Truva oilfield has features of various pore types, complex combinations, a poor porosity-permeability relationship, and mixed types of mercury injection curves. Therefore, it is difficult to divide the difference between reservoir pore structures by a single parameter of physical property parameters or pore structure parameters. The parameters of the high-pressure mercury injection curve can well reflect the pore structure characteristics of the reservoir: displacement pressure, median pressure and median throat radius reflect the size of pore throats; mercury removal efficiency reflects the connectivity of pore throats; porosity and permeability reflect the seepage capacity of the reservoir. Ninety-six samples were selected for high-pressure mercury injection experiments. According to the mercury injection parameters and the shape of the capillary pressure curve, the pore structure of the Ma5 Member reservoir was divided into six types of petrophysical facies (PG1, PG2, PG3, PG4, PG5, and PG6). Different colors of lines represent different rock samples of mercury injection, the pore-throat radius, and the capillary pressure curve of the same mercury intrusion rock sample are expressed in one color (Table 1).
The distribution of PG1 pore-throats is dominated by double peaks of large and weak pore throats. The capillary pressure curve is in the shape of a left concave long platform (Table 1). The porosity is between 13.4–36.3%, the permeability is 12.24–209 mD, the displacement pressure is 0.0035–0.398 MPa, and the median pressure is between 0.18–16.02 MPa. The median throat radius is between 0.0468–4.2182 μm, and the mercury removal efficiency is between 3.2–31.0%. This type is the best quality reservoir in the study area. The PG2 pore-throat distribution is dominated by large and medium pore-throat double peaks. The capillary pressure curve was in the shape of a left concave middle-long platform (Table 1). The porosity is 12.1–25.4%, the permeability is 12.07–906 mD, the displacement pressure is 0.005–0.614 MPa, and the median pressure is 0.047–23.02 MPa. The median throat radius is 0.032–15.865 μm, and the mercury removal efficiency is between 7.4–60.5%. This type is of good quality in the study area. The pore-throat distribution of PG3 is dominated by the multimodal dispersion of median-pore-throat. The capillary pressure curve is of a left concave low slope shape (Table 1). The porosity is 12.2–19.2%, the permeability is 1.01–9.26 mD, the displacement pressure is 0.01–2.01 MPa, the median pressure is 0.28–26.09 MPa, the median throat radius is 0.031–2.645 μm, and the mercury removal efficiency is 8.6–87.2%. This type is of medium quality in the study area. The pore-throat distribution of PG4 is dominated by a single peak of small and medium pore-throat. The capillary pressure curve is of a left concave high slope shape (Table 1). The porosity distribution is between 3.1–11.9%, the permeability distribution is 1.01–9.98 mD, the displacement pressure is 0.005–5.02 MPa, the median pressure is 0.16–32.79 MPa, the median throat radius is 0.023–4.796 μm, and the mercury removal efficiency is 6.3–42.2%. This type is a poor-quality reservoir in the study area. The pore-throat distribution of PG5 is dominated by medium-weak double peaks of small pore-throat. The capillary pressure curve is in the shape of a left concave high slope and a right convex high slope (Table 1). The porosity is 3.2–11.9%, the permeability is 0.0001–0.996 mD, the displacement pressure is 0.01–7.95 MPa, and the median pressure is 0.14–120.64 MPa. The median throat radius is 0.0062–5.08 μm, and the mercury removal efficiency is 7.9–59.2%. This type is a poor-quality reservoir in the study area. The distribution of PG6 pore throats is dominated by weak double peaks in tiny pore throats. The capillary pressure curve was in the shape of a right convex high slope (Table 1). The porosity is distributed 0.2–3%, the permeability distribution is 0.0001–0.97 mD, the displacement pressure is 0.01–74.1 MPa, the median pressure is 12.21–177.23 MPa, the median throat radius is 0.0042–0.06 μm, and the mercury removal efficiency is 8.6–65.4%. This type is of the worst quality reservoir in the study area. The six types of petrophysical facies are marked with different colors. The legends in the following logging identification petrophysical facies map are all based on the marks in Table 1.

4.4. Identification of Petrophysical Facies Based on Machine Learning Method

Based on logging curves, the machine learning method is applied to identify petrophysical facies. When selecting logging curves, well sections with poor wellbore conditions or drilling fluid quality should be excluded. Meanwhile, inter-well standardization should be carried out to eliminate errors caused by the environment and different logging instruments. For the selected logging curves, their correlation with petrophysical facies and physical meaning should both be considered. The photoelectric absorption cross-section index (PE) value reflects the average atomic number of the rock based on the principle of the photoelectric effect, well reflecting the lithology of the reservoir. The lithology is closely related to the pore structure of the reservoir. Neutron (CNC) and Density (DEN) reflect the physical properties of the reservoir, showing the difference in the seepage capacity of the reservoir. Gamma Ray (GR) reflects the shale content of the reservoir and further subdivides the subtle differences between different petrophysical facies.
According to the mercury injection parameters such as displacement pressure, median pressure, median throat radius and mercury removal efficiency, the petrophysical facies of CT-10 and CT-22 mercury injection wells are divided (Table 2). One hundred and seventeen petrophysical facies division results are taken as training data, including six petrophysical facies: PG1, PG2, PG3, PG4, PG5 and PG6. Fifteen of them are from PG1, eight are from PG2, 17 are from PG3, 16 are from PG4, 38 are from PG5 and 23 are from PG6.
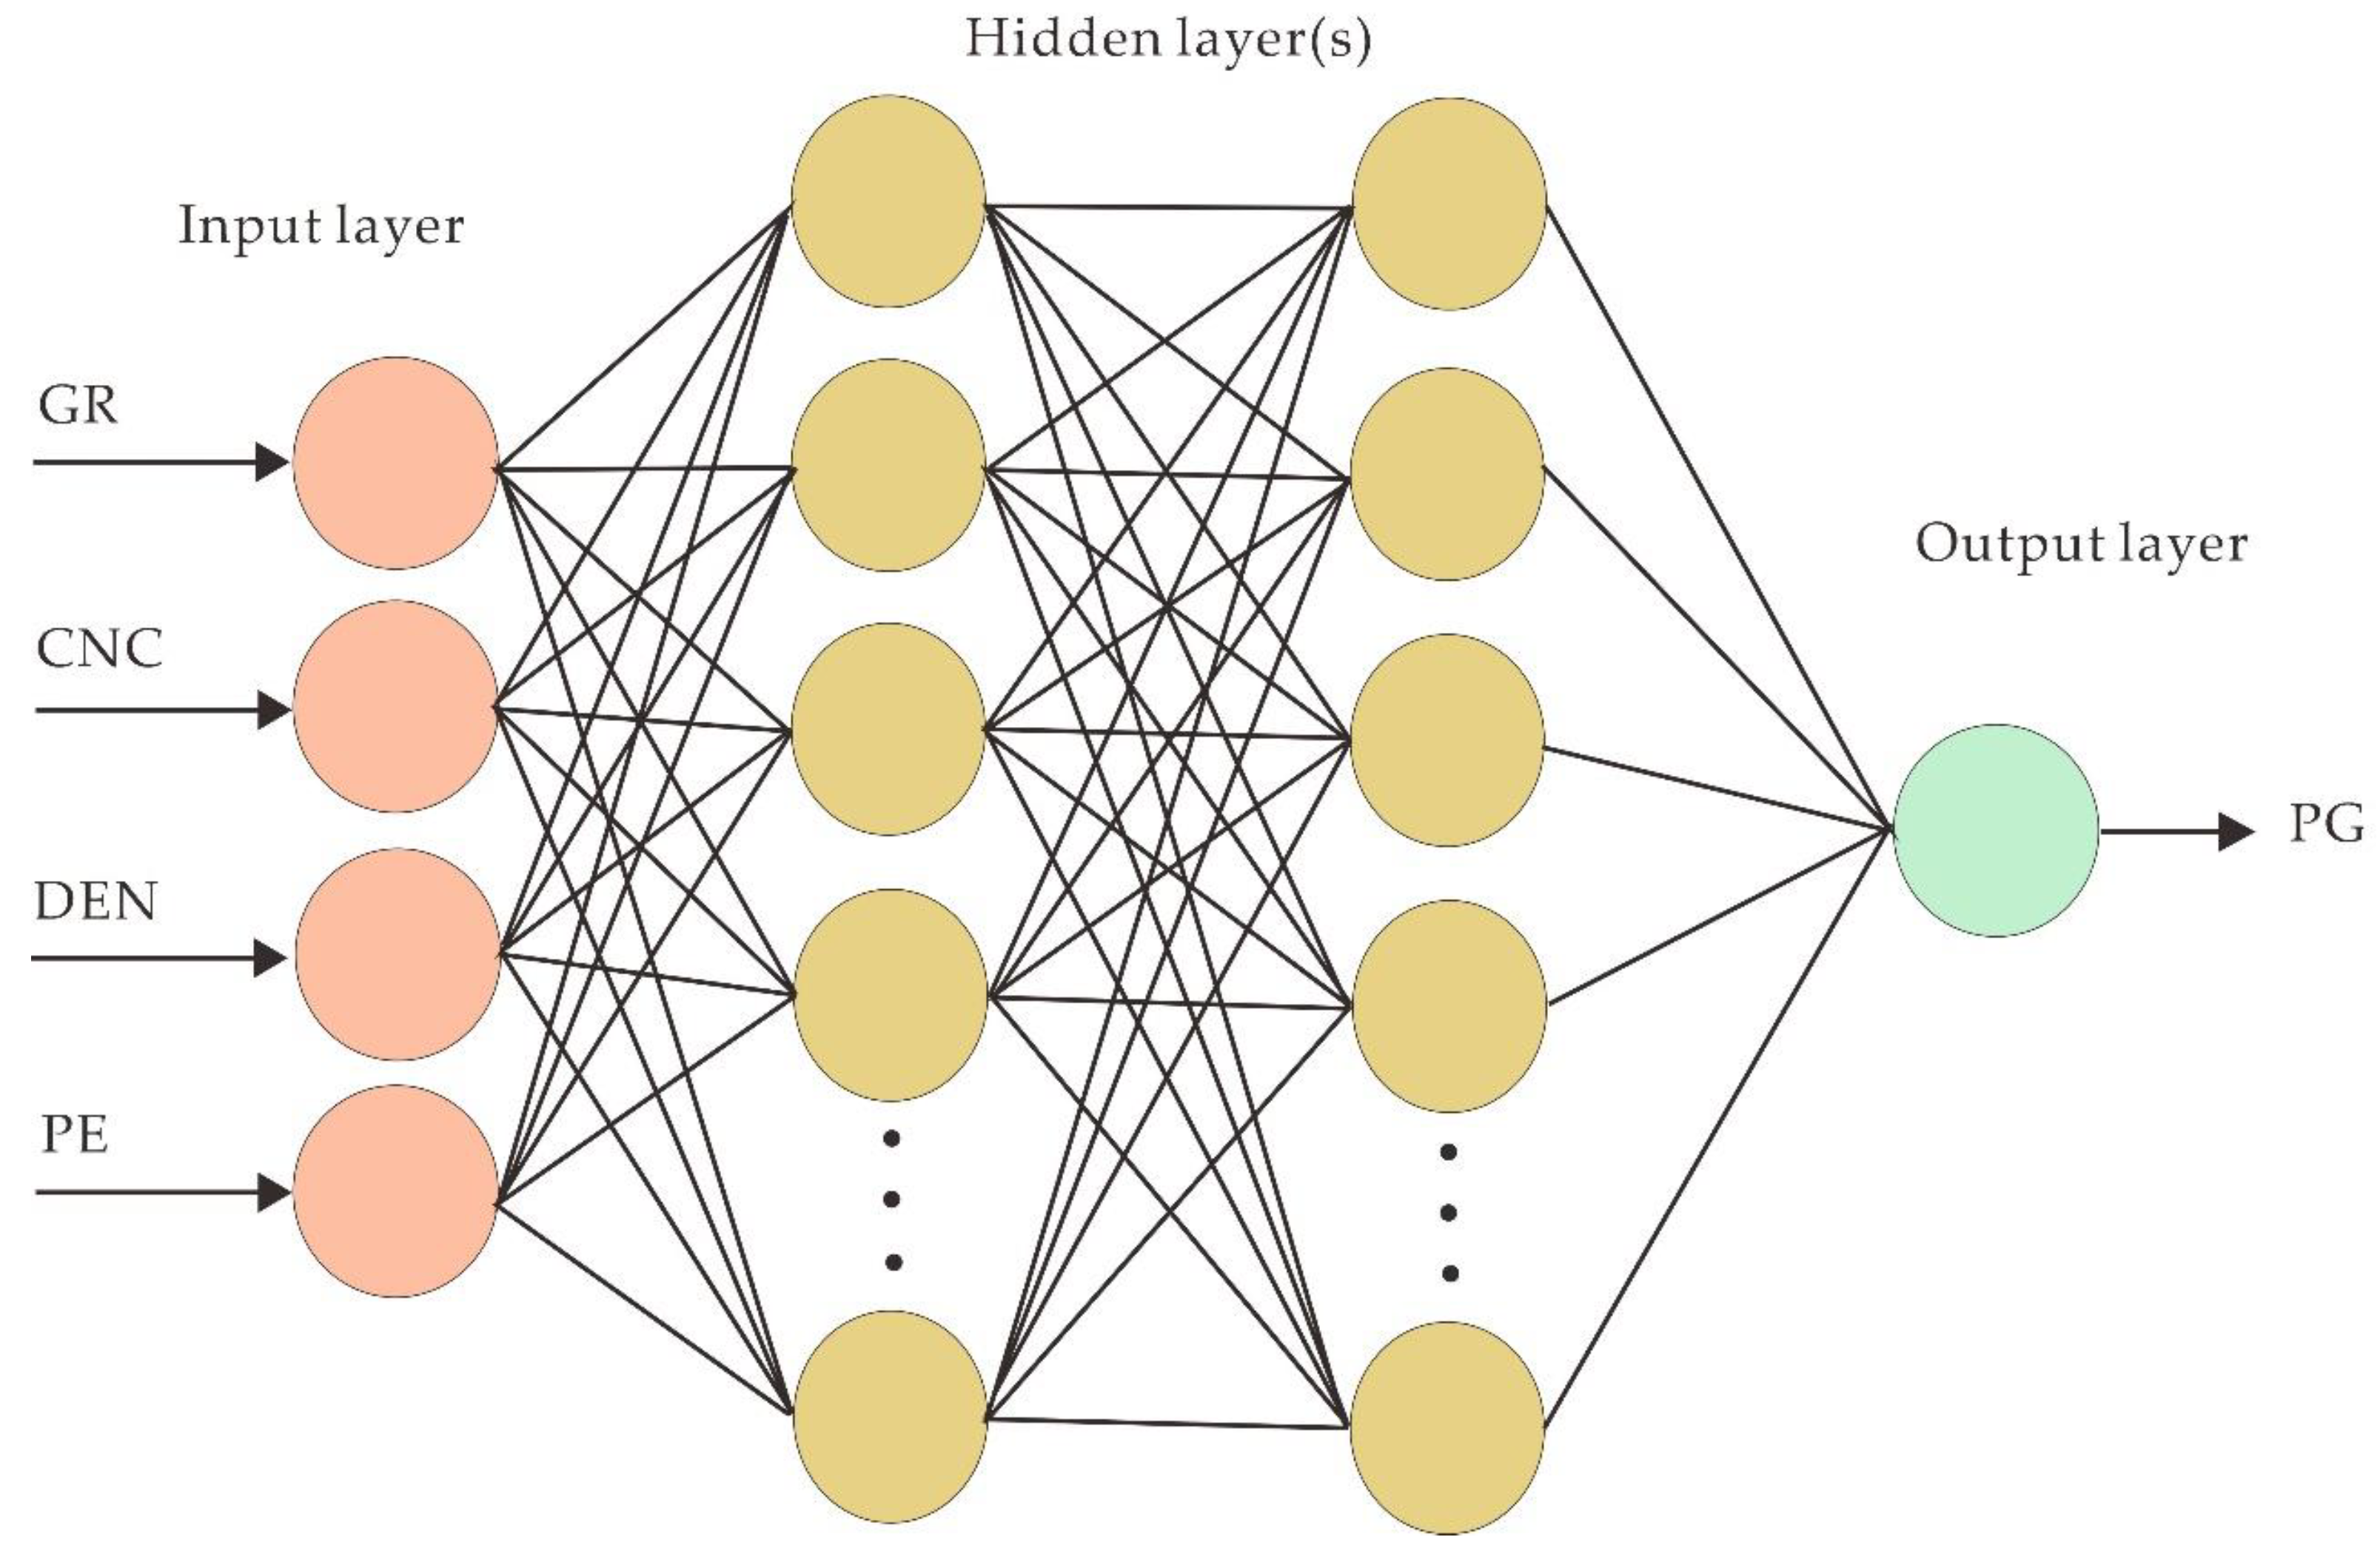
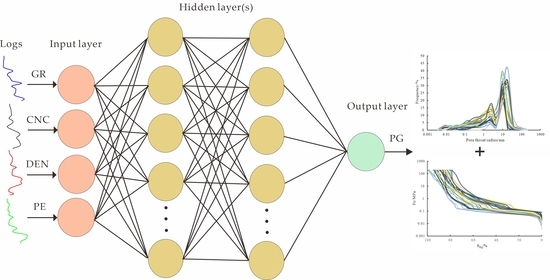
In this paper, gamma ray, neutron, density, photoelectric absorption cross-section index and other logging curve data are used as the input layer. The petrophysical facies division results of two mercury injection wells, CT-10 and CT-22, are used as training data. The number of weights is reduced to avoid overfitting given the limited amount of data. A neural network model with two hidden layers is used. The output layer is the petrophysical phase to be predicted (Figure 7).
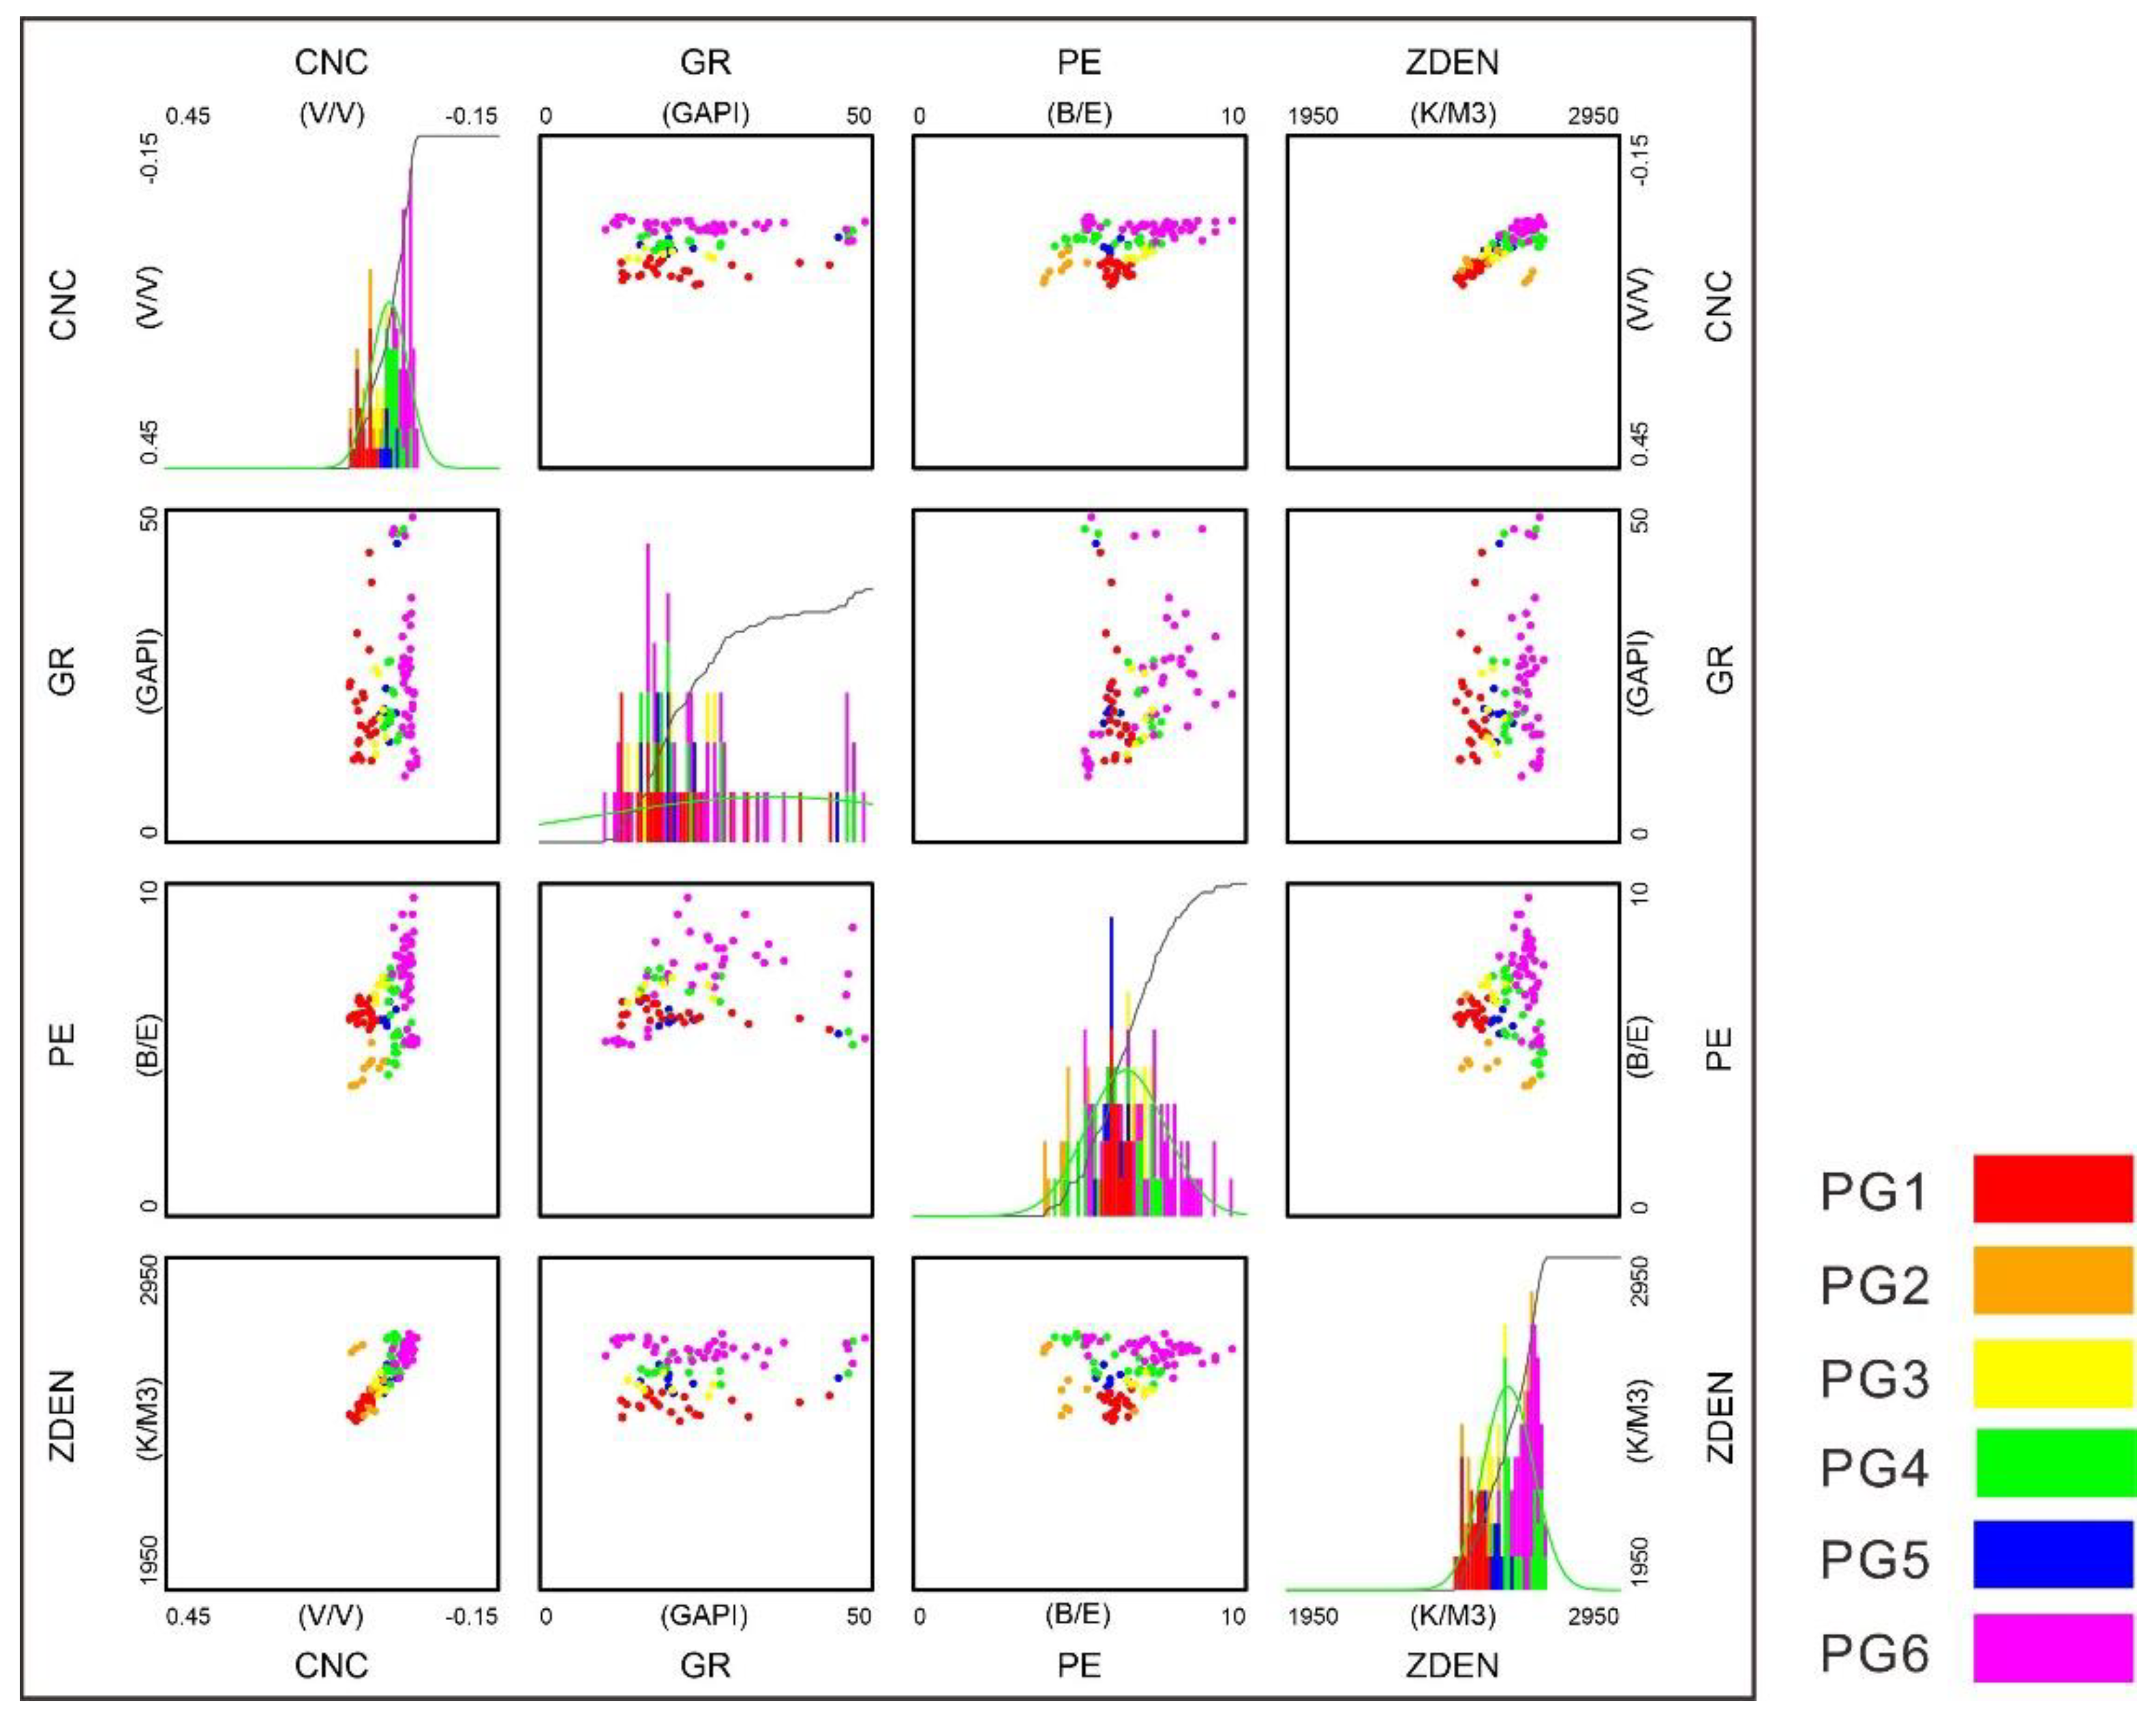
The intervals with poor borehole conditions or bad drilling fluid quality shall be excluded when selecting well logs. Meanwhile, well to well standardization shall be fulfilled to eliminate the errors caused by the environment and different logging instruments. The conventional log value distribution of different petrophysical facies is shown in Figure 8. The differences in the log response for different petrophysical facies provide a reliable basis for discrimination.
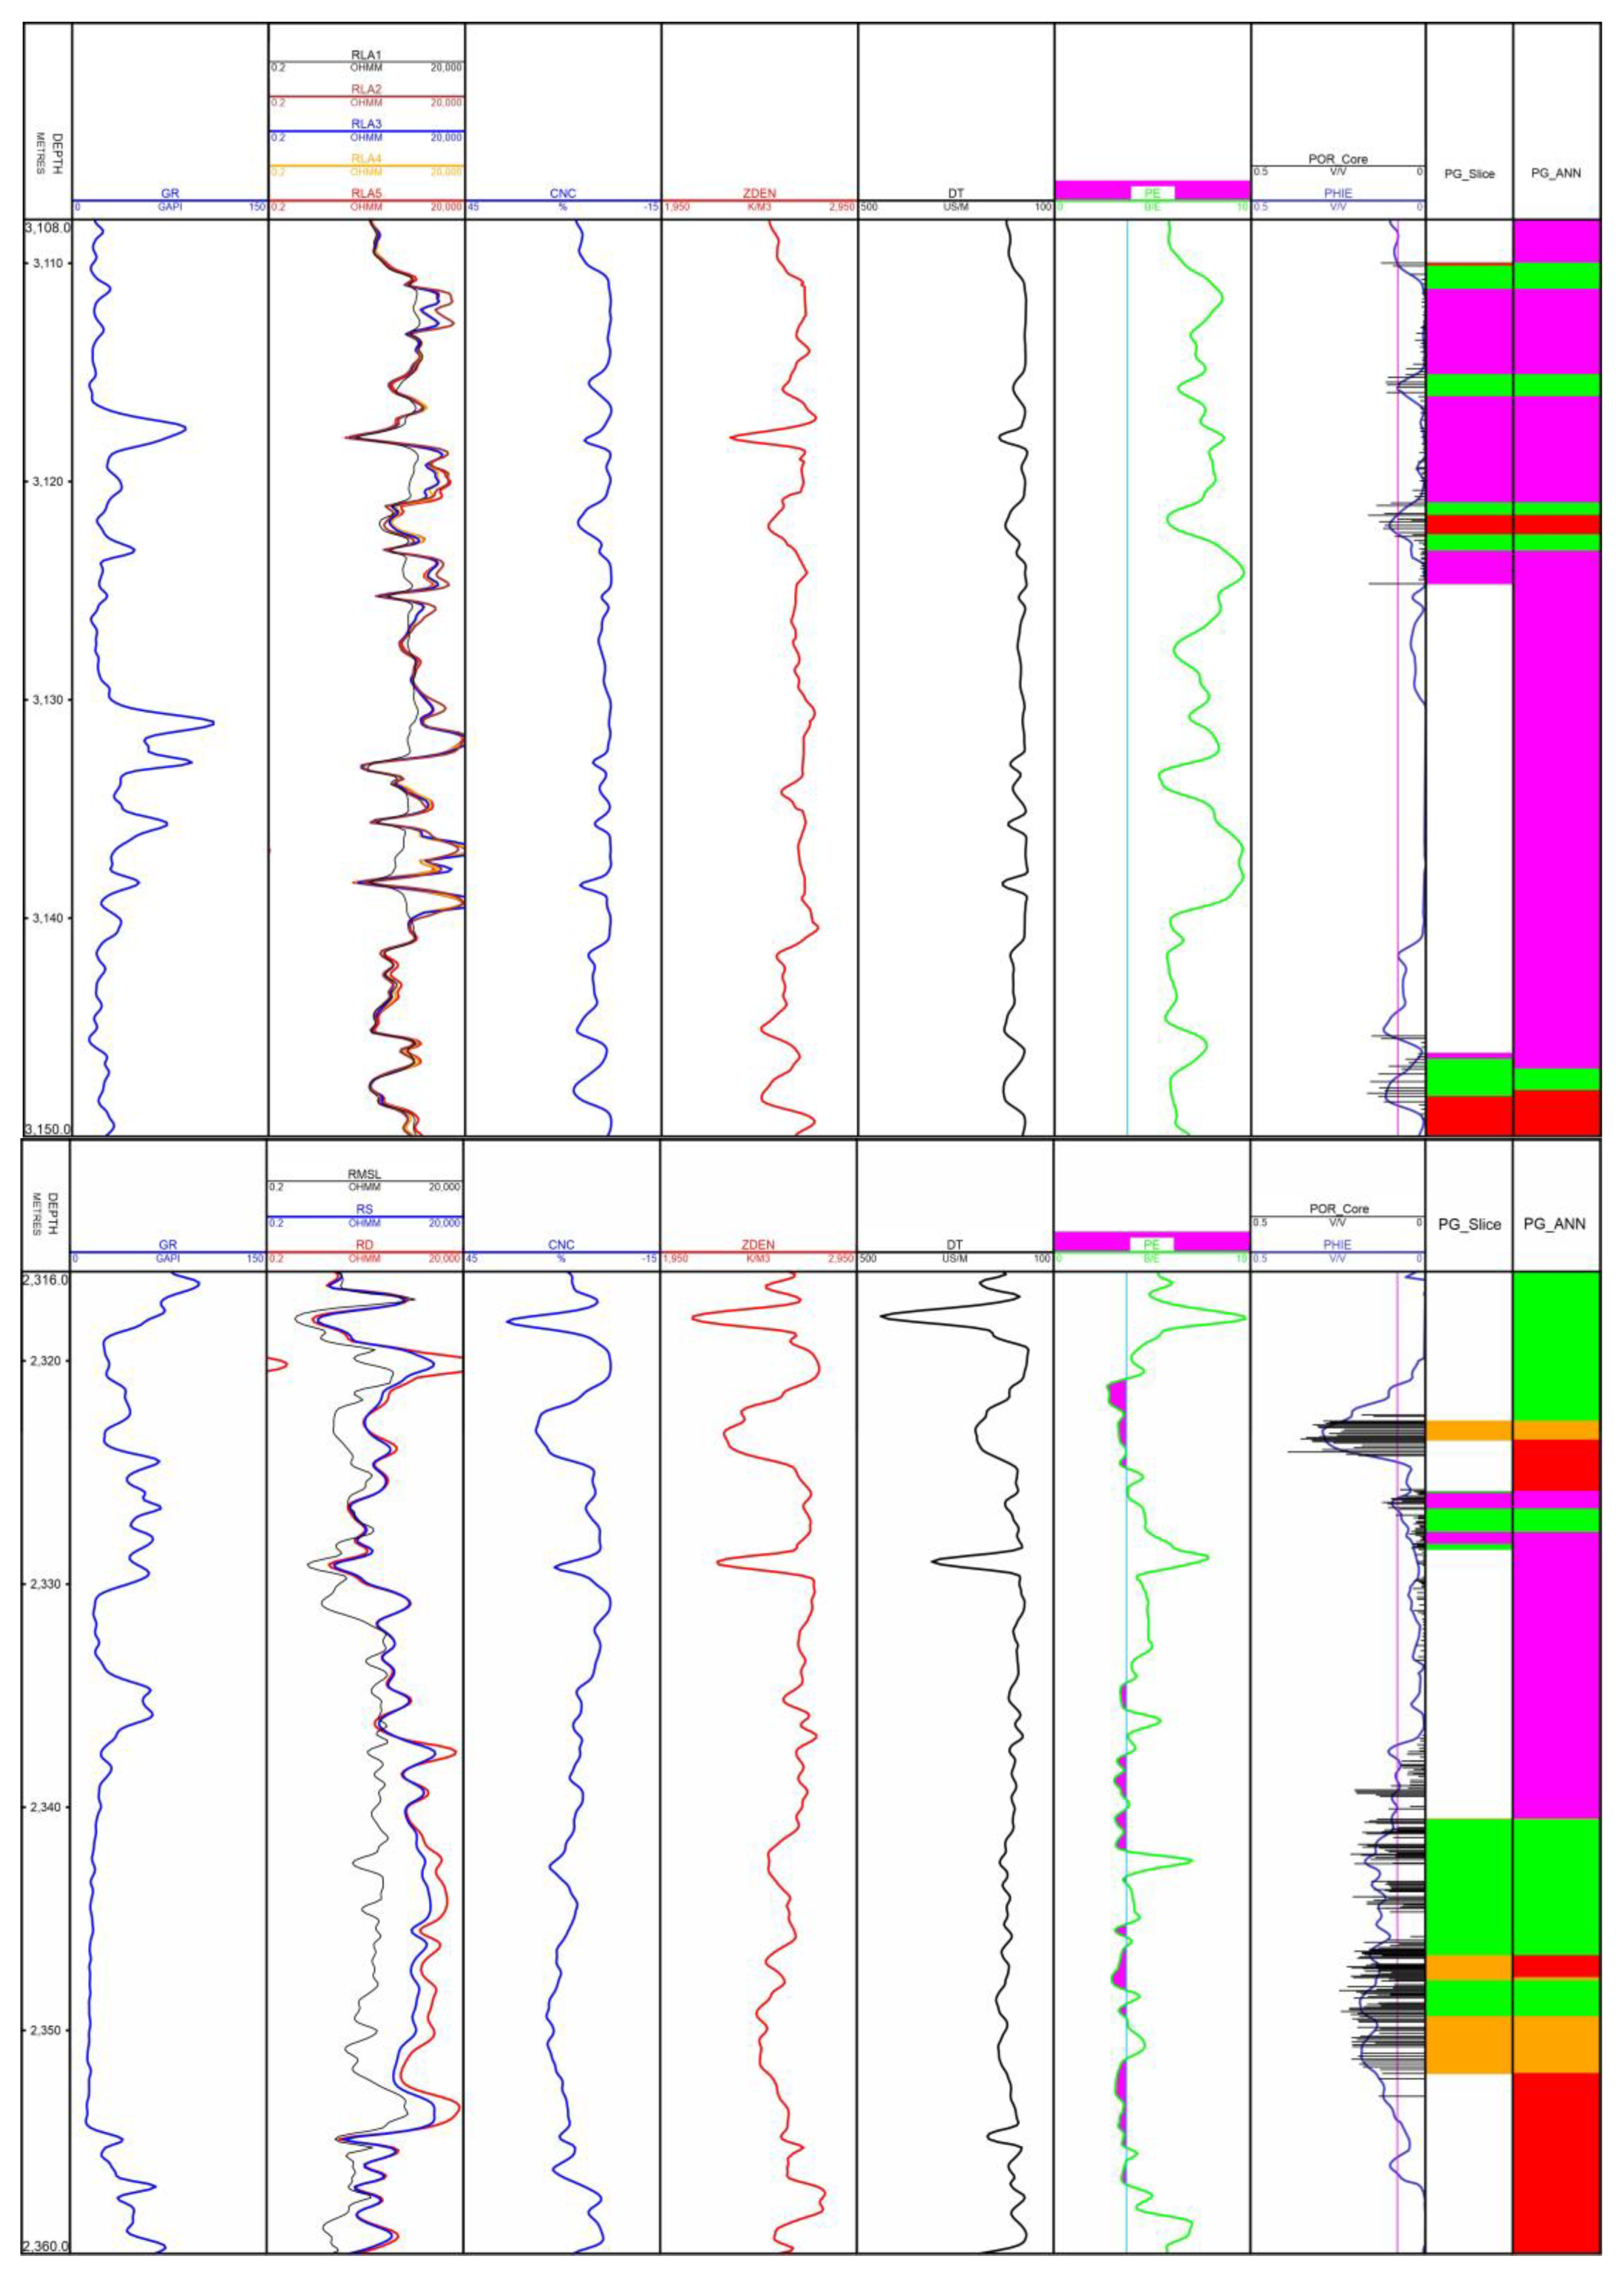
The established ANN model was used to identify 117 training data from Wells CT-10 and CT-22, among which 107 data were recognized successfully, reaching an overall coincidence rate of 91.5%. Part of the identification results were shown (Figure 9). The model of the training sample data has a high coincidence rate and can be used for petrophysical facies prediction of other wells in North Truva oilfield.
After the training model optimized by the ANN, CT-4 was used as a verification well, and its petrophysical facies were identified. As shown in Track 9 of the figure, coring was performed in the 2322–2354 m section of the KT-I layer of Well CT-4. The coring data was divided into 3 sections, with a core thickness of 26.46 m. According to the results of the petrophysical facies division, there are 3 types of petrophysical facies (PG2, PG4, and PG6) within the coring depth range (Figure 9). As shown in Figure 10, after processing and evaluation, four petrophysical facies, PG1, PG2, PG4, and PG6, were identified. The thickness of identification conformity is 23.62 m, and the identification conformity rate is 89.3%.

5. Discussion

5.1. Causes of Differences in Pore Structure

Differences in reservoir pore structure are mainly subject to reservoir development factors such as depositional environment, diagenesis, and fracture distribution. PG1 is a petrophysical facies type that best matches the three favorable reservoir development factors. The favorable sedimentary facies are grain beach subfacies and dolomitic flat microfacies. The formation of the reservoir is related to early dissolution and medium-weak cementation. According to the analysis of cores and thin sections, effective fracture types such as interlayer fractures, dissolution fractures and structural fractures are developed in this kind of petrophysics facie. PG2 represents the typical granular beach and platform tidal flat facies-controlled superposition of early atmospheric freshwater dissolution, medium-weak cementation, favorable diagenesis-controlled reservoir petrophysical facie without fractures. PG3 represents grain beach and dolomitic flats that have not undergone dissolution transformation, with obvious compaction, cementation and interlayer fractures or high-angular fractures. Such petrophysical facies are densified due to destructive diagenesis. PG4 represents grain beaches and dolomitic flats with obvious compaction and cementation that have not undergone dissolution transformation, with fractures as well, such as grain beach-compacted facies, grain beach-cemented facies, and dolomitic flat compacted facies. These petrophysical facies have poor reservoir performance. PG5 corresponds to fine-grained carbonate rocks such as bioclastic cryptite in low-energy sedimentary environments like lagoons and inter-beach seas. The bioclastic itself may have residual body cavity pores. The bioclastic intragranular dissolved pores and stucco intercrystalline pores are formed by the early atmospheric freshwater leaching and reformation. The reservoir quality is poor. PG6 represents the sedimentary subfacies with low depositional energy in lagoons and inter-beach seas, which are not conducive to the development of reservoirs. The petrophysical facies are continuously compacted and densified in the later stage without fractures, such as lagoon compaction facies and intertidal sea compaction facies. The rocks are so dense that they are generally not be regarded as a reservoir.

5.2. Main Controlling Factors of Pore Structure Differences

The North Truva Oilfield is of a carbonate gentle slope deposition model. The platform margin of the KT-II layer is low, the seawater is deep, and the evaporation is generally normal. It has a non-exposed beach environment, dominated by grainstone, with local weak dolomitization. The internal topography of the KT-I platform is high, and the sea water is shallow, with strong evaporation. It has an exposed beach environment and is dominated by sedimentary grain dolomite. Due to the differences in sedimentary environment, their sedimentary lithology and physical properties are quite different. The favorable diagenesis of the KT-I layer grain dolomite is stronger with many stages, resulting in good reservoir physical properties (Figure 10a). The favorable diagenesis of the KT-II layer of granular limestone is weaker with fewer stages and poorer reservoir physical properties (Figure 10b). The exposed beach and platform reservoirs in the KT-I layer are mainly controlled by dolomitization and early atmospheric freshwater dissolution, while the non-exposed beach reservoirs in the KT-II layer are mainly controlled by the preservation level of primary pores under the condition of weak cementation. Reservoirs with favorable pore structures are developed in the middle and upper part of the sedimentary cycle.

5.3. Prediction of Reservoir Pore Structure with Machine Learning Method

Reservoir pore structure characterization and evaluation are usually completed through core testing, which is of high cost and is limited in scope. The use of logging data is required to predict the type of reservoir pore structure. However, logging data has the characteristics of large data volume and multi-source heterogeneity. Logging processing and interpretation are also faced with difficulties such as multiple solutions and uncertainty. Therefore, it is urgent to apply machine learning and other technologies to improve the work efficiency and interpretation coincidence rate. In recent years, the application of machine learning in logging processing and interpretation mainly focuses on automatic depth correction, intelligent layering, curve reconstruction, lithology identification, imaging logging interpretation, reservoir parameter prediction, oil and gas evaluation, and shear wave velocity prediction, etc. The machine learning algorithms used include neural networks, combinatorial learning algorithms and clustering algorithms, etc. Few scholars have applied machine learning methods to the identification of the pore structure of carbonate reservoirs. After a lot of practice, this paper proposes a method based on ANN to predict the pore structure of reservoirs which uses petrophysical facies divided after the comprehensive study of core, thin section, high-pressure mercury injection and electron microscope scanning, etc.. The petrophysical facies prediction model was constructed by logging curves. After verification, it is found that the prediction accuracy rate is over 80%, with high technical practicability.

6. Conclusions

(1)
The North Truva Oilfield has diverse lithology, with complex types of pores and throats. Its lithology includes grainstone, packstone, wackestone, grain dolomite, mudstone, siliceous limestone and gypsum. The pores are mainly composed of intergranular dissolved pores, body cavity pores, intercrystalline dissolved pores, shell dissolved pores and crystal mold pores, etc. The throats mainly include pore-reduced throats, sheet throats, tubular throats and network throats. Among them, network throats are a common and special type of throat mainly affected by dissolution in this area. It is formed in the micropores between the fillings, playing a very positive role in improving the seepage capacity of the reservoir.
(2)
The petrophysical quantitative characterization facies in the reservoir are classified into 6 types: PG1, PG2, PG3, PG4, PG5, and PG6, according to the mercury injection parameters such as displacement pressure, median pressure, median throat radius, mercury removal efficiency and the shape of the capillary curve. The difference in pore structure is mainly caused by the diversification of pores and throats. They are the results of depositional environment, diagenesis and fracture development. Depositional environment and diagenesis are the main controlling factors for the difference in the reservoir pore structure. The beach environment with high-frequency exposure has a great influence on the development of favorable pore structure.
(3)
With the principle of machine learning, the petrophysical facies division structure of mercury injection wells is used as training data. The artificial neural network method (ANN) is then used to establish a petrophysical facies recognition training model. On this basis, the petrophysical facies of each well in the oilfield are predicted, realizing a fine identification of the quantitative characterization of the pore structure of different reservoirs. The application results from the whole block show that the overall identification coincidence rate of this method is up to 89.7%, which effectively improves the accuracy and efficiency of logging identification for the quantitative characterization of pore structures in the reservoir.
(4)
On the basis of lithofacies and petrophysical facies, the reservoir can be divided into multiple rock types. Using the rock type identification results of each well, the rock type model of the reservoir can be established, and the heterogeneity of the complex carbonate rock reservoir can be described in detail, which can effectively help the dynamic analysis of oil reservoirs, numerical simulation, the prediction of remaining oil and the adjustment of the development plan.

Author Contributions

Conceptualization, J.H., L.Z., X.Z. and W.Z.; methodology, J.H., L.Z., X.Z.,Y.C., H.S. and S.W.; formal analysis, J.H, L.Z., X.Z., J.W., J.L., S.W. and H.S.; investigation, J.H. and L.Z.; resources, J.H., L.Z. and X.Z.; data curation, L.Z, J.H. and X.Z.; writing—original draft preparation, J.H., S.W. and X.Z.; writing—review and editing, L.Z. and J.H.; supervision, L.Z., W.Z., Y.C., J.W. and H.S.; funding acquisition, J.H. and H.S. All authors have read and agreed to the published version of the manuscript.

Funding

This work was funded by the Foundation of Petrochina oil and gas major project: 2022DJ3210.

Data Availability Statement

Not applicable.

Acknowledgments

We would like to thank the editor and anonymous reviewers for their constructive comments. We would like to thank Xiucheng Tan from Southwest Petroleum University for his help in doing the laboratory experiments.

Conflicts of Interest

The authors declare that they have no conflict of interest.

Glossary

Wkjthe value of feature tk in sample data dj
|T|the number of dimensions of the feature vector
Pthe final prediction result
Sithe ith feature sample in k nearest samples
Withe weight value corresponding to Si

References

  1. Shen, A.J.; Zhao, W.J.; Hu, A.P.; She, M.; Chen, Y.N.; Wang, X.F. Major factors controlling the development of marine carbonate reservoirs. Pet. Explor. Dev. 2015, 42, 545–554. [Google Scholar] [CrossRef]
  2. He, L.; Zhao, L.; Li, J.X.; Ma, J.; Liu, R.L.; Wang, S.Q.; Zhao, W.Q. Complex porosity and permeability relationship and influencing factors of carbonate reservoir: A case study of plateau facies in Precaspian Basin. Pet. Explor. Dev. 2015, 42, 206–214. [Google Scholar]
  3. Chen, Y.F.; Cai, D.M.; Fan, Z.F.; Li, K.C.; Ni, J. 3D geologic modeling of dual media in presalt reservoir of Kazakstan. Pet. Explor. Dev. 2008, 35, 492–497. [Google Scholar] [CrossRef]
  4. Fan, J.S. Reservoir characteristics of carbonate oil and gas fields in the world and main control factors of hydrocarbon accumulation in them. Earth Sci. Front. 2005, 12, 23–30. [Google Scholar]
  5. Zhao, W.Z.; Shen, A.J.; Hu, S.Y.; Zhang, B.M.; Pan, W.Q.; Zhou, J.G.; Pan, Z.C. Geological conditions and distribution characteristics of Large-scale development of carbonate reservoirs in China. Pet. Explor. Dev. 2012, 39, 1–12. [Google Scholar] [CrossRef]
  6. Wilson, M.E.J.; Evans, M.J. Sedimentology and diagenesis of Tertiary carbonates on the Mangkalihat Peninsula, Borneo: Implications for subsurface reservoir quality. Mar. Pet. Geol. 2002, 19, 873–900. [Google Scholar] [CrossRef]
  7. Rong, H.; Jiao, Y.Q.; Wu, L.Q.; Gu, Y.; Zhang, L.Y.; Li, R.; Zeng, F.P. Effects of diagenesis on the acoustic velocity of the Triassic oolitic shoals in the Yudongzi outcrop of Erlangmiao area, Northwest Sichuan Basin. Mar. Pet. Geol. 2012, 23, 542–558. [Google Scholar] [CrossRef]
  8. Li, W.Q.; Mu, L.X.; Zhao, L.; Li, J.X.; Wang, S.Q.; Fan, Z.F.; Shao, D.L.; Li, C.H.; Shan, F.C.; Zhao, W.Q.; et al. Pore throat structure characteristics of Carboniferous carbonate reservoir in the eastern margin of the Precaspian Basin and its influence on porosity-permeability relationship. Pet. Explor. Dev. 2020, 47, 958–971. [Google Scholar] [CrossRef]
  9. Ole, P.W.; Giulio, C.; Sima, J.; David, C.P.P. The characteristics of open fractures in carbonate reservoirs and their impact on fluid flow: A discussion. Pet. Geosci. 2016, 22, 91–104. [Google Scholar]
  10. Esrafili-Dizaji, B.; Rahimpour-Bonab, H. Effects of depositional and diagenetic characteristics on carbonate reservoir quality: A case study from the South Pars gas field in the Persian Gulf. Pet. Geosci. 2009, 15, 325–344. [Google Scholar] [CrossRef]
  11. Saneifar, M.; Skalinski, M.; Theologou, P.; Kenter, J.; Cuffey, C.; Salazar-Tio, R. Integrated petrophysical rock classification in the Mcelroy Field, West Texas, USA. Petrophysics 2015, 56, 493–510. [Google Scholar]
  12. Chen, X.J.; Yao, G.Q.; Herrero-Bervera, E.; Cai, J.C.; Zhou, K.; Luo, C.F.; Jiang, P.; Lu, J. A new model of pore structure typing based on fractal geometry. Mar. Pet. Geol. 2018, 98, 291–305. [Google Scholar] [CrossRef]
  13. Zhang, L.; Cao, C.; Zhang, P.; Shi, L.H.; Guo, F.Z. Pore structure classification and logging response characteristics of turbidite reservoir: A case study on Chang 6 reservoir of Huangling oilfield in Ordos basin. Prog. Geophys. 2020, 35, 693–700. [Google Scholar]
  14. Yan, J.P.; Wen, D.N.; Li, Z.Z.; Geng, B.; Cai, J.G.; Liang, Q.; Yan, Y. The quantitative evaluation method of low permeable sandstone pore structure based on nuclear magnetic resonance (NMR) logging. Prog. Geophys. 2016, 59, 1543–1552. [Google Scholar]
  15. Zhang, X.W.; Mao, H.Y.; Xie, C.A.; Tan, J.J.; Lai, F.Q. Logging Evaluation Method for the Tight Sandstone Pore Structure in Biyang Depression. Spec. Oil Gas Reservoirs. 2019, 26, 27–32. [Google Scholar]
  16. Wang, H.; Kou, Z.H.; Bagdonas, D.A.; Phillips, E.H.W.; Alvarado, V.; Johnson, A.C.; Jiao, Z.S.; McLaughlin, J.F.; Quillinan, S.A. Multiscale petrophysical characterization and flow unit classification of the Minnelusa eolian sandstones. J. Hydrol. 2022, 607. [Google Scholar] [CrossRef]
  17. Kou, Z.H.; Zhang, D.X.; Chen, Z.T.; Xie, Y.X. Quantitatively determine CO2 geosequestration capacity in depleted shale reservoir: A model considering viscous flow, diffusion, and adsorption. Fuel 2022, 309. [Google Scholar] [CrossRef]
  18. Wang, H.T.; Kou, Z.H.; Guo, J.J.; Chen, Z.T. A semi-analytical model for the transient pressure behaviors of a multiple fractured well in a coal seam gas reservoir. J. Pet. Sci. Eng. 2021, 198, 108159. [Google Scholar] [CrossRef]
  19. Chen, L.; Jiang, Z.X.; Liu, K.Y.; Gao, F.L. Quantitative characterization of micropore structure for organic-rich Lower Silurian shale in the Upper Yangtze Platform, South China: Implications for shale gas adsorption capacity. Adv. Geo-Energy Res. 2017, 1, 112–123. [Google Scholar] [CrossRef]
  20. Zeng, X.; Li, W.Q.; Hou, J.; Zhao, W.Q.; Liu, Y.Y.; Kang, Y.B. Fractal Characteristics of Pore-Throats Structure and Quality Evaluation of Carbonate Reservoirs in Eastern Margin of Pre-Caspian Basin. Energies 2022, 15, 6357. [Google Scholar] [CrossRef]
  21. Zhao, W.Q.; Zhao, L.; Li, J.J.; Hou, J.; Guo, X.J. Graded Control Technology of Oil Stability and Water Control in Fracture-Pore Carbonate Reservoirs. Geofluids 2022, 2022. [Google Scholar] [CrossRef]
  22. Wang, Z.; Wang, Y.K.; Luo, M.; Kong, L.H.; Lin, Y.P. Carbonate Depositional Facies Analysis and Reservoir Prediction for Central Block in Pre-Caspian Basin. Adv. Mater. Res. 2013, 2482, 734–737. [Google Scholar] [CrossRef]
  23. Hou, J.; Lin, Y.P.; Zhao, W.Q.; Luo, M.; Li, J.X.; Wang, S.Q. Logging evaluation of Carboniferous Carbonate Reservoir in North Truva Oilfield, Kazakhstan. Mar. Orig. Pet. Geol. 2022, 27, 103–112. [Google Scholar]
  24. Hou, J.; Liu, B.B.; Wang, S.Q.; Zhao, W.Q.; Li, J.X.; LIN, Y.P. Characteristics of Carboniferous Marine Carbonate Reservoirs in Eastern Margin of Precaspian Basin. Fresenius Environ. Bull. 2022, 31, 911–921. [Google Scholar]
  25. Dunham, R.J. Classification of carbonate rocks according to depositional texture. In Classification of Carbonate Rocks: A Symposium; Ham, W.E., Ed.; American Association of Petroleum Geologists Memoir: Tulsa, OK, USA, 1962; Volume 1, pp. 108–121. [Google Scholar]
  26. Kuang, L.C.; Liu, H.; Ren, Y.L.; Luo, K.; Shi, M.Y.; Su, J.; Li, X. Application and development trend of artificial intelligence in petroleum exploration and development. Pet. Explor. Dev. 2021, 48, 1–11. [Google Scholar] [CrossRef]
  27. Tang, H.; Meddaugh, W.S.; Toomey, N. Using an artificial-neural-network method to predict carbonate well log facies Successfully. SPE Reservoir Eval. Eng. 2011, 14, 35–44. [Google Scholar] [CrossRef]
  28. Nouri-Taleghani, M.; Kadkhodaie-llkhchi, A.; Karimi-Khaledi, M. Determining hydraulic flow units using a hybrid neural network and multi-resolution graph-based clustering method: Case study from South Pars Gas Field, Iran. J. Pet. Geol. 2015, 38, 177–191. [Google Scholar] [CrossRef]
  29. Zhang, D.X.; Chen, Y.T.; Meng, J. Synthetic well logs generation via Recurrent Neural Networks. Pet. Explor. Dev. 2018, 45, 598–607. [Google Scholar] [CrossRef]
  30. Alpana, B.; Hans, B.H. Determination of facies from well logs using modular neural networks. Pet. Geosci. 2018, 8, 217–228. [Google Scholar]
  31. Wu, H.L.; Wang, C.; Feng, Z.; Yuan, Y.; Wang, H.F.; Xu, B.S. Adaptive multi-resolution graph-based clustering algorithm for electrofacies analysis. Appl. Geophys. 2020, 17, 13–25+167. [Google Scholar] [CrossRef]
  32. Tian, Y.; Xu, H.; Zhang, X.Y.; Wang, H.J.; Guo, T.C.; Zhang, L.J.; Gong, X.L. Multi-resolution graph-based clustering analysis for lithofacies identifi cation from well log data: Case study of intraplatform bank gas fi elds, Amu Darya Basin. Appl. Geophys. 2016, 13, 598–607+736. [Google Scholar] [CrossRef]
  33. Zheng, J.Z.; Zhou, H.Y.; Huang, X.X. Analysis on the basic characteristics of petroleum geology and exploration potential in Kazakhstan. China Pet. Explor. 2009, 80, 80–86. [Google Scholar]
  34. Liang, S.; Wu, Y.D.; Wang, Y.K.; Wang, Z.; Sheng, S.B. Hydrocarbon accumulation characteristics and main control factors of presalt reservoirs in the eastern margin of the Precaspian Basin. China Pet. Explor. 2020, 4, 80–86. [Google Scholar]
  35. Zhao, L.; Chen, Y.F.; Ning, Z.F.; Fan, Z.F.; Wu, X.L. Experimental evaluation on stress sensitivity of abnormal high pressure carbonate reservoir: A case study of Kenkyak fracture-pore type low permeability carbonate reservoir in the Precaspian Basin. Pet. Explor. Dev. 2013, 40, 194–200. [Google Scholar] [CrossRef]
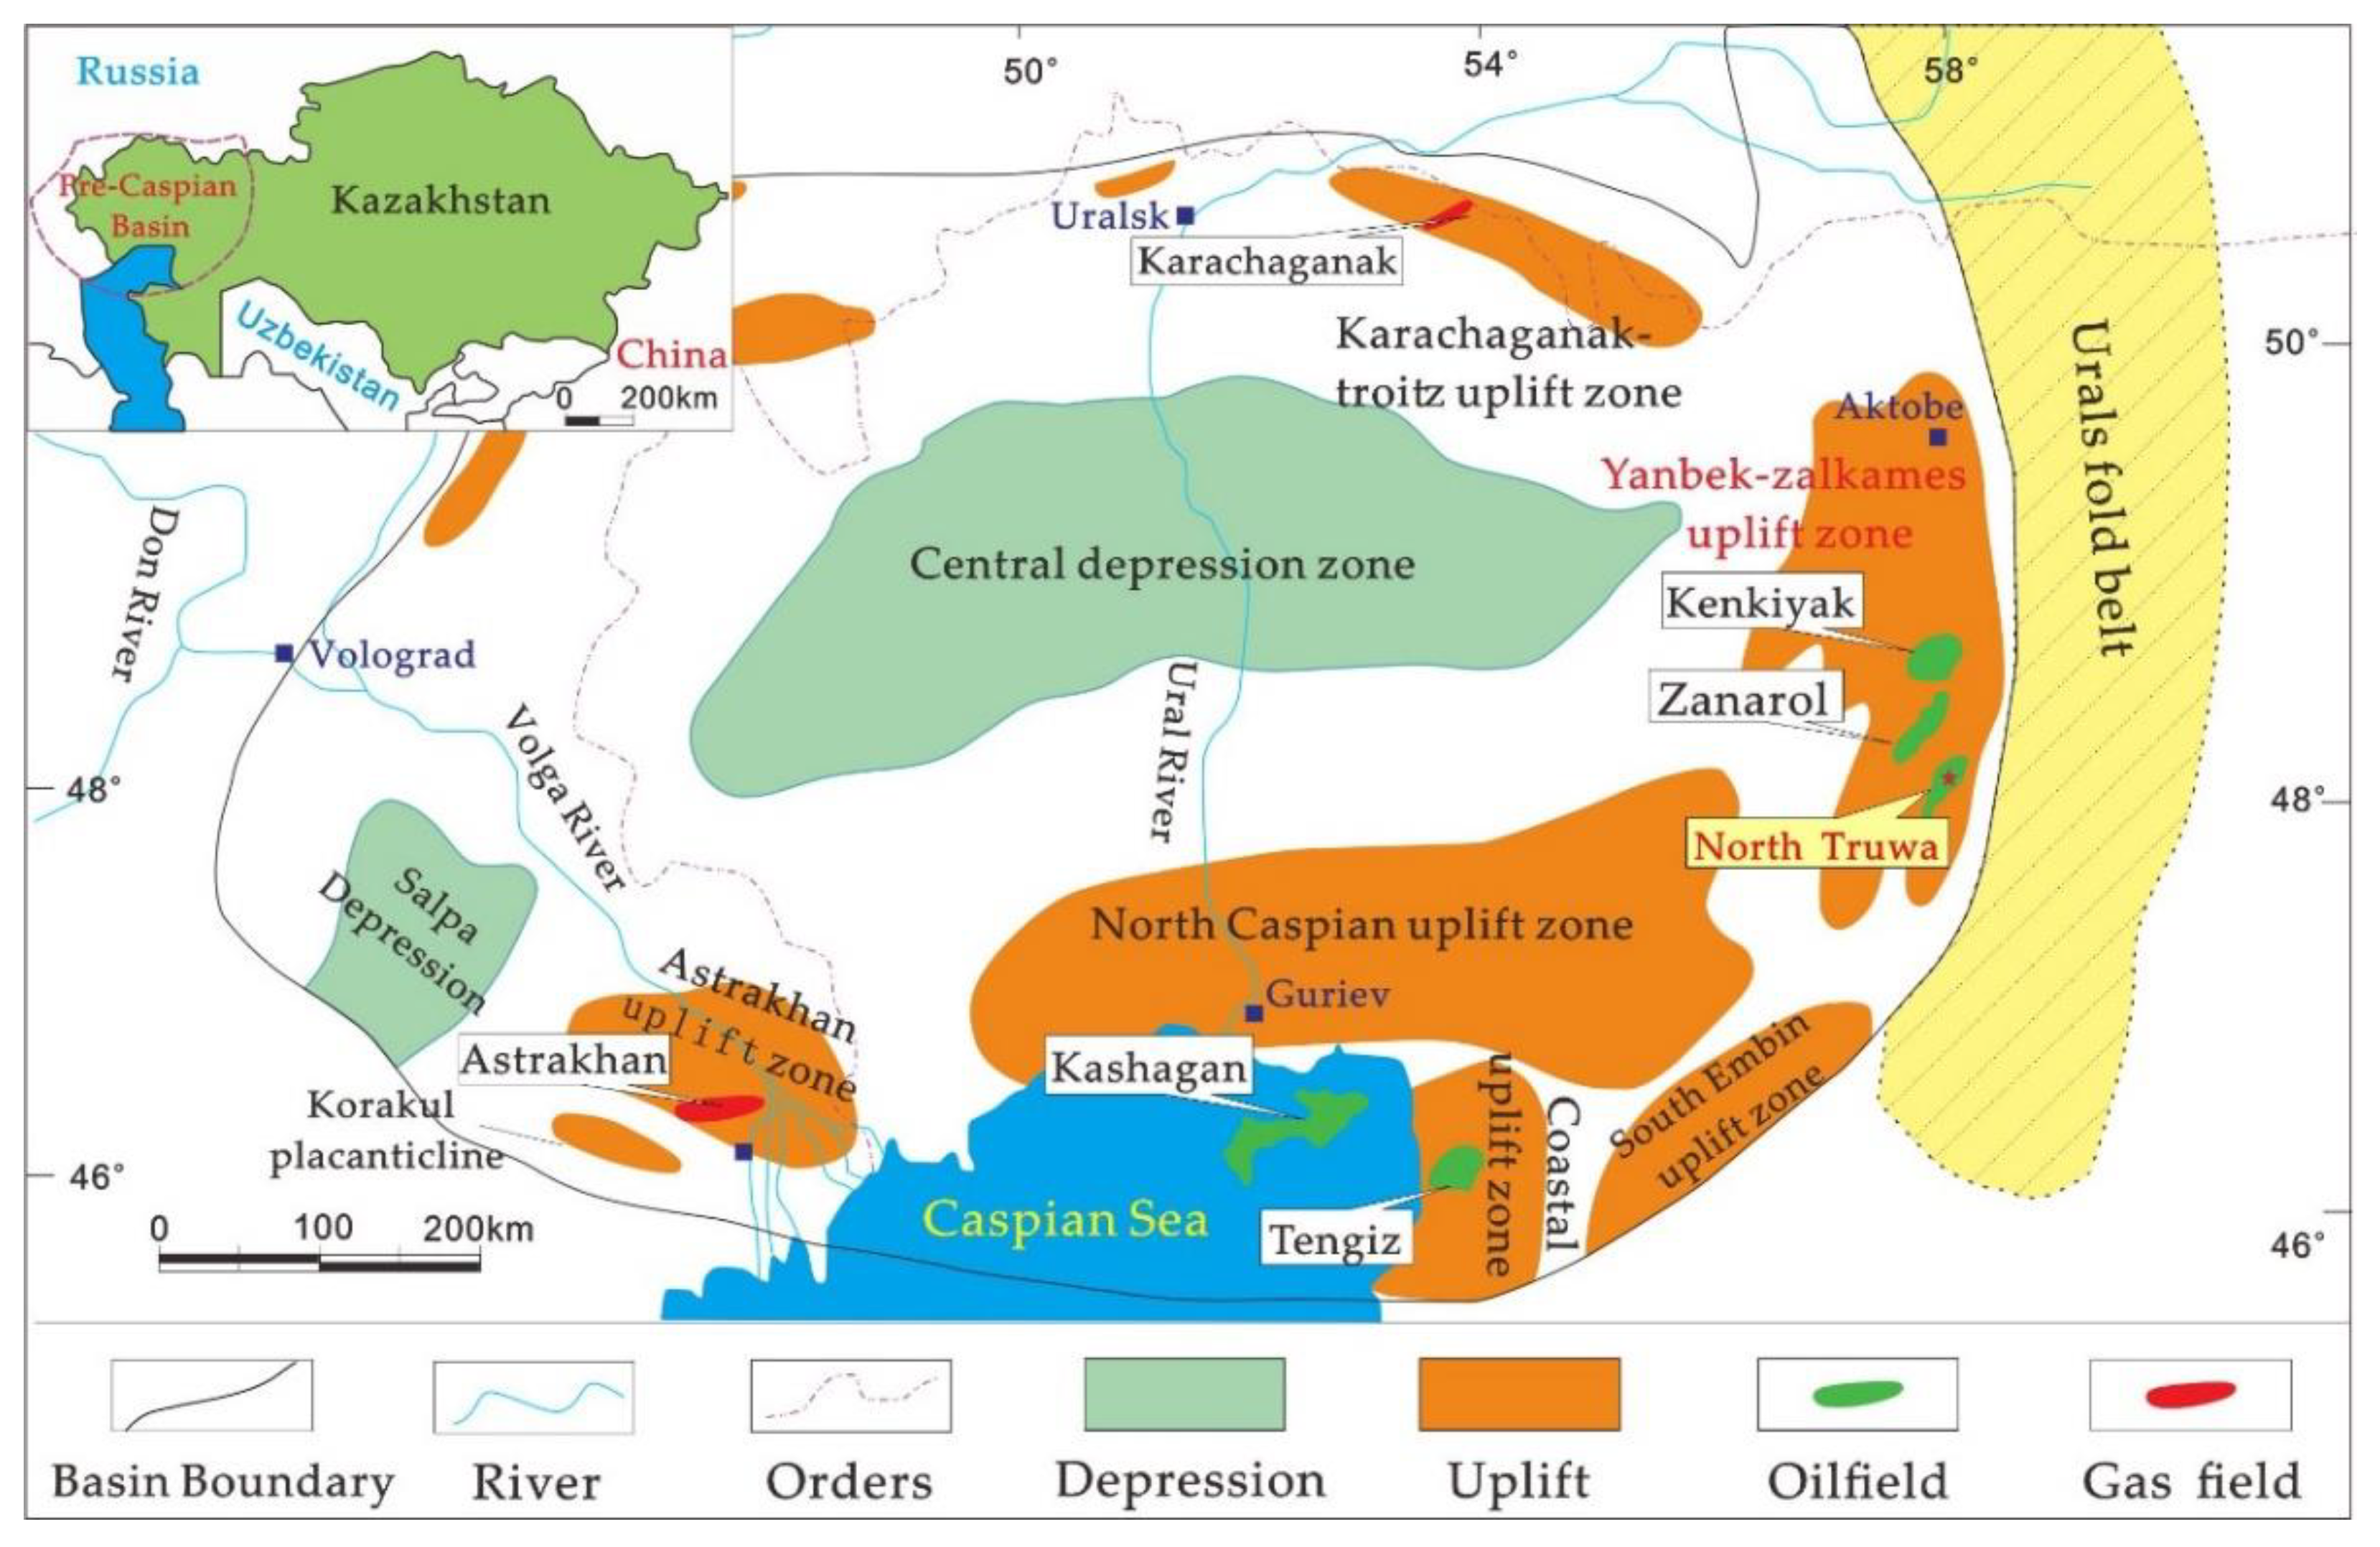
Figure 1. A map for the division of structural units in the Pre-Caspian Basin and the location of the North Truva oilfield.
Energies 15 07126 g001
Figure 2. Structural map of the North Truva Oilfield.
Energies 15 07126 g002
Figure 3. Comprehensive stratigraphic bar chart of the North Truva Oilfield. The main oil producing layers of the North Truwa Oilfield are located in the Middle and Upper Carboniferous, which can be divided into the KT-I oil layer and KT-II oil layer. The average thickness of the KT-I oil layer and the KT-II oil layer is 150 m and 230 m, respectively.
Energies 15 07126 g003
Figure 4. Reservoir core photo of North Truva oilfield (a) Grainstone. Well CT-52, 1477.92 m, with oil stains on the surface, clean rock particles by elutriation, strong hydrodynamic force, a small total amount but many types of pores, and one fracture; (b) Packstone. Well CT-52, 1379.22 m, the marl is mostly oil immersed and a little dolomitized, with few pore types and high content, and a high-angle fracture is discovered; (c) Wackestone. Well CT-22, 2336.18 m, the bioclastics are not evenly distributed, no pores are found, and a structural fracture is seen extending far, with a fracture width >5 mm, and it is not filled; (d) Siliceous limestone. Well CT-4, 3135.73 m, with strong chalcedony and mild dolomitization, no dissolved pores, very few pores, and six mesh fractures; (e) Granular dolomite. Well CT-4, 3135.73 m, with well-developed dissolved pores and large pore size, many dissolved trenches and dissolved fractures, and good connectivity. There are semi-filled gypsum and silt in the karst cave; (f) Mudstone. Well CT-4, 3134.21 m, gray-black mudstone, with irregular laminar structure, weak consolidation, local loss of plasticity, and no pores or fractures.
Energies 15 07126 g004
Figure 5. Thin section photos of different pore types in North Truva Oilfield (a) Well 5598, 3154.41 m, grainstone, with coral cavity pores; (b) Well 5555, 3177.03 m, grainstone, with mainly intergranular pores; (c) Well CT-4, 2344.77 m, graindolomite with intercrystalline pores; (d) Well A-7, 2669.76 m, crystalline dolomite, with intercrystalline pores and intercrystalline dissolved pores, residual grain shape (yellow arrow) after the dolomite grains are dissolved, and the asphalt half fills the pores; (e) CT-22 well, 2354.62 m, packstone, with more intragranular dissolved pores and poor connectivity; (f) Well CT-41, 2416.12 m, graindolomite, salt mold hole and grain mold hole are seen.
Energies 15 07126 g005
Figure 6. Types and characteristics of different throats in North Truva Oilfield (a) Well 5555, 2335.24 m, with residual foraminiferal micrite dolomite, developed with body cavity pores, intercrystalline (dissolved) pores and intercrystalline micropores, among which the body cavity pores are connected by a pore-reduced throat (T1); (b) Well A-5, 2758.2 m, sparite bioclastic limestone with algae mass, mainly intergranular pores and intercrystalline pores, developed with tubular throats (T3) and pore-reduced throats (T1); (c) Well CT-4, 2325.37 m, bioclastic micrite dolomite with intercrystalline pores and lamellar throats (T2); and (d) Well 5555, 2331.66 m, residual foraminiferal powder crystal dolomite, intercrystalline dissolved pores, mold pores and various dissolved pores are very developed but unevenly distributed, strongly dissolved and is in the shape of carbon-slag in some parts, with primarily network throats (T4) and sheet throats (T2), with good connectivity.
Energies 15 07126 g006
Figure 7. A schematic diagram of the ANN structure.
Energies 15 07126 g007
Figure 8. Log response for different petrophysical facies.
Energies 15 07126 g008
Figure 9. Results of petrophysical facies identification of Well CT-10 and CT-4 in North Truva Oilfield.
Energies 15 07126 g009
Figure 10. Environmental model diagram of exposed and non-exposed beaches. The exposed and unexposed beaches (a,b) represent the sedimentary environment of KT-I and KT-II layers respectively, which explains the origin of different petrophysical facies.
Energies 15 07126 g010
Table 1. Classification results of different petrophysical facies. The classification of petrophysical facies is based on the size of pore throat radius, namely pore size, which reflects the percolation ability of the reservoir. PG1 and PG6 represent the best and worst petrophysical facies, respectively.
Petrophysical FaciesPore-throat RadiusCapillary PressureSymbol
PG1 Energies 15 07126 i001 Energies 15 07126 i002 Energies 15 07126 i003
PG2 Energies 15 07126 i004 Energies 15 07126 i005 Energies 15 07126 i006
PG3 Energies 15 07126 i007 Energies 15 07126 i008 Energies 15 07126 i009
PG4 Energies 15 07126 i010 Energies 15 07126 i011 Energies 15 07126 i012
PG5 Energies 15 07126 i013 Energies 15 07126 i014 Energies 15 07126 i015
PG6 Energies 15 07126 i016 Energies 15 07126 i017 Energies 15 07126 i018
Table 2. Petrophysical facies classification results of CT-10 and CT-22 wells (part of data).
WellDepth (m)Displacement Pressure (MPa)Median Pressure (MPa)Median Throat Radius (μm)Mercury Removal Efficiency (%)Petrophysical Facies
CT-102344.880.6216.340.0411.34PG6
CT-102345.410.6714.40.054.18PG5
CT-102345.760.6214.910.0514.37PG5
CT-102346.110.192.30.3219.44PG3
CT-102346.490.182.250.335.13PG3
CT-102346.970.12.070.3541.46PG4
CT-222356.030.00351.440.5424.11PG1
CT-222356.150.00341.920.4524.58PG1
CT-222370.100.00342.010.4357.71PG2
Publisher’s Note: MDPI stays neutral with regard to jurisdictional claims in published maps and institutional affiliations.