Review

Update on the Life-Cycle GHG Emissions of Passenger Vehicles: Literature Review and Harmonization

School of Engineering, Computing and Mathematics, Oxford Brookes University, Wheatley Campus, Oxford OX33 1HX, UK
Energies 2022, 15(19), 7163; https://doi.org/10.3390/en15197163
Submission received: 14 July 2022 / Revised: 9 September 2022 / Accepted: 28 September 2022 / Published: 29 September 2022

Abstract

:
Passenger vehicles are responsible for significant greenhouse gas (GHG) emissions, which calls for accurate and up-to-date estimates of the comparative emissions of the main types of alternative power trains, to enable evidence-based policy recommendations. This paper provides a systematic review and harmonization of the recent scientific literature on this topic. The results show that battery electric vehicles (BEVs) represent the most promising option to decarbonize the passenger vehicle fleet in all considered world regions, with up to −70% reductions in GHG emissions possible, vs. conventional internal combustion engine vehicles (ICEVs) running on petrol. Hybrid electric vehicles (HEVs and PHEVs) are less effective strategies, but they may be useful in bridging the gap between ICEVs and BEVs, especially in those markets that are harder to electrify quickly. Finally, fuel cell vehicles (FCEVs) may also be a viable option, but only if the hydrogen fuel is produced via water electrolysis using renewable energy.

1. Introduction

Anthropogenic greenhouse gas (GHG) emissions have been unquestionably identified as the main driver of impending, and potentially catastrophic, climate change [1]. Globally, the transport sector (and, within it, road transport and specifically passenger cars) are very significant contributors to the total GHG emission budget, and in response to this, the market is rapidly diversifying, with a range of alternative power train options now complementing, and potentially soon displacing, the conventional internal combustion engine [2]. To this latter end, legislators in Europe and the UK have already set targets to effectively ban the sale of internal combustion engine vehicles (ICEVs) by the middle of the next decade [3,4], with similar discussions under way in other parts of the world, too. However, while enabling the shift from fossil fuels to less carbon-intensive energy carriers for their use phase, in most cases the alternative vehicle types that are intended to replace ICEVs tend to entail higher GHG emissions during their manufacturing, primarily because of their greater demand for metals and other critical raw materials.
Within the context of this rapidly changing landscape, it thus becomes especially important to clarify to the maximum extent possible how the various available power train options actually compare in terms of their overall life-cycle GHG emissions. Accordingly, the aim of this paper is two-fold. Firstly, to review the most recent peer-reviewed literature on the life cycle assessment (LCA) of passenger vehicles, focusing specifically on the five options that have emerged as the most significant contenders, namely: ICEVs (both petrol and diesel variants), hybrid electric vehicles (HEVs), plug-in hybrid electric vehicles (PHEVs), battery electric vehicles (BEVs), and fuel cell electric vehicles (FCEVs). Secondly, to provide a harmonized overview of the results contained in the reviewed literature, so as to allow a consistent comparison of the life-cycle GHG emissions of all the considered alternative vehicle types, and thus enable evidence-based policy recommendations.

2. Materials and Methods

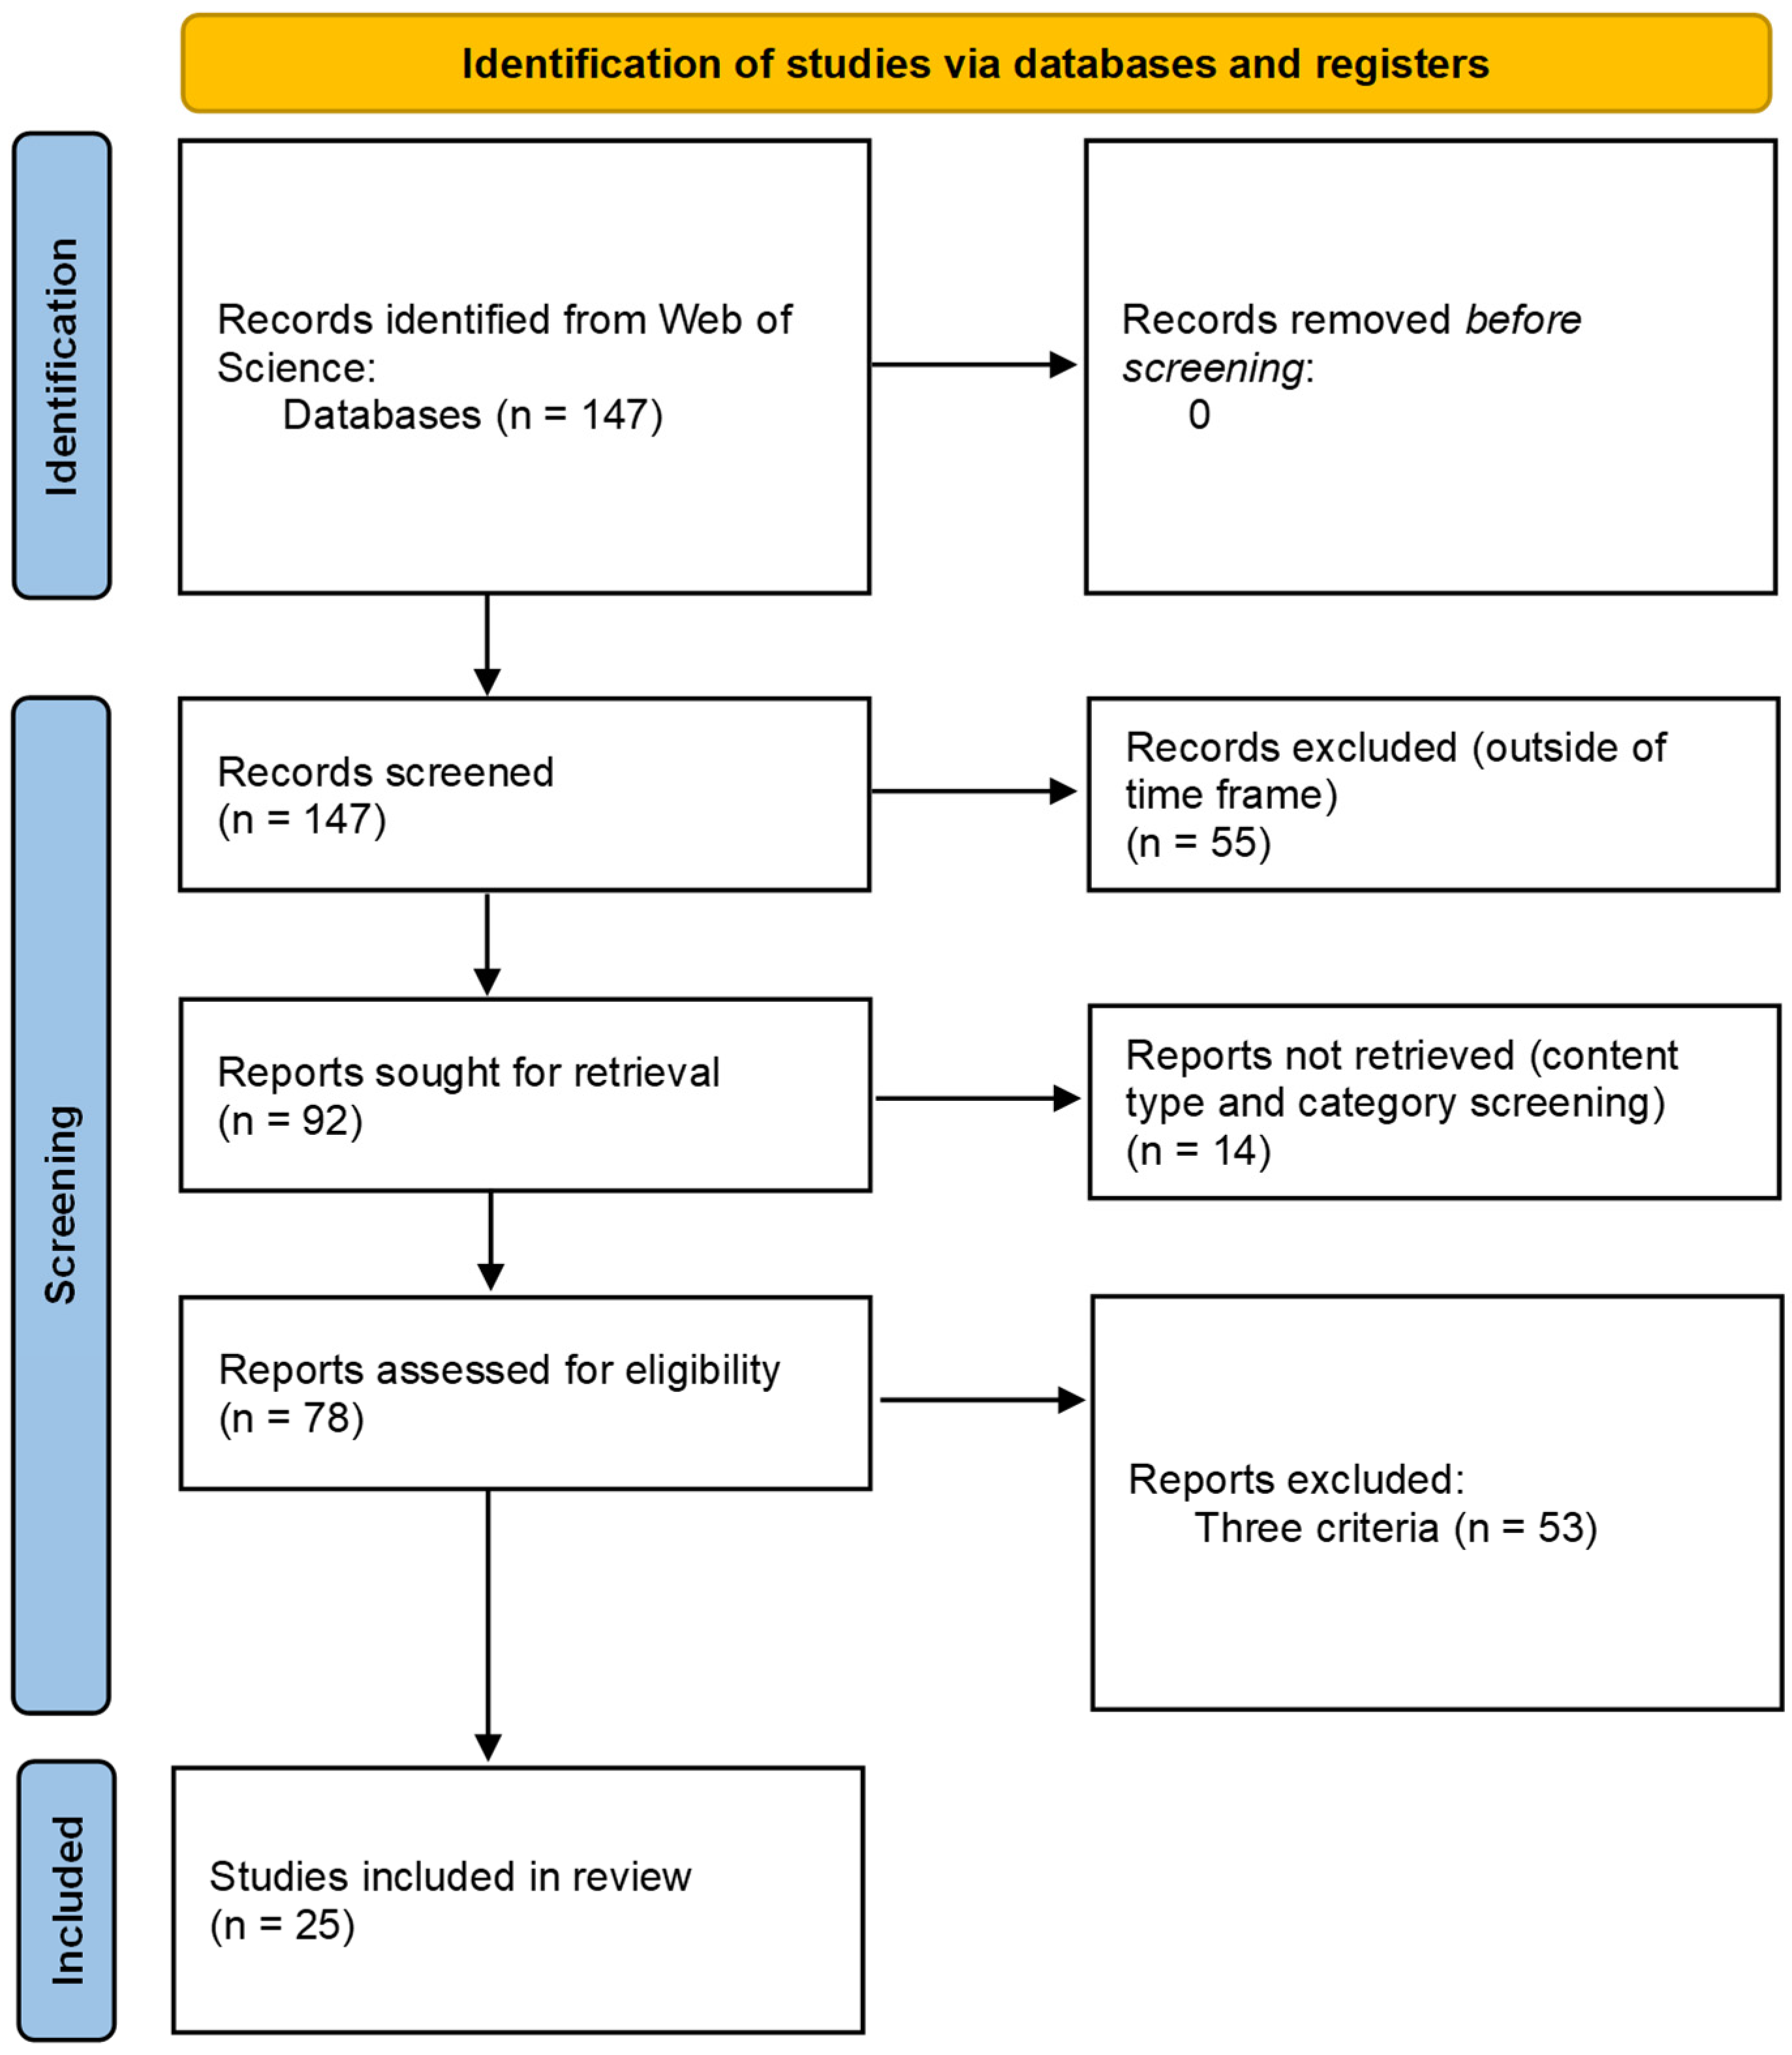
2.1. Collection and Screening of the Literature

The systematic review process was structured following the Preferred Reporting Items for Systematic reviews and Meta-Analyses (PRISMA) methodology [5], which allows for the transparent and unbiased collection of studies related to a set of research questions (Figure 1).
The Web of Science (WoS) was selected as the most prominent and comprehensive scientific literature repository for the search, comprising articles from all the leading publishers (including but not limited to: Elsevier, Springer, and MDPI). The following keywords and Boolean operators were used for searching in the “TOPIC” field (as defined by WoS, which includes Title, Abstract, Keywords, and Keywords Plus): “LCA AND (EV OR BEV OR HEV OR PHEV OR FCEV OR ICEV)”. This initial literature identification stage returned 147 papers.
The first screening stage was then aimed at restricting the time interval to the last five years (i.e., 2018–2022), with the intention of excluding obsolete results that would no longer be relevant, especially for the still rapidly improving non-ICEVs.
The second screening stage removed all papers that were not classified as either Original Research or Review Articles.
The third screening stage selected those remaining papers that pertained to those categories (as defined by WoS) that were deemed relevant for the purposes of this review, while discarding those few papers that clearly fell outside of the intended scope, such as, e.g., those pertaining to categories such as virology, psychology, pharmacology, etc. Figure 2 reports a detailed count of all the papers, respectively, retained and discarded at this stage, by category.
Finally, the fourth screening stage was a manual one, and entailed reading all the hitherto selected papers, and only retaining those that met all of the following three criteria, which were necessary in order to enable the successive rigorous comparison of the results via harmonization:
  • the study must include the entire “cradle-to-grave” life cycle of the vehicle (i.e., not only the “well-to-wheel” analysis of the fuel or energy carrier, or only the life cycle of the vehicle’s power train, etc.);
  • the study must be transparent about: (i) the adopted functional unit (FU), which may be defined as either the whole vehicle, or a suitable unit of transport such as vehicle·km or passenger·km, and (ii) the assumed total vehicle mileage and average vehicle occupancy (if the chosen FU is passenger·km);
  • the study must report GHG emissions as a mid-point life cycle impact assessment (LCIA) indicator, in units of CO2-eq (i.e., including not just CO2, but all GHG emissions, weighted by suitable characterization factors).
The paper counts at each intermediate stage of the literature identification and screening processes are reported in Figure 3; in the end, 25 papers were retained [6,7,8,9,10,11,12,13,14,15,16,17,18,19,20,21,22,23,24,25,26,27,28,29] and became the object of the harmonization described in the following section.

2.2. Harmonization of the GHG Emission Results

In order to enable a consistent “apples-to-apples” comparison of the GHG emission results contained in the reviewed literature, a thorough harmonization of the latter was in order, based on three criteria:
  • All results need to be expressed in terms of the same FU; the choice was made to standardize on (vehicle·km) as the FU that arguably strikes the best balance between significance (it refers to a better identifiable unit of service than just “vehicle”) and accuracy (it avoids additional assumptions on average vehicle occupancy, which may vary significantly across time and different geographies).
  • A common assumption must be made on total vehicle milage; the choice was made to set this parameter to 225,000 km (a value recently reported to be statistically representative for Europe [30]).
  • The same system boundary must be set, to ensure consistency in terms of which processes that form part of the life cycle of the vehicle are included, and which are instead excluded from the analysis. Specifically, reviewing the literature led to the realization that the various studies were very inconsistent in the adopted methodology in terms of the end-of-life (EoL) boundaries and the calculation of the associated emission credits (some studies adopted the “cut-off” approach, others the “avoided burden” one, and others still were not sufficiently transparent about this key methodological choice). As a consequence, the decision was made to exclude the EoL stage emissions from the harmonization and subsequent comparison. Figure 4 provides a graphical illustration of the life-cycle boundaries that apply to the harmonized GHG emissions as harmonized and discussed hereinafter.
Ideally, it would have been preferable to also harmonize the literature studies to take into account local climate characteristics, since BEV battery performance may be negatively impacted by low temperatures, which could lead to higher GHG emissions. However, doing so would have necessitated gaining full access to the underlying LCA models used by the original authors, which was not possible.
From a numerical standpoint, the harmonization of the published GHG emission results was carried out using Equations (1) and (2) as described below.
Harmonization of GHG results for vehicle production stage:
  { I F   ( F U = v e h i c l e )   T H E N   G W P P , H = G W P P V K T H I F   ( F U = v e h i c l e · k m )   T H E N   G W P P , H = G W P P · V K T V K T H I F   ( F U = p a s s e n g e r · k m )   T H E N   G W P P , H = G W P P · V O · V K T V K T H
where:
  • GWPP,H = Harmonized Global Warming Potential of vehicle production stage;
  • GWPP = Global Warming Potential of vehicle production stage, as originally published;
  • VKTH = harmonized vehicle km travelled (i.e., lifetime mileage);
  • VKT = vehicle km travelled (i.e., lifetime mileage), as assumed in original study;
  • VO = vehicle occupancy, as assumed in original study.
Harmonization of GHG results for vehicle use stage:
{ I F   ( F U = v e h i c l e )   T H E N   G W P U , H = G W P U V K T I F   ( F U = v e h i c l e · k m )   T H E N   G W P U , H = G W P U I F   ( F U = p a s s e n g e r · k m )   T H E N   G W P U , H = G W P U · V O
where:
  • GWPU,H = Harmonized Global Warming Potential of vehicle use stage;
  • GWPU = Global Warming Potential of vehicle use stage, as originally published;
  • VKT = vehicle km travelled (i.e., lifetime mileage), as assumed in original study;
  • VO = vehicle occupancy, as assumed in original study.
The total harmonized life-cycle GHG emissions (GWPLC,H, excluding EoL stage) were then simply calculated as the sum of the two previous terms:
GWPLC,H = GWPP,H + GWPU,H
Finally, it is worth noting that, while a very small number of these resulting 25 studies also calculated results for ICEVs running on compressed natural gas (CNG), liquefied petroleum gas (LPG), and a range of alternative low-carbon fuels such as biofuel blends, hydrogen or other e-fuels (i.e., fuels synthetically produced via low-carbon electricity), the vast majority of the studies only considered petrol and diesel ICEV options. Additionally, the literature is in broad agreement that using synthetic e-fuels in ICEVs would be a comparatively inefficient strategy, vs. using low-carbon electricity directly to power BEVs. The data points for ICEVs running on alternative fuels were therefore excluded from the harmonization process.

3. Results

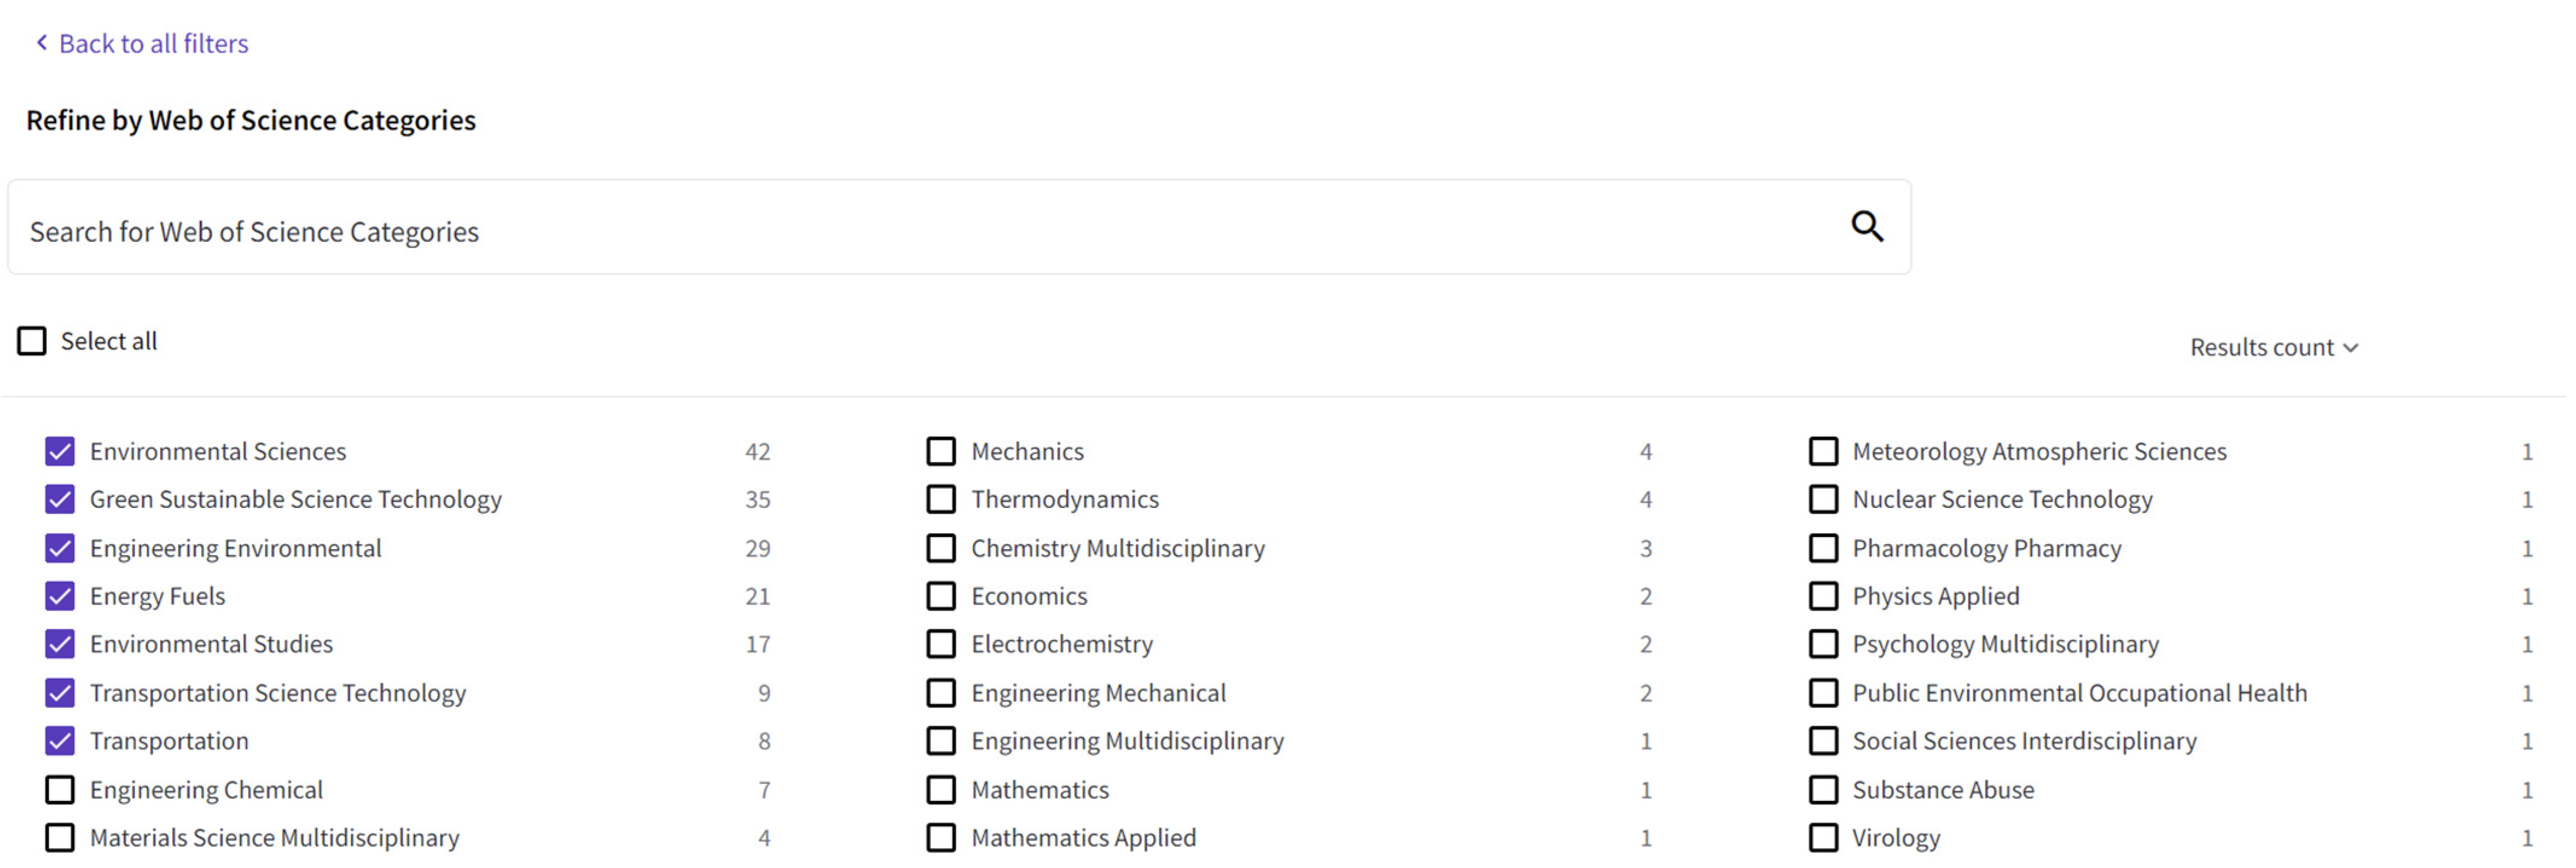
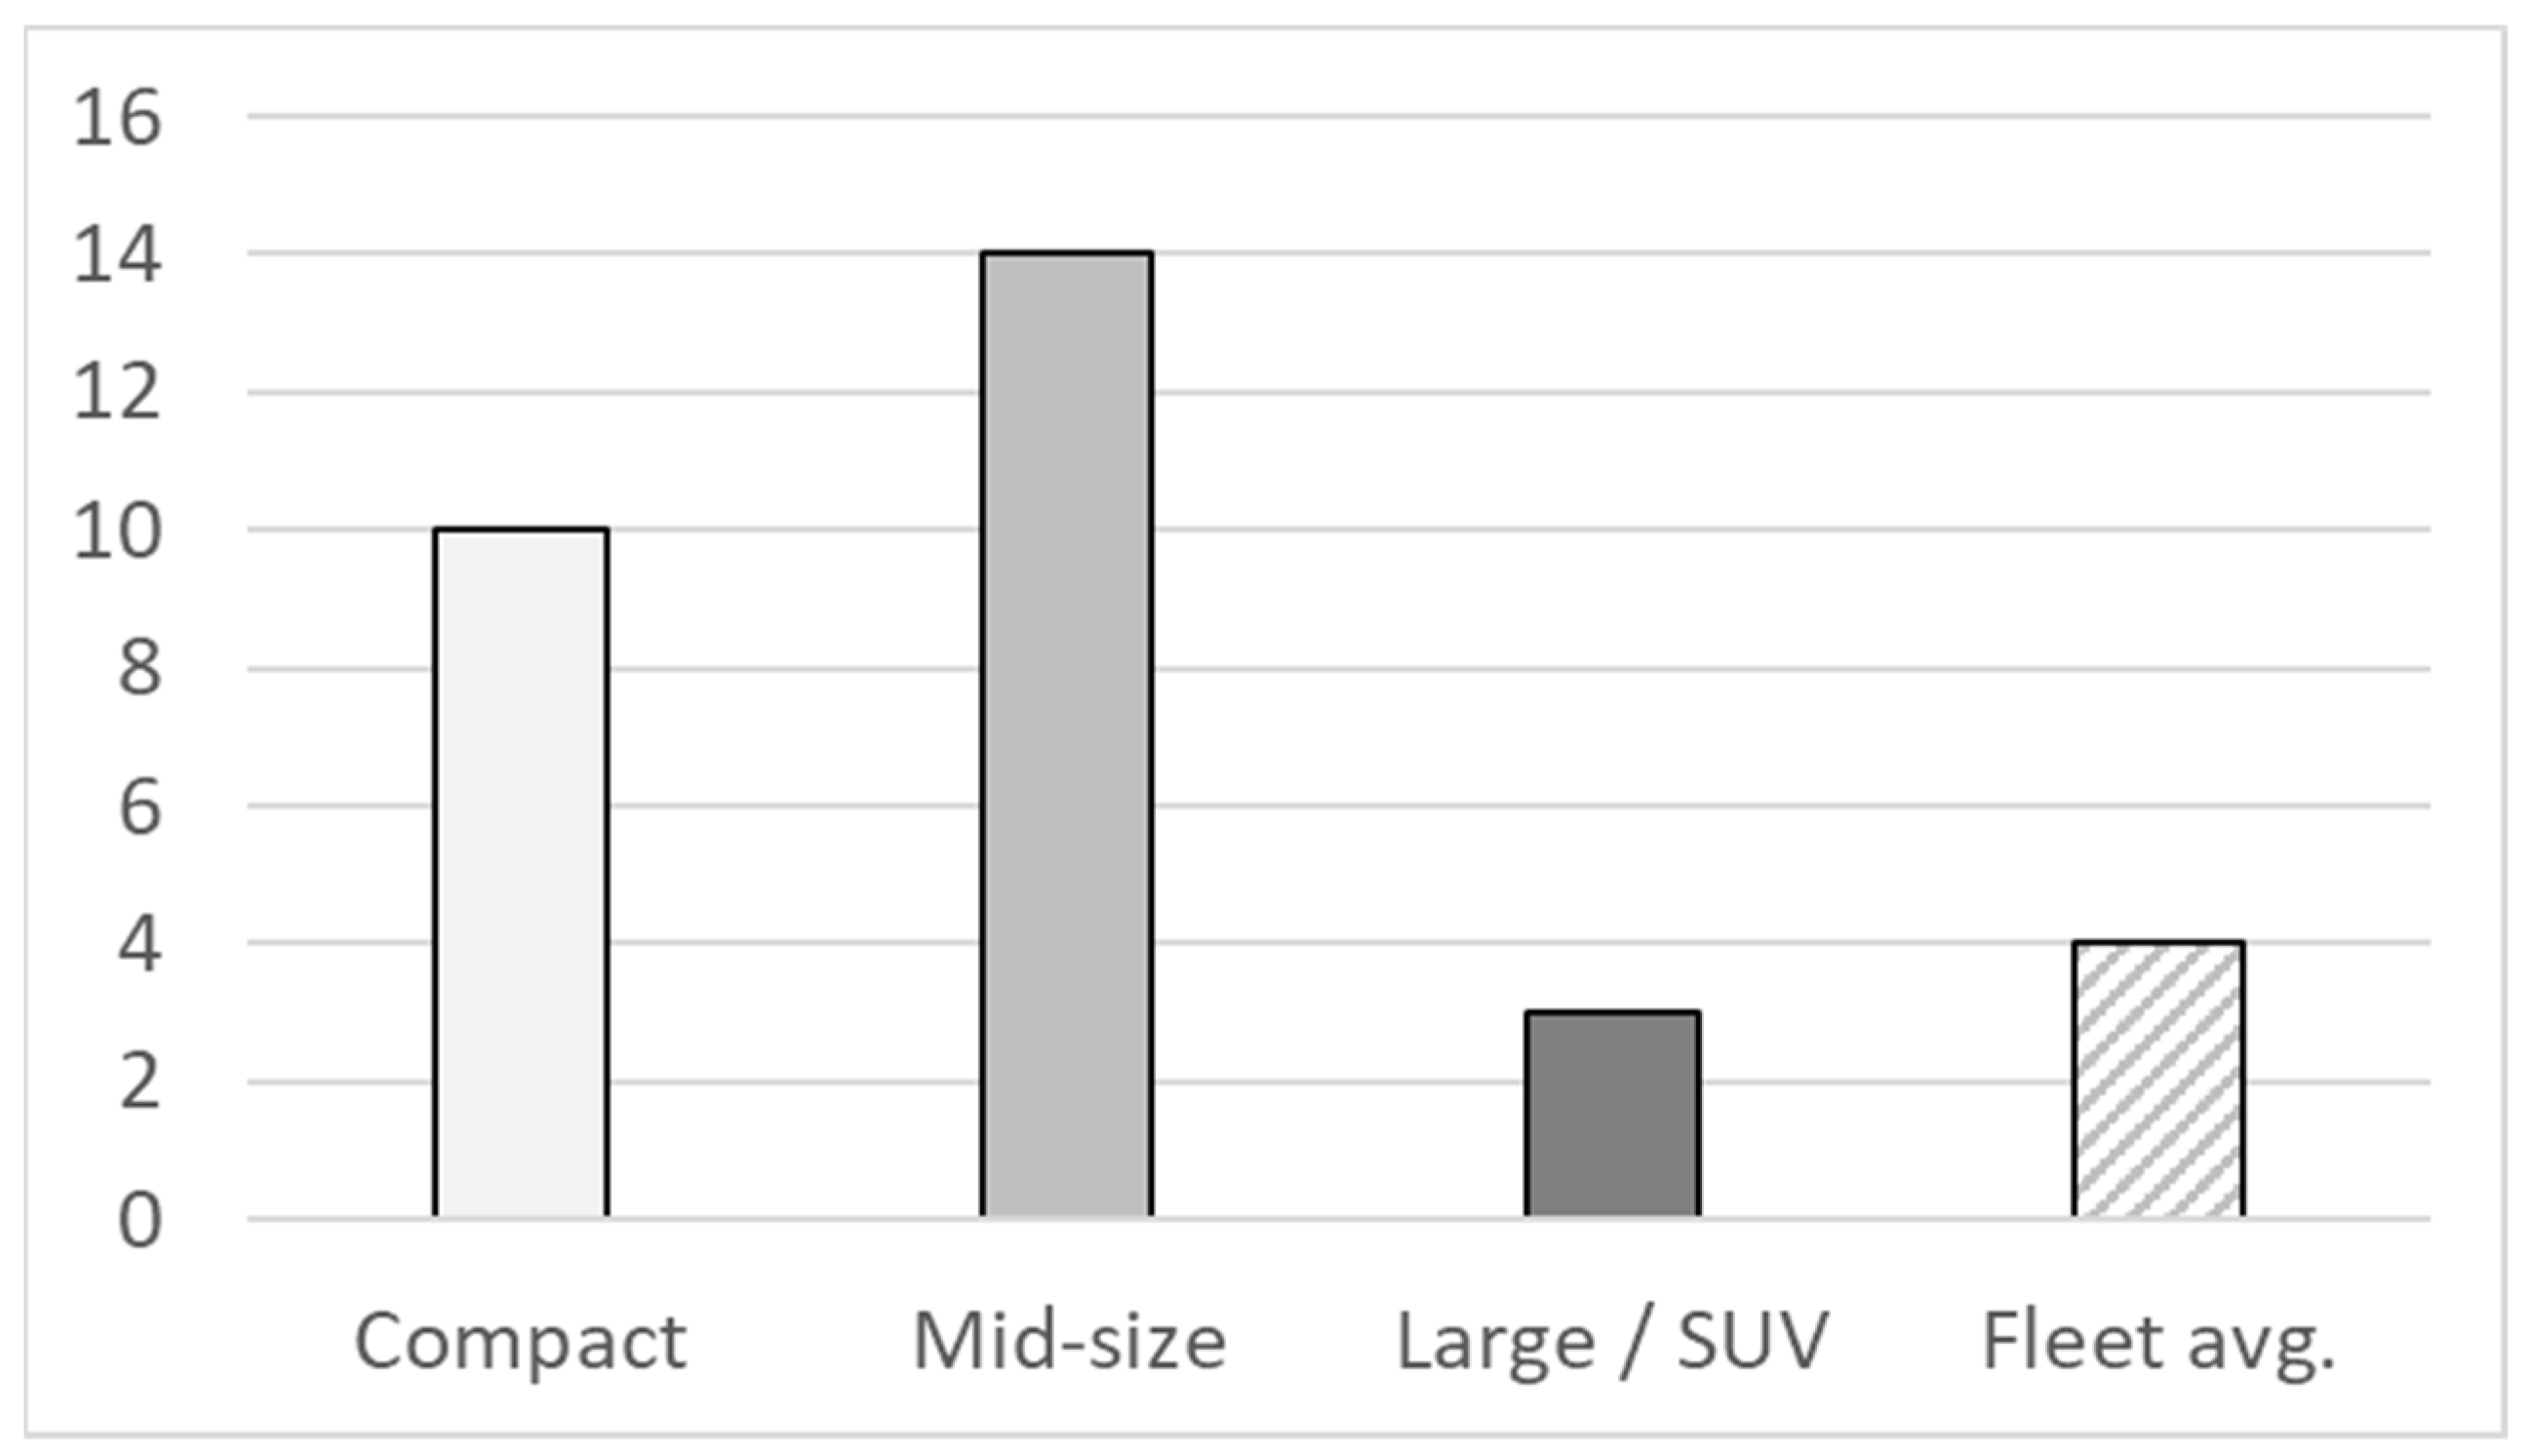
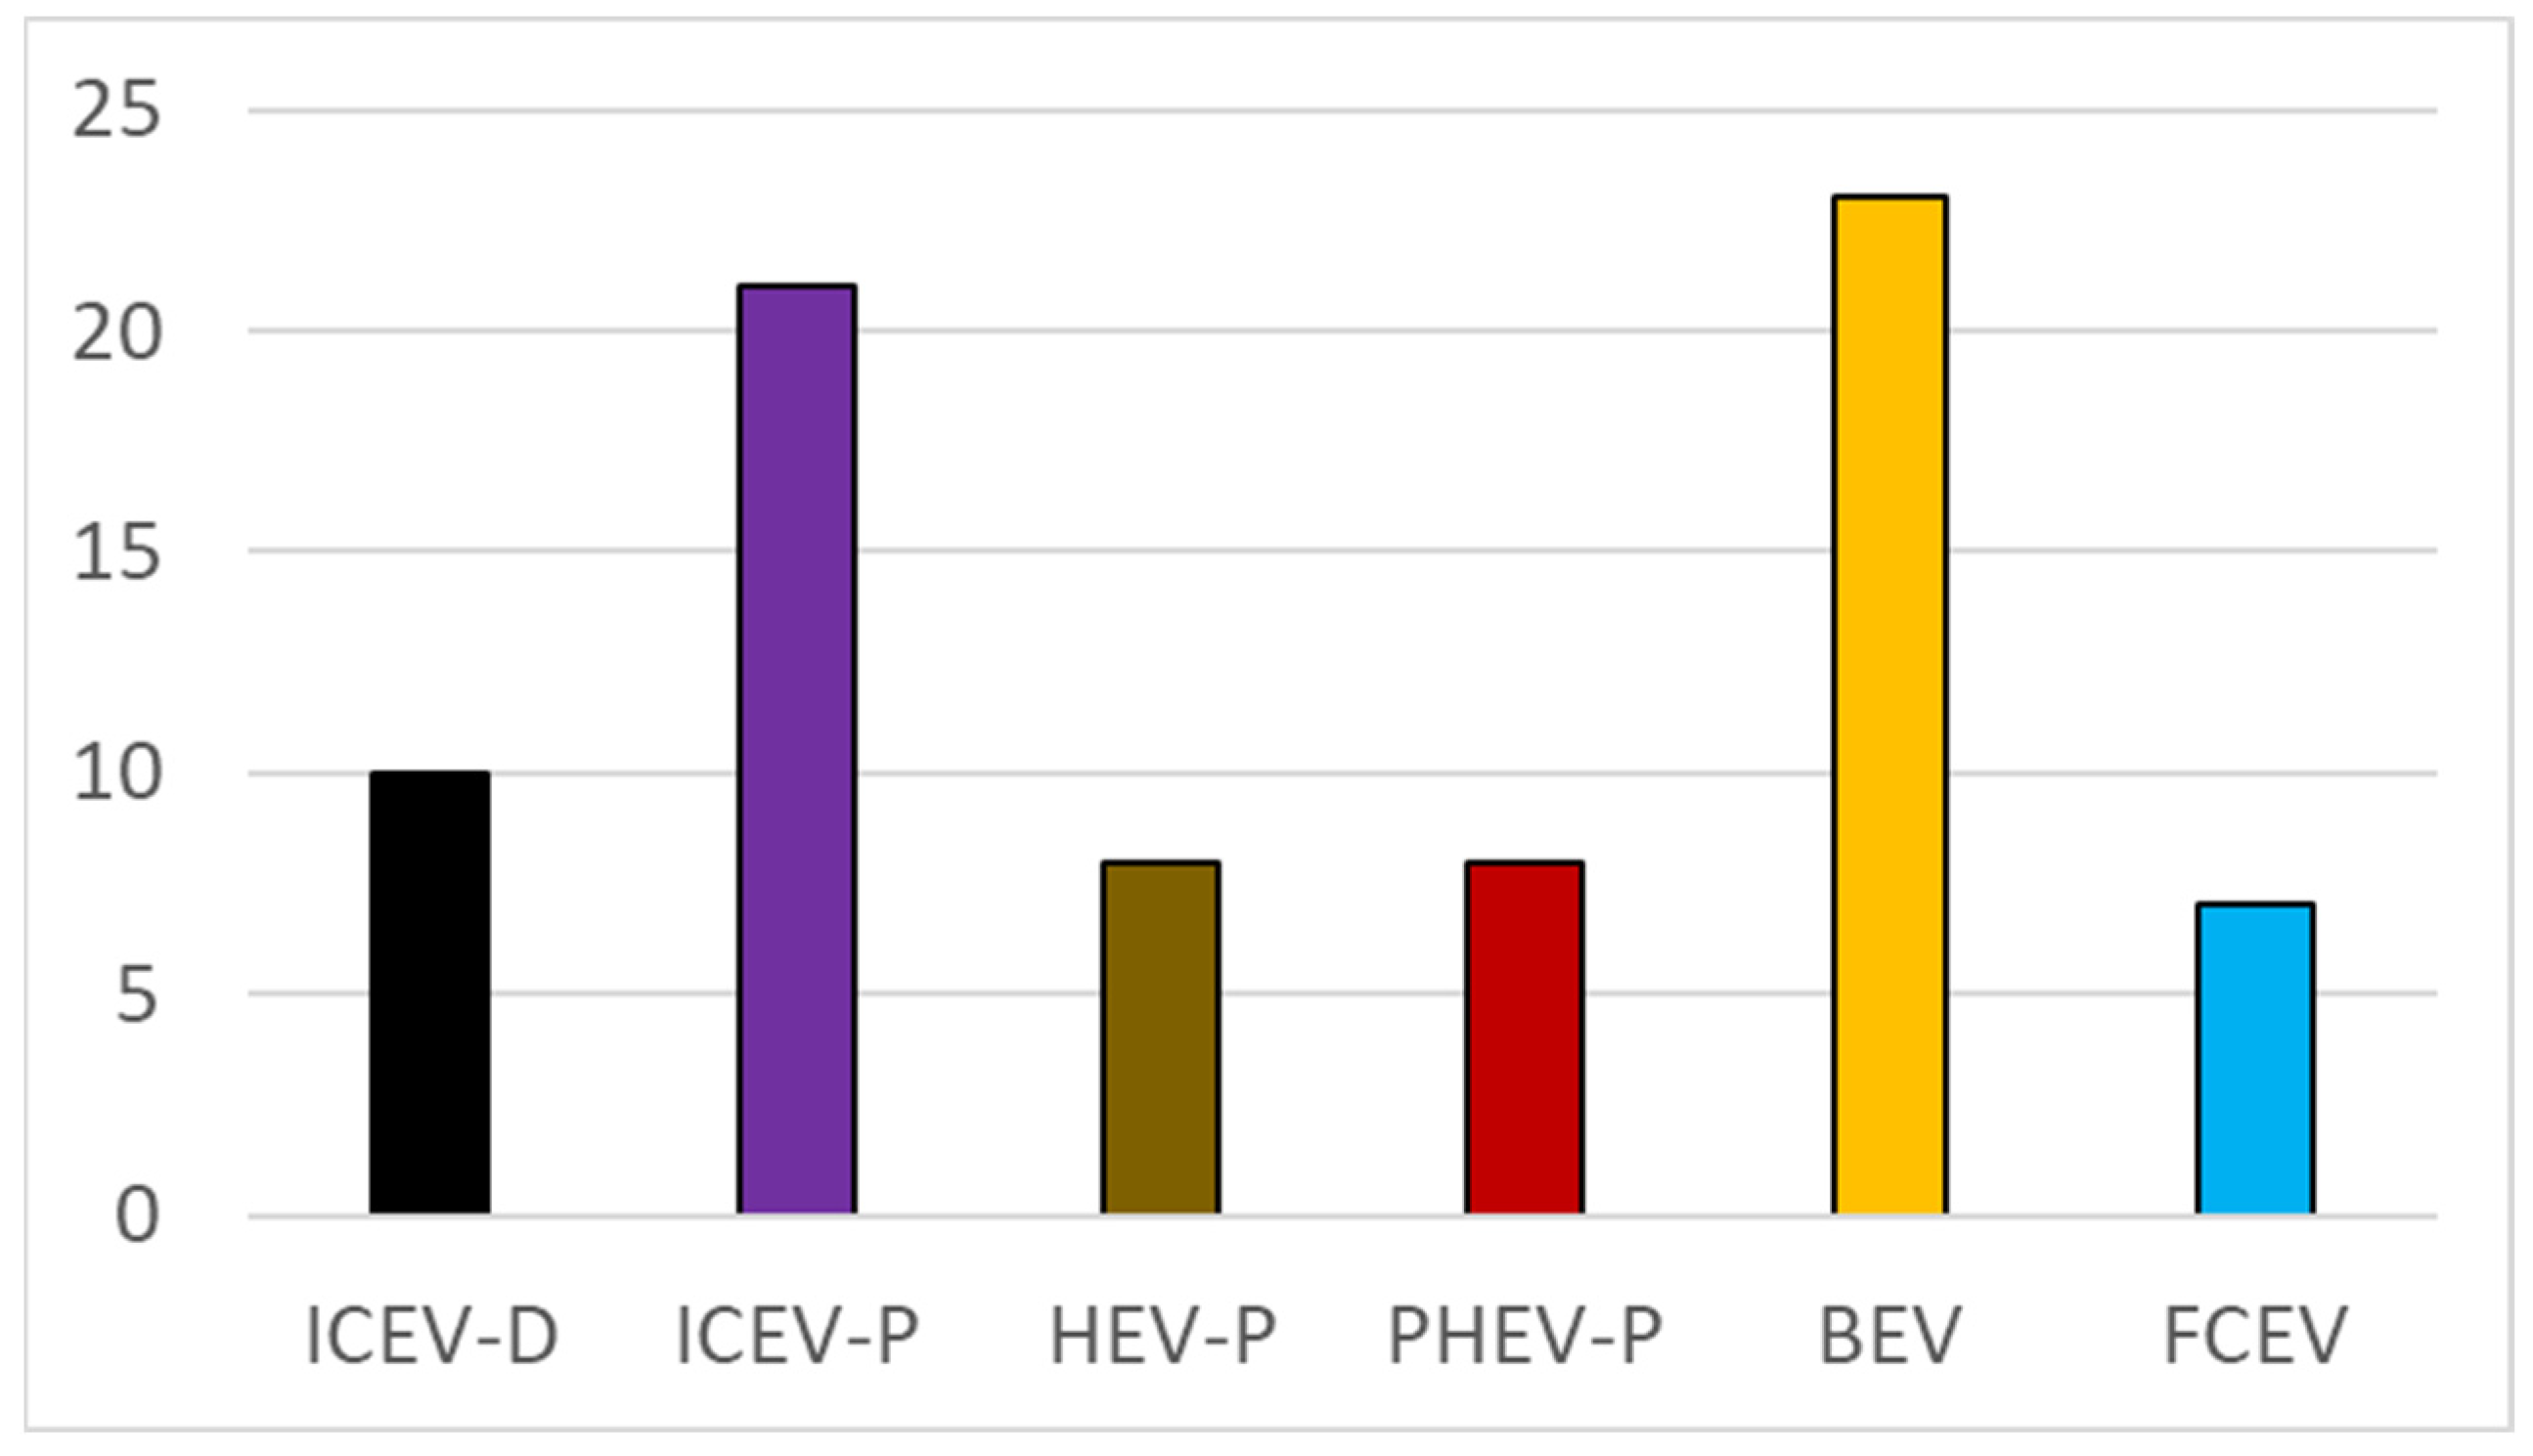
3.1. Bibliographic Analysis

Figure 5 reports the paper count per year of publication, from 2018 to 2022. Even considering that the tally for year 2022 is incomplete (limited to the time of writing), it appears that there was a peak in research activity on the LCA of passenger vehicles in the year 2020. The increase in number of papers per year leading to 2020 was however steeper than the subsequent decrease.
Figure 6 then reports the number of studies that address each of three main vehicle size classes (respectively: compact, medium-size and large or sport utility), or an average “fleet mix”. Broadly speaking, the resulting distribution appears to approximately reflect the average vehicle fleet composition in many European countries (e.g., see [31]); however, it may indicate an under-representation of large and sport-utility vehicles (SUVs) in other markets, notably especially in North America.
Finally, Figure 7 reports the number of studies that address each of the five types of vehicle under consideration, namely: ICEV-diesel, ICEV-petrol, HEV-petrol, PHEV-petrol, BEV and FCEV. ICEVs and BEVs emerge as the options that have attracted the most attention in the literature; this comes as no surprise, given that ICEVs are the most historically widespread, and as such also the most important benchmark against which all other options are often compared, and BEVs have often been identified as among the most promising candidates for displacing the former [2].

3.2. Harmonized Life-Cycle GHG Emissions

Figure 8 and Figure 9 report all the GHG emission data points extracted from the reviewed literature, post-harmonization. It should be noted that the horizontal axis indicates the actual vintage of the data used in the calculations (and specifically, in the case of PHEVs and BEVs, the year of the reference electricity grid mix assumed for the vehicle’s use phase), and not the year of publication of the LCA.
Figure 10 then presents a statistical break-down analysis of the same data points, subdivided by power train type, and then classified in terms of the percentages of results that fall within each consecutive 50 g range, from 0 to 400 g (CO2-eq)/(V·km).
The analysis of the harmonized results leads to several clear indications.
Firstly, as far as ICEVs are concerned, the use of diesel fuel appears to lead to significantly lower emissions vs. petrol. While this comparison between ICEV-D and ICEV-P results may in small part be affected by cross-study inconsistencies in terms of associated vehicle size classes, the fact that the statistical distributions of the two sets of results are centred on sufficiently separated values, with comparatively little overlap, points to a likely high degree of robustness for this finding.
Additionally, HEVs with petrol engines are characterized by consistently lower GHG emissions than their non-hybrid counterparts. This second finding indicates that, on average, the additional mechanical complexity and increased up-front carbon intensity of hybrid power trains are justified in light of the ensuing overall life-cycle emission reductions.
PHEVs and BEVs data points are scattered over fairly wide ranges, and while several data points do populate the left-most bars in their statistical distributions of Figure 10, at first sight the latter do not appear to be centred on significantly lower values vs. HEVs and ICEV-Ds. However, it is important to note that the results for these vehicle types, and specifically for BEVs, exhibit a very strong dependence on the composition of the electricity grid mix that is assumed to be used to recharge the on-board batteries during their use phase, and that such grid mix composition often varies considerably across different world regions, and over time. In fact, comparing Figure 8 and Figure 9 indicates that significantly lower GHG emissions are expected for the future (years 2025–2050) vs. the past decade (years 2013–2021).
Additionally, importantly, a further consideration needs to be made before summarily interpreting the GHG emission results for BEVs shown in Figure 8, Figure 9 and Figure 10: all the reviewed literature studies made similarly simplistic assumptions on the composition of the electricity grid mix. Essentially, each data point was calculated while assuming that the grid mix will remain the same throughout the entire use phase of the vehicle. Yet, in a world where most countries are actively engaged in aggressive efforts directed at decarbonizing electricity generation, such assumption is clearly not only over-simplistic, but also very likely overly pessimistic. Admittedly, several studies then address this oversimplification by way of a sensitivity analysis, repeating the BEV calculations for one or more alternative grid mix compositions, which are deemed representative of corresponding future energy scenarios.
However, as also discussed elsewhere [30,32], a different approach would arguably be more appropriate and conducive to more realistic results, namely assuming a “dynamic” grid mix composition that is allowed to change over time throughout the expected service life of the vehicle. This approach has therefore been approximated here by calculating the averages of the harmonized life-cycle GHG emission results previously reported, respectively, over the years from 2021 to 2035 (corresponding to an assumed 15-year service life for new vehicles registered in 2021), and then again over the years 2036 to 2050 (for a similar estimate for vehicles registered in 2036 and driven over the following 15 years). The results of these calculations, carried out separately for the BEV data points, respectively, pertaining to Europe, North America and Asia + Australia, and compared to the average data points for ICEV-Ds and ICEV-Ps, are reported in Figure 11.
The indication that emerges from Figure 11 is that the switch from ICEVs to BEVs will represent a very effective strategy at curbing GHG emissions over the next three decades. In almost all cases, BEVs introduced on the market today are already expected to represent a lower carbon intensive option than conventional ICEVs, over their estimated 15-year service life (specifically, −45% in Europe and Asia&Australia, and −25% in North America, when compared to petrol ICEVs; and −15% in Europe and Asia&Australia, and +5% in North America, when compared to diesel ICEVs). Additionally, even more importantly, the life-cycle GHG emission benefits then increase significantly when considering new BEVs over the following 15 years (up to −60% in Europe, −70% in Asia&Australia, and −40% in North America, when compared to petrol ICEVs; and −40% in Europe, −60% Asia&Australia, and −12% in North America, when compared to diesel ICEVs).
Finally, it is noteworthy that the statistical analysis of the life-cycle GHG emis-sion results for FCEVs shown in Figure 10 differs significantly from those for all other power train types, in that it is the only case in which a bi-normal distribution is ob-served, with two peaks centred on the (0.10–0.15) and (0.20–0.25) kg (CO2-eq)/(V·km) ranges, respectively. This is due to the very large difference in carbon intensity for the two types of hydrogen supply chains that are assumed in the reviewed studies. The low-er emission range corresponds to the use of H2 produced via electrolysis powered by a range of low-carbon electricity mixes, while the higher range is characteristic of the use of H2 produced via fossil fuel reforming. These results indicate that only in the former case do FCEVs offer a GHG emission reduction potential vs. the continued use of con-ventional fuels in ICEVs.

4. Discussion

The systematic review and harmonization of the life-cycle GHG emissions of passenger cars produced by the most recent peer-reviewed scientific literature has enabled a few clear overall messages to emerge, which are deemed key to enable evidence-based policy recommendations. Firstly, battery electric vehicles (BEVs) stand out as the most promising option to decarbonize the passenger vehicle fleet, when compared to conventional internal combustion engine vehicles (ICEVs) running on petrol, and, to a lesser extent, also on diesel. Secondly, hybrid and plug-in hybrid electrics (HEVs and PHEVs) may also represent valid options, especially as an intermediate solution for those markets that may struggle to quickly deploy the extensive battery charging infrastructure that is required for fully electric vehicles to be a really practical solution. Thirdly, the competitiveness of fuel cell vehicles (FCEVs) in terms of carbon emission reduction potential vs. conventional ICEVs strongly depends on the viability of generating sufficient quantities of “green” hydrogen via water electrolysis powered by low-carbon electricity.
It must also be mentioned that the reviewed literature appears to be characterized by a comparative lack of coverage and in-depth discussion of several other factors and variables that may also affect the future trends in life-cycle GHG emissions of passenger vehicles. Some of these variables apply to all vehicle power train options, such as: the possible further decarbonization of the supply chains of key material inputs to car manufacturing (e.g., low-carbon steel produced via electric arc furnaces (EAC) fed by directly reduced iron (DRI); low-carbon aluminium produced using renewable energy, etc.); and enhanced end-of-life recycling rates for all carbon-intensive materials contained in the vehicle. Other factors are instead specific to electric vehicles, thereby potentially further increasing their comparative advantage vs. conventional ICEVs: the on-going evolution in battery technology, both in terms of new cathode and anode chemistries (e.g., Li-metal, Na-ion, etc.), and increased energy density; and increased end-of-life take-back and repurposing of EV batteries in second-life applications (e.g., for grid storage).
Finally, although outside of the intended scope of this review, it is worth mentioning that behavioural change has also been identified as playing a potentially significant role in terms of reducing the GHG emissions of passenger vehicles, per unit of transport service provided. Specifically, a transition to vehicle sharing schemes—often also collectively referred to as “Mobility as a Service” (MaaS) or “Transport as a Service (TaaS)—has been shown to hold great potential for significant decarbonization of the passenger vehicle sector in its entirety [33].

Funding

This research received no external funding.

Conflicts of Interest

The author declares no conflict of interest.

Abbreviations

BEVbattery electric vehicle
CNGcompressed natural gas
DRIdirectly reduced iron
EACelectric arc furnace
FCEVfuel cell electric vehicle
FUfunctional unit
GHGgreenhouse gase
HEVhybrid electric vehicle
ICEVinternal combustion engine vehicle
LCAlife cycle assessment
LIBlithium-ion battery
LPGliquefied petroleum gas
MaaSmobility as a service
PHEVplug-in hybrid electric vehicle
SUVsport utility vehicle
TaaStransport as a service
VKTvehicle km travelled
VOvehicle occupancy

References

  1. Intergovernmental Panel on Climate Change (IPCC). Climate Change 2022: Impacts, Adaptation and Vulnerability. Available online: https://www.ipcc.ch/report/ar6/wg2/ (accessed on 14 July 2022).
  2. International Energy Agency (IEA). Global EV Outlook 2022. Available online: https://www.iea.org/reports/global-ev-outlook-2022 (accessed on 14 July 2022).
  3. UK Government. PM Outlines His Ten Point Plan for a Green Industrial Revolution for 250,000 Jobs. Available online: https://www.gov.uk/government/news/pm-outlines-his-ten-point-plan-for-a-green-industrial-revolution-for-250000-jobs (accessed on 14 July 2022).
  4. European Parliament. Fit for 55: MEPs Back CO2 Emission Standards for Cars and Vans. Available online: https://www.europarl.europa.eu/news/en/press-room/20220509IPR29105/fit-for-55-meps-back-co2-emission-standards-for-cars-and-vans (accessed on 14 July 2022).
  5. Page, M.J.; McKenzie, J.E.; Bossuyt, P.M.; Boutron, I.; Hoffmann, T.C.; Mulrow, C.D.; Shamseer, L.; Tetzlaff, J.M.; Akl, E.A.; Brennan, S.E.; et al. The PRISMA 2020 statement: An updated guideline for reporting systematic reviews. BMJ 2021, 372, n71. [Google Scholar] [CrossRef]
  6. Shafique, M.; Azam, A.; Rafiq, M.; Luo, X. Life cycle assessment of electric vehicles and internal combustion engine vehicles: A case study of Hong Kong. Res. Transp. Econ. 2022, 91, 101112. [Google Scholar] [CrossRef]
  7. Smit, R.; Kennedy, D.W. Greenhouse Gas Emissions Performance of Electric and Fossil-Fueled Passenger Vehicles with Uncertainty Estimates Using a Probabilistic Life-Cycle Assessment. Sustainability 2022, 14, 3444. [Google Scholar] [CrossRef]
  8. Wang, N.; Tang, G. A Review on Environmental Efficiency Evaluation of New Energy Vehicles Using Life Cycle Analysis. Sustainability 2022, 14, 3371. [Google Scholar] [CrossRef]
  9. Tang, B.; Xu, Y.; Wang, M. Life Cycle Assessment of Battery Electric and Internal Combustion Engine Vehicles Considering the Impact of Electricity Generation Mix: A Case Study in China. Atmosphere 2022, 13, 252. [Google Scholar] [CrossRef]
  10. Zheng, G.; Peng, Z. Life Cycle Assessment (LCA) of BEV’s environmental benefits for meeting the challenge of ICExit (Internal Combustion Engine Exit). Energy Rep. 2021, 7, 1203–1216. [Google Scholar] [CrossRef]
  11. Zeng, D.; Dong, Y.; Cao, H.; Li, H.; Wang, J.; Li, Z.; Hauschild, M.Z. Are the electric vehicles more sustainable than the conventional ones? Influences of the assumptions and modeling approaches in the case of typical cars in China. Resour. Conserv. Recycl. 2021, 167, 105210. [Google Scholar] [CrossRef]
  12. Yang, L.; Yu, B.; Yang, B.; Chen, H.; Malima, G.; Wei, Y.-M. Life cycle environmental assessment of electric and internal combustion engine vehicles in China. J. Clean. Prod. 2021, 285, 124899. [Google Scholar] [CrossRef]
  13. Petrauskienė, K.; Galinis, A.; Kliaugaitė, D.; Dvarionienė, J. Comparative Environmental Life Cycle and Cost Assessment of Electric, Hybrid, and Conventional Vehicles in Lithuania. Sustainability 2021, 13, 957. [Google Scholar] [CrossRef]
  14. Koroma, M.S.; Brown, N.; Cardellini, G.; Messagie, M. Prospective Environmental Impacts of Passenger Cars under Different Energy and Steel Production Scenarios. Energies 2020, 13, 6236. [Google Scholar] [CrossRef]
  15. Desantes, J.M.; Molina, S.; Novella, R.; Lopez-Juarez, M. Comparative global warming impact and NOX emissions of conventional and hydrogen automotive propulsion systems. Energy Convers. Manag. 2020, 221, 113137. [Google Scholar] [CrossRef]
  16. Bouter, A.; Hache, E.; Ternel, C.; Beauchet, S. Comparative environmental life cycle assessment of several powertrain types for cars and buses in France for two driving cycles: “Worldwide harmonized light vehicle test procedure” cycle and urban cycle. Int. J. Life Cycle Assess 2020, 25, 1545–1565. [Google Scholar] [CrossRef]
  17. Ambrose, H.; Kendall, A.; Lozano, M.; Wachche, S.; Fulton, L. Trends in life cycle greenhouse gas emissions of future light duty electric vehicles. Transp. Res. Part D Transp. Environ. 2020, 81, 102287. [Google Scholar] [CrossRef]
  18. Blat Belmonte, B.; Esser, A.; Weyand, S.; Franke, G.; Schebek, L.; Rinderknecht, S. Identification of the Optimal Passenger Car Vehicle Fleet Transition for Mitigating the Cumulative Life-Cycle Greenhouse Gas Emissions until 2050. Vehicles 2020, 2, 75–99. [Google Scholar] [CrossRef]
  19. Petrauskienė, K.; Skvarnavičiūtė, M.; Dvarionienė, J. Comparative environmental life cycle assessment of electric and conventional vehicles in Lithuania. J. Clean. Prod. 2020, 246, 119042. [Google Scholar] [CrossRef]
  20. Helmers, E.; Dietz, J.; Weiss, M. Sensitivity Analysis in the Life-Cycle Assessment of Electric vs. Combustion Engine Cars under Approximate Real-World Conditions. Sustainability 2020, 12, 1241. [Google Scholar] [CrossRef]
  21. Evtimov, I.; Ivanov, R.; Stanchev, H.; Kadikyanov, G.; Staneva, G. Life Cycle Assessment of Fuel Cells Electric Vehicles. Transp. Probl. 2020, 15, 153–166. [Google Scholar] [CrossRef]
  22. Wu, Z.; Wang, C.; Wolfram, P.; Zhang, Y.; Sun, X.; Hertwich, E. Assessing electric vehicle policy with region-specific carbon footprints. Appl. Energy 2019, 256, 113923. [Google Scholar] [CrossRef]
  23. Kim, S.; Pelton, R.E.O.; Smith, T.M.; Lee, J.; Jeon, J.; Suh, K. Environmental Implications of the National Power Roadmap with Policy Directives for Battery Electric Vehicles (BEVs). Sustainability 2019, 11, 6657. [Google Scholar] [CrossRef]
  24. Bekel, K.; Pauliuk, S. Prospective cost and environmental impact assessment of battery and fuel cell electric vehicles in Germany. Int. J. Life Cycle Assess 2019, 24, 2220–2237. [Google Scholar] [CrossRef]
  25. Rosenfeld, D.C.; Lindorfer, J.; Fazeni-Fraisl, K. Comparison of advanced fuels—Which technology can win from the life cycle perspective? J. Clean. Prod. 2019, 238, 117879. [Google Scholar] [CrossRef]
  26. Ahmadi, P. Environmental impacts and behavioral drivers of deep decarbonization for transportation through electric vehicles. J. Clean. Prod. 2019, 225, 1209–1219. [Google Scholar] [CrossRef]
  27. Kawamoto, R.; Mochizuki, H.; Moriguchi, Y.; Nakano, T.; Motohashi, M.; Sakai, Y.; Inaba, A. Estimation of CO2 Emissions of Internal Combustion Engine Vehicle and Battery Electric Vehicle Using LCA. Sustainability 2019, 11, 2690. [Google Scholar] [CrossRef]
  28. Burchart-Korol, D.; Jursova, S.; Folęga, P.; Korol, J.; Pustejovska, P.; Blaut, A. Environmental life cycle assessment of electric vehicles in Poland and the Czech Republic. J. Clean. Prod. 2018, 202, 476–487. [Google Scholar] [CrossRef]
  29. Wu, Z.; Wang, M.; Zheng, J.; Sun, X.; Zhao, M.; Wang, X. Life cycle greenhouse gas emission reduction potential of battery electric vehicle. J. Clean. Prod. 2018, 190, 462–470. [Google Scholar] [CrossRef]
  30. Hill, N.; Amaral, S.; Morgan-Price, S.; Nokes, T.; Bates, J.; Helms, H.; Fahrenbach, H.; Bieman, K.; Abdalla, N.; Joehrens, J.; et al. Determining the Environmental Impacts of Conventional and Alternatively Fuelled Vehicles through LCA. European Commission, DG Climate Action. Available online: https://ec.europa.eu/clima/system/files/2020-09/2020_study_main_report_en.pdf (accessed on 14 July 2022).
  31. Raugei, M.; Hutchinson, A.; Morrey, D. Can Electric Vehicles significantly reduce our dependence on non-renewable energy? Scenarios of compact vehicles in the UK as a case in point. J. Clean. Prod. 2018, 201, 1043–1051. [Google Scholar] [CrossRef]
  32. Hoekstra, A. The Underestimated Potential of Battery Electric Vehicles to Reduce Emissions. Joule 2019, 3, 1404–1414. [Google Scholar] [CrossRef]
  33. Raugei, M.; Kamran, M.; Hutchinson, A. Environmental implications of the ongoing electrification of the UK light duty vehicle fleet. Resour. Conserv. Recycl. 2021, 174, 105818. [Google Scholar] [CrossRef]
Figure 1. PRISMA 2020 flow diagram for new systematic reviews [5].
Energies 15 07163 g001
Figure 2. Screening step 3—Web of Science categories.
Energies 15 07163 g002
Figure 3. Literature identification/collection and screening process and resulting paper counts at each stage.
Energies 15 07163 g003
Figure 4. Schematic diagram of vehicle life cycle stages included in harmonization.
Energies 15 07163 g004
Figure 5. Number of papers per year of publication (tally for 2022 limited to the first half of the year).
Energies 15 07163 g005
Figure 6. Number of papers addressing each vehicle size class.
Energies 15 07163 g006
Figure 7. Number of papers addressing each vehicle category (by power train type).
Energies 15 07163 g007
Figure 8. Harmonized life-cycle GHG emissions per (vehicle·km), plotted vs. year of data used (2013–2021); PHEV and BEV results were calculated assuming “static” (i.e., non-evolving) grid mix composition.
Energies 15 07163 g008
Figure 9. Harmonized life-cycle GHG emissions per (vehicle·km), plotted vs. year of respective grid mix scenario (2025–2050); PHEV and BEV results were calculated assuming “static” (i.e., non-evolving) grid mix composition.
Energies 15 07163 g009
Figure 10. Statistical analysis of all harmonized life-cycle GHG emission results, per (vehicle·km). All data points (2013–2050); PHEV and BEV results were calculated assuming “static” (i.e., non-evolving) grid mix composition.
Energies 15 07163 g010
Figure 11. Corrected estimates for the life-cycle GHG emissions of ICEVs and BEVs, when accounting for the dynamic evolution of the electricity grid mix used to recharge the BEV batteries over their service lives.
Energies 15 07163 g011
Publisher’s Note: MDPI stays neutral with regard to jurisdictional claims in published maps and institutional affiliations.

