Article

Effect of the Hydrogen Injection Position on the Combustion Process of a Direct Injection X-Type Rotary Engine with a Hydrogen Blend

1
Science and Technology on Plasma Dynamics Laboratory, Air Force Engineering University, Xi’an 710038, China
2
School of Mechanical Engineering, Xi’an Jiaotong University, Xi’an 710049, China
*
Author to whom correspondence should be addressed.
Energies 2022, 15(19), 7219; https://doi.org/10.3390/en15197219
Submission received: 1 September 2022 / Revised: 26 September 2022 / Accepted: 27 September 2022 / Published: 1 October 2022
(This article belongs to the Section A5: Hydrogen Energy)

Abstract

:
As a new type of power device, the X-type rotary engine (XRE) is regarded as a major revolution of the internal combustion engine with its special structure and high-efficiency hybrid cycle (HEHC). A 3D CFD model of an XRE with hydrogen–gasoline fuel is firstly built in this paper. The gasoline is premixed with air in the intake of the XRE. The hydrogen is directly injected (DI) into the cylinder with four different injection positions. The effects of the hydrogen injection position on the combustion process, engine thermodynamic performance, and unburned carbon emissions and NOx emissions are investigated. The results show that, due to the interaction between the in-cylinder main flow field and the injected hydrogen gas flow, different hydrogen concentration zones are formed at different injection positions. Furthermore, a larger hydrogen distribution area and being closer to the ignition position led to a faster in-cylinder combustion rate and a higher in-cylinder temperature and pressure. When the injection position is from the front to the back of the combustion chamber such as in position 2, the hydrogen has the widest distribution area and is closest to the ignition position, resulting in its fastest combustion speed. Meanwhile, the peak in-cylinder pressure is 3.73 MPa and the peak temperature is a maximum of 1835.16 K. Especially, the highest indicated thermal efficiency of 26.56% is found in position 2, which is 10.08% higher than that of position 4 (from right to left of the combustion chamber), which was 24.13%. At the same time, due to the best overall combustion effect, position 2 presents the lowest final unburned carbon emission of 0.36 mg, while it produces the highest NOx emission of 9.15 μg. Thus, this study provides important theoretical guidelines for the hydrogen injection strategy of the XRE using hydrogen–gasoline fuel.

1. Introduction

Compared with the traditional reciprocating-piston engine, the rotary engine is a rotary internal combustion engine with unique advantages of fewer parts, compact structure, small size, and high power-to-weight ratio [1,2,3]. It has obvious advantages in the fields of oil–electric hybrid cars, range extenders, generators, and small UAVs. The typical rotary engine is the Wankel rotary engine (WRE). However, it suffers from incomplete combustion, high fuel consumption, sealing and lubrication difficulties due to its narrow combustion chamber, mutual air escape between the combustion chambers, and other structural defects [4,5]. In recent years, in order to overcome the shortcomings of WRE, a new X-type rotary engine with an anti-triangular structure has been proposed [6,7]. In the structure, it inverts the rotor profile and cylinder profile of the WRE. It uses the outer rotation line as the rotor profile and the outer envelope line as the cylinder profile. In the thermal cycle, a high efficiency hybrid cycle (HEHC) with a high compression ratio and over-expansion (expansion ratio is greater than compression ratio) is adopted. Therefore, the XRE has the characteristics of high thermal efficiency, high power-to-weight ratio, and high reliability [8,9]. There is no doubt that it can solve many problems of the WRE such as high fuel consumption, easy wear and tear, and easy leakage.
At present, the research on the XRE is still in the initial stage. The American Liquid piston company has developed three XREs: X1 type, XMv3 type, and X4 type [10,11,12,13]. They found that the X1 engine can reach 60% thermal efficiency in theory, but the thermal efficiency obtained experimentally is only 33%. At the same time, the company increased the indicated thermal efficiency from 22% to 34%, and the work–weight ratio reached 2.0 kW/kg of the XMv3 engine by optimizing the sealing method, combustion chamber shape, and spark plug. For the X4 engine, after performance predictions, the company noted that the thermal efficiency is expected to reach 45% and power of 30 kW/7000 r·min−1 by using pre-combustion chamber diesel and aviation kerosene fuels. However, only single fuel research has been conducted for the XRE at this stage. The inherent disadvantages of gasoline, diesel, and other traditional fuels have caused low combustion efficiency and restricted the performance of the XRE.
As a clean and efficient new energy, hydrogen has the advantages of high flame speed, short quenching distance, fast diffusion rate, wide combustion limit, and low calorific value [14,15,16]. Therefore, the method of HB in carbon-based fuels is an effective solution to develop the hydrogen economy. On the one hand, the flame propagation and combustion process in the cylinder are affected by the boundary conditions such as in-cylinder space, time and temperature [17,18], and thus the HB has beneficial effect on improving the overall combustion stability [19,20]. On the other hand, the use of hydrogen-enriched fuels can alleviate the safety issues of pure hydrogen fuel [21,22,23]. Therefore, it can effectively improve the combustion efficiency of conventional single fuel in rotary engines by HB.
For the combustion performance study of hydrogen–gasoline dual-fuel rotary engine, Amrouche et al. [24,25] conducted an experimental study at 3000 RPM and an ignition angle of 15 °CA BTDC (crankshaft angle before top dead center). They found that HB could accelerate the combustion process, promote the complete combustion of the in-cylinder mixture, and improve effective thermal efficiency. Furthermore, they [26,27] investigated HB to extend the dilute combustion limit of the rotary engine. They found that HB could broaden the dilute combustion limit, improve the economy and reduce pollutant emissions. At 6% energy fraction of HB, the thermal efficiency was increased by 28% and NOx emissions were reduced by 61%. Fedyanov et al. [28,29] investigated the effect of 30% HB on flame propagation and obtained the variation of flame front position with crankshaft angle and hydrogen content. At the same time, they found that the unburned HC compound emissions are reduced by two times and CO emissions are reduced to 40% by using a staged HB approach. To investigate the effect of HB under different intake methods, Yang et al. [30,31] firstly compared the combustion performance of PI and DI mixed with hydrogen under the condition of circumferential intake. They found that the combustion effect of DI was better than that of PI. To be specific, the peak in-cylinder pressure was increased by 90.6% under 6% volume fraction of DI compared with 6% volume fraction of PI. However, the NOx and CO emissions were significantly higher. They [32,33] also optimized the injection strategy for DI and showed that the best combustion and emission characteristics were obtained for the rotary engine with a 110 °CA BTDC injection moment and 40 °CA injection pulse width. Based on this optimization strategy, they [34,35] also found that the rotary engine can achieve better power, economy, and emission characteristics by using a compound intake way. For the injection strategy, Shi et al. [36,37,38] conducted a deeper optimization study. The results show that the best engine performance was achieved with a high charge concentration, a 45° injection angle, a 0.4 MPa injection pressure, and a 1 mm nozzle diameter at the HB volume fraction of 3%. In addition, they [39,40] found that the split DI strategy could make the combustion more efficient and rapid compared to the single injection method and the engine performance is greatly improved with the increase in the secondary injection pulse width.
To sum up, a large number of scholars have conducted in-depth research on the hydrogen–gasoline fuel combustion of the WRE and found that direct injection (DI) HB can improve the engine combustion performance significantly. However, to the authors’ knowledge, few works focus on the effect of hydrogen–gasoline fuel on the combustion and thermodynamic performance of the XRE. Although the WRE and XRE are both rotary piston engines, they present different rotor structure and combustion chamber structure, leading to different laws of kinematics and thermodynamic cycles. Thus, this paper trys to improve the combustion performance of the XRE using a HB method with a DI strategy. More importantly, this study could find out the best hydrogen injection position of the XRE to maximize the performance of the XRE by comparing the engine performances at different hydrogen injection positions.

2. Models Establishment and Verification

2.1. Establishment of Geometric Model

The comparison diagram of the WRE and XRE is shown in Figure 1. Their main difference is that the shape of the XRE rotor is similar to that of the WRE cylinder block, which is oval and the shape of the WRE rotor is similar to a triangle. At the same time, their combustion chamber volume change rules, intake and exhaust positions, and sealing methods are also very different.
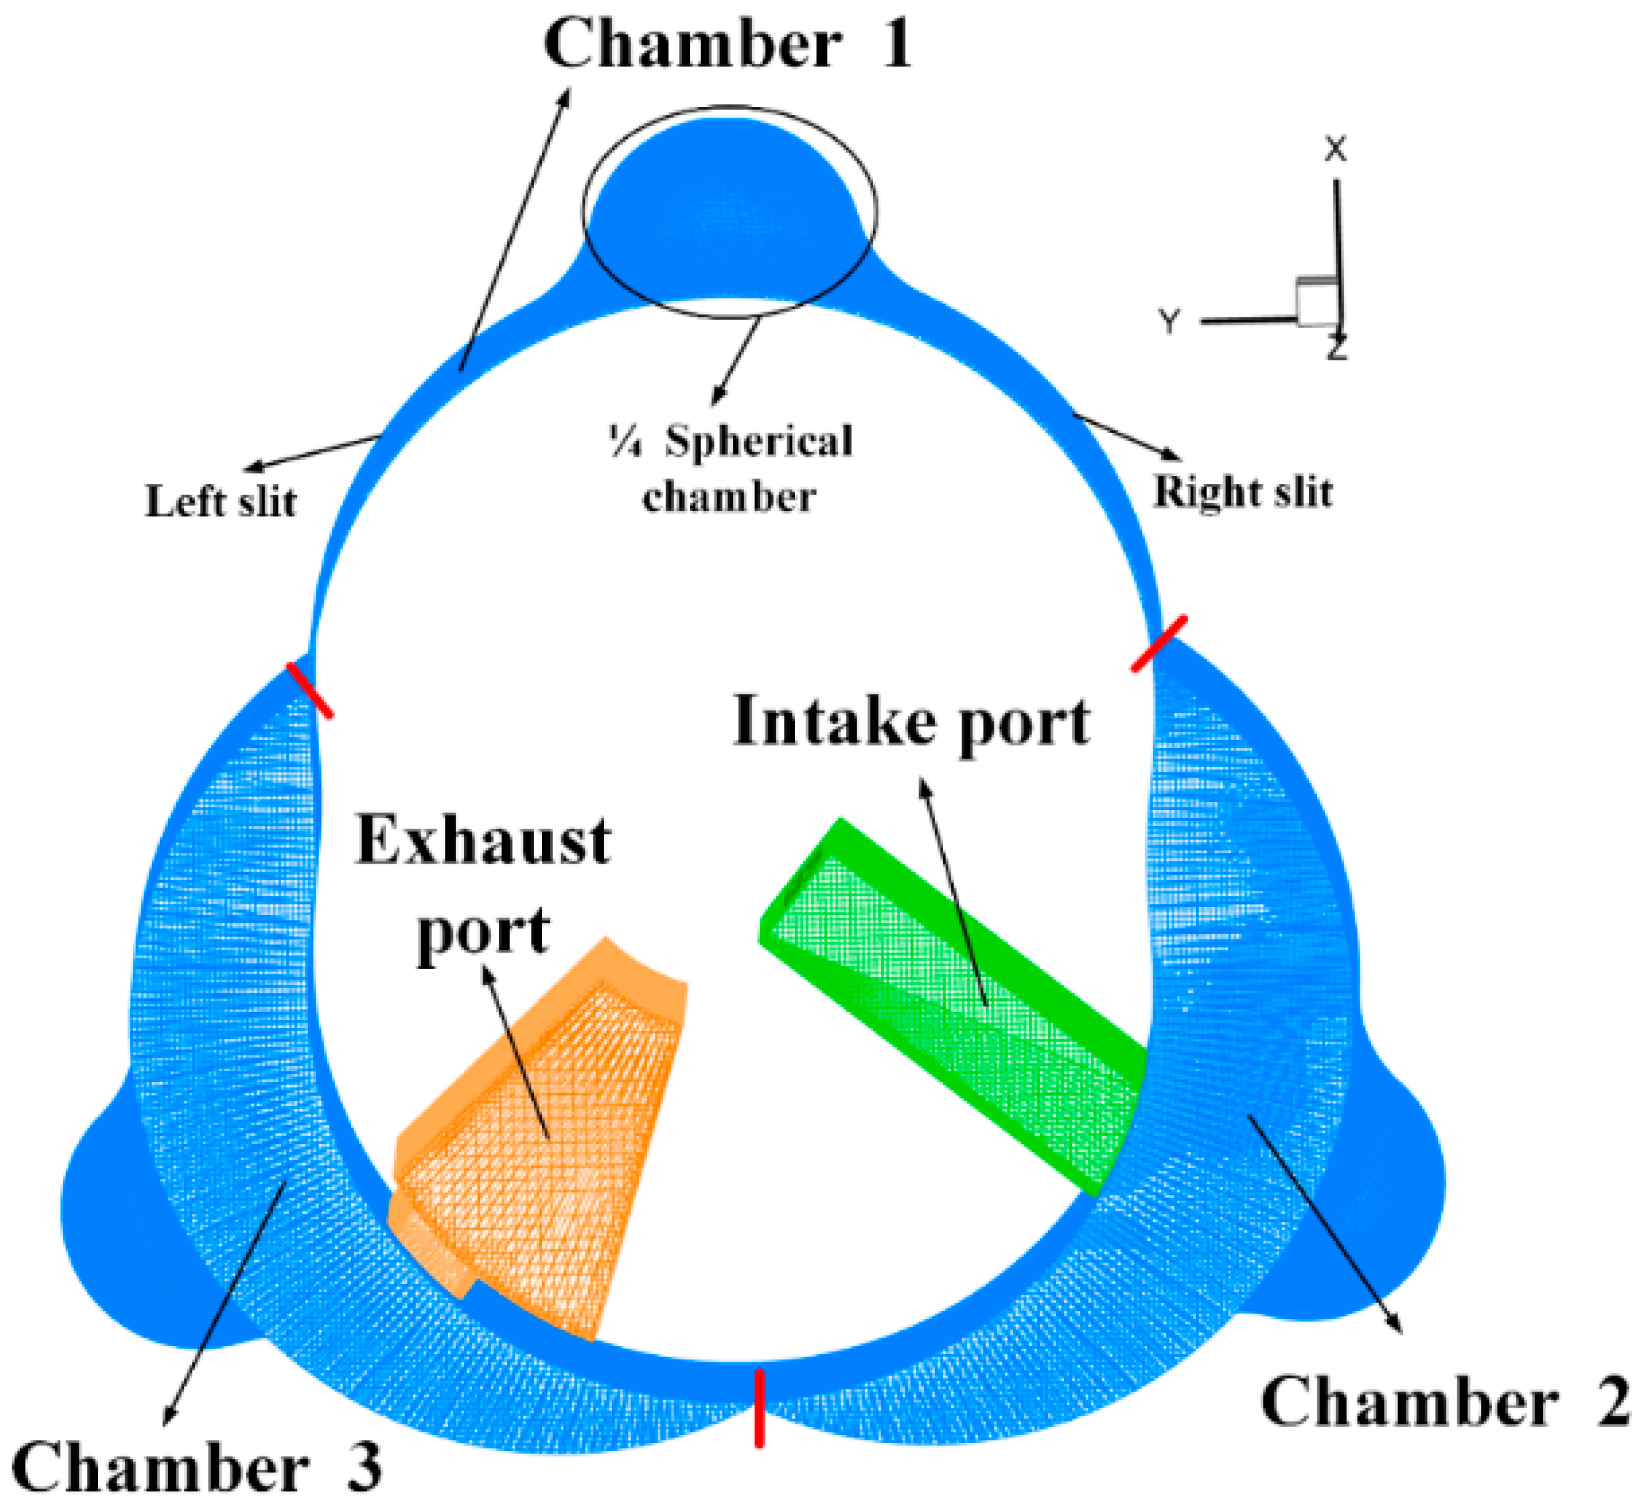
As shown in Figure 1b, the combustion chamber of the XRE in the combustion stage consists of two parts, a fixed 1/4 spherical area and a slit area that varies with the rotor rotation. The spark plug is located at the top of the combustion chamber. The engine is cycled at every 720 °CA. The volume of the chamber reaches a minimum at the top dead center of 360 °CA. The CFD model developed is based on the XMv3 engine and the specific geometric parameters are shown in Table 1.

2.2. Mathematical Model and Boundary Conditions

This paper is based on CONVERGE software for simulation. When building the CFD model, the first step is to divide the grid in the software. Furthermore, the surface grid of each region is divided into five regions: intake port, exhaust port, and three combustion chambers. The base grid size is set to 3 mm, while the setting of adaptive mesh refinement is turned on. In the meantime, the grid encryption with a refinement level of three is set in CONVERGE software, which is used for the velocity, temperature, and components of the calculation area, and the specific grid division results are shown in Figure 2.
For the choice of computational models, the RNG κ-ε model is used for the turbulence model [41,42]. Moreover, the Han–Reitz model is used for the wall heat transfer model [12,13] and the SAGE model is used for the combustion model [43]. The chemical reaction mechanism uses the isooctane PRF skeleton mechanism proposed by Liu et al. [44]. This mechanism also contains a detailed hydrogen oxidation mechanism, which can be used for the numerical study of hydrogen–gasoline fuel combustion characteristics. The ignition model uses added ignition energy. Expressly, three 0.5 mm spherical cores are set at the central ignition positions of the three combustion chambers and the ignition energy of the three cores is 20 mJ. The specific parameters of the standard operating conditions of the XRE are shown in Table 2. The simulation was conducted at 9000 RPM, 1.03 bar intake pressure, 30 °CA ignition advance angle, and 0.85 Lambda.

2.3. HB Method and Nozzle Positions

When blending hydrogen, the method to controlling the hydrogen energy fraction is chosen. In detail, the hydrogen energy fraction is changed while keeping the total gasoline to hydrogen–gasoline fuel equivalent ratio constant [45]. In the hydrogen–gasoline fuel, the hydrogen energy fraction per unit mass of fuel is set to ε H 2 . The specific formula is as follows:
ε H 2 = m H 2 q H 2 m I C 8 H 18 q I C 8 H 18 + m H 2 q H 2 100 %
where q H 2 and q I C 8 H 18 represent the low calorific values (MJ/kg) of hydrogen and gasoline, respectively, and the values q H 2 = 120 MJ/kg and q I C 8 H 18 = 44 MJ/kg.
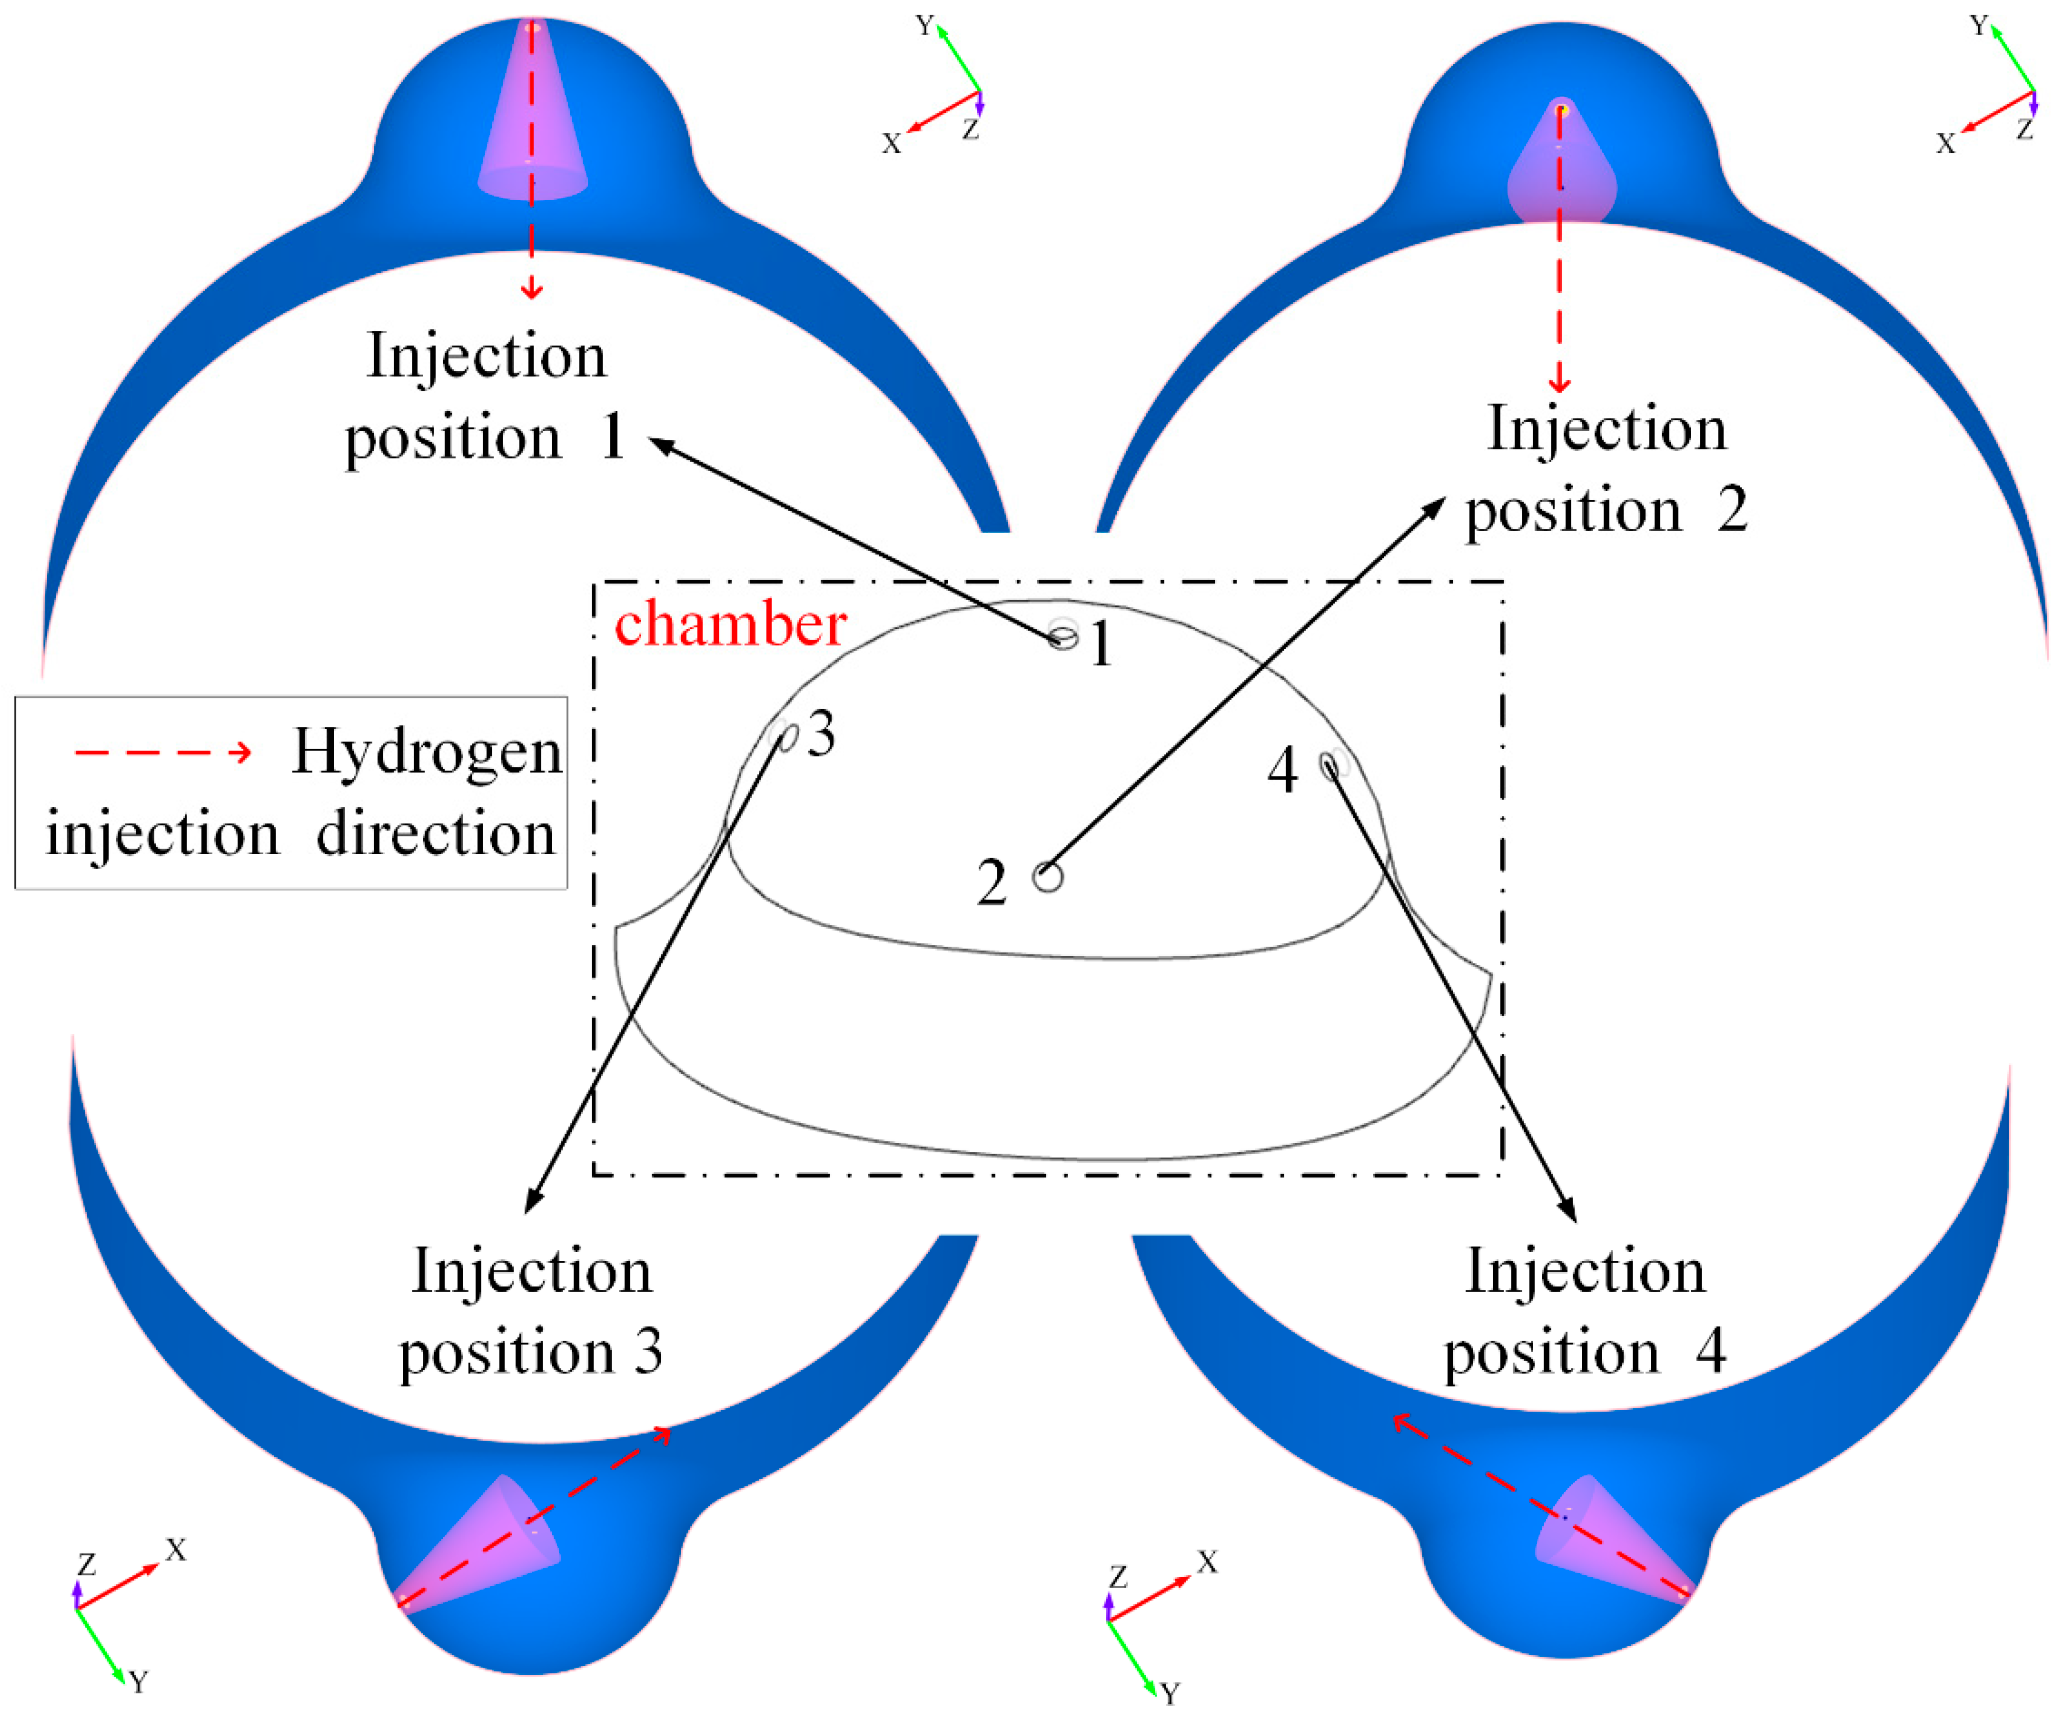
The hydrogen is injected into the combustion chamber using DI. Namely, the hydrogen nozzle is perforated at a specific location in the engine block and the hydrogen is injected directly into the combustion chamber through the nozzle. The injection pressure is set to 0.5 MPa, the injection timing is 70 °CA BTDC, the injection pulse width is 3.5 °CA, and the hydrogen energy fraction is controlled to 3%. The specific parameters are shown in Table 3. Moreover, three nozzles are installed in three combustion chambers, respectively, and the nozzle diameter is 1 mm. In order to investigate the effect of different injection positions on the engine’s combustion performance, four nozzle positions are set up for comparison. Figure 3 shows these four positions at the top, bottom, left, and right of the 1/4 spherical combustion chamber. The injection direction is as shown by the red arrow, which is sprayed to the central ignition position of the spherical combustion chamber.

2.4. Model Validation

In order to ensure the accuracy of the calculation results and high computational efficiency, the model was verified for grid independence. Four basic combustion chamber grid sizes of 2, 3, 4, and 5 mm were set. The combustion simulation of pure gasoline was carried out with the parameters given in Table 2. Figure 4 shows the variation of the in-cylinder mean pressure versus crankshaft angle for different chamber grid sizes. As the grid accuracy increases, the difference between the calculated results for grids within 5 mm becomes smaller and smaller. This indicates that the grid independence is verified. To balance computational cost and high computational accuracy, a basic grid size of 3 mm with adaptive encryption is used for the numerical simulations in this paper.
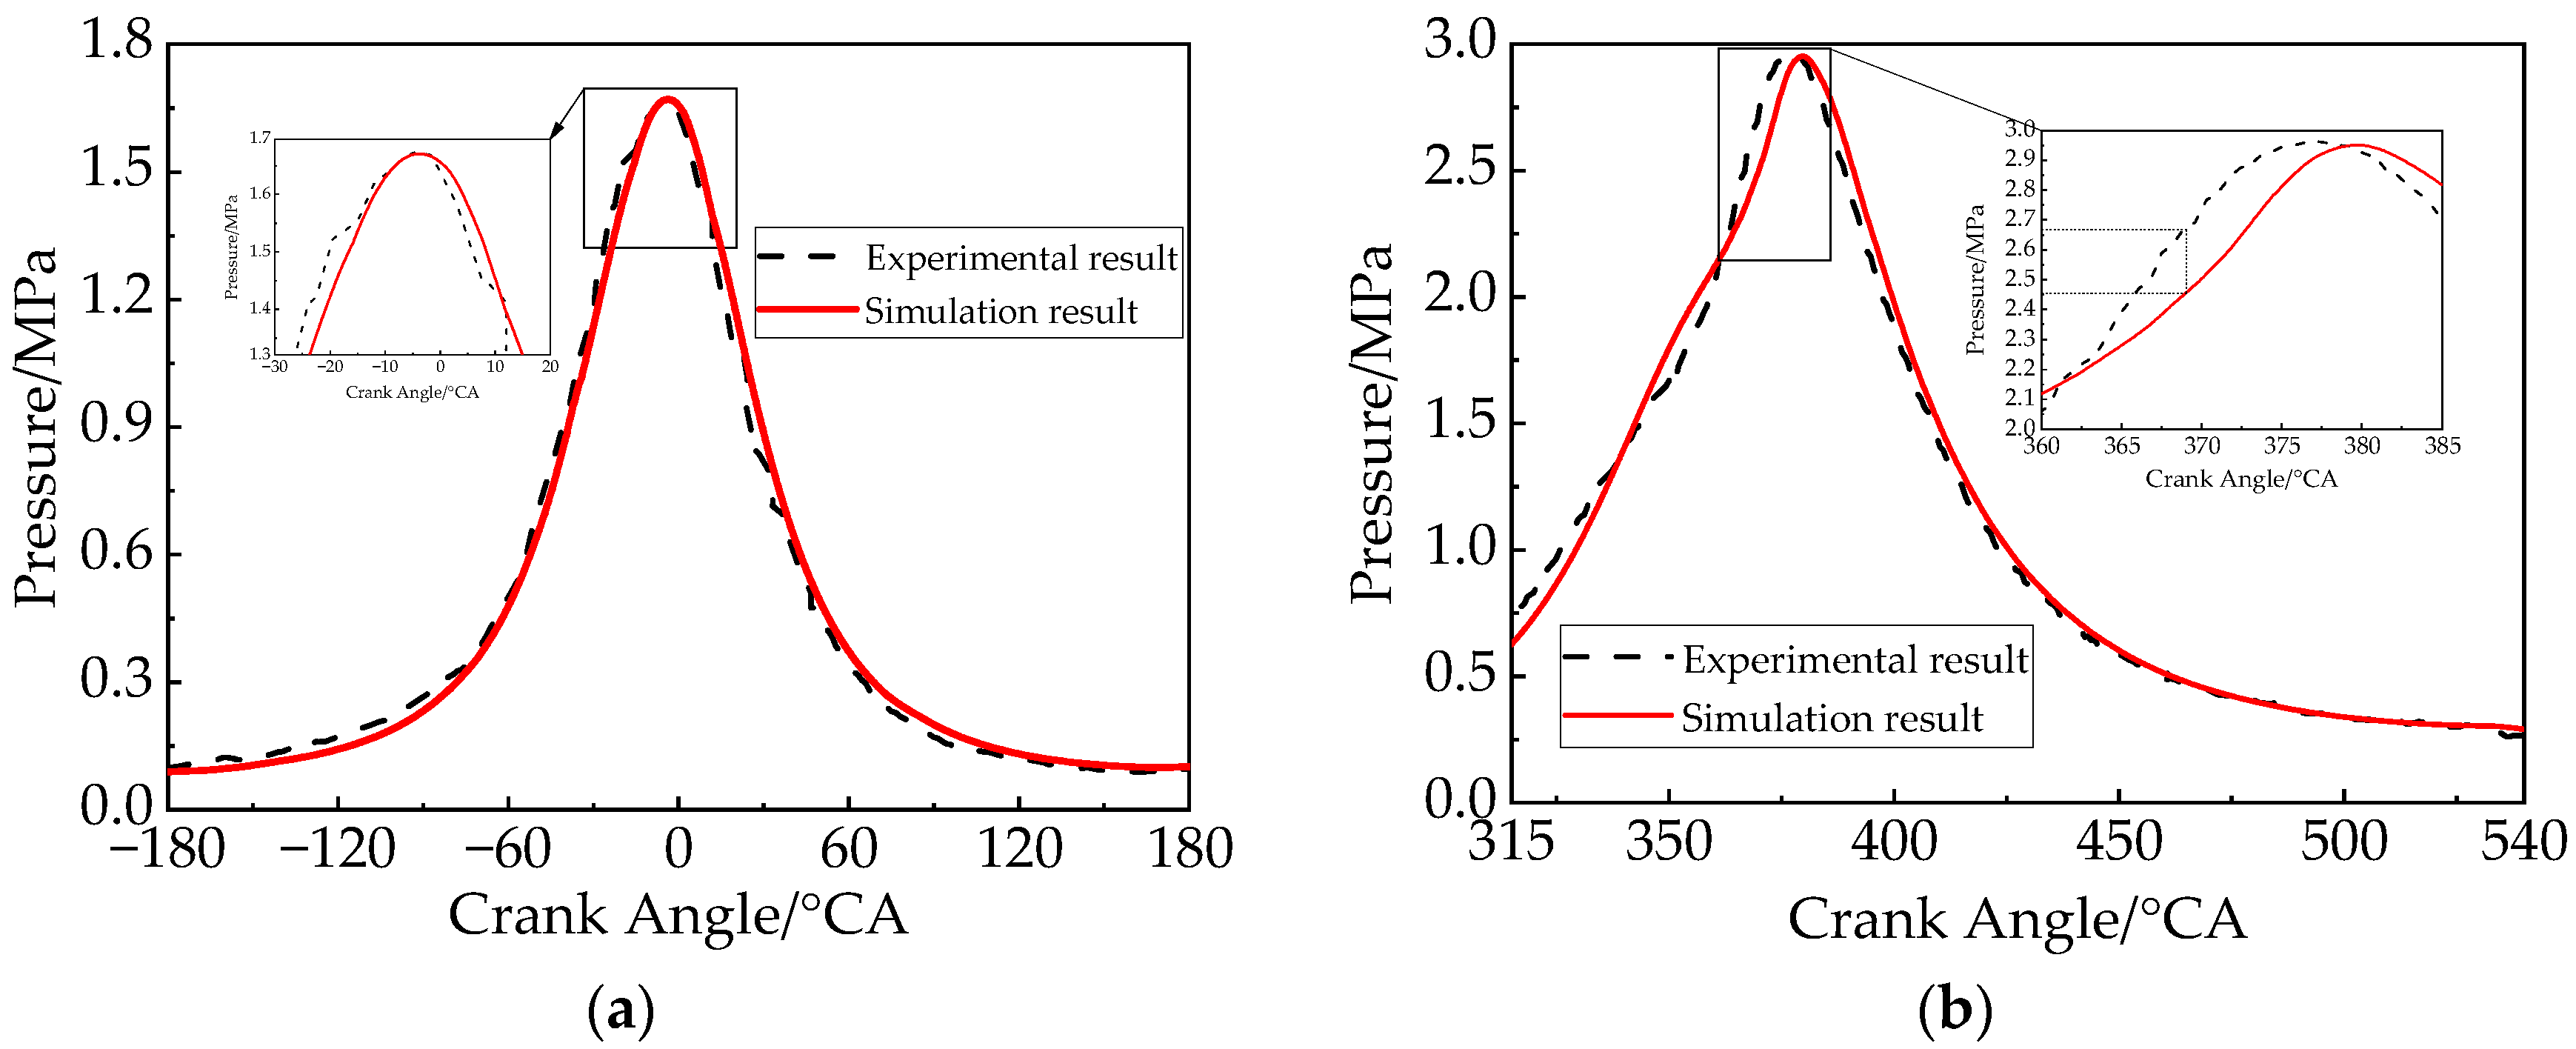
In order to verify the accuracy of the CFD model, the calculations were set up at two operating conditions of 10,000 RPM and 9000 RPM, respectively. At 10,000 RPM, only the three strokes of intake, compression, and exhaust are calculated. At 9000 RPM, the gasoline combustion is entirely calculated, which is the full load. This paper is based on the experiments carried out by the Liquid Piston company [12,13]. The initial conditions of the experiments are consistent with the simulation boundary conditions, as shown in Table 2. The experiments were carried out in the dynamometer test facility, and the engine was controlled by a National Instrument system. In addition, the dynamic pressure signals were measured by the Kistler 6052C piezoelectric sensor (Winterthur, Switzerland). The fuel was commercial ethanol-free gasoline.
Comparing the simulation with the Liquid Piston company experimental results [12,13], the comparison results of the in-cylinder mean pressure are shown in Figure 5. It was found that the pressure trend obtained from the simulation is consistent with the experimental results. At 10,000 RPM, the peak pressure is almost equal. At 9000 RPM, the maximum error of pressure is less than 8% and the error of peak pressure is less than 2%. To sum up, the numerical and experimental results are in good agreement so that the calculation of HB can be carried out.

3. Results and Discussion

3.1. Flow Field Distribution and Mixture Formation

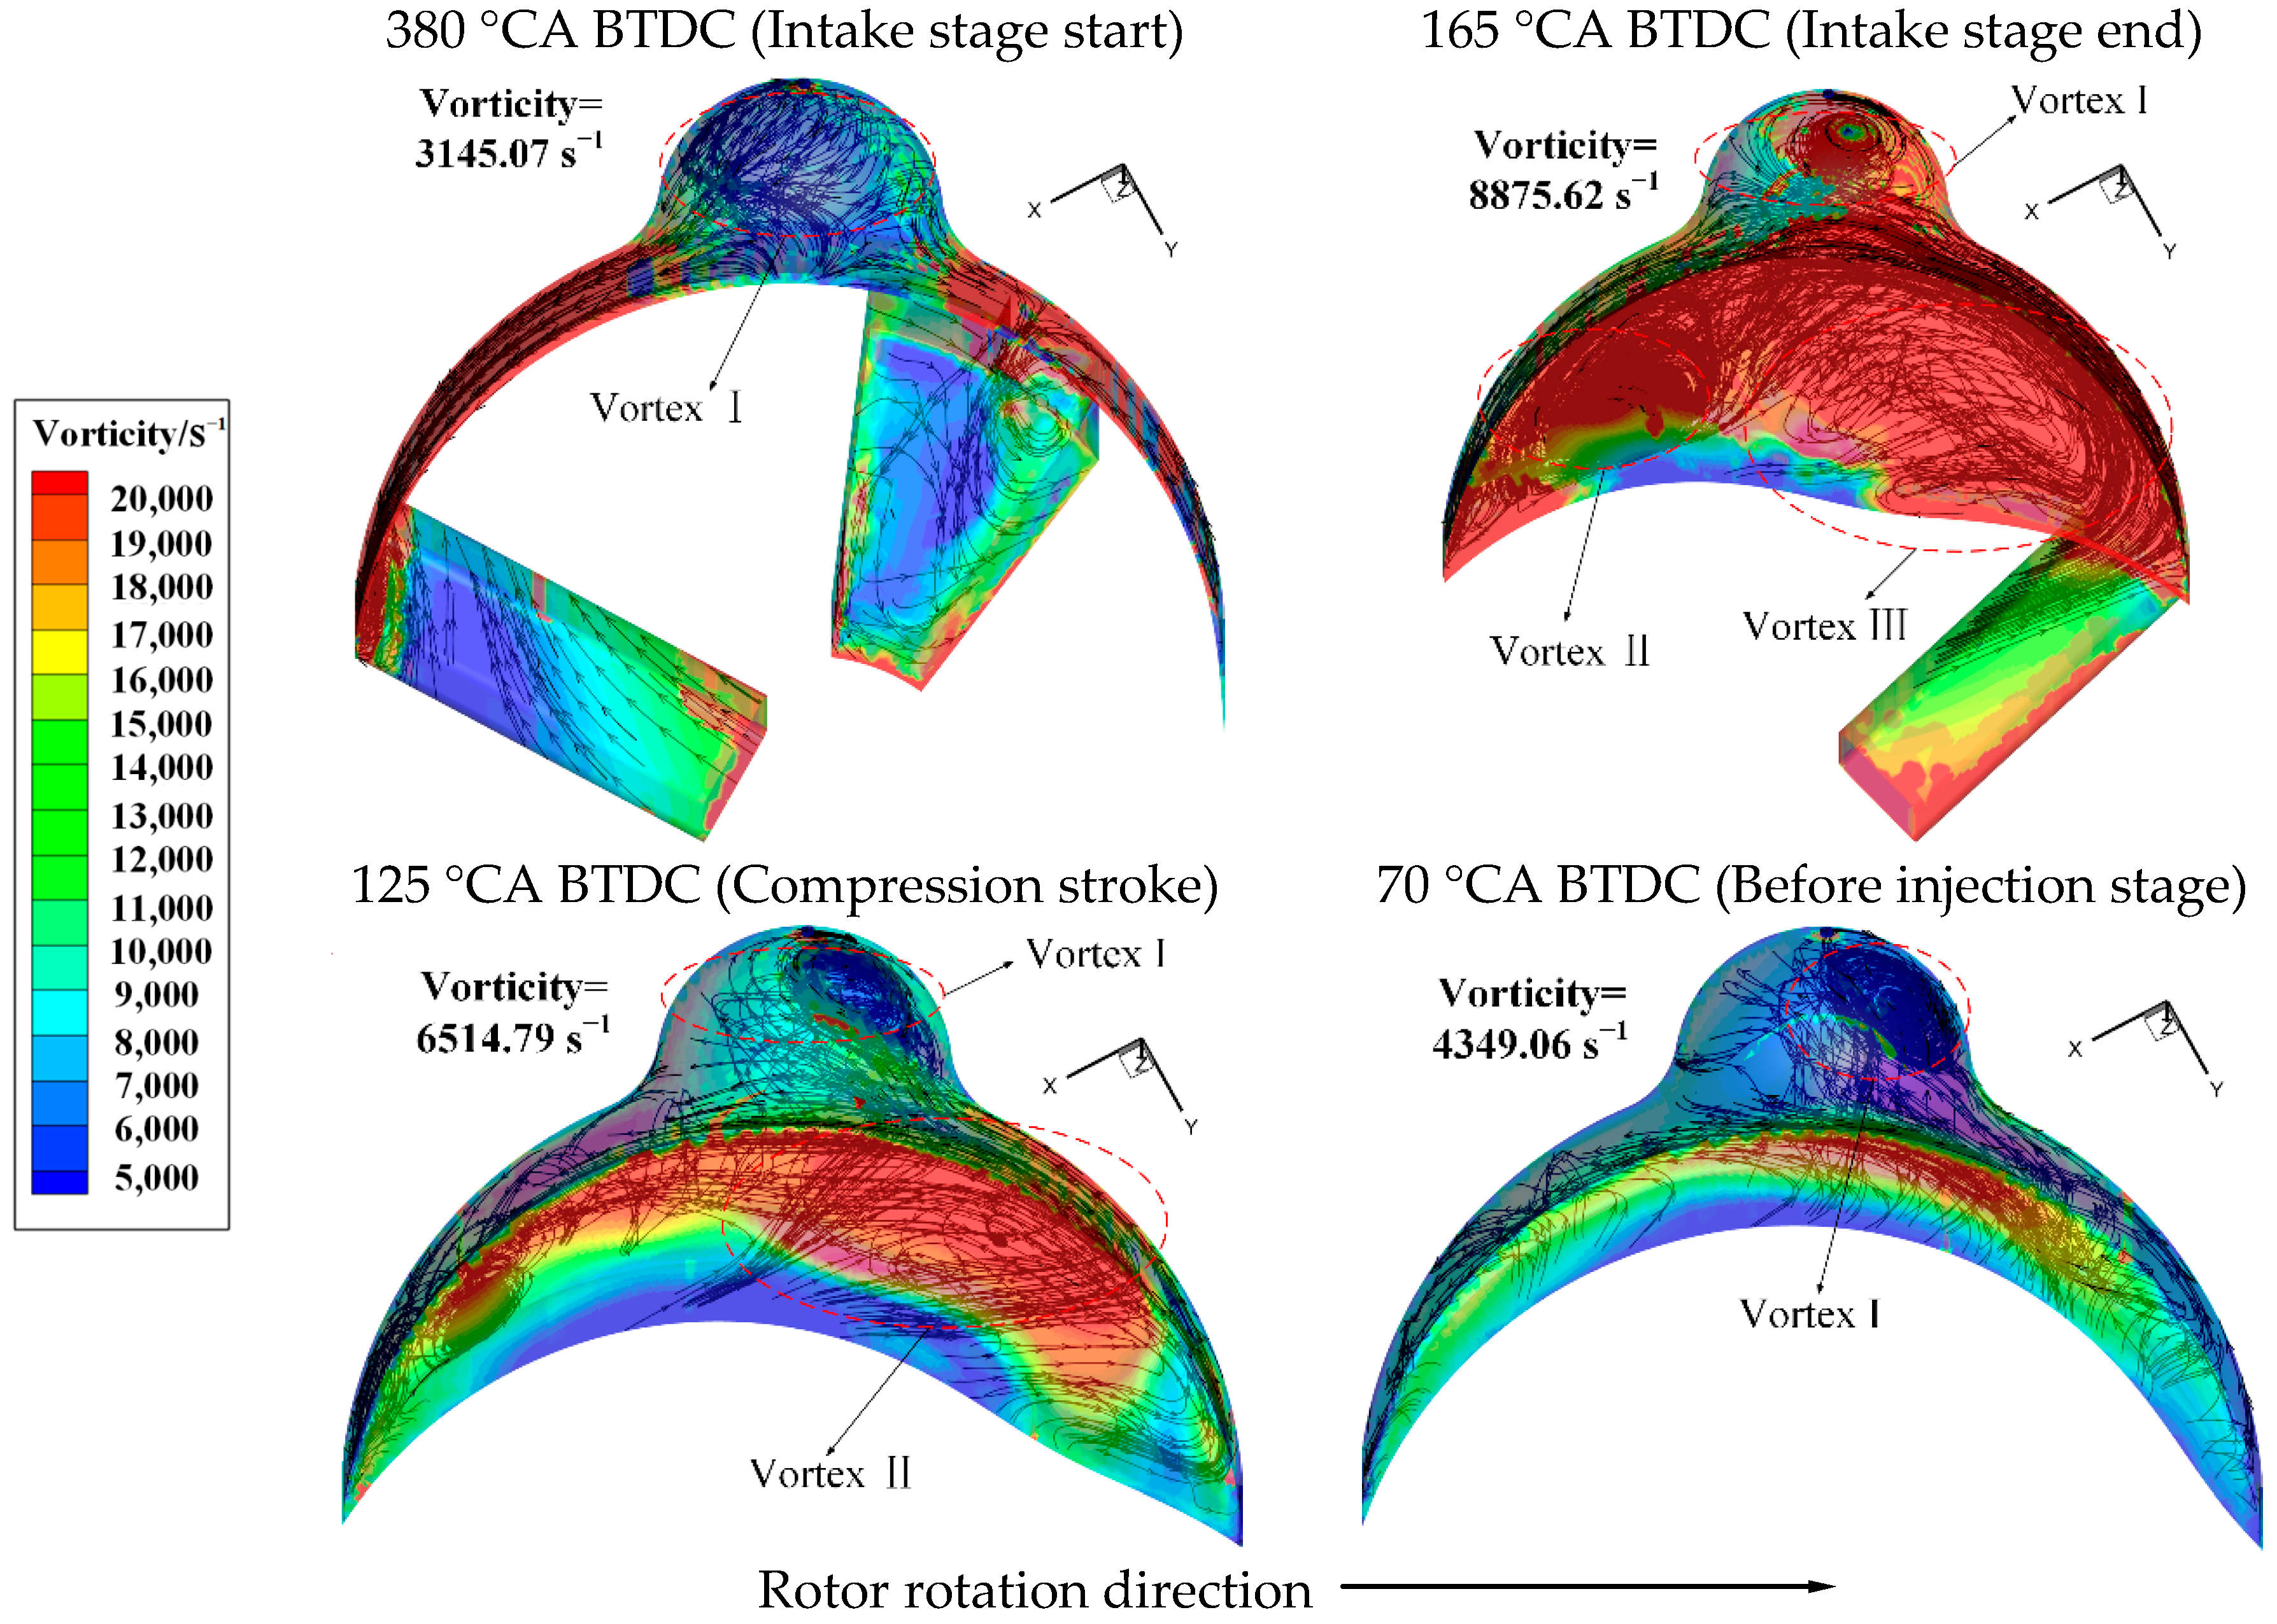
The distribution of the hydrogen–gasoline mixture in the combustion chamber determines the engine’s combustion performance and the injection of hydrogen under different injection positions has significant differences in the formation of the mixture. It is important to study the in-cylinder flow field motion and the formation of the mixture for the subsequent combustion process. Since there is no significant difference in the flow field before hydrogen injection, it is divided into two parts for flow-field analysis before and after injection. Figure 6 shows the vorticity and flow distribution from the beginning of the intake stage to before the hydrogen injection at position 1.
At the initial moment of intake (380 °CA BTDC), the intake airflow flows through the intake port into the combustion chamber through a narrow slit on the left side of the combustion chamber. Since the intake and exhaust processes exist simultaneously at this moment, most of the airflow still flows from the spherical combustion chamber to both sides and the airflow in the spherical combustion chamber is more turbulent, forming vortex I. At the end of the intake moment (165 °CA BTDC), the airflow flows into the whole combustion chamber along the intake port, forming three large vortexes I, II, and III. They are located at the top of the spherical combustion chamber and on the left and right sides of the combustion chamber. Vortex III on the right side is close to the intake port and occupies the largest area. At this moment, the in-cylinder vorticity rises significantly and the mean vorticity reaches 8875.62 s−1. In the middle of the compression stroke (125 °CA BTDC), as the volume of the chamber continues to compress, the above-mentioned vortexes II and III are continuously squeezed to the right side of the chamber and integrated into a single vortex II. It has high vorticity in the area where vortex II is located. Meanwhile, the mean in-cylinder vorticity is reduced to 6514.79 s−1. At the moment of hydrogen injection (70 °CA BTDC), vortex II was dissipated; only vortex I was located in the spherical combustion chamber and the mean vorticity is further reduced to 4349.06 s−1. Furthermore, these in-cylinder flow fields and vortex I will affect the hydrogen injection. The distribution of in-cylinder flow lines and the morphology of vortexes will differ greatly under different nozzle positions and injection directions, which will change the direction of hydrogen movement and affect the mixture formation process.
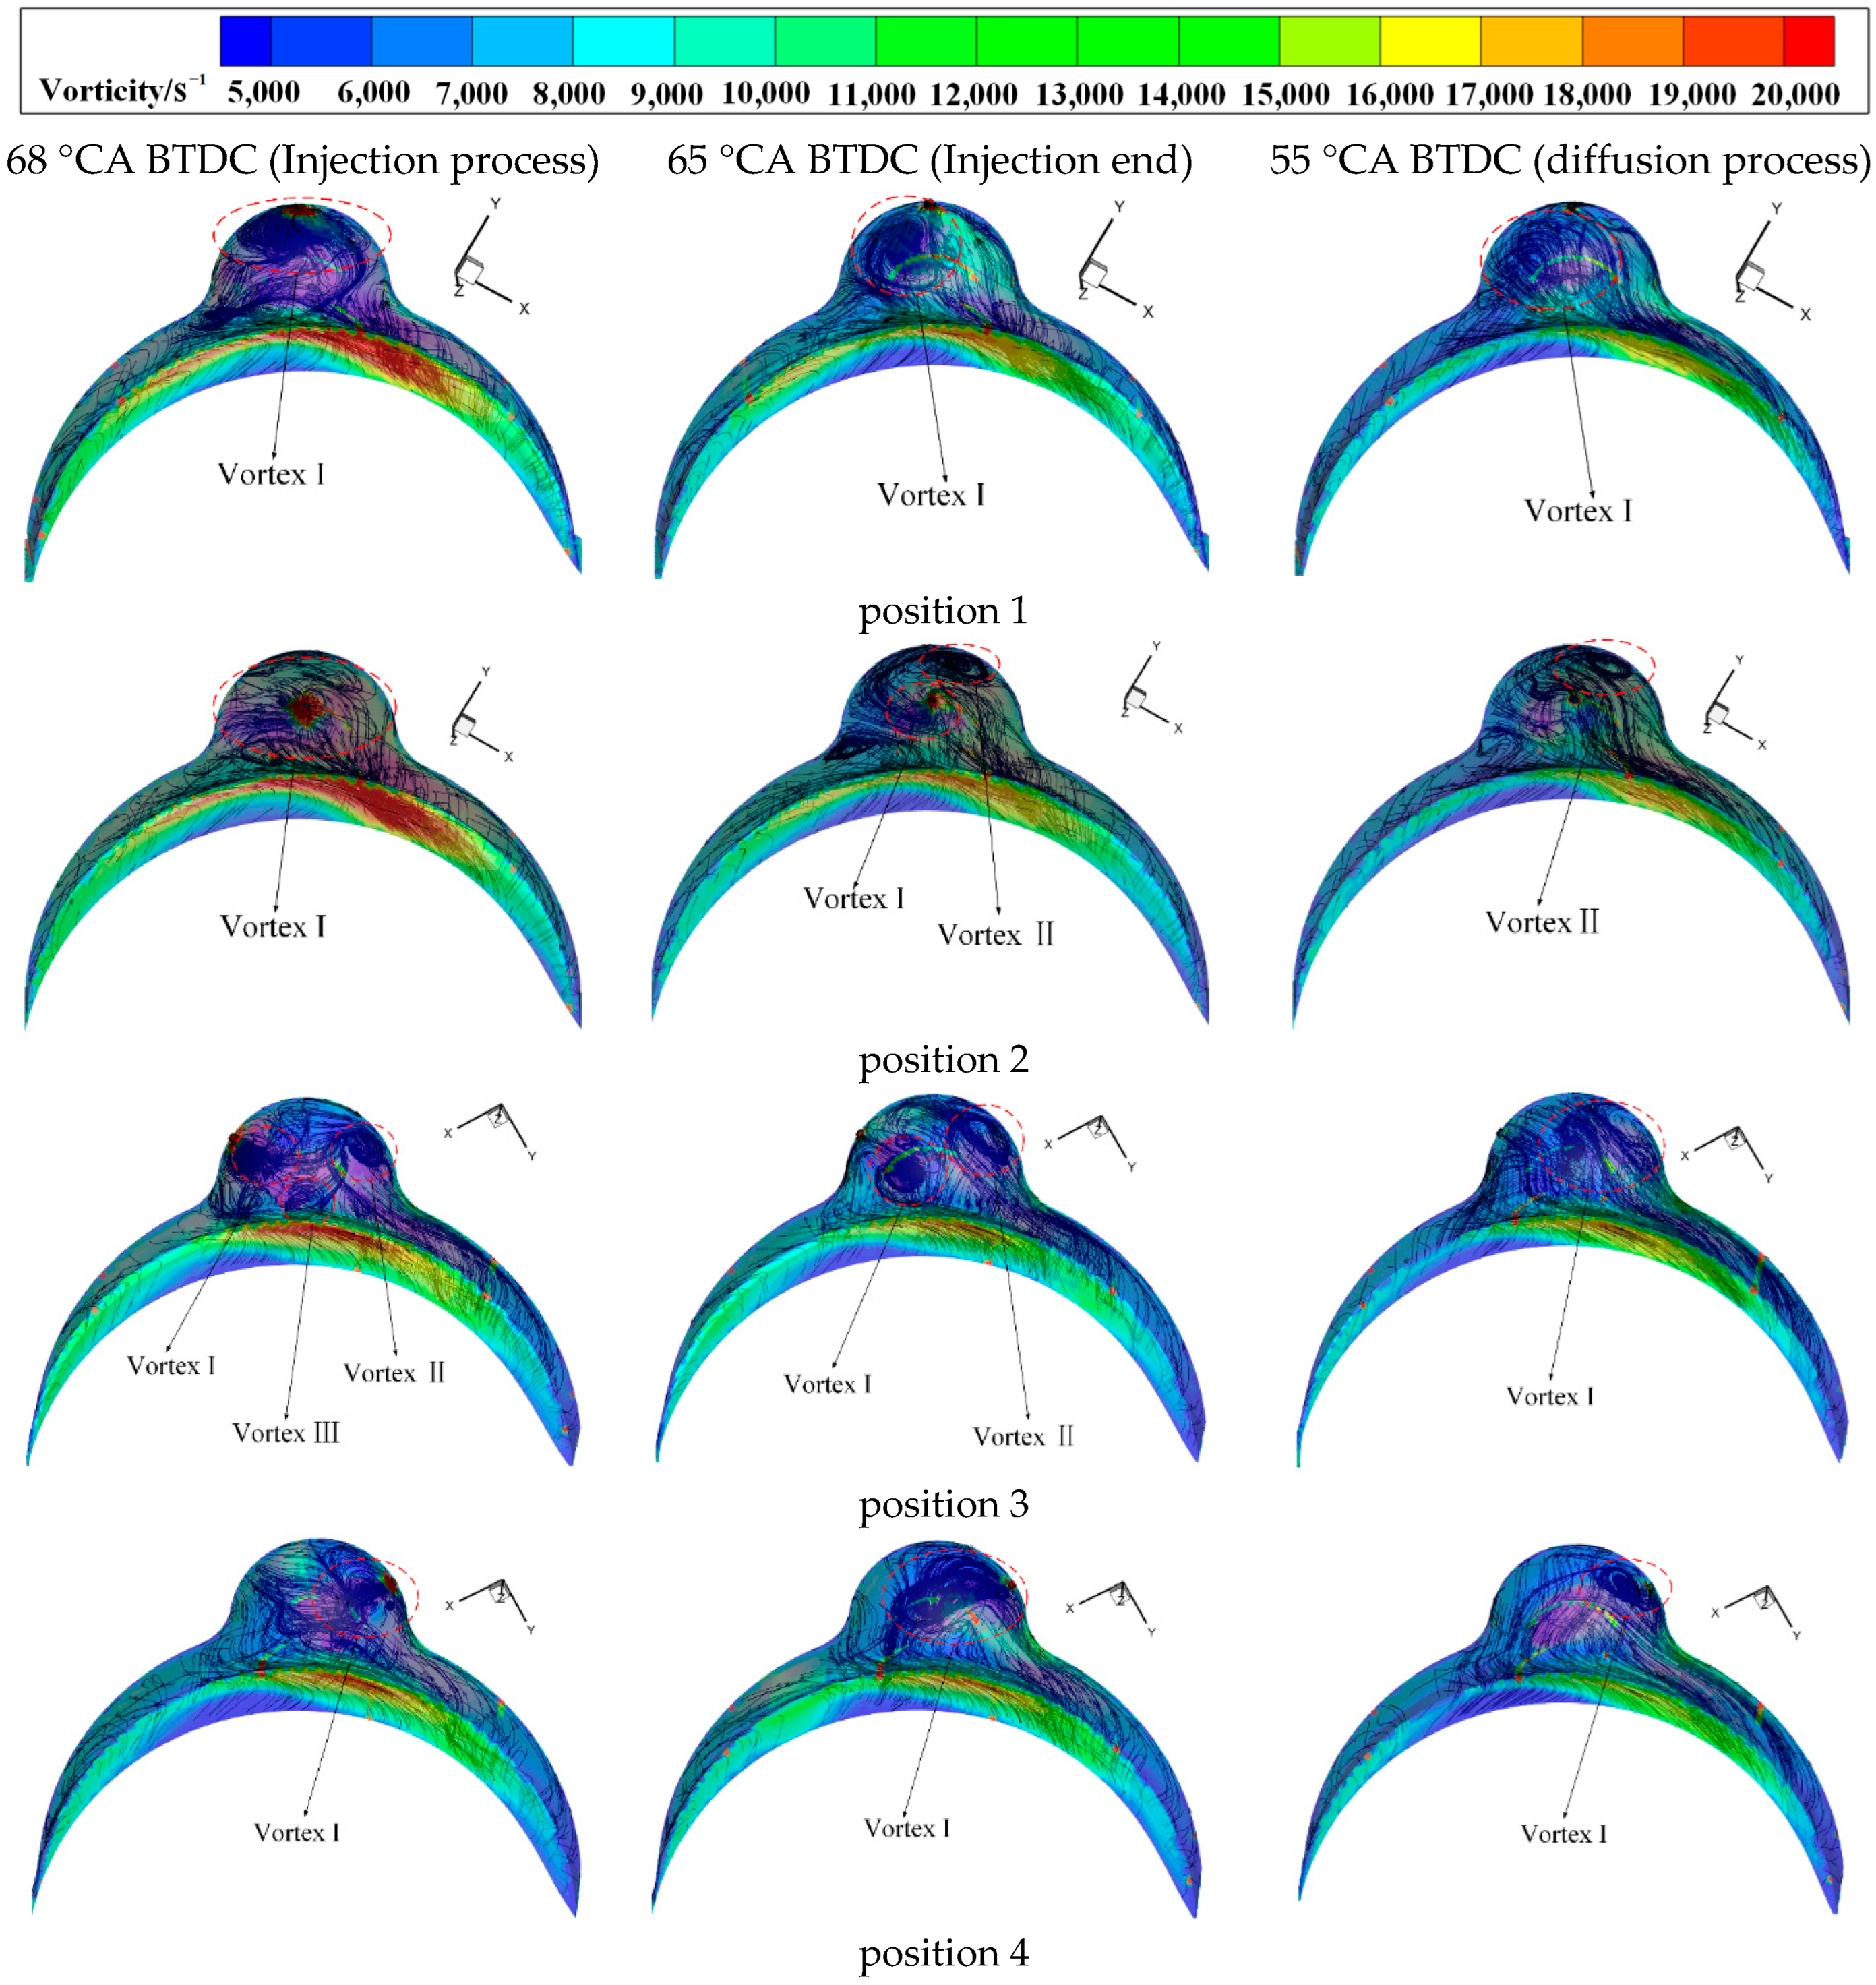
In order to investigate the variability of the in-cylinder flow field at different injection positions, Figure 7 shows the variability of the in-cylinder flow field and vorticity during the injection process (68 °CA BTDC), at the end of the injection (65 °CA BTDC), and during the hydrogen diffusion process (55 °CA BTDC).
At position 1, the hydrogen injection causes the flow to converge first at the injection position, forming vortex I, where the vorticity is high. Then, vortex I starts to spread to the left side of the combustion chamber. Meanwhile, the radius of the vortex increases but the vorticity decreases. With the continuous compression of the combustion chamber on the airflow, vortex I gradually dissipates and the degree of convergence decreases.
At position 2, the hydrogen is injected from the front to the rear of the combustion chamber, which causes the airflow to form vortex I near the nozzle first. The hydrogen injection makes the vorticity at the nozzle and the rear of the combustion chamber very high. Subsequently, vortex I diffuses into two vortexes. Furthermore, the main vortex I still diffuses in the direction of the nozzle and the split secondary vortex II converges at the right side of the top of the combustion chamber. At the moment of 55 °CA BTDC, vortex I has broken up and the radius and vorticity of vortex cluster II are significantly reduced.
At position 3, the hydrogen is injected from the left side of the combustion chamber, and the direction of injection is the same as the rotation direction of the engine. The hydrogen injection rapidly changes the distribution of the in-cylinder flow field and impacts the original vortexes. This makes a flow field distribution in the cylinder, which is dominated by the left vortex I and the right vortex II, supplemented by the small vortex III at the lower of the combustion chamber. Then, the small vortex III is crushed and broken and vortex I is moved to the right. At the moment of 55 °CA BTDC, vortex I and vortex II start to contact and gradually merge into a whole. Finally, they form a large new vortex I.
At position 4, the direction of injection is opposite to the rotation direction of the engine. Hydrogen injection from the right side makes the in-cylinder flow line very turbulent and forms vortex I at the nozzle. Next, vortex I continues to spread to the left side, showing a long strip. Under the continuous compression of the combustion chamber, vortex I gradually dissipates and its radius decreases rapidly, which only exists on the right side of the top of the combustion chamber.
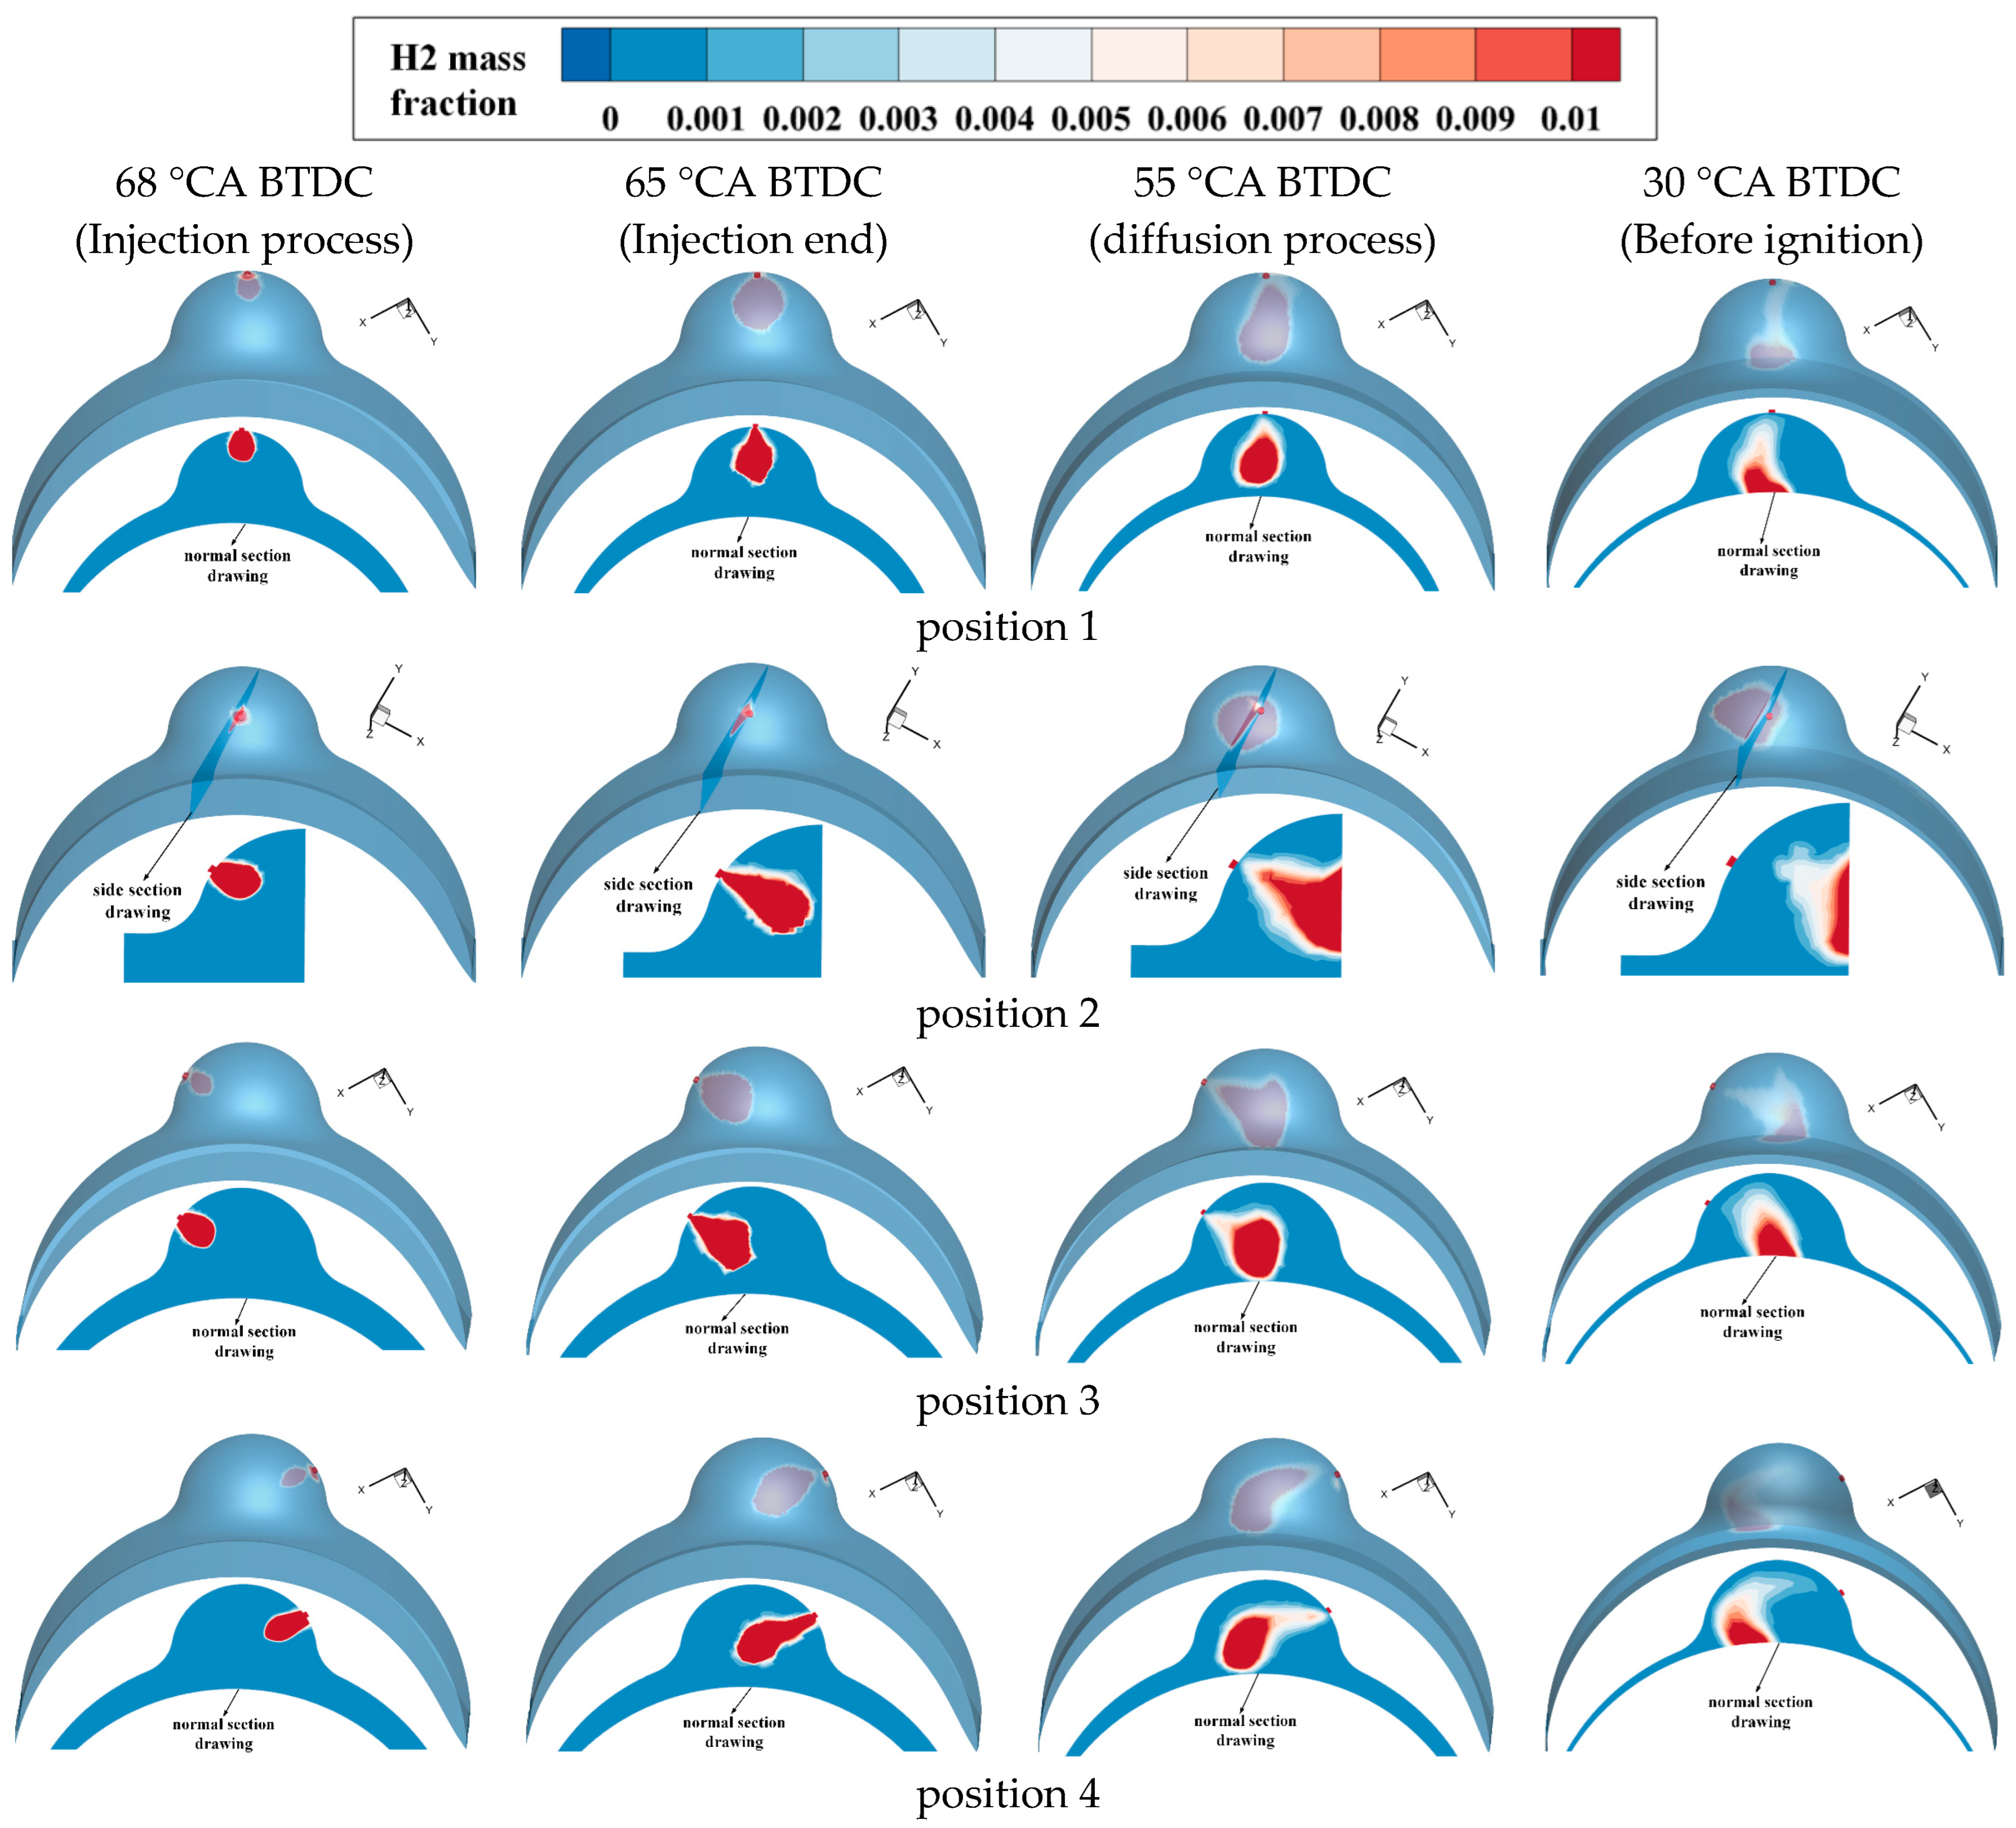
The flow of these mixtures and the change of vortexes will in turn affect the subsequent hydrogen flow, which causes the difference in in-cylinder hydrogen distribution before ignition. Figure 8 shows the hydrogen distribution in four stages of the hydrogen injection process (68 °CA BTDC), end of injection stage (65 °CA BTDC), hydrogen diffusion process (55 °CA BTDC), and ignition moment (30 °CA BTDC) for different injection positions, and also gives a section drawing of the combustion chamber interior.
Combined with Figure 8, at position 1, the hydrogen is continuously diffused downward from the upper nozzle. Meanwhile, the area occupied by hydrogen is constantly expanded and the injection is completed at the moment of 65 °CA BTDC. Subsequently, hydrogen is continuously mixed with air and gas under the effect of streamlines and vortexes. Before ignition, the hydrogen distribution thick area is mainly located in the middle of the spherical combustion chamber and it is most distributed at the bottom of the chamber contacting with the rotor. In position 2, hydrogen is injected from the front of the combustion chamber to the back, showing a side section drawing of the chamber inside. It is found that the hydrogen spreads quickly to the back of the combustion chamber and spreads rapidly at the back of the chamber. That is because the front-to-back width of the combustion chamber is smaller than the top-to-bottom length. Before ignition, the hydrogen is distributed in the area where the combustion chamber is in contact with the end cap. In positions 3 and 4, hydrogen is injected from the left and right sides to the middle of the combustion chamber, respectively. Due to the vortexes’ influence, the hydrogen of position 4 has a thin strip shape. Since the injection direction is opposite to the engine running direction, it tends to turn back to the right after the hydrogen is injected to the left of the chamber. Before ignition, the distribution area of hydrogen in position 3 is not much different from that of position 1. The thick distribution area of position 4 is also located at the bottom of the combustion chamber, but it is more inclined to the left side. It is found that the distribution of hydrogen before ignition is basically located at the bottom of the combustion chamber at positions 1, 3 and 4. However, it is located at the back of the combustion chamber in position 2, and the distribution area is larger than the rest of the positions. This indicates that the hydrogen is best mixed with the rest of the gases in position 2. Furthermore, it is mostly distributed in the ignition area, which is beneficial to the next combustion process.

3.2. Combustion Process Analysis

3.2.1. In-Cylinder Flame Propagation

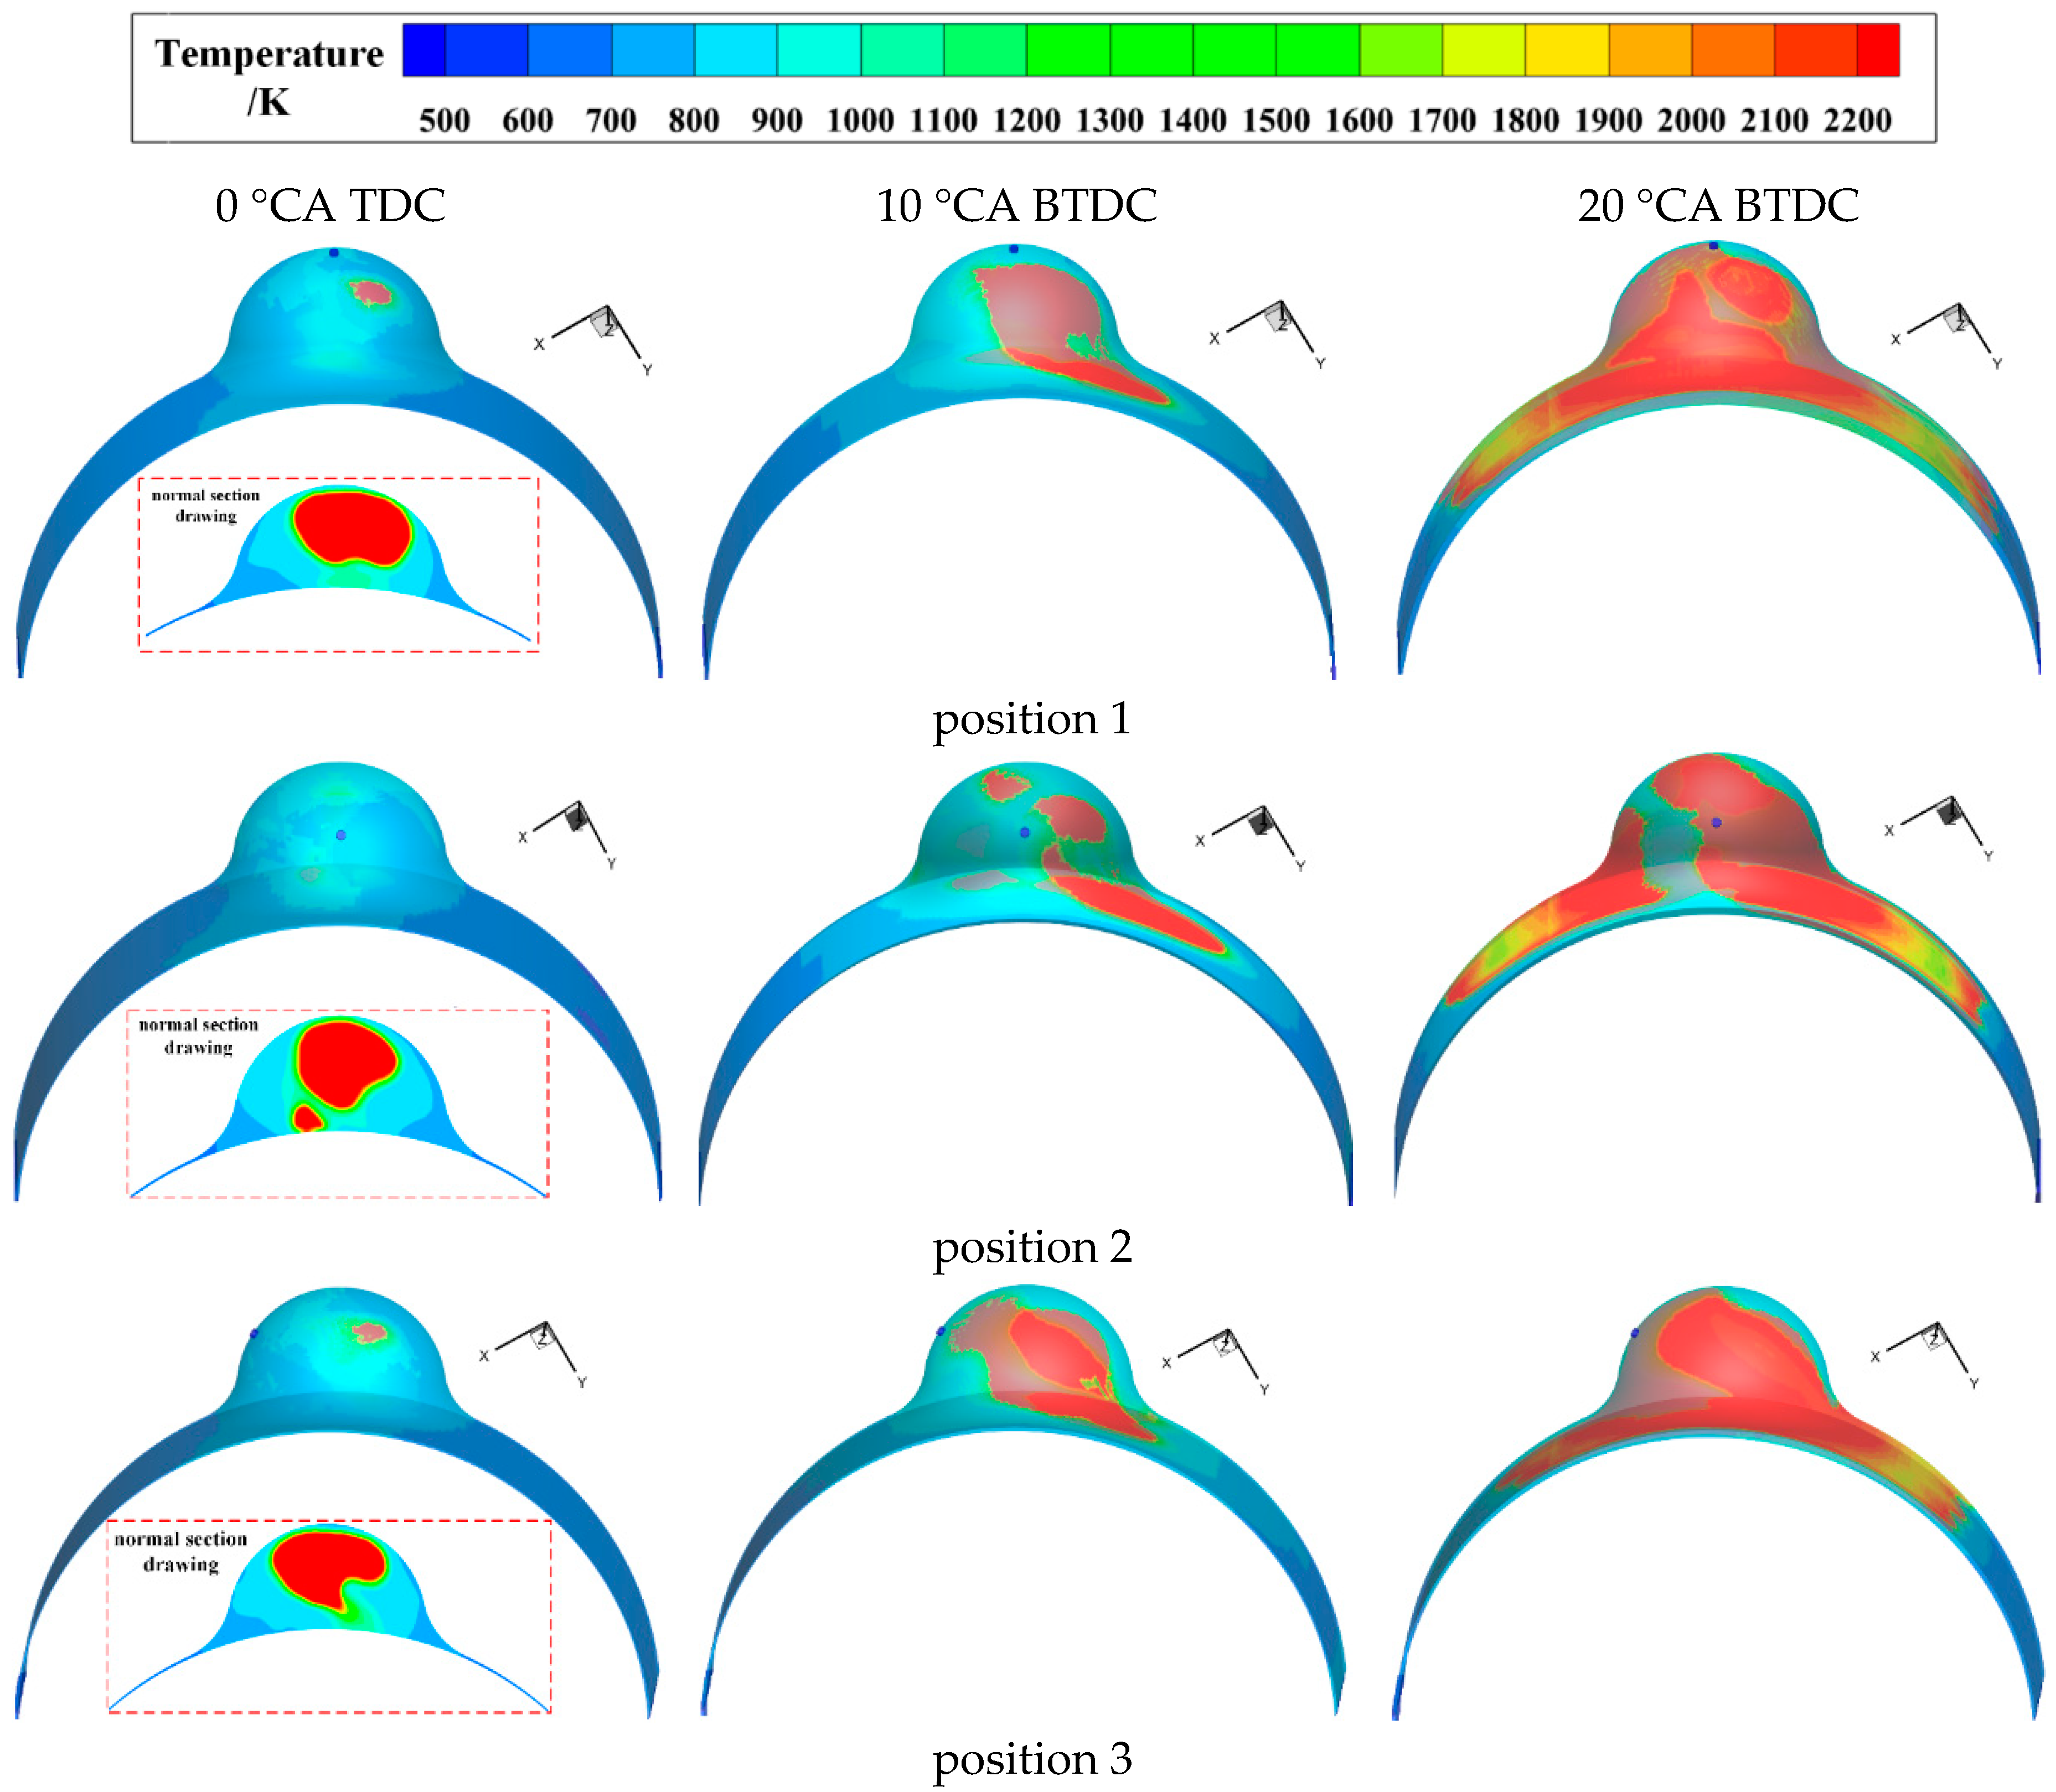
In order to compare the differences produced by the hydrogen injection under different positions in the combustion phase, Figure 9 presents the comparison of the in-cylinder temperature clouds at three moments of the combustion phase. According to the temperature field distribution, the larger temperature gradient can be regarded as the flame front surface. The in-cylinder combustion can be more clearly understood by observing the propagation process of the flame front surface.
At 0 °CA TDC, this is the beginning moment of the obvious combustion period. The flame front surface at four positions propagates inside the combustion chamber, thus showing a normal section drawing of the in-cylinder temperature. At positions 1 and 3, the flame has propagated to the outer wall of the combustion chamber’s right; at position 2, the flame propagates to the lower part of the combustion chamber’s rear; at position 4, the flame is all inside the combustion chamber. Combined with the section drawing temperature, the high-temperature distribution area under position 4 is the smallest at this moment and its combustion rate is slower. The combustion area is larger under position 2, which is located in the middle and bottom parts of the combustion chamber, respectively.
At 10 °CA ATDC, this is the middle moment of the obvious combustion period. The difference in the flame front surface under the four positions is large. At position 1, the flame front surface propagates to the right of the combustion chamber’s curved wall and the bottom of the combustion chamber. This indicates that the combustion is mainly in the lower and middle parts of the combustion chamber’s right. At position 2, the flame spreads widely. The flame front surface is distributed on the top and right, the bottom and rear of the combustion chamber. Meanwhile, a part of the flame has begun to spread to the right slit. Although the area shown by the flame front surface on the wall of the combustion chamber is not very large, it can be seen that the inside combustion is very intense. At position 3, the flame front surface has propagated to the curved wall, the bottom, and the rear of the combustion chamber. It shows that the flame area is more concentrated, mainly located in the middle of the combustion chamber and the combustion range is larger. At position 4, the combustion area is mainly concentrated in the lower of the combustion chamber. Furthermore, the flame front surface spread to the curved wall surface and the bottom of the combustion chamber. However, the distribution is less, indicating that the combustion at position 4 is relatively less intense. Therefore, the combustion areas at this moment are all located in the spherical combustion chamber and are the largest at position 2 and the smallest at position 4.
At 20 °CA ATDC, this is the end moment of the obvious combustion period. The temperature cloud distribution tends to be the same at four positions. Specifically, the flame is mainly distributed in the spherical combustion chamber and the slit on both sides. At this time, the combustion rate has slowed and the main difference is shown in the combustion on both sides of the slit. It was found that the slit burning area at positions 1 and 2 is larger than that at positions 3 and 4. At position 3, the burning area on the left side of the slit is smaller than the right side; at position 4, the burning area on the right side of the slit is smaller than the left side. Since hydrogen is injected from different positions, the hydrogen distribution between the left and right sides is not uniform.
On the whole, after hydrogen injection into the cylinder, the basic development course of the flame is as follows. Firstly, XRE ignites in the center of the combustion chamber to form a stable flame kernel. Then, the combustion area and combustion speed are different in the cylinder according to the distribution of hydrogen. At different positions, the combustion area is the larger and the combustion speed is the fastest at position 2, followed by that at position 3. Meanwhile, the combustion area is significantly smaller and has the slowest burning speed at position 4. It was also found that the flame does not completely propagate the slits on both sides of the combustion chamber. However, the problem of incomplete combustion of the slit on both sides can be improved by changing the injection strategy of hydrogen.

3.2.2. Overall Combustion Performance of Engine

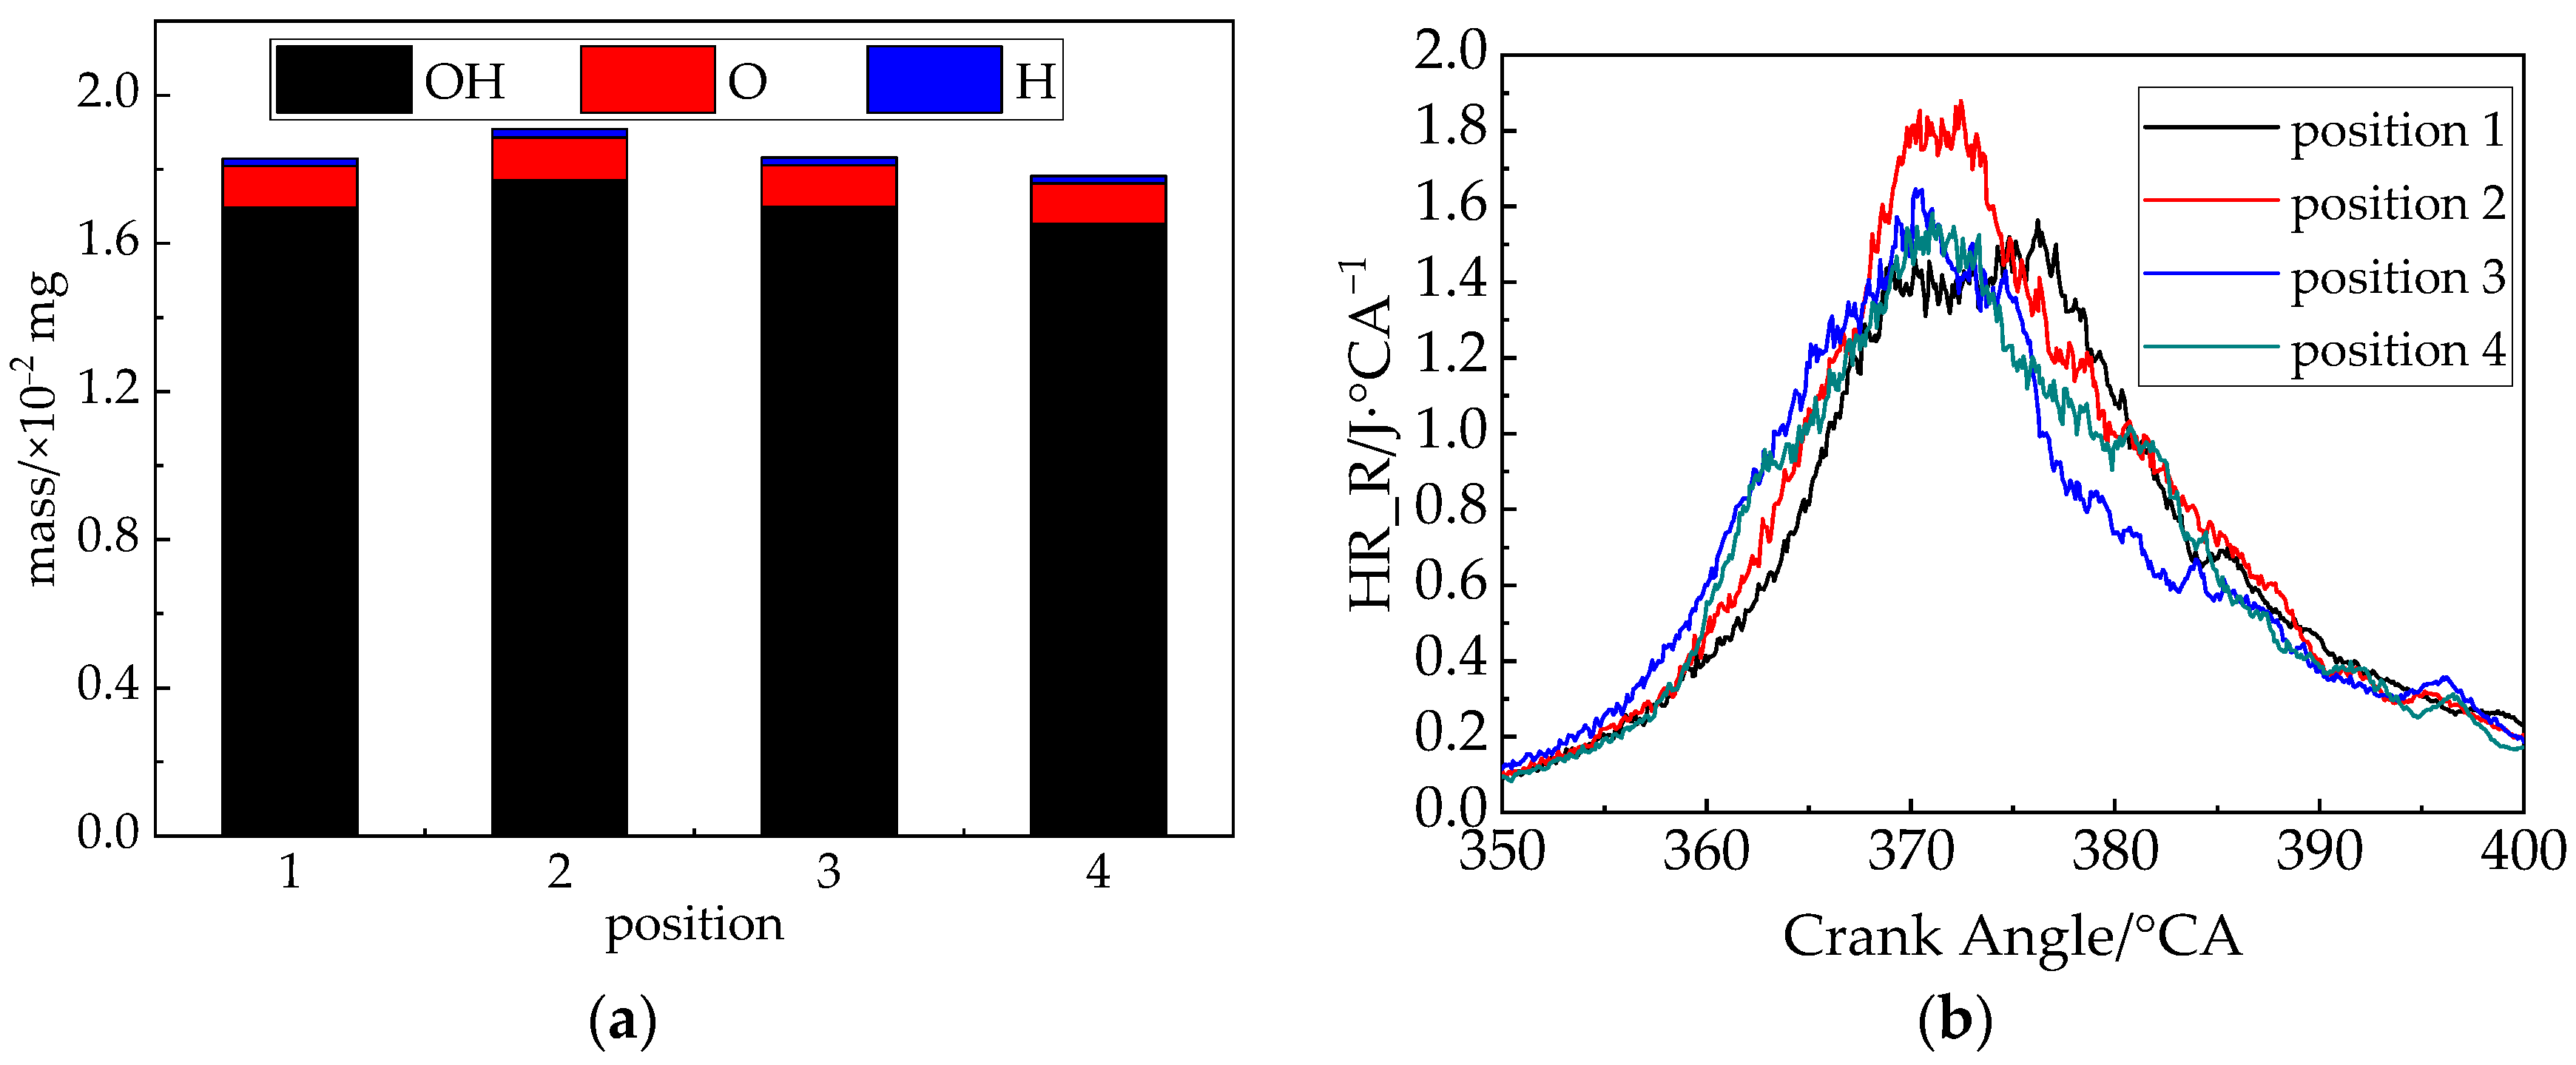
OH, H and O radicals are essential intermediates in the combustion process and play an important role and they can characterize the intensity of chemical reactions. In particular, the blending of hydrogen will improve the reaction rate of the OH + H2⇔H2O + H branched chain and accelerate the gasoline combustion [46]. The sum of the peak mass of OH, O and H radicals at different positions is shown in Figure 10a. The peak mass is the largest at 1.91 × 10⁻² mg at position 2 and the smallest at 1.78 × 10⁻² mg at position 4. It can be found that the different positions produce differences in the generation rate of OH radicals due to the distribution of hydrogen during the combustion process. In return, the change of radicals will directly affect the in-cylinder combustion rate. Figure 10b shows the variation curve of the in-cylinder HRR with the crank angle. It can be seen that the HRR shows a trend of increasing and then decreasing with the increase in crank angle. In the obvious combustion period of 5 °CA BTDC–20 °CA ATDC, the HRR reaches the highest value at different positions. The highest HRR of 1.88 J/°CA is found in position 2. At the same time, the time when the HRR maintains a high value is the longest at position 2, which indicates that the combustion duration is longer. In short, the variability of hydrogen injection leads to a difference in the reaction rate of the branched chains during the combustion process, which affects the HRR. Furthermore, the fastest chemical reaction and combustion rate are observed at position 2.
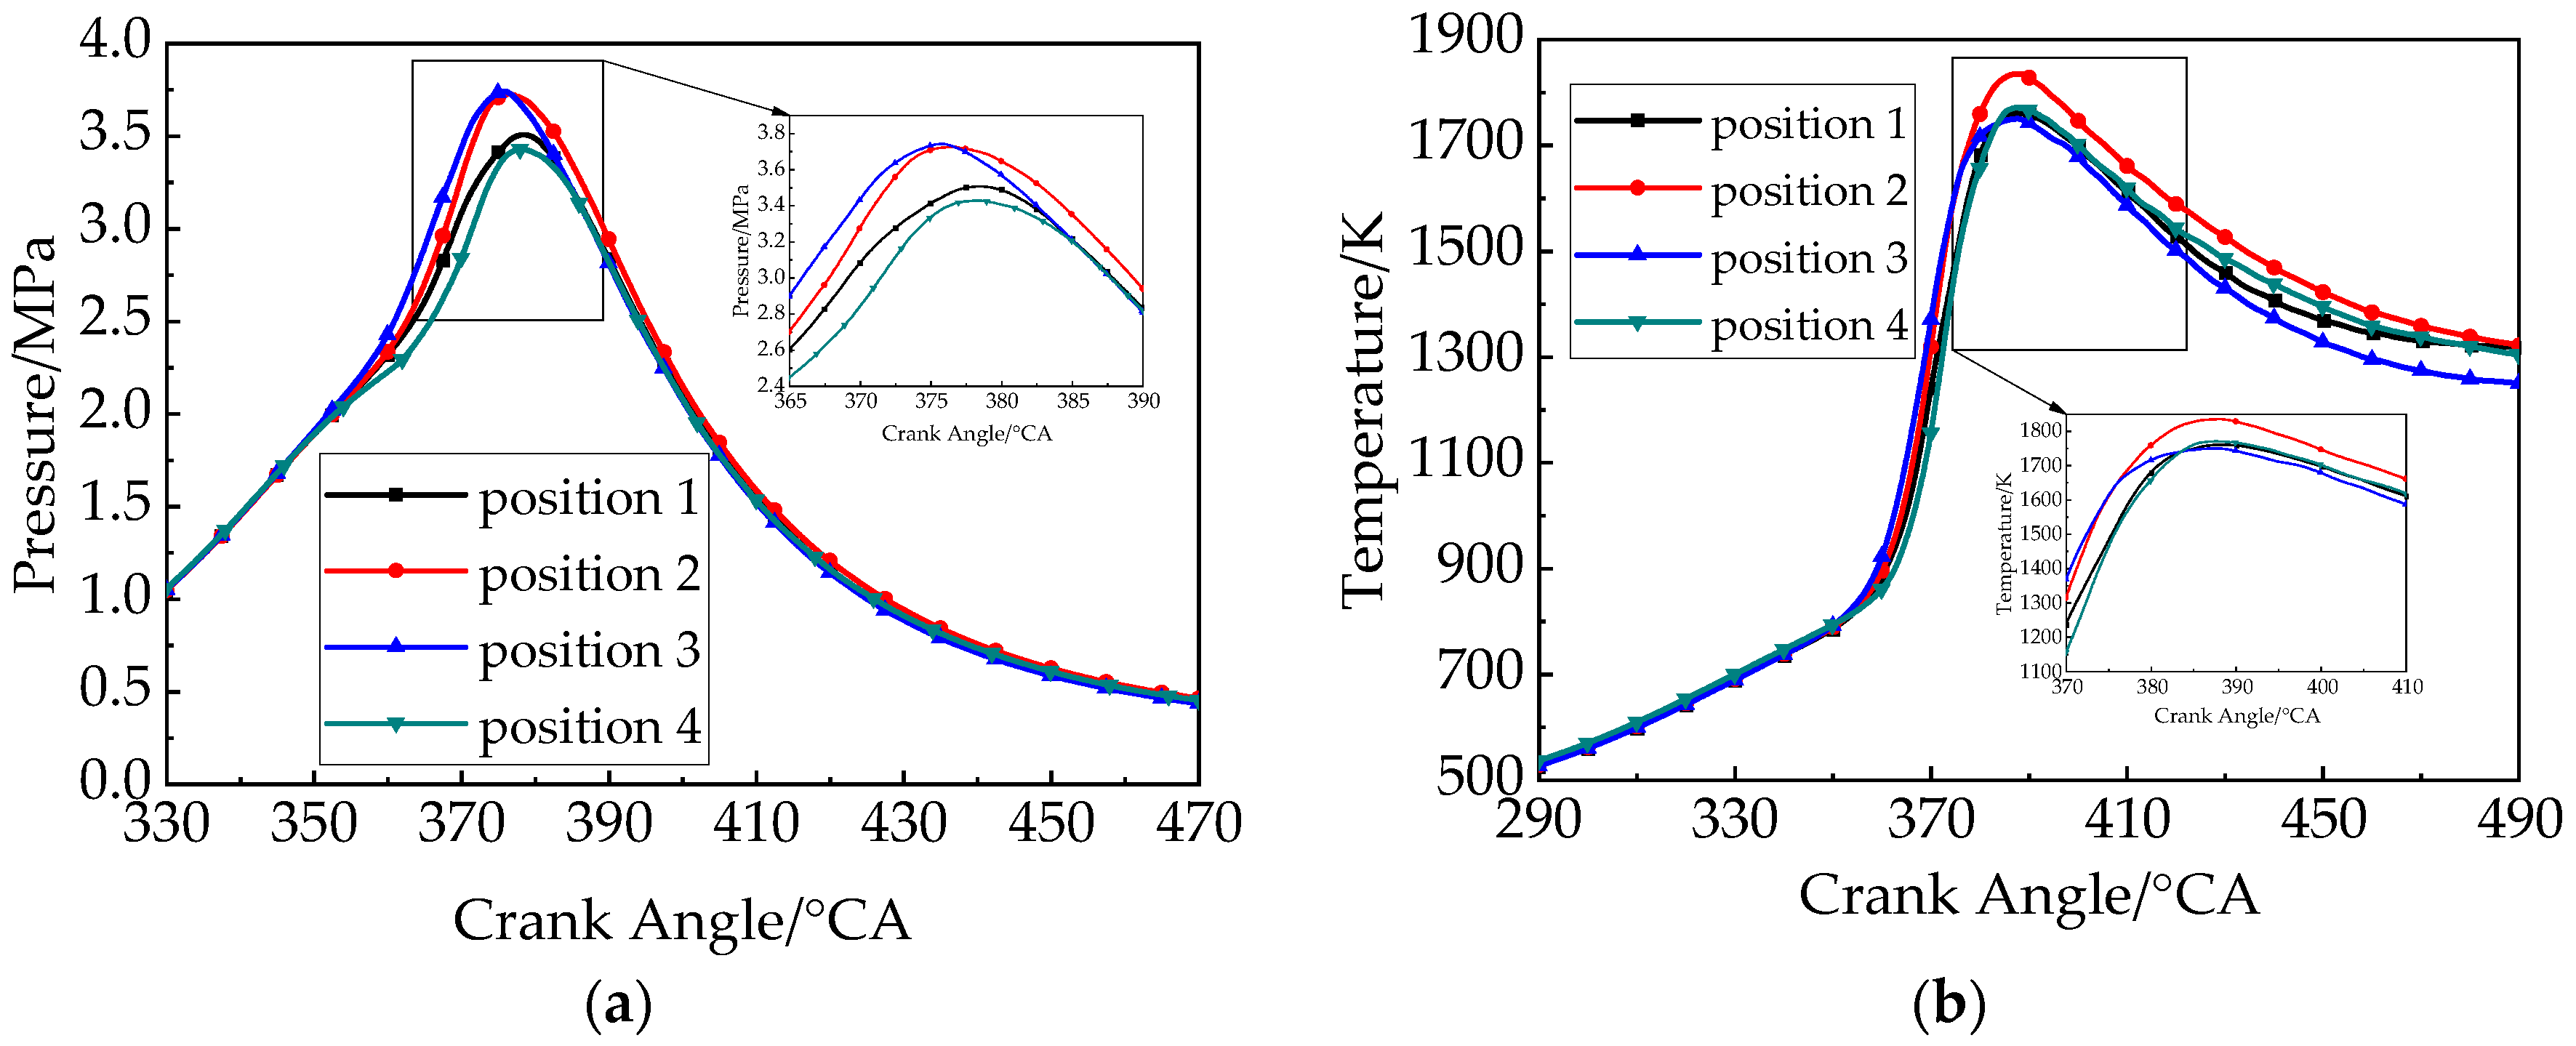
Figure 11 shows the change curves of in-cylinder mean pressure and temperature at different positions, respectively. It can be seen that the mean in-cylinder pressure and temperature show a trend of increasing first and then decreasing with the increase in crank angle. Furthermore, the pressure reaches the maximum value in the 10–20 °CA ATDC moment, and the temperature reaches the maximum value in the 20–30 °CA ATDC moment. At different positions, the pressure peak at position 3 is the largest at 3.74 MPa, followed by the pressure peak at position 2 is 3.73 MPa. At position 2, the temperature peak is the largest at 1835.16 K. At the same time, the angle corresponding to the pressure peak at positions 2 and 3 is also advanced. Compared with position 4, they are advanced by 2.8 °CA and 1.9 °CA, respectively, and the difference between the above pressure and temperature changes began to appear after 10 °CA BTDC, which is the beginning of the obvious combustion period. This indicates that the speed and intensity of combustion will directly affect the in-cylinder pressure and temperature changes in the combustion process, which will lead to the overall engine performance changes.
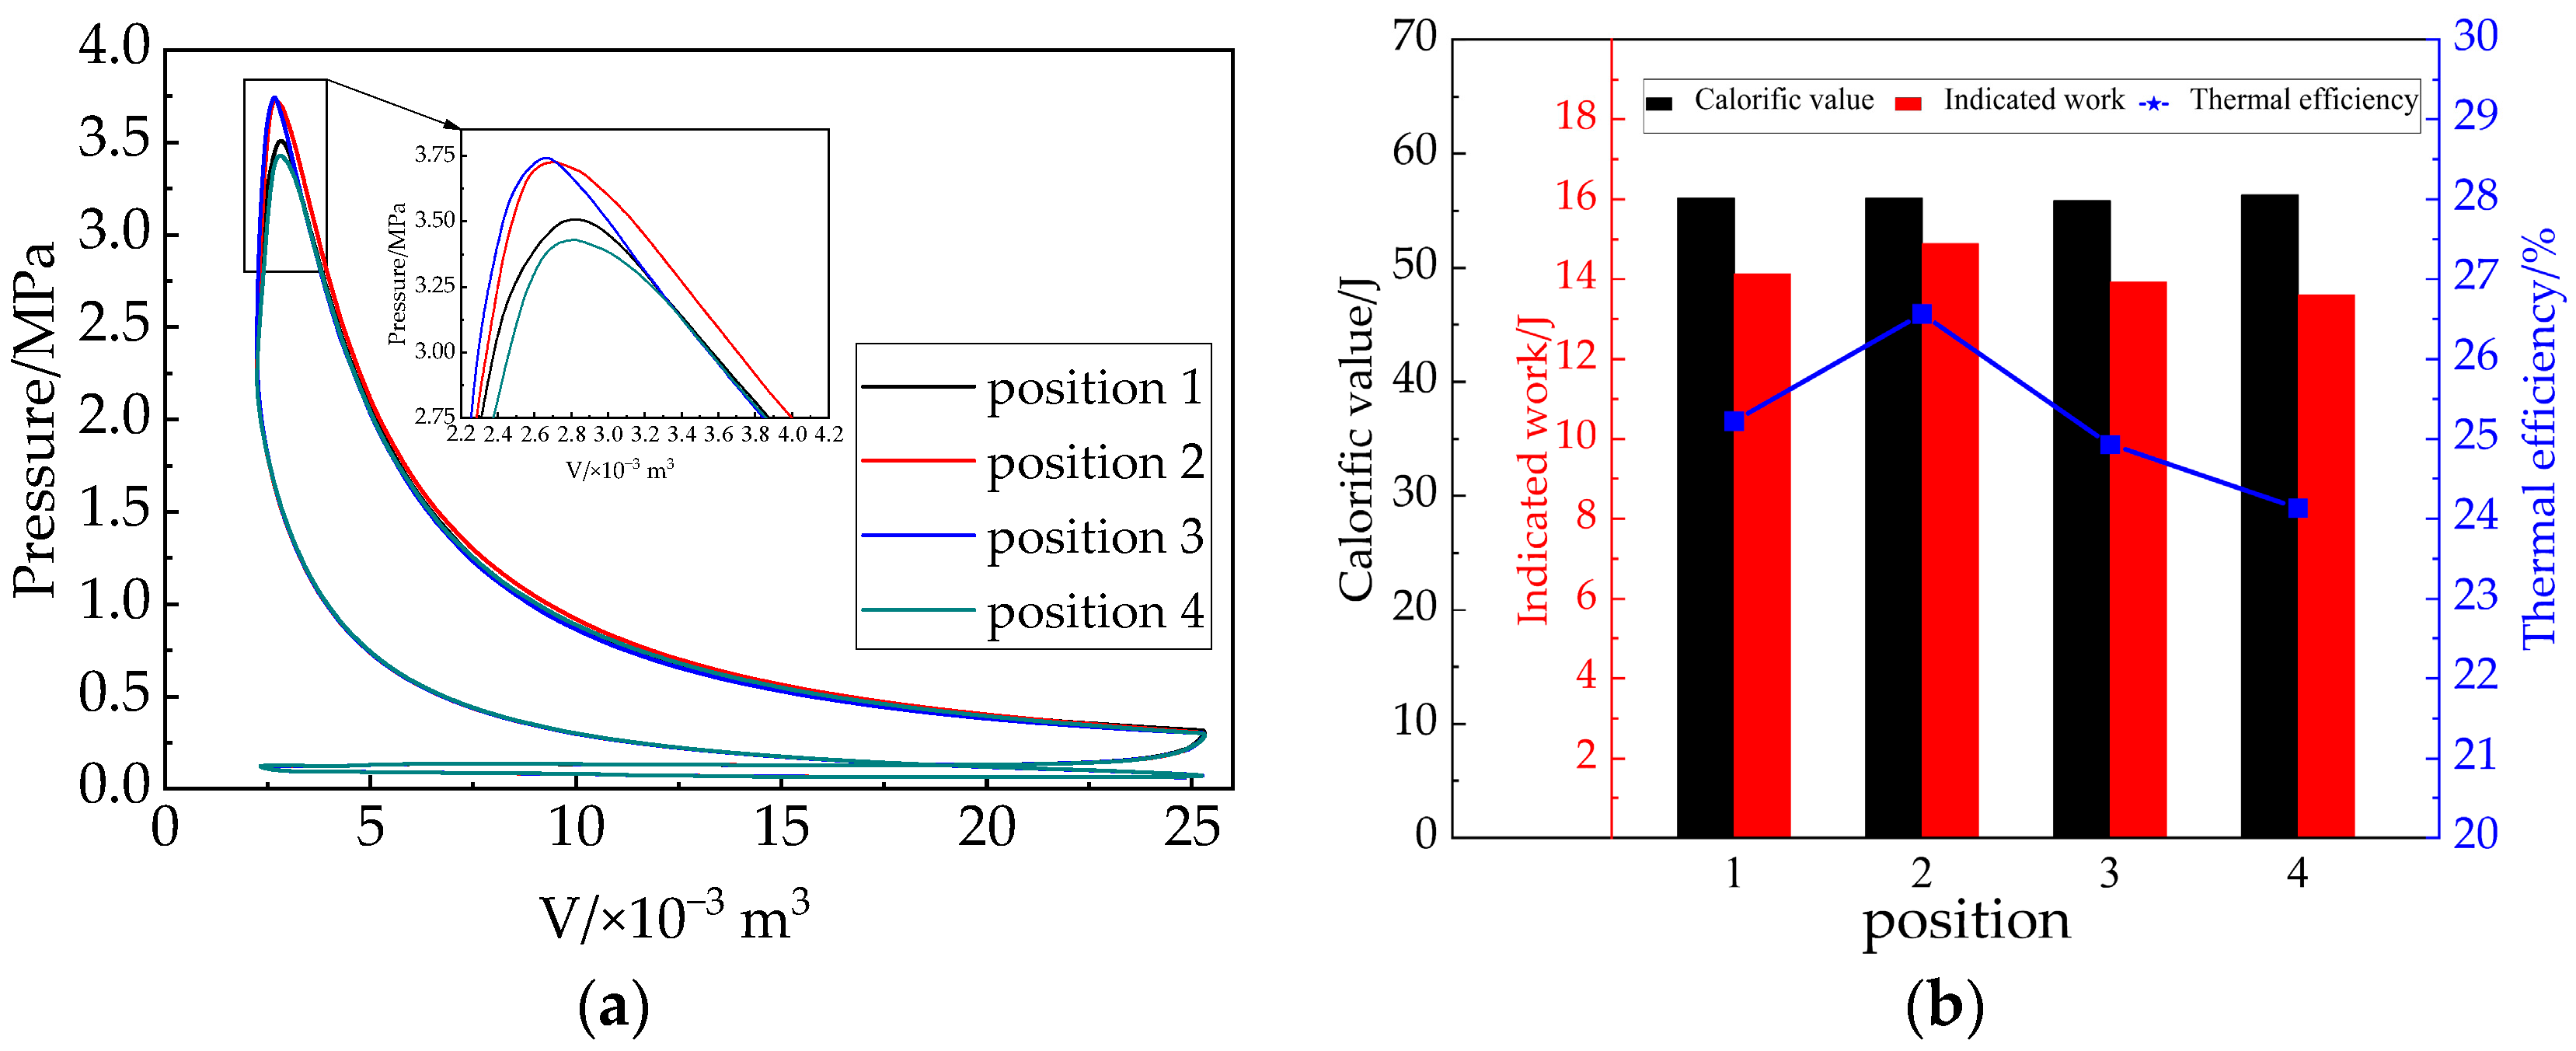
Indicated thermal efficiency is an important parameter for evaluating the economy and performance of the whole engine [47]. The P-V diagram and the indicated thermal efficiency of the XRE at different positions are shown in Figure 12. The area under the line of the P-V diagram can represent the effective work carried out by the engine per cycle. It is found that the higher the peak pressure, the larger the area under the line in the top region. Meanwhile, the faster the pressure drops in the post-combustion period, the smaller the area under the line. Combined with the indicated thermal efficiency, the engine does the most indicated work per cycle at position 2. So it has the highest thermal efficiency of 26.56%, which is 10.08% higher than that of position 4. As shown in the P-V diagram, the area under the line included in position 2 is the largest, and the area in position 4 is the smallest.
The main reason is as follows. The peak pressure and pressure rise rate are two important combustion characteristic parameters that affect the engine performance. According to Figure 11a, it can be found that the peak pressure and the pressure rise rate are very high in positions 2 and 3, so their thermal efficiency will be correspondingly high. However, due to the poor combustion effect and incomplete combustion in the post-combustion period, the pressure drops faster after reaching the peak at position 3, which will cause the area of the P-V diagram to be reduced. Furthermore, the indicated work is reduced, and the thermal efficiency decreases.
To sum up, it is found through simulation research that when position 2 is selected, the in-cylinder combustion speed is the fastest, the combustion is the most intense, and the indicated thermal efficiency of the engine is the highest. Therefore, according to the simulation results, we can choose to drill nozzles at position 2 to inject hydrogen in the practical work process of the XRE, optimize the engine structure, and improve the performance of the engine.

3.3. Emission Process Analysis

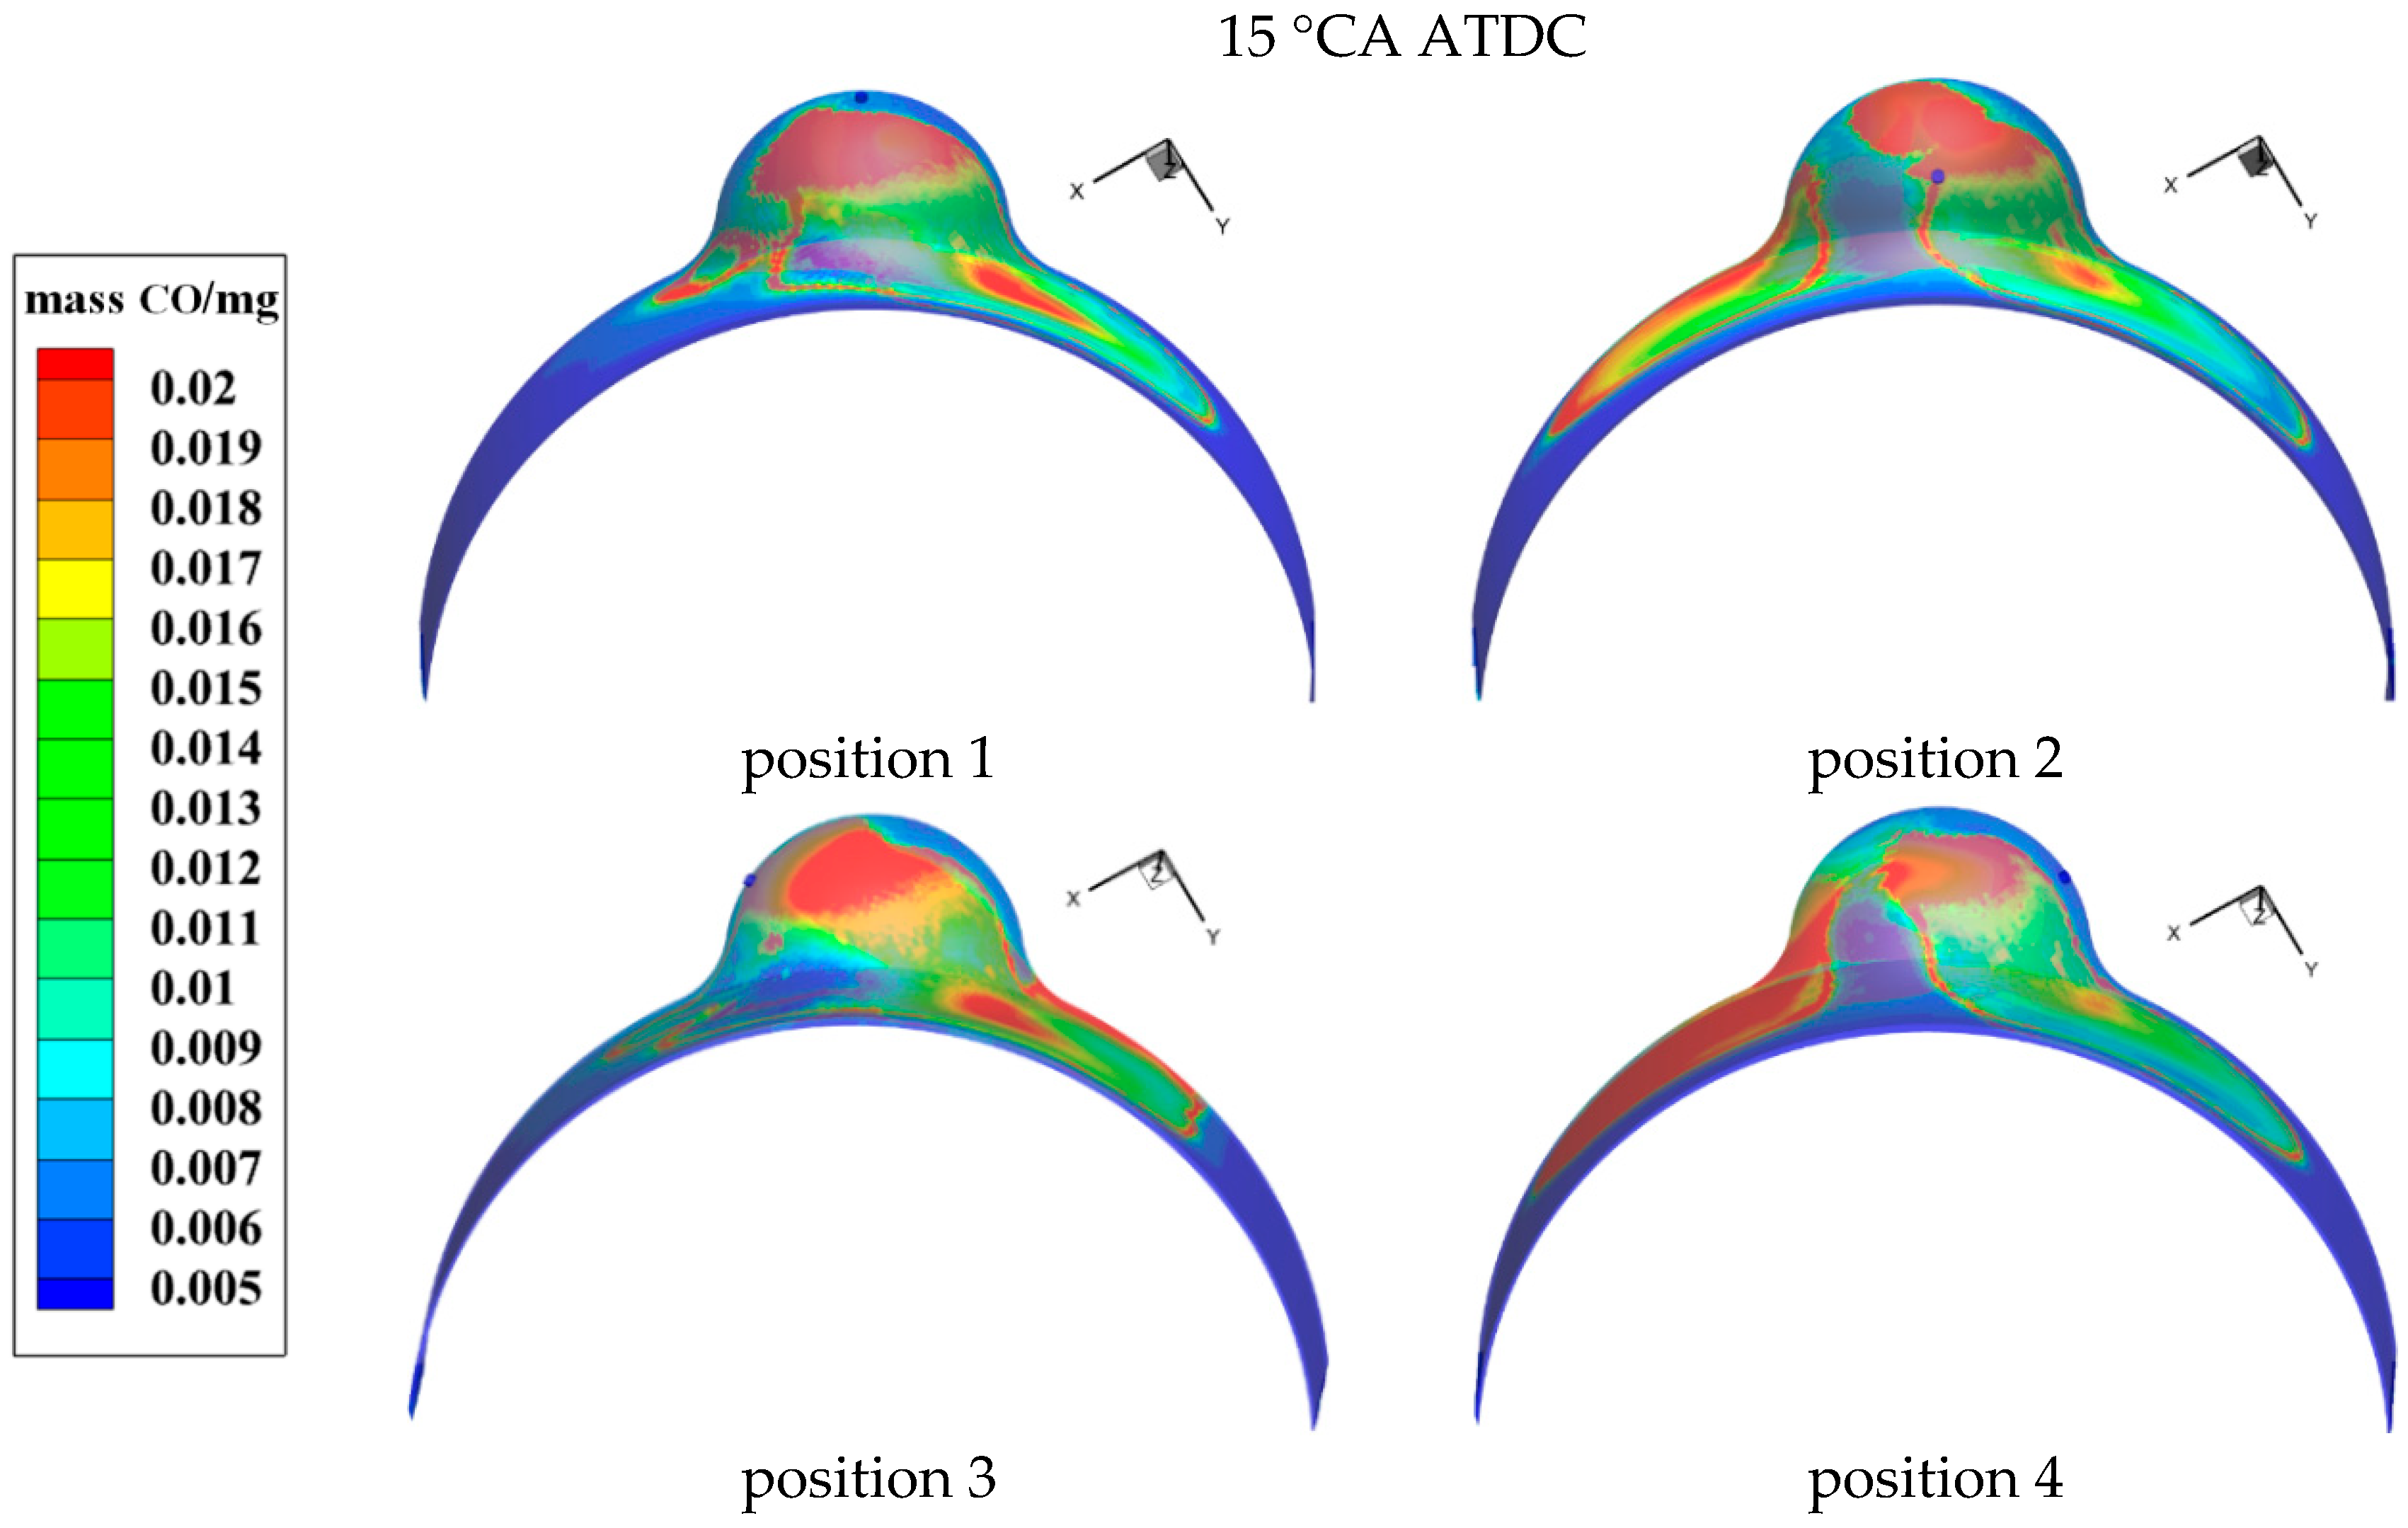
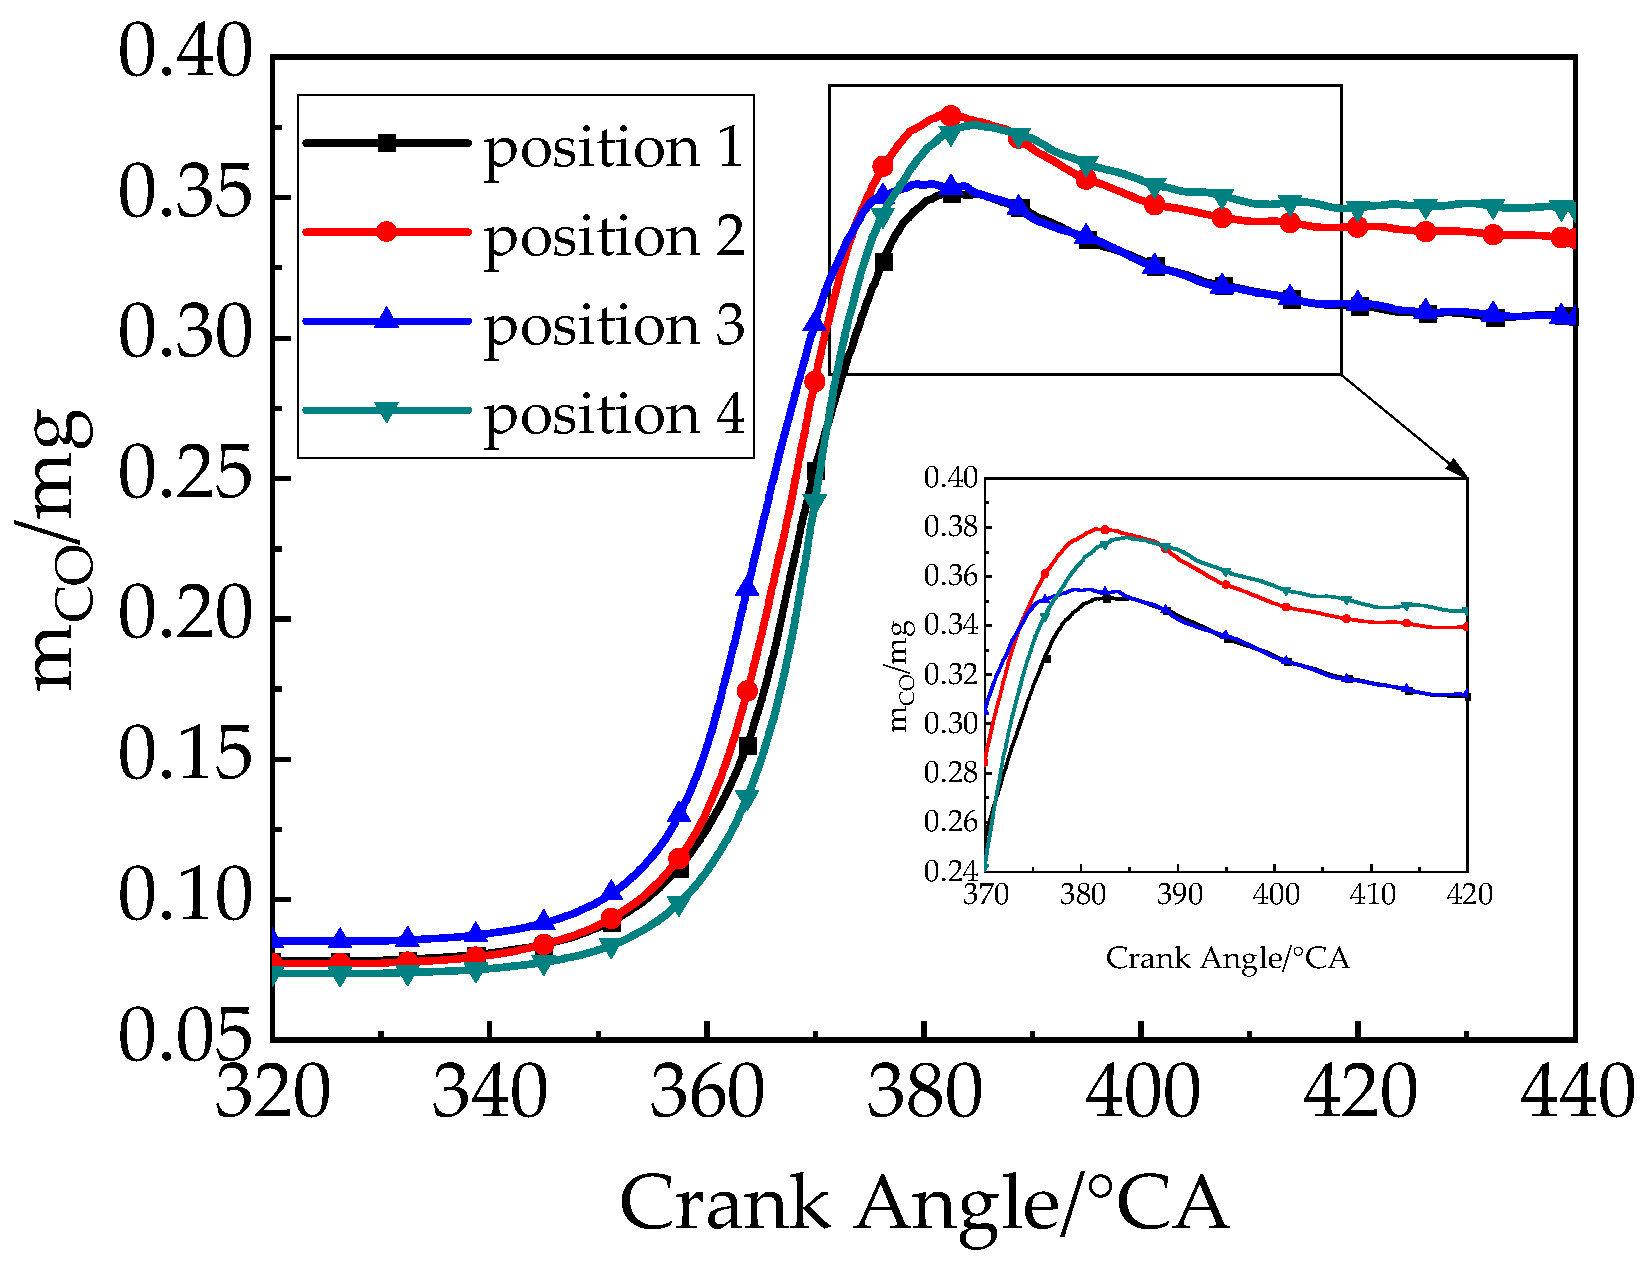
As an intermediate product of gasoline combustion, the distribution and content of in-cylinder CO can reflect the intensity and completeness of fuel combustion [48]. Figure 13 shows the distribution of in-cylinder CO at different positions, which is the most intense stage of in-cylinder combustion at 15 °CA ATDC. The rich distribution area of CO is not only the area where the flame front surface is located but also the place where the instantaneous oxygen amount is small and the combustion is most intense. It was found that the CO distribution in the right of the combustion chamber does not differ much at the four positions. However, the main difference is on the left of the slit. Furthermore, the CO distribution area on the left of the slit at positions 2 and 4 is larger than that at positions 1 and 3 and the CO distribution on the left is more at position 4. Figure 14 shows the curve of in-cylinder CO mass with the crank angle at different positions. The mass of CO emission shows a rapid increase and then a slow decrease with the increase in crank angle. The CO generation at positions 2 and 4 is faster than that at positions 1 and 3, which coincides with the distribution of CO as shown in Figure 13.
Specifically, the formation of the CO emission is due to incomplete combustion caused by low in-cylinder temperature and low oxygen concentration, which slow the local oxidation reactions. Because the combustion is most intense at position 2, more oxygen is consumed instantaneously resulting in insufficient oxygen. Therefore, its CO generation rate is the fastest and the mass peak generated is the largest. At position 4, due to slow combustion and low in-cylinder temperature, part of the CO is not converted into CO2 in time. Therefore, its CO content is also high and the distribution is especially obvious on the left side of the slit.
After analyzing the distribution of in-cylinder CO, the final emission mass of CO2, CO, HC compounds, NOx, and carbon soot are shown in Figure 15. The HC emissions are mainly attributed to several reasons as follows. First, the unburned mixture escapes into the exhaust port during the valve overlap period. Second, the unburned mixture is compressed into the in-cylinder crevices and released during the exhaust valve opening, which plays a dominant role in the formation of HC emissions. Third, the unburned mixture is absorbed into the lubricating oil and then released during the expansion stroke.
At position 4, the highest CO2 emission of 3.18 mg was found and the highest CO emission of 0.32 mg was also found, but the lowest unburned HC emission of 0.04 mg was found. After adding up the incompletely burned CO and HC, the highest unburned carbons of 0.42 mg were found at position 3 and the lowest unburned carbons of 0.36 mg were found at position 2. It was also found that most NOx is discharged at position 2, which is 9.15 μg. In addition, the carbon soot emission masses at different positions do not differ significantly and are all in the range of 0.9–1.0 μg.
The level of carbon emission can show the complete degree of combustion in the cylinder. To be specific, the combustion degree is the most complete, and the gasoline is converted into the most CO2 at positions 2 and 4. The combustion degree is the lowest and the unburned intermediate carbides are the highest at position 3. The main reason is that the overall combustion rate of position 2 is very fast. The obvious combustion period of position 4 is slow, but the combustion is fast, intense and complete in the post-combustion period. Although the obvious combustion period of the position 3 burned quickly, the combustion effect of the post-combustion period is not good. Meanwhile, some intermediate products do not burn completely at position 3, therefore indicating their thermal efficiency is not high. For NOx generation, it is mainly related to the mean in-cylinder temperature, oxygen concentration and combustion reaction time. In the CFD model, the NOx generation model is a thermal model, therefore temperature plays a decisive role in NOx generation [49]. At position 2, the in-cylinder temperature rises the fastest, and the peak temperature is the highest. Thus, its NOx content is also the highest, which matches the temperature results in Figure 11b.
In summary, the fastest rate of CO and NOx generation and the highest NOx emissions were found in position 2. Still, the lowest unburned carbon emissions were also found at this position.

4. Conclusions

In this paper, a 3D CFD model of the X-type rotary engine (XRE) with hydrogen–gasoline fuel is constructed to investigate the effect of direct injection (DI) position on combustion, thermodynamic performances, and pollution emission. Meanwhile, the comparative analysis of four different DI positions is conducted to obtain the best hydrogen DI nozzle position. The conclusions are as follows:
(1)
The interaction between the in-cylinder flow of the mainstream flow field and the hydrogen injection affects the distribution of hydrogen gas before ignition. On the one hand, due to the influence of the hydrogen injection, a large vortex is formed in the injection direction. On the other hand, the vortex makes the hydrogen mix faster with the gas. When the injection position is from the front to the back of the combustion chamber, namely position 2, the hydrogen thick distribution area in the cylinder is the largest and closest to the ignition position.
(2)
The different injection position leads to different in-cylinder hydrogen distribution, which affects the combustion area and combustion rate after the stable flame kernel is formed. Furthermore, position 2 presents the largest combustion area, leading to the highest in-cylinder peak temperature of 1835.16 K and cycle work of 14.90 J. Compared to position 4 that has the lowest thermal efficiency of 24.13%, position 2 presents the highest thermal efficiency of 26.56%, which is 10.08% higher than that of position 4. Thus, it is suggested to drill nozzles at position 2 for injecting hydrogen in the practical work.
(3)
Position 2 shows the most intense combustion, resulting in its CO generation speed being the fastest. Meanwhile, its highest combustion completeness leads to its lowest final unburned carbon emission of 0.36 mg. Although the combustion speed in the pre-combustion period is fast at position 3, the in-cylinder temperature drops obviously in the post-combustion period. Therefore, the incomplete combustion of position 3 in the post-combustion period results in the highest unburned carbon emission of 0.42 mg. The NOx emission of position 2 is the highest at 9.15 μg due to its higher temperature. Meanwhile, the differences in carbon soot emission quality among the different positions are not noticeable. Thus, it can be concluded that carbon emissions can only be minimized by controlling the complete combustion of the whole combustion process.
(4)
In the future, the influences of hydrogen injection timing, secondary injection, injection nozzle diameter and other factors on XRE overall performance with hydrogen–gasoline fuel will be conducted.

Author Contributions

Conceptualization, G.H.; Data curation, Y.D. and R.W.; Investigation, Q.G. and Z.Y.; Methodology, Q.G. and Z.Y.; Writing—original draft, Q.G.; Writing—review and editing, X.W. and Y.D. All authors have read and agreed to the published version of the manuscript.

Funding

This research was funded by the Science and Technology on Plasma Dynamics Laboratory Program, grant number No. 6142202210201.

Data Availability Statement

Not applicable.

Acknowledgments

Thanks for the support from the Science and Technology on Plasma Dynamics Laboratory Program (No. 6142202210201) and The Green Aerotechnics Research Institute of CQJTU.

Conflicts of Interest

The authors declare no conflict of interest.

Abbreviations

XREX-type rotary engine
WREWankel rotary engine
HEHChigh-efficiency hybrid cycle
CFDComputational Fluid Dynamics
HBhydrogen-blended
DIdirect injection
PIport injection
RPMRevolutions per minute
CAcrankshaft angle
BTDCbefore top dead center
ATDCafter top dead center
HRRHeat Release Rate

References

  1. Ohkubo, M.; Tashima, S.; Shimizu, R.; Fuse, S.; Ebino, H. Developed Technologies of the New Rotary Engine (RENESIS); SAE Technical Paper; SAE: Warrendale, PA, USA, 2004. [Google Scholar]
  2. Wang, W.; Zuo, Z.; Liu, J. Miniaturization limitations of rotary internal combustion engines. Energy Convers. Manag. 2016, 112, 101–114. [Google Scholar] [CrossRef]
  3. Sadiq, G.A.; AL-Dadah, R.; Mahmoud, S.M. Development of rotary Wankel devices for hybrid automotive applications. Energy Convers. Manag. 2019, 202, 112159. [Google Scholar] [CrossRef]
  4. Shivaprasad, K.V.; Raviteja, S.; Chitragar, P.R.; Kumar, G.N. Experimental Investigation of the Effect of Hydrogen Addition on Combustion Performance and Emissions Characteristics of a Spark Ignition High Speed Gasoline Engine. Procedia Technol. 2014, 14, 141–148. [Google Scholar] [CrossRef]
  5. Siadkowska, K.; Wendeker, M.; Majczak, A.; Barański, G.; Szlachetka, M. The Influence of Some Synthetic Fuels on the Performance and Emissions in a Wankel Engine); SAE Technical Paper; SAE: Warrendale, PA, USA, 2014. [Google Scholar]
  6. Shkolnik, N.; Shkolnik, A.C. Rotary High Efficiency Hybrid Cycle Engine); SAE Technical Paper; SAE: Warrendale, PA, USA, 2008. [Google Scholar]
  7. Shkolnik, N.; Shkolnik, A.C. High Efficiency Hybrid Cycle Engine. In Proceedings of the Internal Combustion Engine Division Spring Technical Conference, Aachen, Germany, 7–10 May 2006. [Google Scholar]
  8. Yang, Z.; Du, Y.; Geng, Q.; He, G. Energy loss and comprehensive performance analysis of a novel high-efficiency hybrid cycle hydrogen-gasoline rotary engine under off-design conditions. Energy Convers. Manag. 2022, 267, 115942. [Google Scholar] [CrossRef]
  9. Shkolnik, A.C.; Shkolnik, N.; Scarcella, J.B.; Nickerson, M.D.; Kopache, A.; Becker, K.F.; Bergin, M.J.; Spitulnik, A.N.; Equiluz, R.; Fagan, R.; et al. Compact, lightweight, high efficiency rotary engine for generator, APU, and range-extended electric vehicles. In Proceedings of the NDIA Ground Vehicule Systems Engineering and Technology Symposium, Novi, MI, USA, 7–8 August 2018. [Google Scholar]
  10. Nickerson, M.D.; Kopache, A.; Shkolnik, A.C.; Becker, K.F.; Shkolnik, N.; Bergin, M.J.; Spitulnik, A.N.; Mikhailov, K.A.; Equiluz, R.; Fagan, R.; et al. Preliminary Development of a 30 kW Heavy Fueled Compression Ignition Rotary ‘X’ Engine with Target 45% Brake Thermal Efficiency. In Proceedings of the WCX World Congress Experience, Detroit, MI, USA, 10–12 April 2018. [Google Scholar]
  11. Leboeuf, M.; Dufault, J.-F.; Nickerson, M.D.; Becker, K.F.; Kopache, A.; Shkolnik, N.; Shkolnik, A.C.; Picard, M. Performance of a Low-Blowby Sealing System for a High Efficiency Rotary Engine); SAE Technical Paper; SAE: Warrendale, PA, USA, 2018. [Google Scholar]
  12. Littera, D.; Nickerson, M.D.; Kopache, A.; Machamada, G.; Sun, C.F.; Schramm, A.; Medeiros, N.; Becker, K.F.; Shkolnik, N.; Shkolnik, A.C. Development of the XMv3 High Efficiency Cycloidal Engine; SAE Technical Paper; SAE: Warrendale, PA, USA, 2015. [Google Scholar]
  13. Costa, T.; Nickerson, M.D.; Littera, D.; Martins, J.; Shkolnik, A.C.; Shkolnik, N.; Brito, F.P. Measurement and Prediction of Heat Transfer Losses on the XMv3 Rotary Engine. SAE Int. J. Engines 2016, 9, 2368–2380. [Google Scholar] [CrossRef]
  14. Dincer, I.; Acar, C. Review and evaluation of hydrogen production methods for better sustainability. Int. J. Hydrogen Energy 2015, 40, 11094–11111. [Google Scholar] [CrossRef]
  15. Raviteja, S.; Kumar, G.N. Effect of hydrogen addition on the performance and emission parameters of an SI engine fueled with butanol blends at stoichiometric conditions. Int. J. Hydrogen Energy 2015, 40, 9563–9569. [Google Scholar] [CrossRef]
  16. Shadidi, B.; Najafi, G.; Yusaf, T. A Review of Hydrogen as a Fuel in Internal Combustion Engines. Energies 2021, 14, 6209. [Google Scholar] [CrossRef]
  17. Duan, X.; Liu, Y.; Liu, J.; Lai, M.-C.; Jansons, M.; Guo, G.; Zhang, S.; Tang, Q. Experimental and numerical investigation of the effects of low-pressure, high-pressure and internal EGR configurations on the performance, combustion and emission characteristics in a hydrogen-enriched heavy-duty lean-burn natural gas SI engine. Energy Convers. Manag. 2019, 195, 1319–1333. [Google Scholar] [CrossRef]
  18. Zhu, Z.; Li, Y.; Shi, C. Effect of natural gas energy fractions on combustion performance and emission characteristics in an optical CI engine fueled with natural gas/diesel dual-fuel. Fuel 2022, 307, 121842. [Google Scholar] [CrossRef]
  19. Garcia-Agreda, A.; Sarli, V.D.; Benedetto, A.D. Bifurcation analysis of the effect of hydrogen addition on the dynamic behavior of lean premixed pre-vaporized ethanol combustion. Int. J. Hydrogen Energy 2012, 37, 6922–6932. [Google Scholar] [CrossRef]
  20. Sarli, V.D. Stability and Emissions of a Lean Pre-Mixed Combustor with Rich Catalytic/Lean-burn Pilot. Int. J. Chem. React. Eng. 2014, 12, 77–89. [Google Scholar] [CrossRef]
  21. Cammarota, F.; Benedetto, A.D.; Sarli, V.D.; Salzano, E. The Effect of Hydrogen Addition on the Explosion of Ethanol/air Mixtures. Chem. Eng. Trans. 2012, 26, 405–410. [Google Scholar]
  22. Salzano, E.; Cammarota, F.; Benedetto, A.D.; Sarli, V.D. Explosion behavior of hydrogenemethane/air mixtures. J. Loss Prev. Process Ind. 2012, 25, 443–447. [Google Scholar] [CrossRef]
  23. Sarli, V.D.; Benedetto, A.D.; Long, E.J.; Hargrave, G.K. Time-Resolved Particle Image Velocimetry of dynamic interactions between hydrogen-enriched methane/air premixed flames and toroidal vortex structures. Int. J. Hydrogen Energy 2012, 37, 16201–16213. [Google Scholar] [CrossRef] [Green Version]
  24. Amrouche, F.; Erickson, P.A.; Park, J.W.; Varnhagen, S. An experimental investigation of hydrogen-enriched gasoline in a Wankel rotary engine. Int. J. Hydrogen Energy 2014, 39, 8525–8534. [Google Scholar] [CrossRef]
  25. Amrouche, F.; Erickson, P.A.; Park, J.W.; Varnhagen, S. Performance Comparison of a Wankel SI Engine Fuelled with Gasoline and Ethanol Blended Hydrogen. In Advances in Renewable Hydrogen and Other Sustainable Energy Carriers; Springer: Singapore, 2020. [Google Scholar]
  26. Amrouche, F.; Erickson, P.A.; Park, J.W.; Varnhagen, S. Extending the lean operation limit of a gasoline Wankel rotary engine using hydrogen enrichment. Int. J. Hydrogen Energy 2016, 41, 14261–14271. [Google Scholar] [CrossRef]
  27. Amrouche, F.; Erickson, P.A.; Varnhagen, S.; Park, J.W. An experimental analysis of hydrogen enrichment on combustion characteristics of a gasoline Wankel engine at full load and lean burn regime. Int. J. Hydrogen Energy 2018, 43, 19250–19259. [Google Scholar] [CrossRef]
  28. Fedyanov, E.A.; Levin, Y.V.; Itkis, E.M.; Prikhodkov, K.V. Use of phased supply of hydrogen additives for improvement of the ecological characteristics of the Wankel rotary engine. IOP Conf. Ser. Mater. Sci. Eng. 2021, 1155, 012077. [Google Scholar] [CrossRef]
  29. Fedyanov, E.A.; Zakharov, E.A.; Prikhodkov, K.V.; Levin, Y.V. Modelling of Flame Propagation in the Gasoline Fuelled Wankel Rotary Engine with Hydrogen Additives. OP Conf. Ser. Mater. Sci. Eng. 2017, 177, 012076. [Google Scholar] [CrossRef]
  30. Yang, J.; Ji, C.; Wang, S.; Zhang, Z.; Wang, D.; Zedong, M. Numerical investigation of the effects of hydrogen enrichment on combustion and emissions formation processes in a gasoline rotary engine. Energy Convers. Manag. 2017, 151, 136–146. [Google Scholar] [CrossRef]
  31. Yang, J.; Ji, C.; Wang, S.; Wang, D.; Ma, Z.; Ma, L. A comparative study of mixture formation and combustion processes in a gasoline Wankel rotary engine with hydrogen port and direct injection enrichment. Energy Convers. Manag. 2018, 168, 21–31. [Google Scholar] [CrossRef]
  32. Yang, J.; Ji, C.; Wang, S.; Wang, D.; Ma, Z.; Zhang, B. Numerical investigation on the mixture formation and combustion processes of a gasoline rotary engine with direct injected hydrogen enrichment. Appl. Energy 2018, 224, 34–41. [Google Scholar] [CrossRef]
  33. Yang, J.; Ji, C.; Wang, S.; Wang, D.; Shi, C.; Ma, Z.; Zhang, B. Numerical study of hydrogen direct injection strategy on mixture formation and combustion process in a partially premixed gasoline Wankel rotary engine. Energy Convers. Manag. 2018, 176, 184–193. [Google Scholar] [CrossRef]
  34. Yang, J.; Ji, C.; Wang, S.; Shi, C.; Wang, D.; Ma, Z.; Yang, Z. Numerical study of compound intake on mixture formation and combustion process in a hydrogen-enriched gasoline Wankel rotary engine. Energy Convers. Manag. 2019, 185, 66–74. [Google Scholar] [CrossRef]
  35. Ji, C.; Meng, H.; Wang, S.; Wang, D.; Yang, J.; Shi, C.; Ma, Z. Realizing stratified mixtures distribution in a hydrogen-enriched gasoline Wankel engine by different compound intake methods. Energy Convers. Manag. 2020, 203, 112230. [Google Scholar] [CrossRef]
  36. Shi, C.; Ji, C.; Wang, S.; Yang, J.; Ma, Z.; Ge, Y. Combined influence of hydrogen direct-injection pressure and nozzle diameter on lean combustion in a spark-ignited rotary engine. Energy Convers. Manag. 2019, 195, 1124–1137. [Google Scholar] [CrossRef]
  37. Shi, C.; Ji, C.; Wang, S.; Yang, J.; Li, X.; Ge, Y. Numerical simulation on combustion process of a hydrogen direct-injection stratified gasoline Wankel engine by synchronous and asynchronous ignition modes. Energy Convers. Manag. 2019, 183, 14–25. [Google Scholar] [CrossRef]
  38. Shi, C.; Ji, C.; Wang, S.; Yang, J.; Li, X.; Ge, Y. Effects of hydrogen direct-injection angle and charge concentration on gasoline-hydrogen blending lean combustion in a Wankel engine. Energy Convers. Manag. 2019, 187, 316–327. [Google Scholar] [CrossRef]
  39. Shi, C.; Ji, C.; Ge, Y.; Wang, S.; Yang, J.; Wang, H. Effects of split direct-injected hydrogen strategies on combustion and emissions performance of a small-scale rotary engine. Energy 2021, 215, 119124. [Google Scholar] [CrossRef]
  40. Ji, C.; Cong, X.; Wang, S.; Shi, L.; Su, T.; Wang, D. Performance of a hydrogen-blended gasoline direct injection engine under various second gasoline direct injection timings. Energy Convers. Manag. 2018, 171, 1704–1711. [Google Scholar] [CrossRef]
  41. Fan, B.; Zeng, Y.; Pan, J.; Fang, J.; Salami, H.A.; Wang, Y. Numerical study of injection strategy on the combustion process in a peripheral ported rotary engine fueled with natural gas/hydrogen blends under the action of apex seal leakage. Energy 2021, 242, 122532. [Google Scholar] [CrossRef]
  42. Fan, B.; Wang, Y.; Zhang, Y.; Pan, J.; Yang, W.; Zeng, Y. Numerical Investigation on the Combustion Performance of a Natural Gas/Hydrogen Dual Fuel Rotary Engine under the Action of Apex Seal Leakage. Energy Fuels 2020, 35, 770–784. [Google Scholar] [CrossRef]
  43. Shi, C.; Ji, C.; Ge, Y.; Wang, S.; Bao, J.; Yang, J. Numerical study on ignition amelioration of a hydrogen-enriched Wankel engine under lean-burn condition. Appl. Energy 2019, 255, 113800. [Google Scholar] [CrossRef]
  44. Liu, Y.; Jia, M.; Xie, M.; Pang, B. Enhancement on a Skeletal Kinetic Model for Primary Reference Fuel Oxidation by Using a Semidecoupling Methodology. Energy Fuels 2012, 26, 7069–7083. [Google Scholar] [CrossRef]
  45. Fan, B.; Zeng, Y.; Zhang, Y.; Pan, J.; Yang, W.; Wang, Y. Research on the hydrogen injection strategy of a direct injection natural gas/hydrogen rotary engine considering apex seal leakage. Int. J. Hydrogen Energy 2021, 46, 9234–9251. [Google Scholar] [CrossRef]
  46. Shi, C.; Zhang, Z.; Ji, C.; Li, X.; Di, L.; Wu, Z. Potential improvement in combustion and pollutant emissions of a hydrogen-enriched rotary engine by using novel recess configuration. Chemosphere 2022, 299, 134491. [Google Scholar] [CrossRef]
  47. Shibata, G.; Ogawa, H.; Amanuma, Y.; Okamoto, Y. Optimization of multiple heat releases in pre-mixed diesel engine combustion for high thermal efficiency and low combustion noise by a genetic-based algorithm method. Int. J. Engine Res. 2019, 20, 540–554. [Google Scholar] [CrossRef] [Green Version]
  48. Wang, S.; Ji, C.; Zhang, B.R.; Cong, X.; Liu, X. Effect of CO2 dilution on combustion and emissions characteristics of the hydrogen-enriched gasoline engine. Energy 2016, 96, 118–126. [Google Scholar] [CrossRef]
  49. Gao, J.; Xing, S.; Tian, G.; Ma, C.; Zhao, M.; Jenner, P. Numerical simulation on the combustion and NOx emission characteristics of a turbocharged opposed rotary piston engine fuelled with hydrogen under wide open throttle conditions. Fuel 2021, 285, 119210. [Google Scholar] [CrossRef]
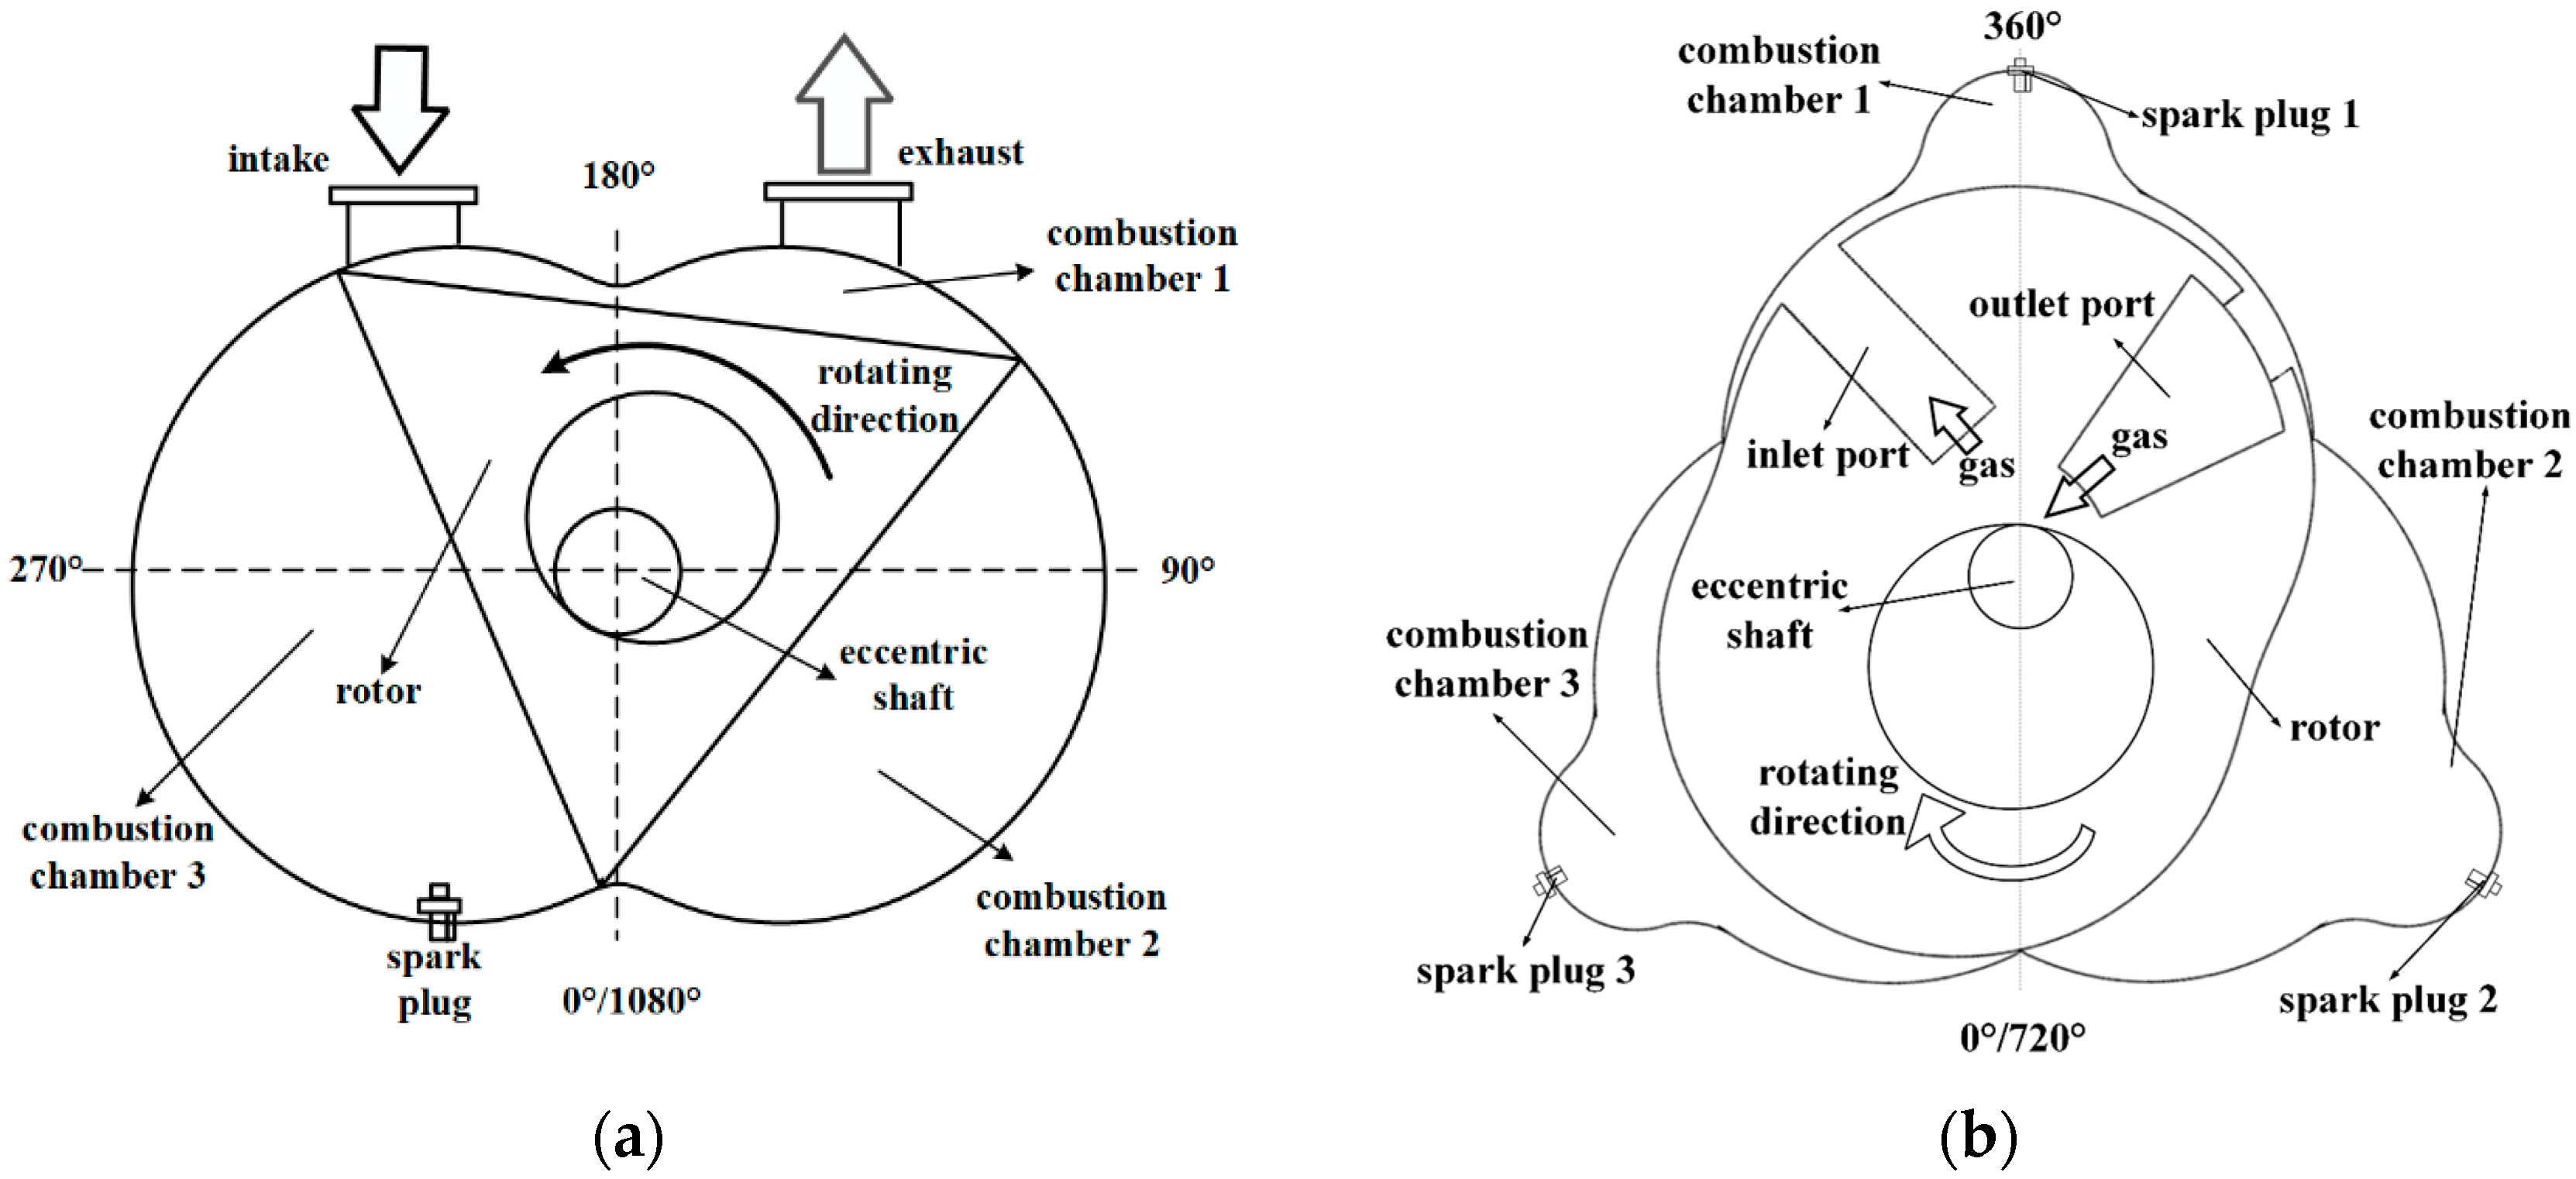
Figure 1. Schematic comparison of XRE: (a) WRE, (b) XRE.
Energies 15 07219 g001
Figure 2. Grid division of XRE.
Energies 15 07219 g002
Figure 3. Schematic diagram of nozzle position and injection direction.
Energies 15 07219 g003
Figure 4. In-cylinder mean pressure under different grid sizes.
Energies 15 07219 g004
Figure 5. Pressure verification of experimental and simulation results: (a) pressure comparison between intake and compression processes at 10,000 RPM, (b) pressure comparison in combustion process at 9000 RPM.
Energies 15 07219 g005
Figure 6. Flow field and vorticity changes at various stages before injection.
Energies 15 07219 g006
Figure 7. Comparison of flow field and vorticity changes in injection stage at different positions.
Energies 15 07219 g007
Figure 8. Comparison of hydrogen distribution in injection stage at different positions.
Energies 15 07219 g008
Figure 9. Comparison of temperature cloud atlas in combustion stage at different positions.
Energies 15 07219 g009aEnergies 15 07219 g009b
Figure 10. Comparison of parameters at different positions: (a) sum of peak mass of OH, O and H radicals, (b) heat release rate (HRR).
Energies 15 07219 g010
Figure 11. Comparison of in-cylinder mean pressure and temperature at different positions: (a) pressure, (b) temperature.
Energies 15 07219 g011
Figure 12. Comparison of overall engine performance at different positions: (a) P-V diagram, (b) indicated thermal efficiency.
Energies 15 07219 g012
Figure 13. Comparison of CO distribution cloud atlas in combustion stage at different positions.
Energies 15 07219 g013
Figure 14. CO emission changes at different positions.
Energies 15 07219 g014
Figure 15. Comparison of final pollutants discharged into the atmosphere at different positions: (a) compound of carbon, (b) nitrides and soot.
Energies 15 07219 g015
Table 1. Main structural parameters of XMv3 rotary engine [13].
ProjectValue
Generating radius/mm41
Eccentricity/mm6
Cylinder thick/mm18.5
Offset/mm0.7
Geometry compression ratio11:1
One chamber displacement/cc23
Cooling methodWater cooled
Ignition sourceSpark plug
Top dead center angle/°CA360
Intake value closing/°CA585
Exhaust value opening/°CA161
Table 2. Calculated initial conditions [13].
Calculated ParametersValue
Engine speed/RPM9000, 10,000
Intake pressure/bar1.03
Spark advance angle/°CA30
Cooling gas flow to housing/kg·s−1165
FuelGasoline, hydrogen–gasoline
Lambda0.85
Table 3. Specific parameters of hydrogen DI in engine.
Specification ParametersValue
Hydrogen energy fraction3%
Injection pressure0.5 MPa
Injection moment70 °CA BTDC
Injection pulse width3.5 °CA
Number of nozzles3
Nozzle diameter1 mm
Publisher’s Note: MDPI stays neutral with regard to jurisdictional claims in published maps and institutional affiliations.