Article

Three-Dimensional Physical Simulation of Horizontal Well Pumping Production and Water Injection Disturbance Assisted CO2 Huff and Puff in Shale Oil Reservoir

1
State Key Laboratory of Enhanced Oil Recovery, PetroChina, Beijing 100083, China
2
Research Institute of Petroleum Exploration and Development, PetroChina, Beijing 100083, China
3
Key Laboratory of Unconventional Oil and Gas Development, China University of Petroleum (East China), Ministry of Education, Qingdao 266580, China
4
School of Petroleum Engineering, China University of Petroleum (East China), Qingdao 266580, China
5
Research Institute of Petroleum Exploration and Development of Xinjiang Oil Field, PetroChina, Karamay 834000, China
*
Author to whom correspondence should be addressed.
Energies 2022, 15(19), 7220; https://doi.org/10.3390/en15197220
Submission received: 16 August 2022 / Revised: 23 September 2022 / Accepted: 27 September 2022 / Published: 1 October 2022
(This article belongs to the Special Issue Enhanced Oil Recovery for Unconventional Oil and Gas Reservoirs)

Abstract

:
In view of the problems of low matrix permeability and low oil recovery in shale reservoirs, CO2 huff and puff technology is considered as an effective method to develop shale oil reservoirs. However, the production behaviors of actual shale reservoirs cannot be reproduced and the EOR potentials cannot be evaluated directly by scaled models in the laboratory. Conventional CO2 huff and puff has problems such as early gas breakthrough and gas channeling leading to inefficient development. In this article, with the help of a three-dimensional experimental simulation apparatus, a new method of CO2 huff and puff with a horizontal well assisted by pumping production and water injection disturbance is developed. The dynamic characteristic, pressure field distribution of soaking and the enhanced oil recovery effect are comprehensively evaluated. The results show that the soaking stage of CO2 huff and puff can be divided into three stages: differential pressure driving, diffusion driving and dissolution driving. According to the pressure field distribution, after water injection disturbance, the fluctuation boundary and distribution of pressure becomes more stable and uniform and the sweep rate is greatly improved. Water injection disturbance realizes the combination of CO2 injection energy enhancement and water injection energy enhancement and the CO2 injection utilization rate is improved. It has the dual effect of stratum energy increase and economic benefit. The new huff and puff method can increase the oil recovery rate by 7.18% and increase the oil–gas replacement rate to 1.2728, which confirms the potential of horizontal well pumping production and water injection disturbance-assisted CO2 huff and puff technology to improve oil recovery.

1. Introduction

In recent years, with the continuous increase in the exploration and development of shale oil reservoirs, unconventional resources such as shale oil and gas have played a key role in the rapid growth of oil production, which has greatly alleviated the shortage of oil and gas resources and become an important substitute resource for increasing oil production and reserves [1]. However, due to the low permeability and high proportion of nano-pores of shale reservoirs, the development of micro-fractures and the serious heterogeneity of reservoirs, the energy of shale reservoirs decreases rapidly and oil recovery is only approximately 7% [2]. For the subsequent stimulation of shale reservoirs, the multi-stage volume fracturing technology for horizontal wells was developed. With the help of this technology, the initial production can be greatly improved, but there are still problems such as a rapid recovery decline in the follow-up, which shows that low oil recovery is caused by the poor continuity of production because it easily leads to rapid depletion of natural energy after fracturing, but the subsequent energy supply is not timely, so it is difficult to maintain high-speed production [3]. Therefore, how to explore new methods to improve the recovery of shale reservoirs has become a new challenge.
Shale reservoirs are characterized by strong heterogeneity on the macro level and complex nano-scale pores and throats on the micro level. Water injection easily leads to the rapid increase in reservoir pressure, but there are some problems such as water injection difficulty and small swept area. Moreover, due to the existence of inter-well fractures, water preferentially occupies the fractures, resulting in rapid water breakthrough in oil wells, rapid increase in water cut and low production [4,5,6]. Considering the above problems, based on the good injectivity of gas, gas injection has proved to be an effective method to improve the oil recovery of shale reservoirs. Commonly used injected gases include CO2, N2 and CH4. Among them, CO2 has proved to be one of the most effective displacement fluids for enhanced oil recovery. Compared with other gases, CO2 is easier to dissolve into the oil phase, promoting oil expansion and reducing oil flow viscosity to increase its fluidity [7,8]. In addition, CO2 has strong adsorption in shale organic matter, which has the potential to exploit shale oil with adsorption and mutual solubility. Moreover, Rathmell et al. studied the effect of CH4 and N2 on MMP of CO2 crude oil and found that MMP increased with the increase in CH4 and N2 content [9], indicating that pure CO2 has lower MMP than other gases. The injected CO2 repeatedly contacts with the crude oil in the underground oil layer, and finally reaches the miscible state through intermolecular diffusion and mass transfer [10,11]. Therefore, rational use of CO2 can effectively improve the recovery of shale oil reservoirs and effectively alleviate the energy shortage problem. At the same time, during CO2 flooding, a portion of CO2 is sealed underground [12,13,14], and the goal of carbon sequestration is achieved at the same time of oil production.
The continuous injection of CO2 makes it easier for gas to diffuse and flow in shale pores, which can continuously replenish energy for the formation. The research has proved that the recovery can be increased by 10–20% [15]. However, there are many micro-fractures in shale reservoirs, so when continuous gas injection is carried out, gas preferentially occupies fracture channels, and large-scale hydraulic fracturing leads to serious early breakthrough problems [16], resulting in a substantial increase in the gas–oil ratio and production cost and a decrease in oil recovery. At the same time, it is difficult to connect the matrix and fracture channels [17], and a large amount of residual oil remains in the matrix [18,19]. Therefore, solving the early breakthrough of gas becomes another challenge to further enhance oil recovery. Li et al. took the influence of molecular diffusion into account and established a double permeation model using numerical simulation. The results showed that the gas breakthrough time of CO2 huff and puff was delayed [20]. Sun and Chen et al. studied the feasibility of CO2 huff and puff to improve the oil recovery of fault block oilfields and fractured oilfields through laboratory experiments, and analyzed the related mechanism [21,22]. For fractured shale reservoirs, CO2 preferentially enters the fractures after injection. In the soaking stage, due to the extremely low permeability and porosity of shale reservoirs, CO2 in the fractures further migrates to the matrix, and the slow replacement rate increases the contact time of oil and gas, thus, facilitating oil displacement [23]. Other researchers have added slug injection to delay gas channeling during huff and puff; commonly used slug injection agents are water, surfactant, etc. Li et al. used polymer gel as slug in their experiments and compared the effect of adding polymer slug to prevent gas channeling [24]. In the above experimental studies, CO2 huff and puff had a good oil displacement effect, but the effect in the field experiment was not satisfactory and the recovery was only approximately 10% [25]. The reason is that the previous experiments are mostly core-scale experiments [26,27], which are easy to operate, but the gap between the linear physical model and the actual field experiment is too large, and the heterogeneity of shale reservoirs and the ambiguity of pore structure make the characterization of gas injection production dynamics unclear. Secondly, the high heterogeneity of the reservoir leads to the acceleration of gas injection and oil displacement breakthrough time, resulting in the reduction in oil production [28]. The previous methods were ineffective in delaying gas breakthrough. Therefore, the research on the efficient production mode of CO2 huff and puff is not deep enough at this stage. In order to further explore the seepage mechanism and find a breakthrough in enhancing oil recovery in shale reservoirs, it is necessary to develop and design a new CO2 huff and puff oil production method to prevent the gas from breaking through prematurely.
In view of the above problems, a three-dimensional (3D) physical simulation apparatus was designed and constructed to overcome the disadvantage of the one-dimensional (1D) and two-dimensional (2D) models, i.e., unclear characterization of production performance. Based on the problems of early gas breakthrough and poor oil recovery in conventional CO2 huff and puff, a new method of CO2 huff and puff with horizontal well assisted by pumping production and water injection disturbance was developed, which realized the real-time monitoring of the pressure field during the development process. Combined with the indicators of the recovery factor and the oil–gas replacement rate, the effect of CO2 huff and puff and the contribution to the recovery factor were compared under the two huff and puff methods. This research can provide theoretical methods and technical support for the effective development of CO2 huff and puff in shale oil reservoirs.

2. Experimental Section

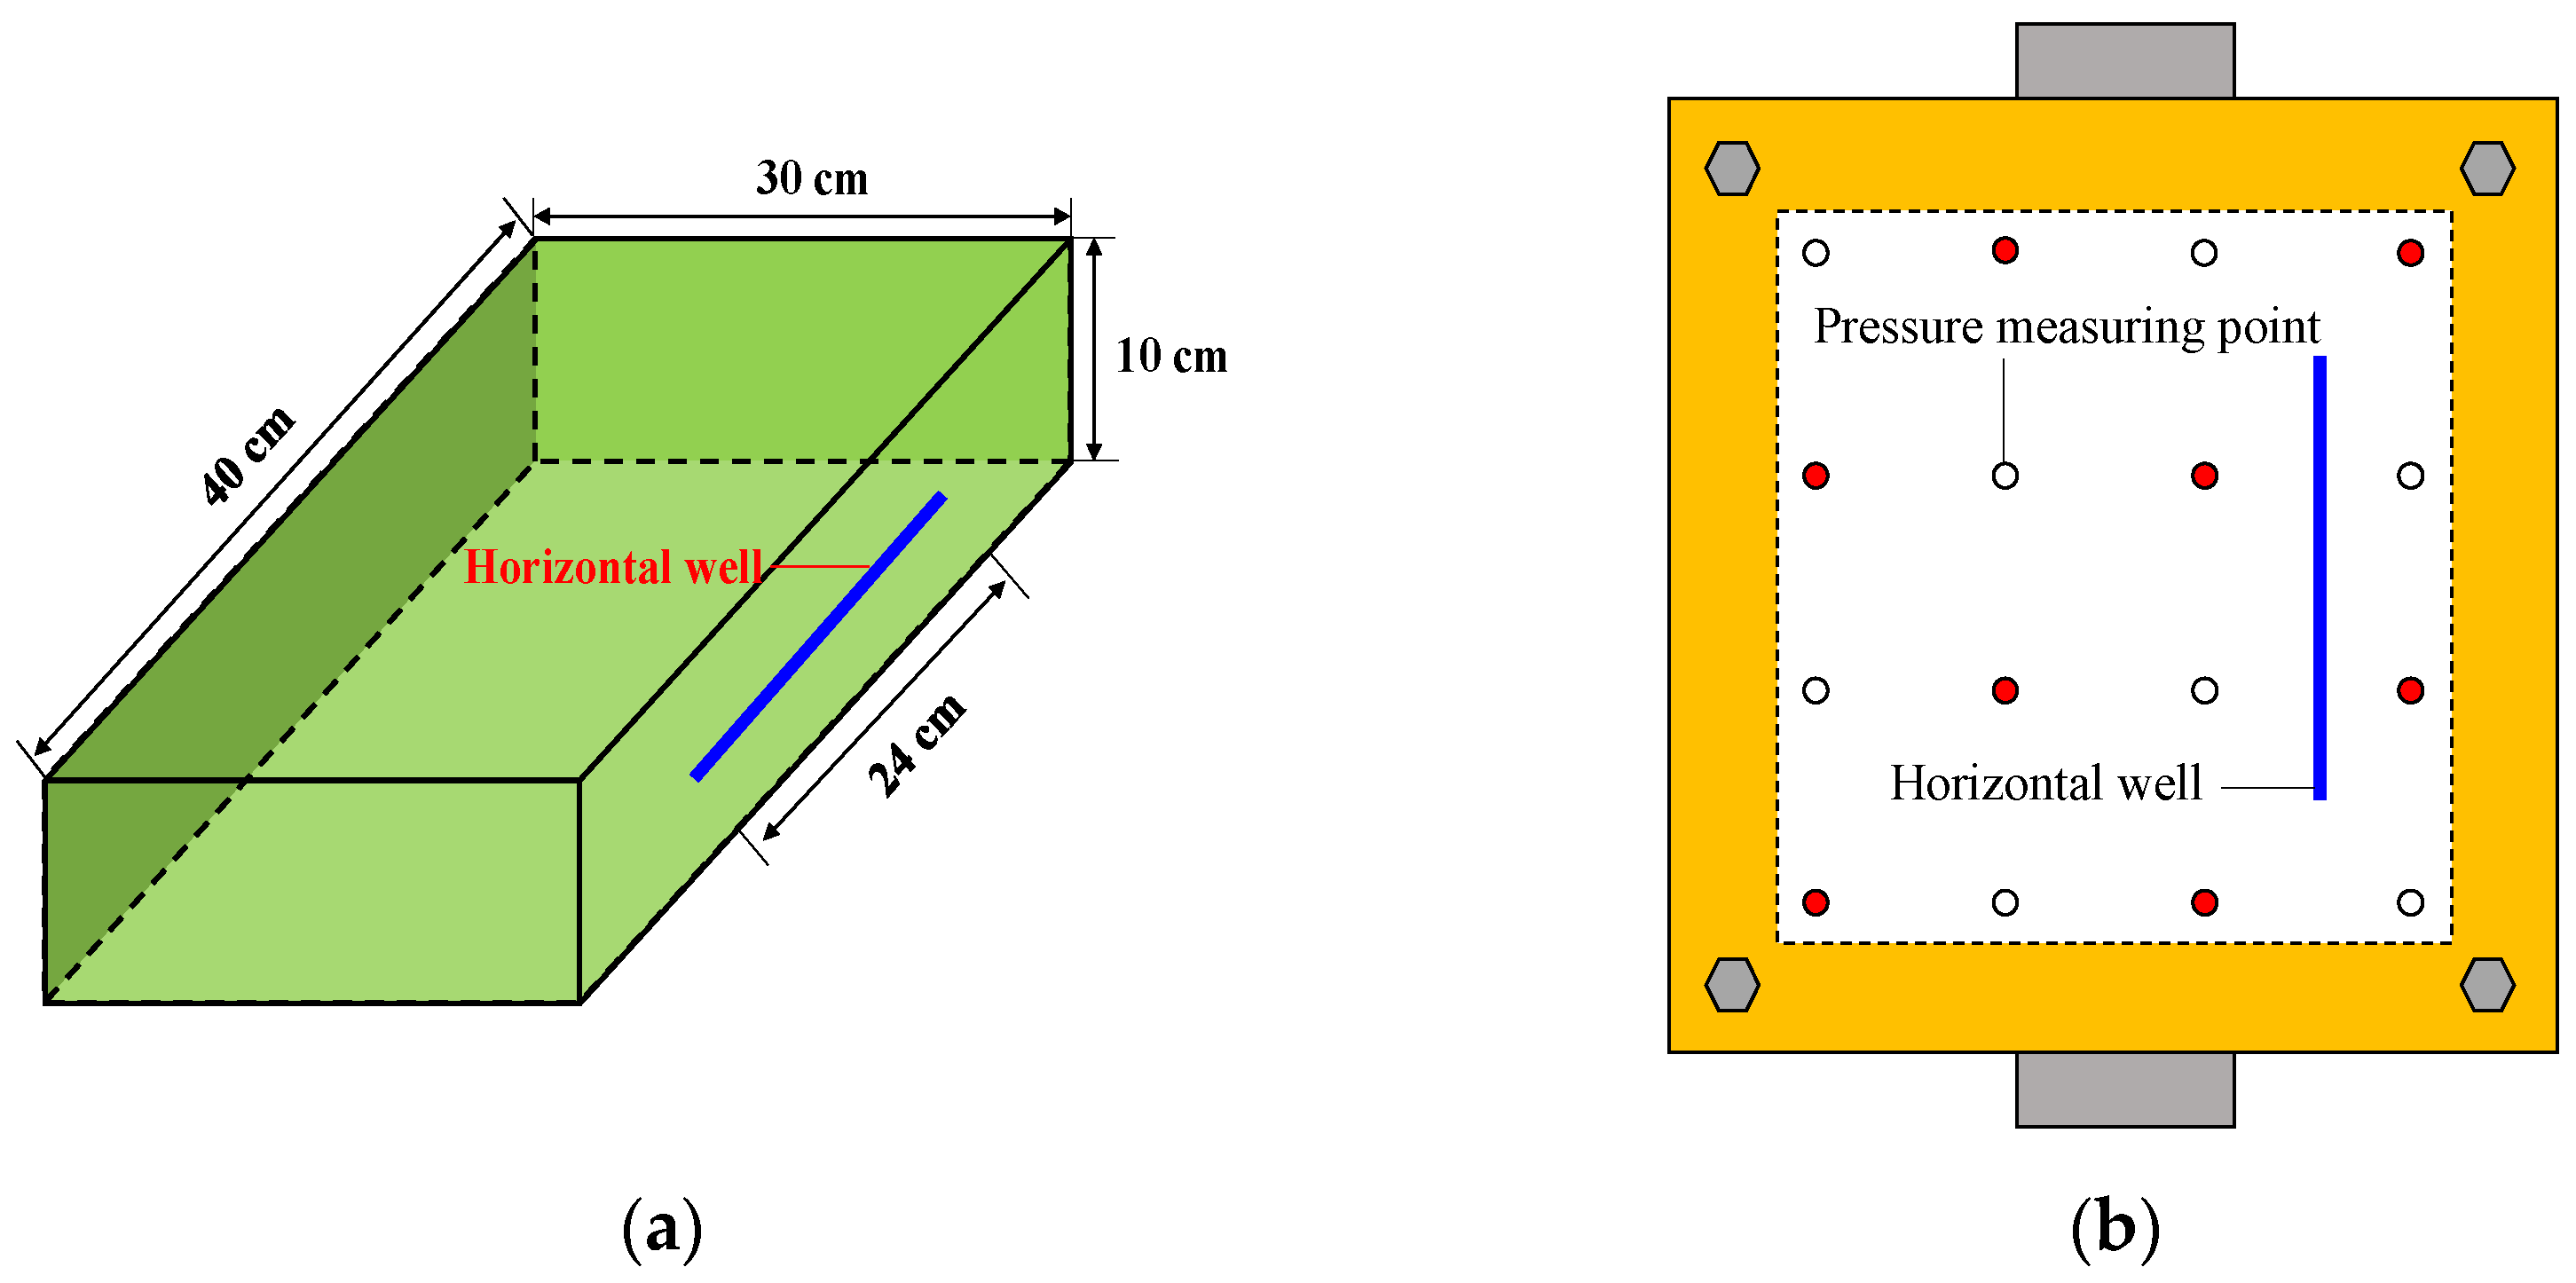
2.1. Design of 3D Huff and Puff Physical Simulation Model

To solve the problems of size limitation of 1D and 2D models, i.e., unknown characterization of production dynamics and seepage laws, a large-scale 3D physical simulation apparatus was designed and constructed to carry out the experimental study of a new CO2 huff and puff mode. The design of the 3D physical simulation model is shown in Figure 1. The size of the huff and puff physical model was 40 cm × 30 cm × 10 cm and its working temperature ranged from 20 °C to 85 °C. It could withstand the pressure of 20 MPa to simulate the high-temperature and high-pressure conditions of the actual reservoir. Sixteen pressure measuring points were distributed on the seal cover of the model and connected to the pressure sensors to realize the real-time monitoring of the pressure field distribution in the model. The 3D physical shale block used in the experiment was sintered with artificial sand filling. According to the porosity and permeability characteristics of the shale oil reservoir, before preparing the large model, a small core was created to measure the porosity and permeability characteristics for formula screening and the final quartz sand ratio was 200 mesh: 350 mesh = 1:3. Then, the 3D model was filled according to the volume proportional enlargement of the above ratio. The filled shale block was drilled and measured and had a permeability of 0.0264 × 10⁻³ μm2 and a porosity of 11%, which was in line with the pore and permeability characteristics of the actual shale reservoir. The manufacturing process of the huff and puff model was as follows: (1) According to the above ratio, quartz sand was weighed, then simulated oil and epoxy resin were added in turn and fully mixed evenly. (2) In order to make the filled 3D model more compact, 80–90 mesh quartz sand was used for rough treatment at the bottom and surrounding walls of the 3D model, and compaction treatment was carried out after filling to 1/2 of the model height. (3) In the experiment, a short pipeline with an inner diameter of 3 mm was used to perforate in sequence to simulate a horizontal well with wireless conductivity. The horizontal well was wrapped with a filter to avoid blockage by quartz sand. The horizontal well was set on the right side of the huff and puff physical model, and the distance between the horizontal well and the right boundary was 7 cm, fixed at 1/2 of the height of the model. (4) The remaining 3D model was filled and pressed with hydraulic tools for 24 h. Next, the pressed core and mold were put into an oven and baked at high temperature for more than 48 h.

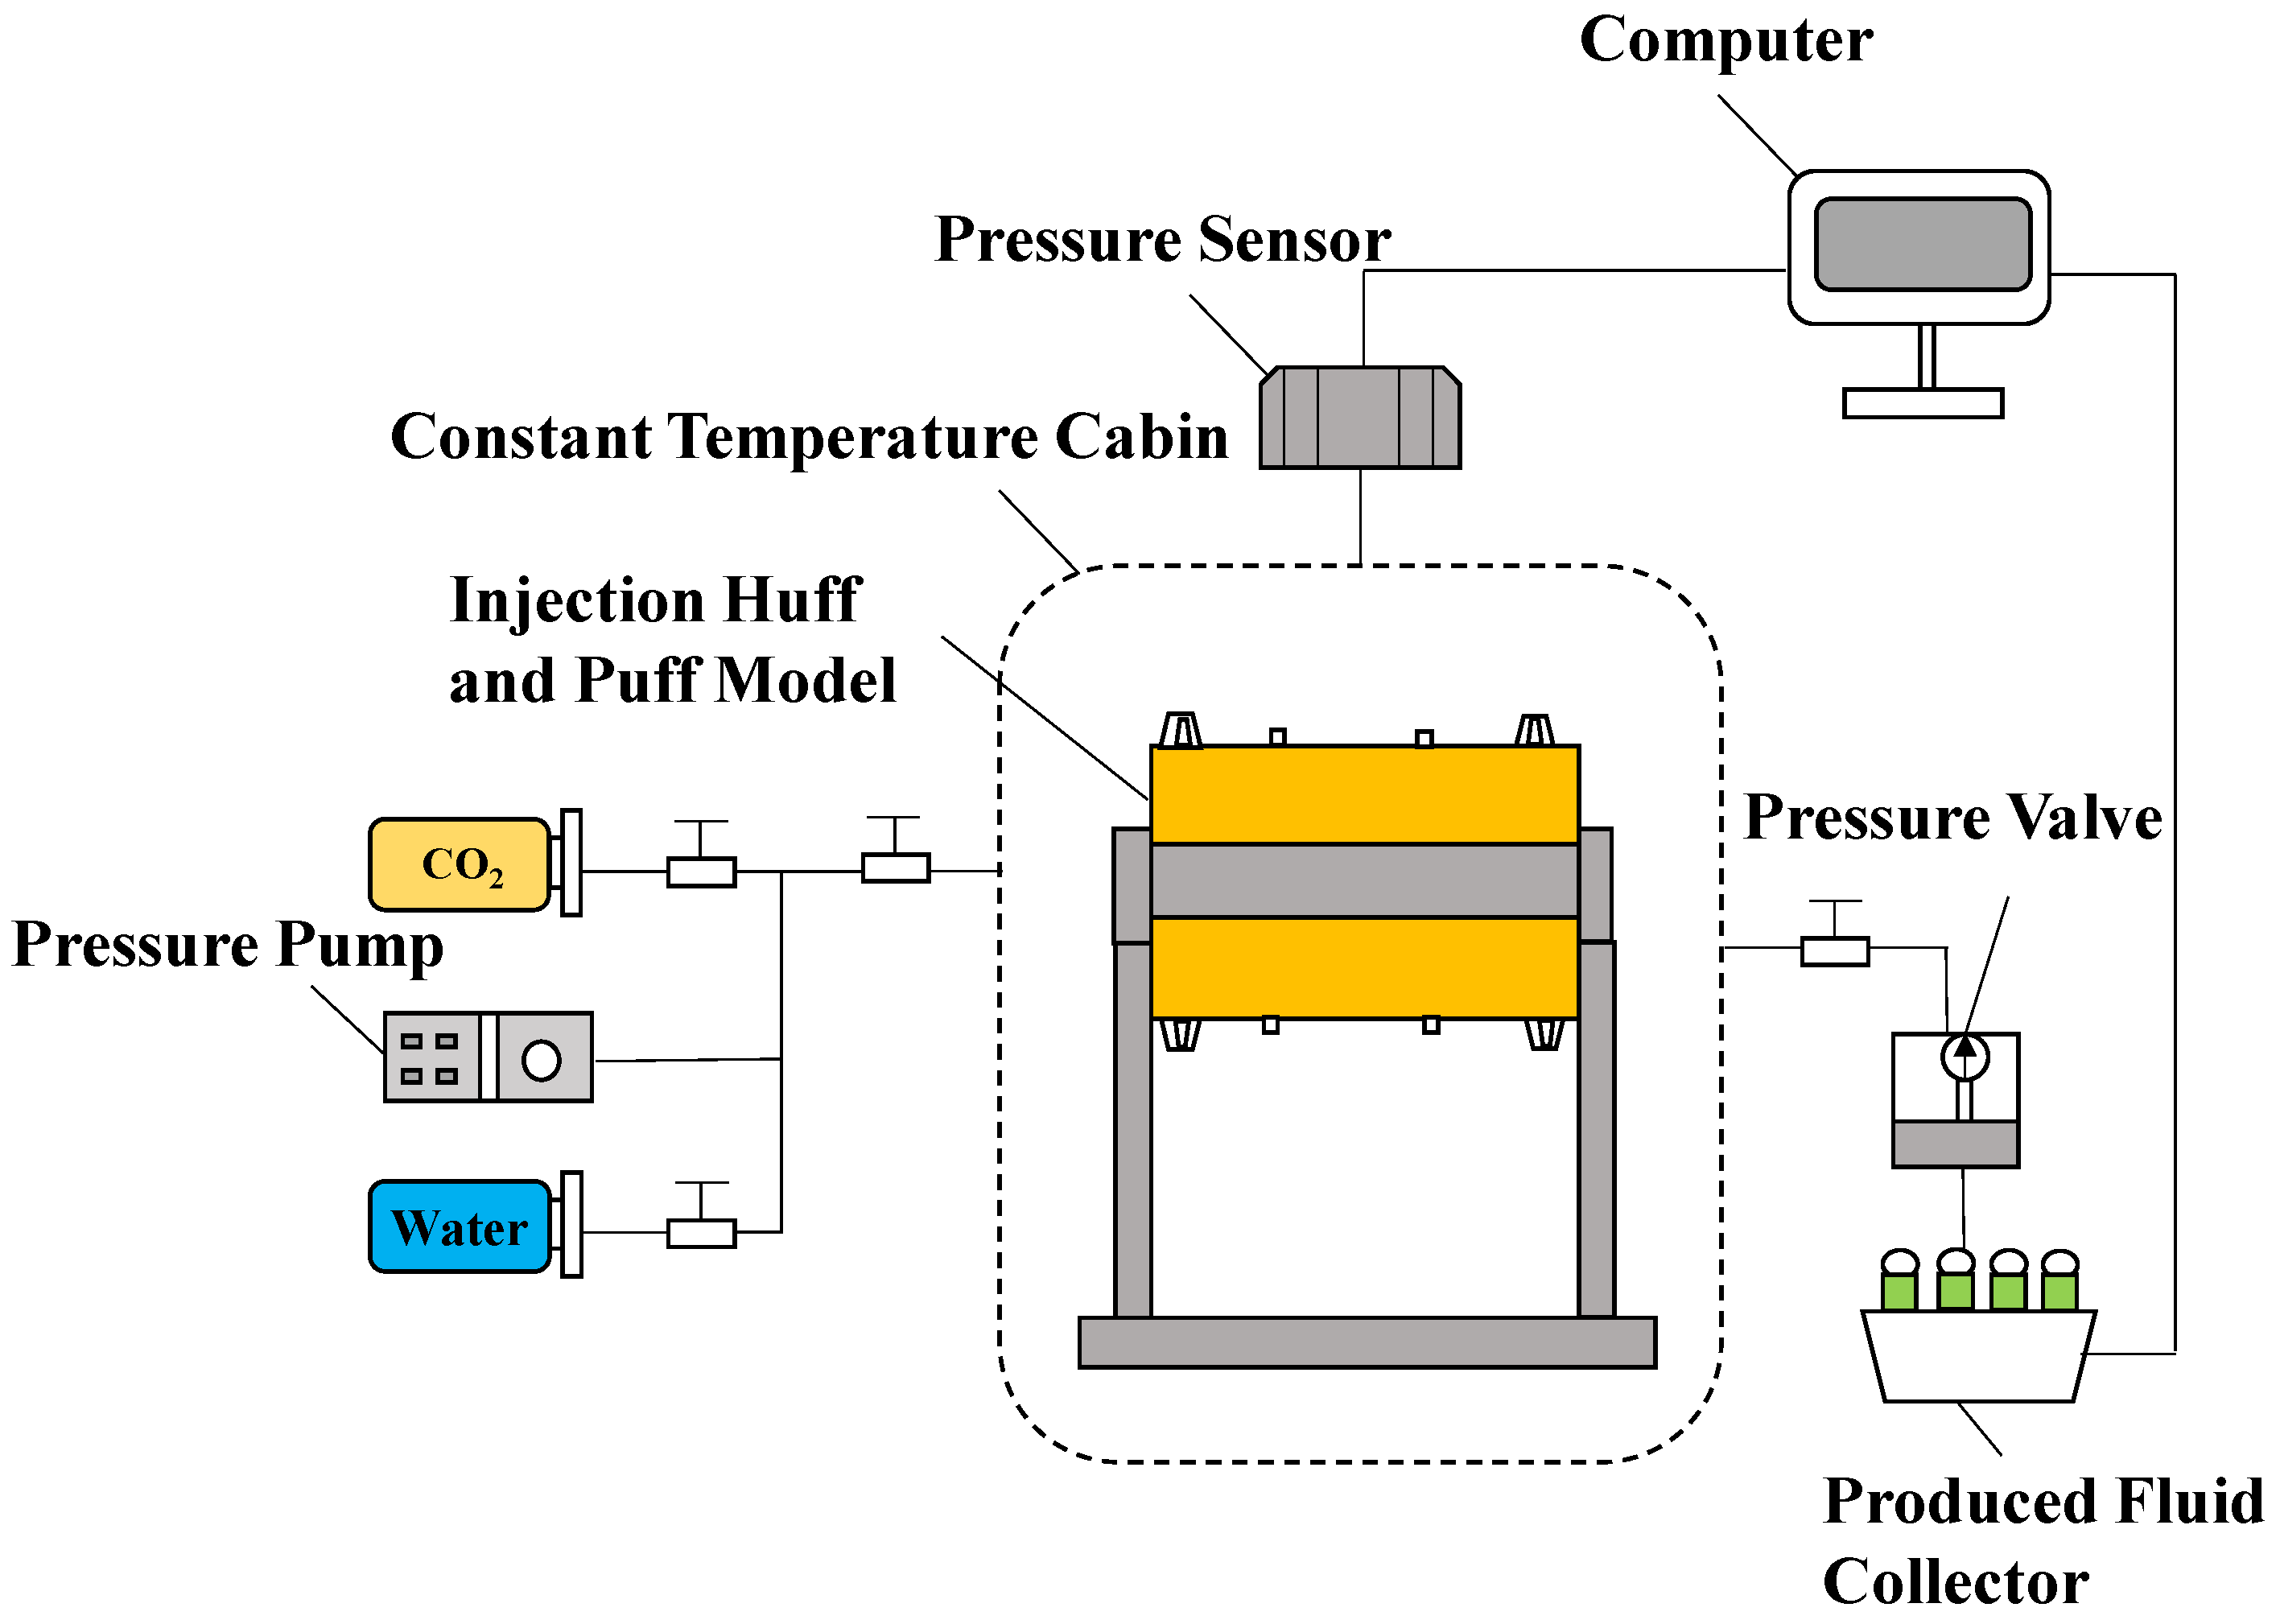
2.2. Three-dimensional Physical Simulation System for Huff and Puff

The 3D physical simulation system is shown in Figure 2. The huff and puff system could simulate the formation conditions more realistically, and the 3D physical model could realize the heterogeneous changes of the reservoir in vertical and plane. The 3D huff and puff physical simulation system consisted of four parts: the driving system, the huff and puff model, the pressure acquisition system and the produced fluid metering system.
The driving system was mainly used to inject CO2 and water into the huff and puff model at a constant speed and quantitatively through a constant pressure pump. The huff and puff model was the core of the 3D physical simulation system. The model could simulate the underground high-temperature condition (temperature ≤ 85 °C) through a constant-temperature experimental chamber. Sixteen pressure measuring points were distributed on the sealing cover according to certain rules, and the upper ends of the pressure measuring points were blocked by blocking screws when the experiment was not being carried out. During the experiment, they were connected to pressure sensors or oil and gas collectors through pipelines to realize multi-point real-time monitoring of the pressure in the model. The pressure acquisition system was composed of a high-precision pressure sensor (pressure ≤ 50 MPa, accuracy ≤ 0.1%) and a computer, which could acquire the pressure data in real time and realized the distribution inversion of the pressure field with a supporting software. The produced end was equipped with a back-pressure valve (pressure ≤ 40 MPa, accuracy ≤ 1%) for experimental back-pressure control, and the produced liquid metering system was equipped with a flow monitor (CX-M3, accuracy ≤ 0.1%) to realize real-time measurement of oil production and oil recovery of the huff and puff process.

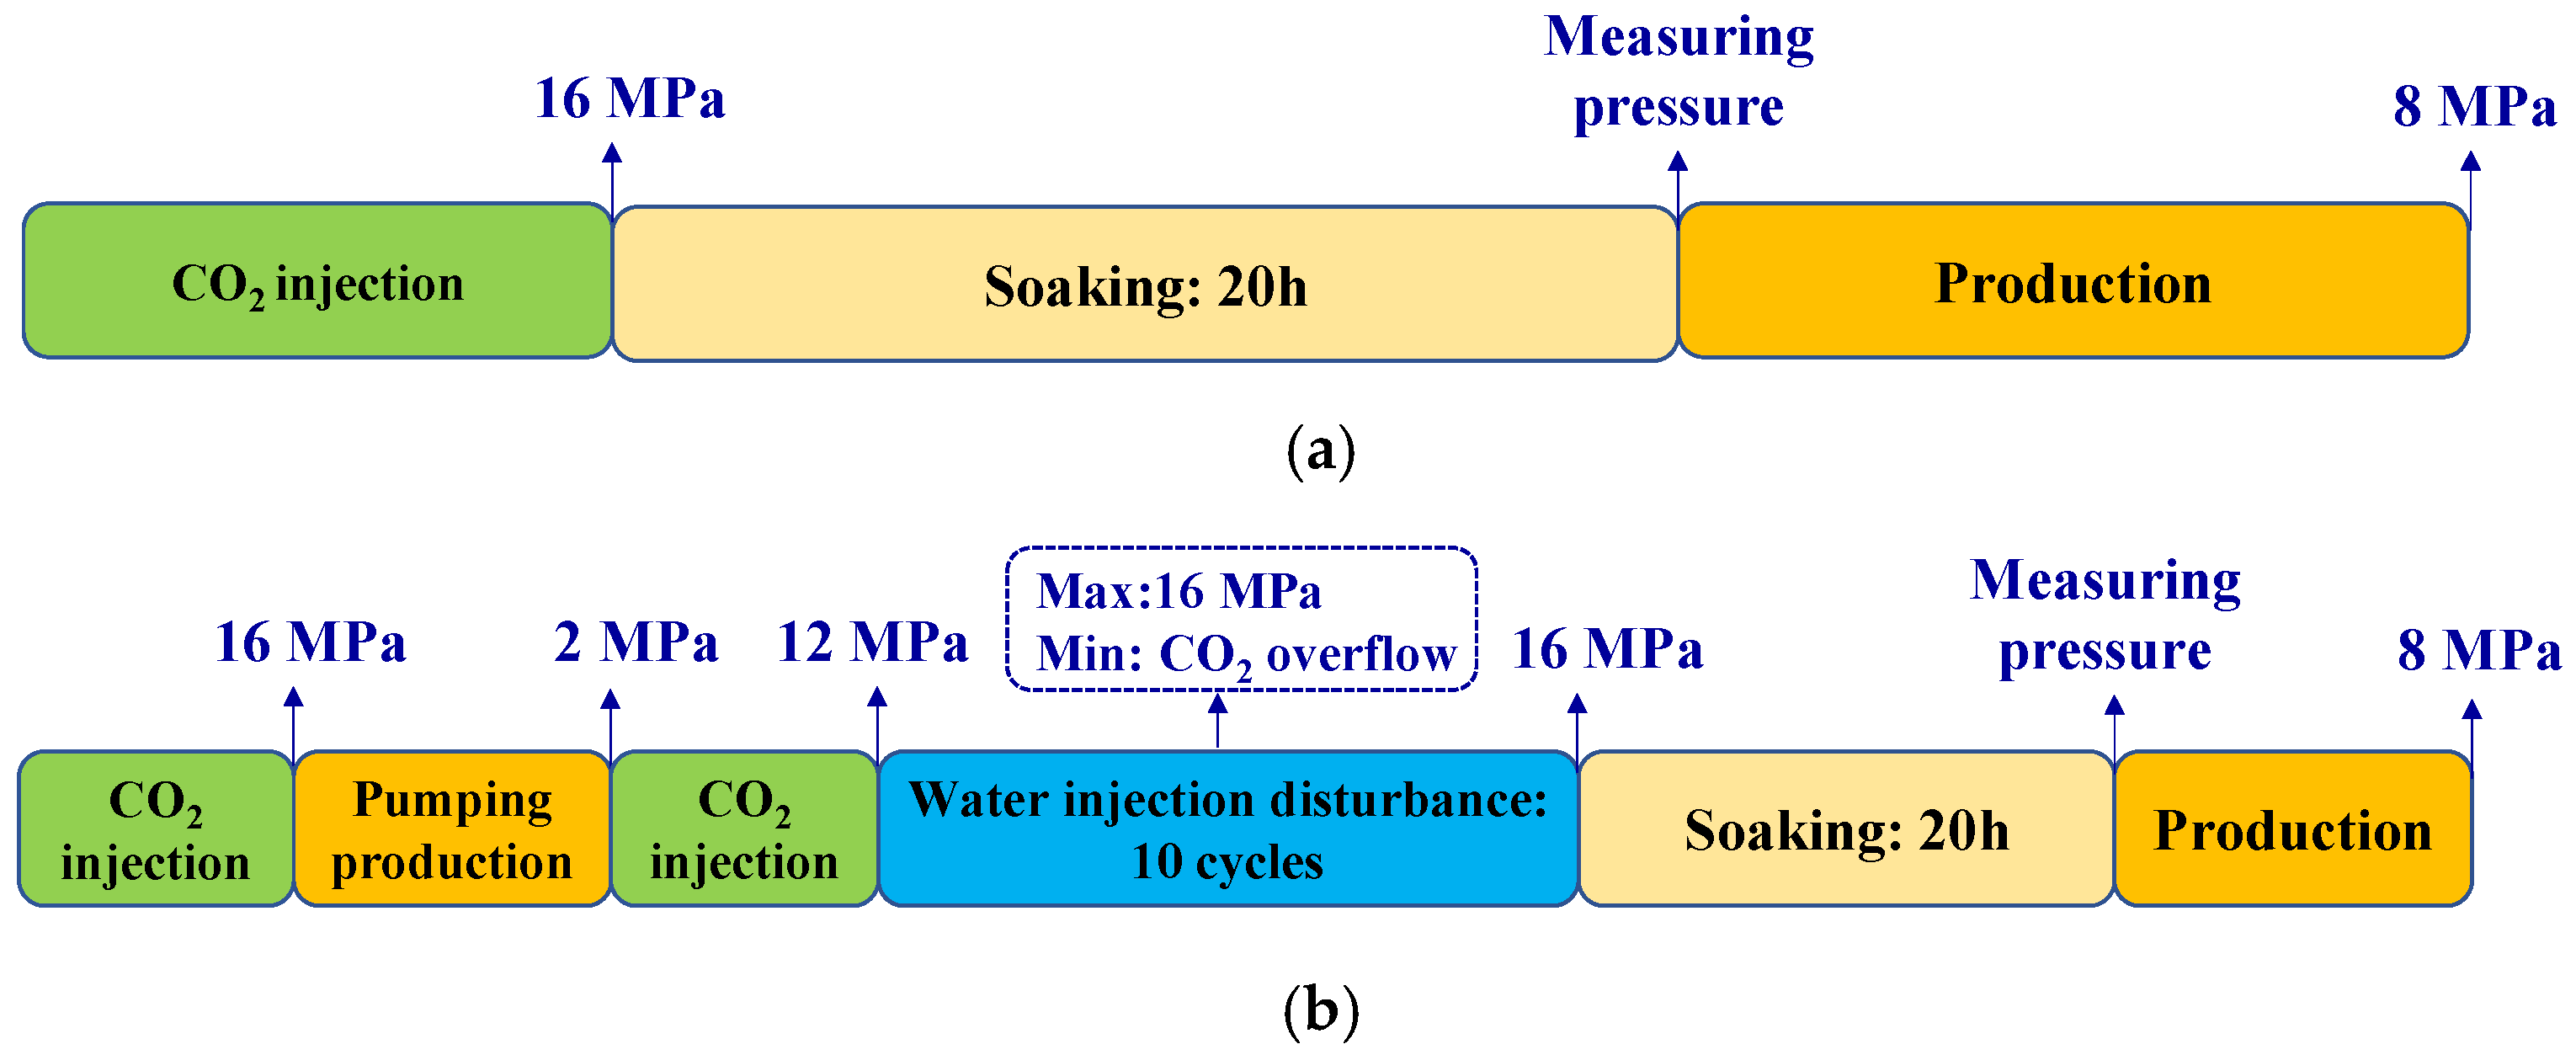
2.3. Huff and Puff Experimental Scenario

Due to the extremely low permeability of shale reservoirs and the formation fracture caused by the rapid increase in water injection pressure in water flooding, CO2 huff and puff is considered to be one of the most effective oil recovery methods in shale reservoirs. Huff and puff is the process of a single well operation, which does not need the connectivity between wells and has more advantages in production operation. However, due to the existence of natural fractures in the formation, the injected gas quickly enters the fracture, resulting in the inefficient gas recovery, thus, affecting the oil production of other production wells around it. The conventional huff and puff process is divided into three stages of injection, soaking and production. In the process of CO2 injection, due to the low permeability of the shale matrix, the displacement pressure takes a long time to spread to the whole formation, while the soaking stage promotes the contact between CO2 and the fluid in the formation, resulting in the expansion of crude oil and the decrease in crude oil viscosity, which makes it easier for the shale oil in the reservoir to flow to the production well. In this paper, based on the conventional CO2 huff and puff method, considering the problems of premature gas breakthrough and low sweep efficiency, a new method of CO2 huff and puff with horizontal well assisted by pumping production and water injection disturbance was developed. The corresponding huff and puff scenario design is shown in Figure 3.

2.4. Experimental Procedures

The complete experimental process included two independent CO2 huff and puff methods, the conventional CO2 huff and puff experiment was case 1, and the new method of CO2 huff and puff assisted by pumping production and water injection disturbance experiment was case 2. The experimental temperature was 50 °C, the viscosity of simulated oil was 2.35 mPa·s and the purity of CO2 used in the experiments was 99.9%. The simulation of the 3D huff and puff experiment included five steps, and the specific operations were as follows:
  • According to the above process, the 3D shale blocks were filled and created, and the small-core coring was carried out to test its porosity and permeability characteristics. When it accorded with the physical properties of the actual shale reservoir, the 3D huff and puff physical simulation experiment system was built in turn. Moreover, the pressure leakage test of the whole equipment was conducted for tightness inspection.
  • If pumping production was set, CO2 was injected from one end of the horizontal well until the injection pressure reached the set pumping pressure of 16 MPa. When the pressure was stabilized, the back pressure was set to 2 MPa and the horizontal well was opened to production. Then, the produced oil was collected with the collection device and the oil production data were recorded through the flow monitor.
  • If there was no pumping production, CO2 was injected from one end of the horizontal well, and the injection was stopped when the set injection pressure of 16 MPa was reached and the pressure change within 4 h was less than 0.1 MPa.
  • If water injection disturbance was required, CO2 was injected to reach a set pressure of 12 MPa, and after stabilization, water was injected through the horizontal well until the injection pressure reached the upper disturbance pressure of 16 MPa. Next, the back-pressure valve was opened to reduce the pressure to the point where CO2 was about to overflow at the wellhead, and then water was injected again to the disturbance upper limit pressure, the above operation was repeated for 10 rounds.
  • Soaking and monitoring of the pressure propagation effect was performed. After 20 h, the back pressure was set to 8 MPa and the horizontal well was opened for production. The pressure change was monitored in real time through the pressure sensors and the volume of produced fluid was also measured at the same time. When no fluid was produced at the outlet, this cycle experiment was stopped.
  • Steps (2)–(5) were repeated for 6 cycles of huff and puff to end the whole experiment.

3. Results and Discussions

Using the above 3D huff and puff physical simulation system, the experiments for conventional CO2 huff and puff and the new method of CO2 huff and puff assisted by pumping production and water injection disturbance were carried out, the pressure field was inverted by the real-time monitoring of the pressure measuring points and the dynamic characteristics of the soaking were analyzed combined with the pressure change curve. The new CO2 huff and puff method was evaluated based on experimental data such as oil recovery and the oil–gas replacement rate.

3.1. Comparisons of Dynamic Characteristics of Soaking

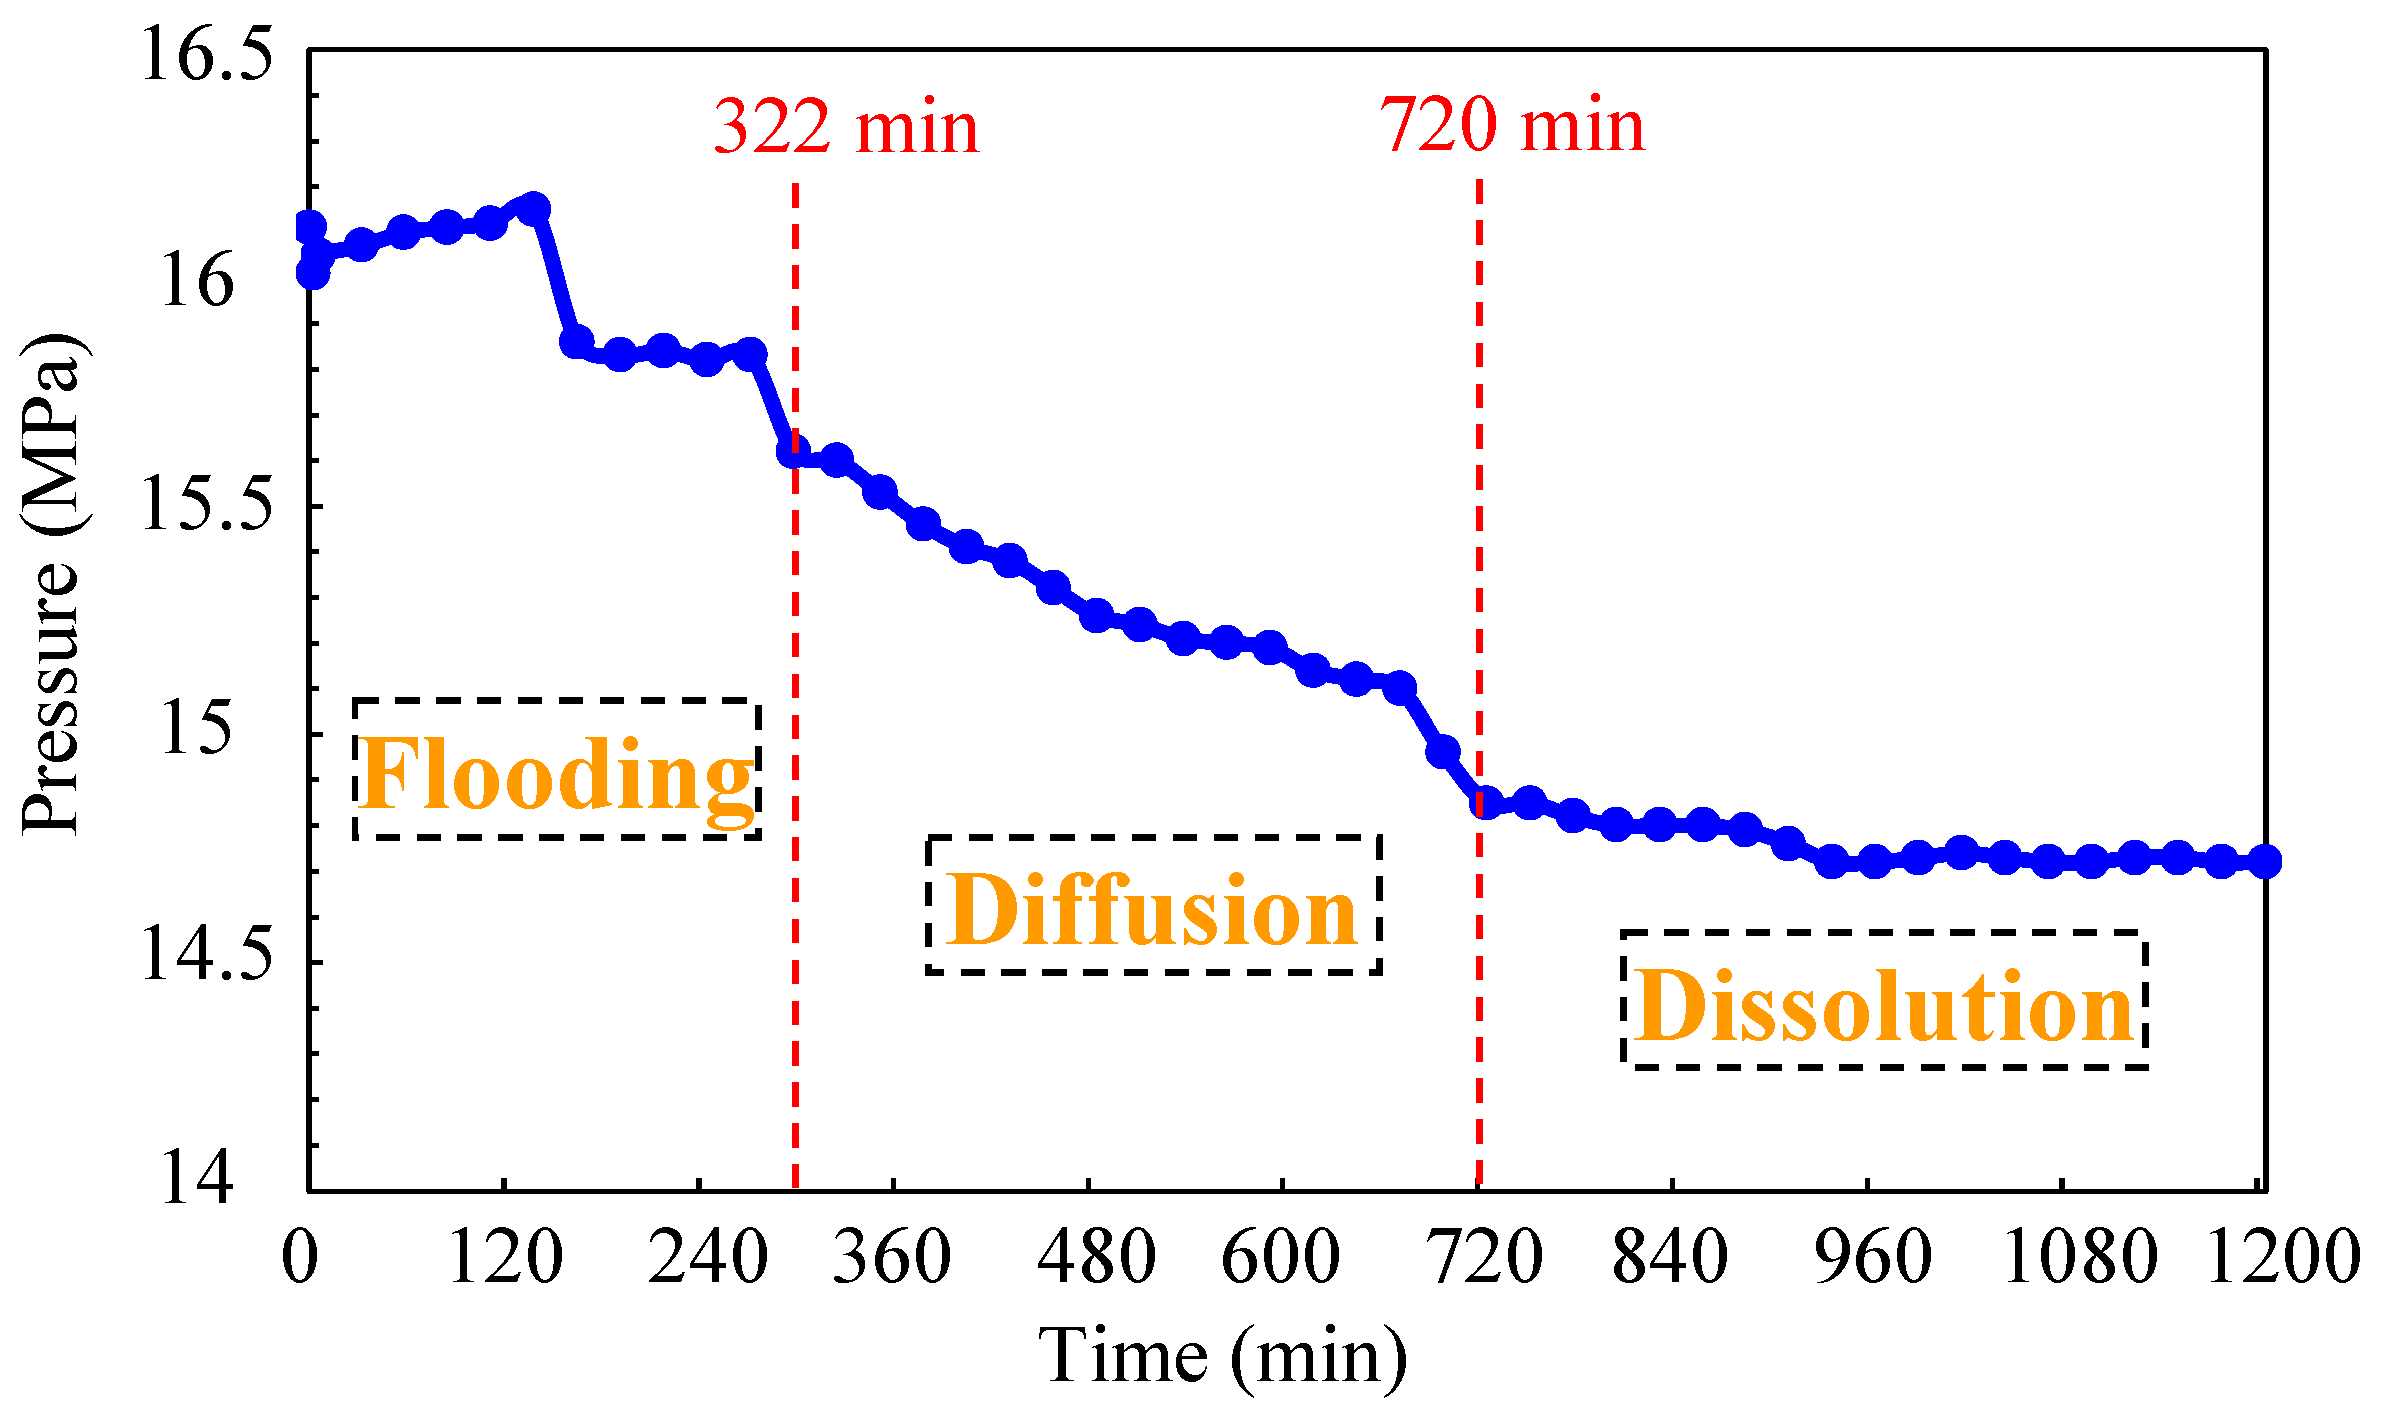
3.1.1. Dynamic Characteristics of Soaking Curves

Figure 4 shows the pressure dynamic curve during the soaking process of case one (conventional CO2 huff and puff). The whole soaking process lasted for 20 h, and the pressure drop process had different laws in different stages. The pressure dynamics curve was divided into three stages by the pressure drop amplitude, the shape of pressure curve and the role of CO2. By observing the pressure drop amplitude, it could be seen that the initial pressure drop amplitude was larger, the pressure drop rate slowed down in the later period and the pressure tended to be stable. By observing the shape of the pressure dynamics curve and the role of CO2, it could be seen that the division of 322 min was based on the pressure drop shape. Before this time, the pressure dropped in a stepped manner. After this time, the pressure dropped regularly and decreased linearly at a constant speed. The characteristics of the three stages were as follows. In the initial stage of soaking (0–322 min), after CO2 was injected to 16 MPa, the pressure first increased slightly, and subsequent pressure showed a stepped drop. In this condition, the pressure difference between the near-well zone and the far-well zone was large, the injected CO2 mainly relied on the power of the pressure difference to move forward, and at the same time, due to the heterogeneity of the formation, the pressure showed a step-like irregular decrease. The pressure drop in this section depended on the displacement pressure difference to cause the fluid flow, so it was the pressure difference driving stage. In the middle period of soaking (322–720 min), the pressure showed a relatively regular linear decrease. At this time, the CO2 had basically formed a seepage channel under the action of the pressure difference, so the diffusion and advancement of the fluid was relatively uniform, and the pressure difference in the model gradually decreased in this stage. Under this circumstance, the pressure propagation mainly relied on the diffusivity of CO2. In the later stage of soaking (720–1200 min), the pressure did not drop significantly, showing a gradual and stable trend. At this stage, the pressure in the model was gradually balanced, and the fluid flow was basically stopped. This stage mainly depended on the dissolution of CO2 in the oil phase, so it was the dissolution-driven stage.
Figure 5 shows the pressure dynamic curve during the soaking process of case two (CO2 huff and puff assisted by pumping production and water injection disturbance). The phase before 98 min was the pumping production period, the pumping production was a process of forced oil extraction through pumping energy and increasing production intensity. In the experiment, a large production pressure difference (14 MPa) was set for the transfer pump, and the valve was opened by controlling the pump. The pressure drop in the initial stage of the pumping process decreased greatly, and then slowed down slightly, and the pressure drop increased further at the end of the pumping process. The phase of 98–530 min was the water injection disturbance period, ten disturbance rounds were set, the upper limit of the disturbance amplitude was 16 MPa and the lower limit was controlled to the pressure when CO2 just overflowed the wellhead boundary, which ensured the maximum disturbance amplitude. The lower limit pressure after each disturbance round was recorded, and the average lower limit pressure of water injection disturbance was 10.743 MPa. Due to the tightness of the reservoir, the pressure rose rapidly during the water injection period, which provided a strong boost to the CO2 injected in the early stage, so that it could continuously interact with the crude oil and accelerate the pressure propagation. After 530 min, it was a conventional soaking process. Compared with case one, the initial soaking pressure was relatively stable, and the final pressure was stable at 14.92 MPa due to the subsequent decrease in CO2 dissolution and diffusion pressure.

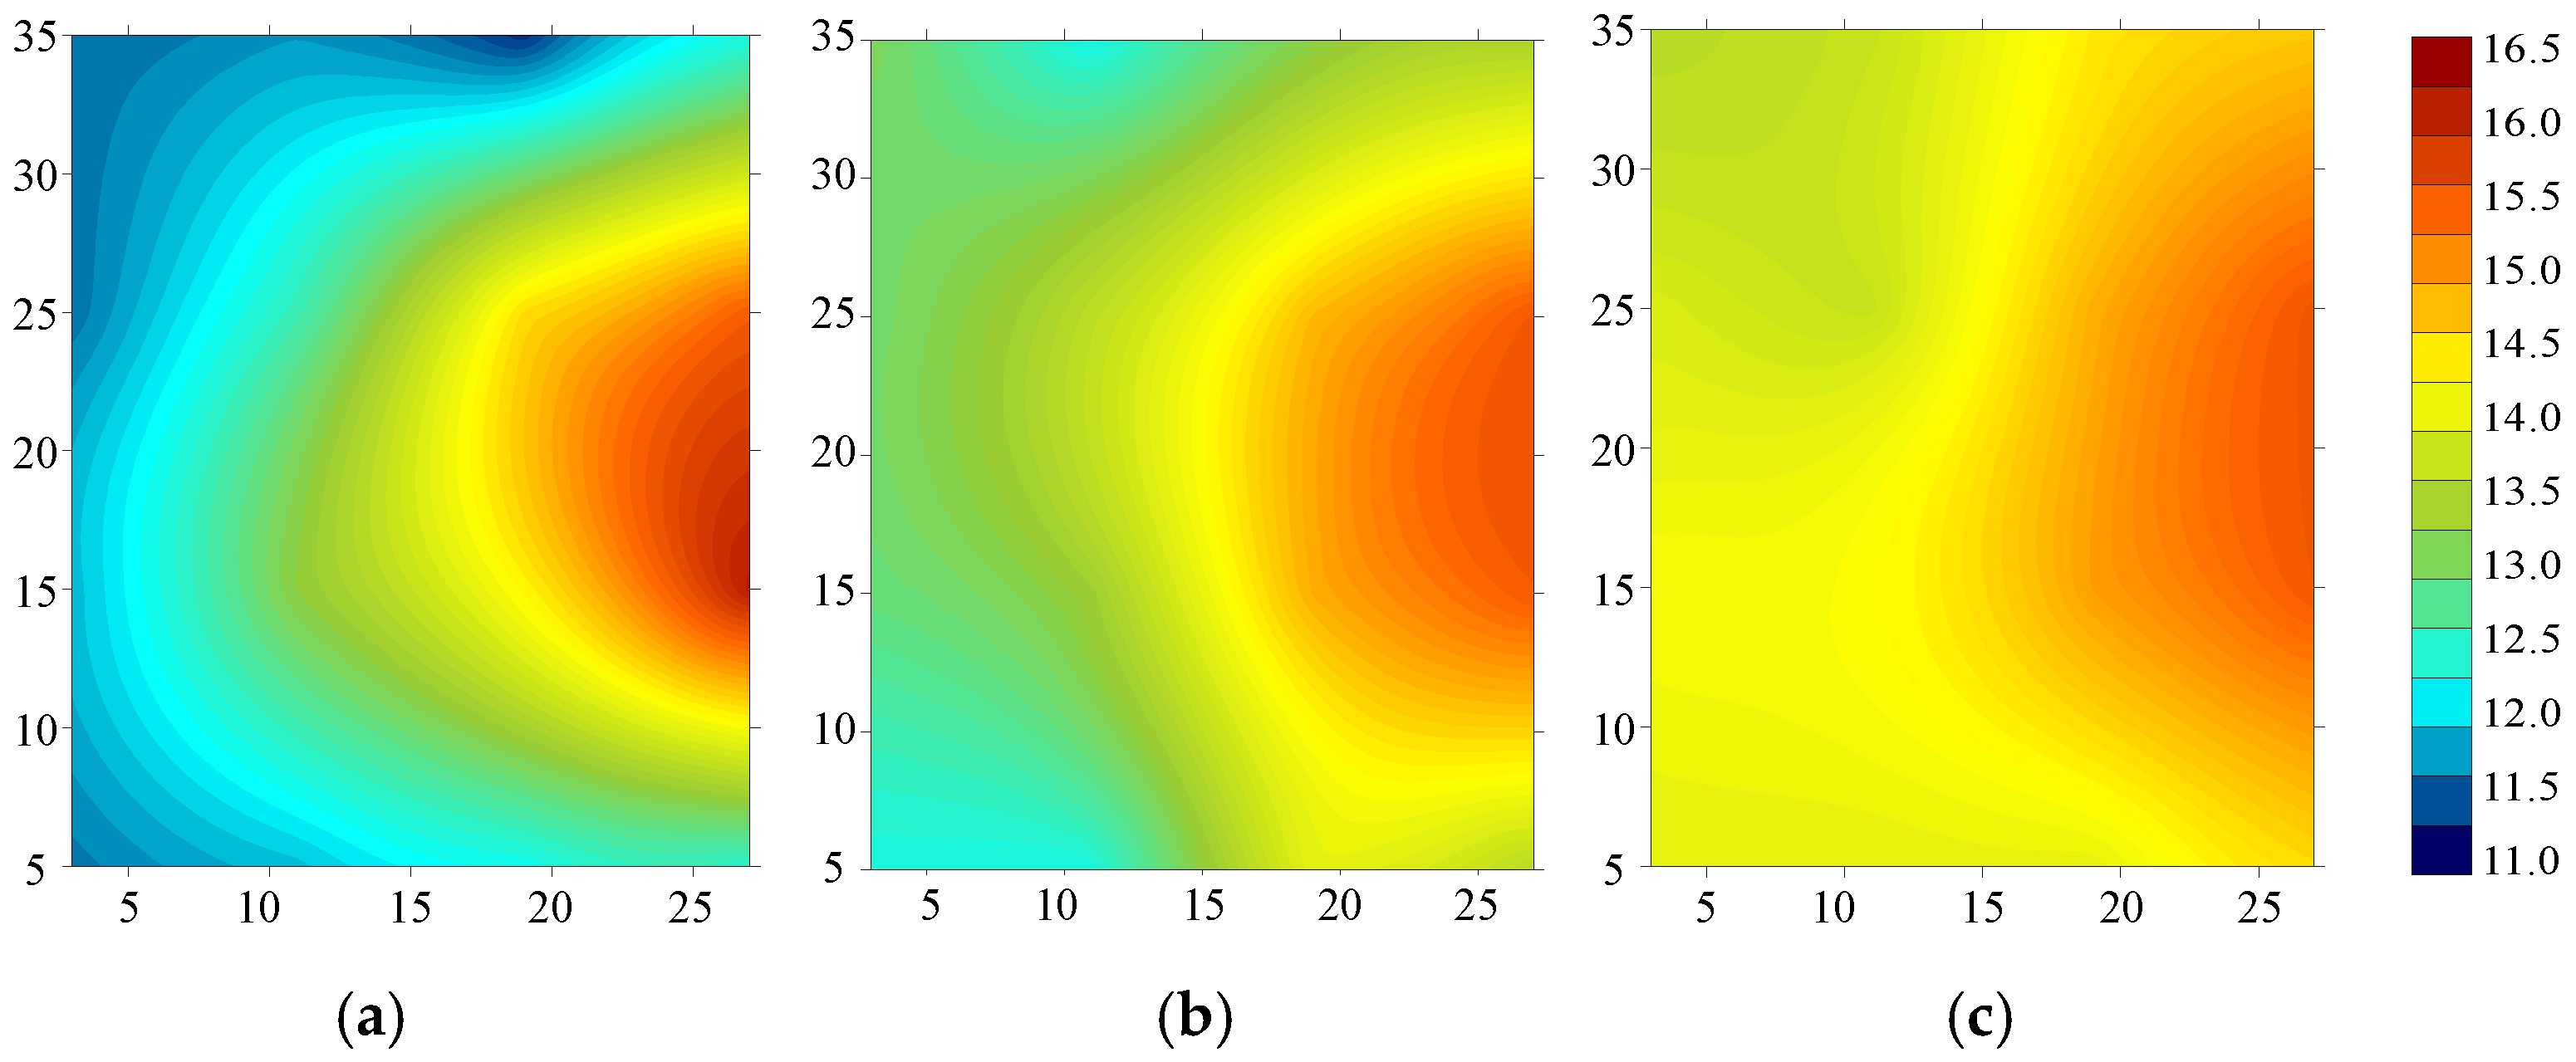
3.1.2. Dynamic Distribution of Pressure Field in Soaking

In this experiment, based on the 3D huff and puff multi-point physical simulation apparatus, the real-time monitoring of the pressure data during the soaking process was carried out. At the same time, the data were transmitted to the computer, then, the pressure field diagrams were obtained by converting the pressure data into the pressure field using Surfer. The model pressure at 10 min, 5 h and 10 h of the soaking was obtained. Figure 6 shows the pressure field distribution diagram of the soaking in case one. When the model was soaked for 10 min, it corresponded to the initial stage of soaking. It could be seen from the pressure field diagram that the pressure difference in the model was large (approximately 5 MPa), and a large amount of injected CO2 accumulated in the area near the wellbore. Because the breakthrough channel of CO2 was not established, it was difficult for the pressure to spread to the far-well area. When the model was soaked for 5 h, the soaking stage was between the initial and middle stages. Compared with the initial stage, the differential pressure driving fully played a role; CO2 took the lead in the breakthrough from the dominant channel at the bottom of the well, diffusing from the high-pressure area to the low-pressure area; and the gas flooding range was pushed forward in a conical shape. When the well was soaked for 10 h, it was between the middle and late stages of soaking. At this time, the pressure in the model was further balanced. Compared with the middle period of the soaking, CO2 broke forward from the middle of the model. CO2 was mainly carried forward by diffusion.
Figure 7 shows the pressure field distribution of case two during soaking for 10 min, 5 h and 10 h. After soaking for 10 min, the pressure difference between the near-well zone and the far-well zone was still obvious (approximately 4 MPa), but compared with that of case one, the pressure difference was obviously reduced, and the pressure propagation range of the case two scheme was obviously expanded, indicating that the pressure propagation speed was further accelerated after the water injection disturbance. When soaking for 5 h, the pressure difference between near and far wells gradually decreased compared to that for 10 min. Compared with case one, the effect of CO2 propagation to the far well was more obvious, and the pressure propagation boundary of the case two scheme was more uniform, which indicated that the water injection disturbance expanded the spreading range of CO2 at the model boundary, so that its seepage channel was no longer single. Compared with case one, the pressure distribution in the case two model was more balanced, the pressure propagation boundary was obviously enlarged when the well was soaked for 10 h and the pressure in the near-well zone was higher than that in case one, which indicated that the average formation energy was increased at this time, which was conducive to storing energy for the reservoir, thus, promoting oil production in the development stage.

3.2. Development Effect Evaluation of CO2 Huff and Puff Models

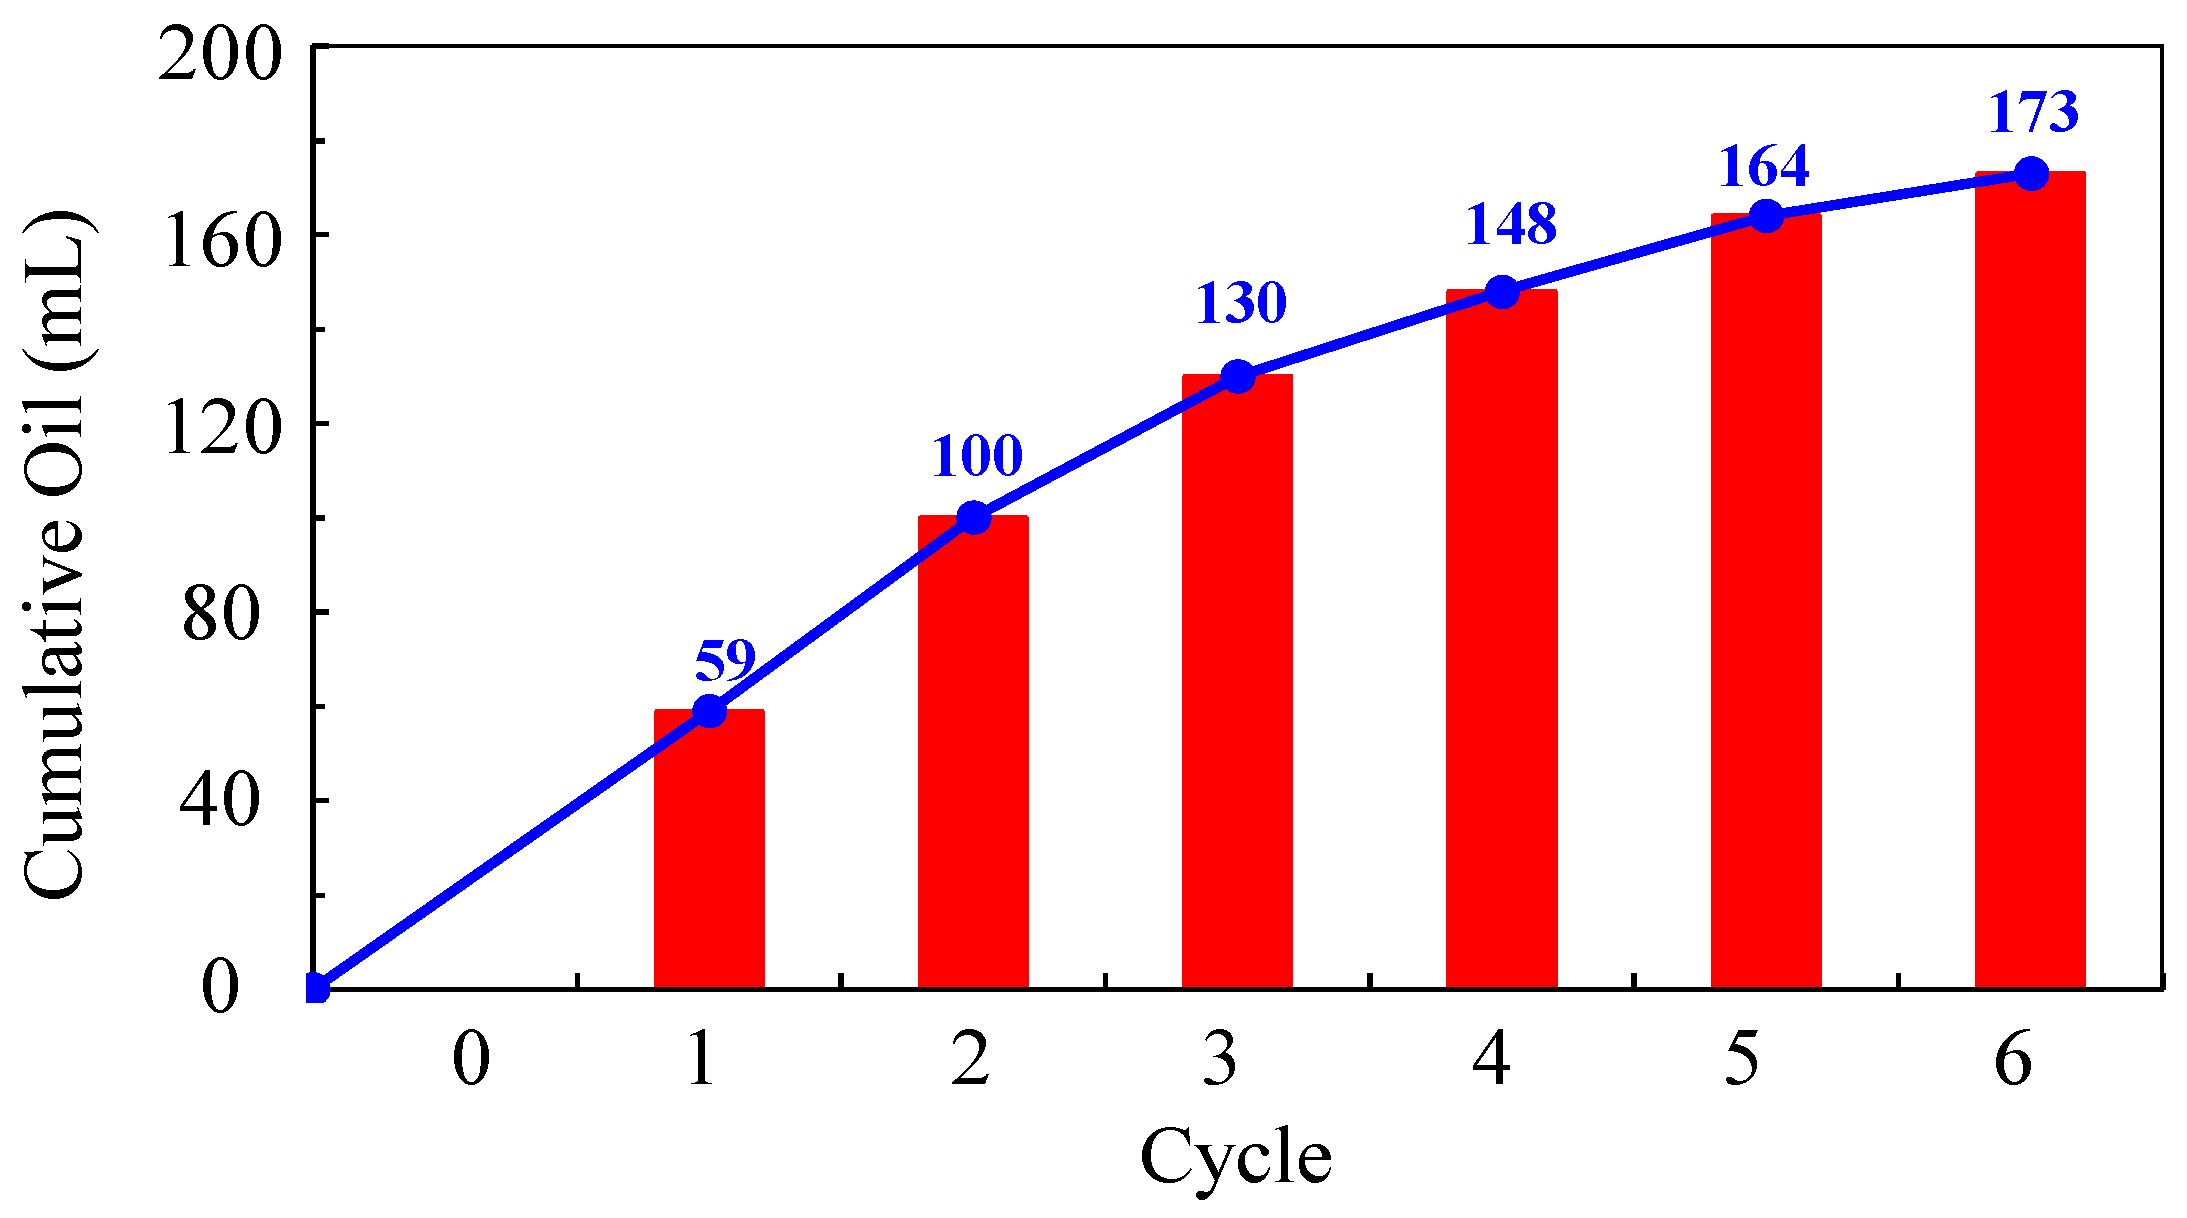
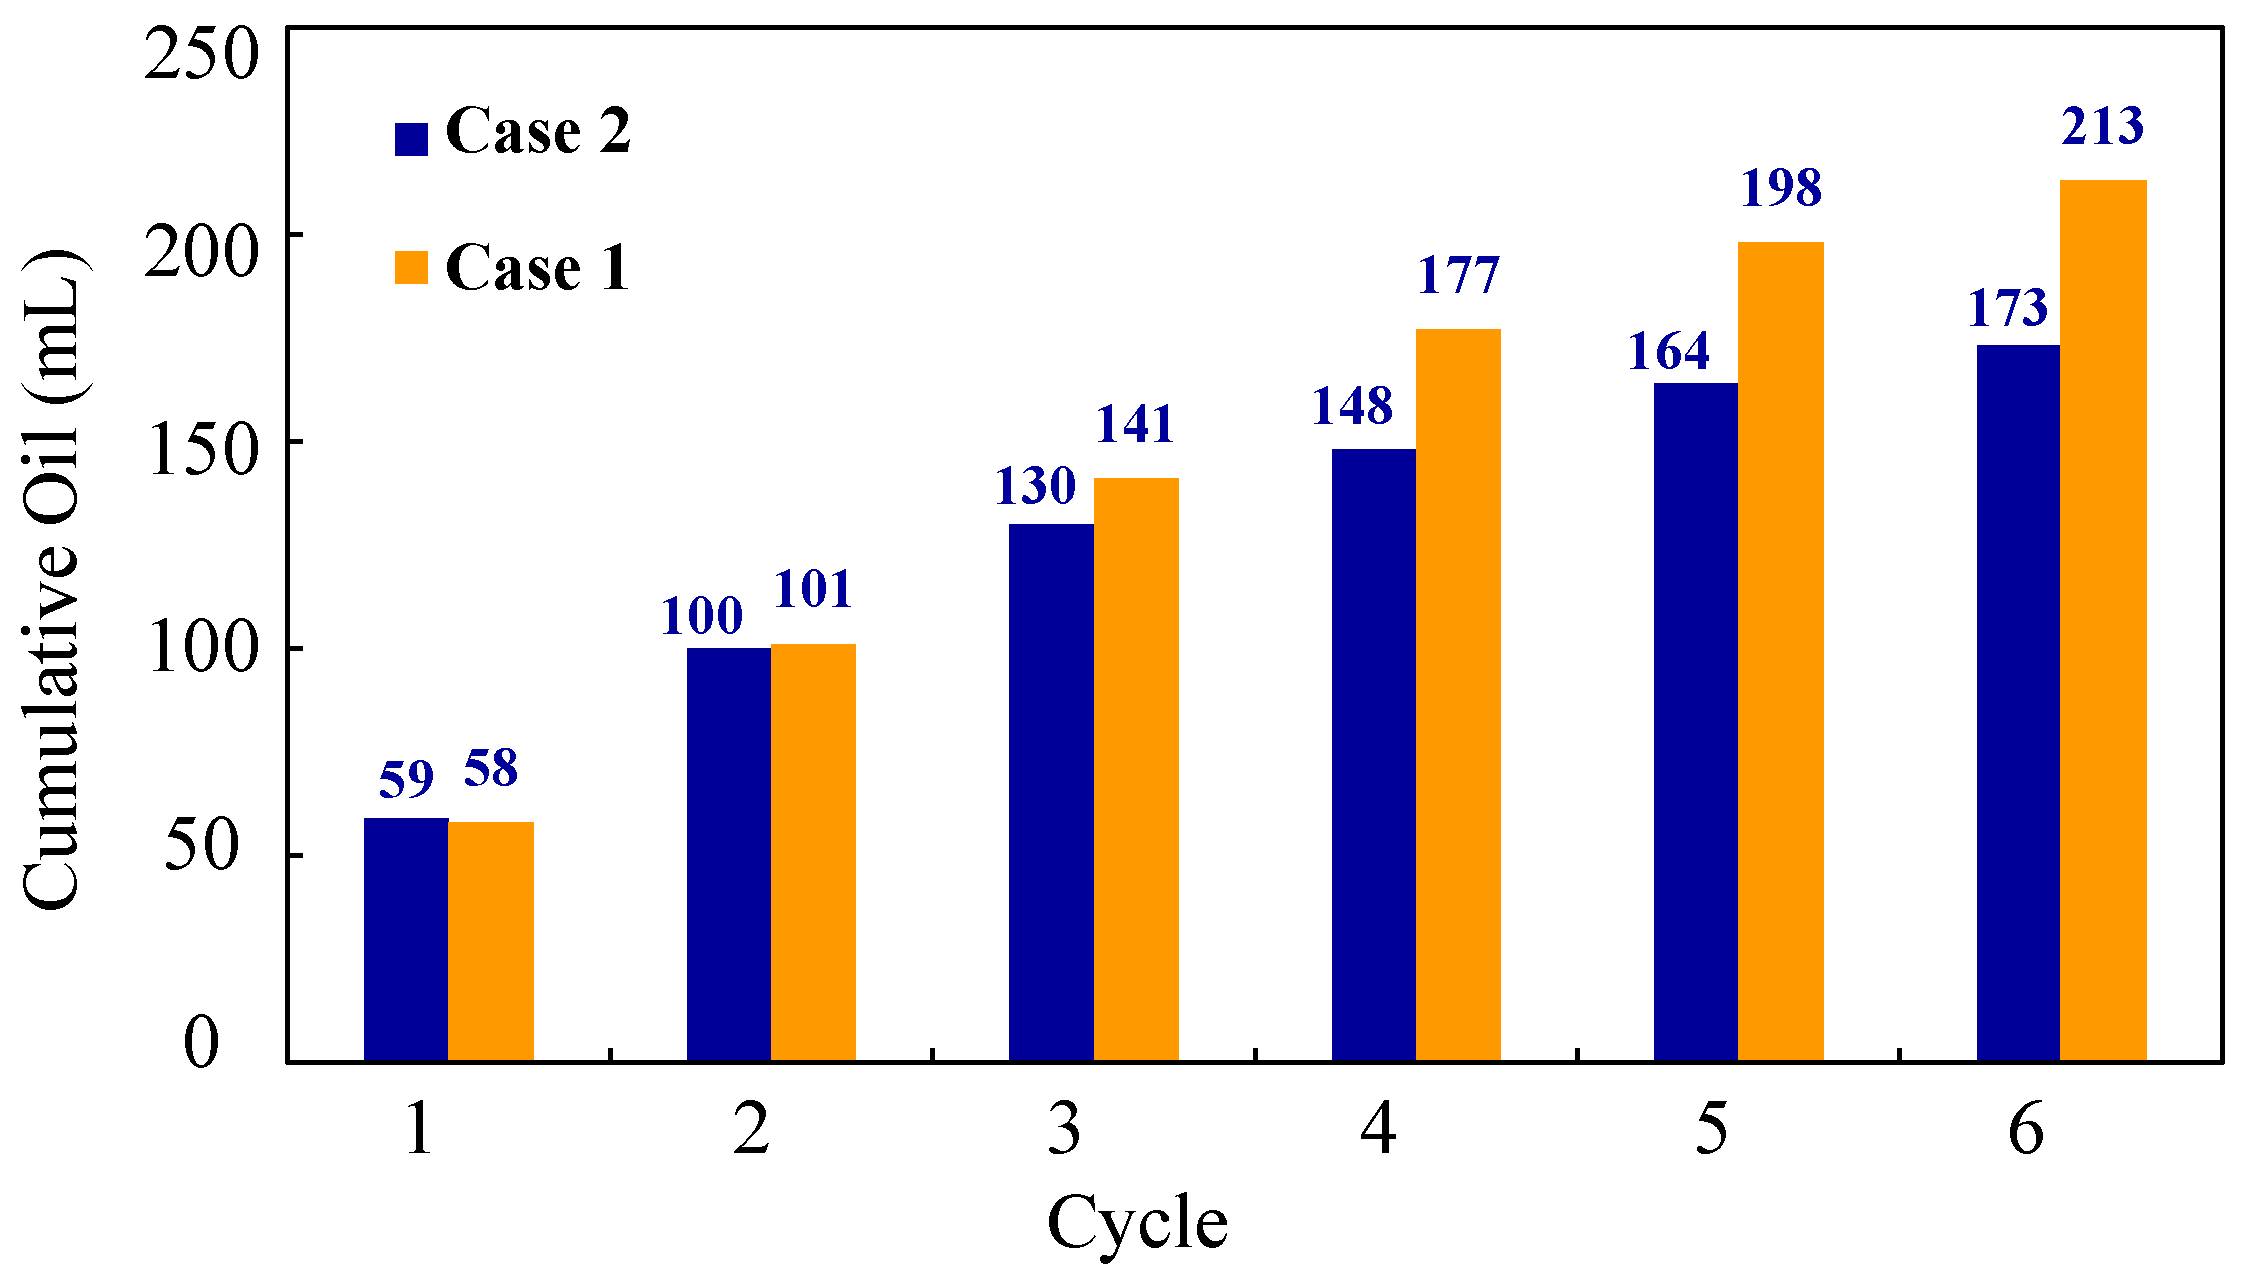
3.2.1. Comparisons of Cumulative Oil Production

The cumulative oil production of each cycle of case one is shown in Figure 8. It could be seen from Figure 8 that the increase in the oil production of each cycle gradually decreased with the increase in huff and puff cycles, and the main oil production was concentrated in the first three cycles. The average oil production per cycle of the first three cycles was approximately 40 mL, accounting for 75.14% of the total oil production, indicating that the production energy in these three cycles was relatively enough and a stable supply of crude oil could be maintained. After four cycles of huff and puff, the oil production per cycle was approximately 14 mL, and the increase in oil production gradually became stable. The reason was that after a long period of soaking, CO2 quickly occupied the large pores in the reservoir. Under the action of CO2 flooding, the crude oil in front of CO2 flooding was driven and accumulated, which greatly increased the oil saturation of this part. After a large amount of CO2 flowed back into the production stage, the remaining oil in the near-well zone fully reacted with CO2 and expanded. At this time, under the production pressure difference, the previously injected CO2 and the expanded crude oil were reversely displaced to the wellhead and quickly flowed to the production well, which greatly improved the recovery degree of crude oil. In the subsequent cycles, the easily displaced crude oil in the macropores was extracted, while the small pores in the matrix were difficult to be affected by CO2, leaving only the remaining oil and CO2 in the macropores, and the oil production was gradually decreased.
Figure 9 shows the comparison of cumulative oil production of each cycle between case one and case two. It could be seen that the cumulative oil production law of the case two scheme was basically the same as that of case one, the oil production was concentrated in the first four cycles. For case two, the cumulative oil production of the first four cycles accounted for 83.11% of the total oil production, and the subsequent cycles provided less oil production. It could be seen from the comparison between the two cases that in the first three cycles, the oil production of the two cases was not much different (the difference was within 10 mL), but from the fourth cycle, the oil production of case two gradually rose and obviously exceeded that of case one, and the oil production difference in the subsequent cycles was approximately 30 mL on average, indicating that the oil production of the subsequent cycles could be obviously promoted by pumping production and water injection disturbance, which was equivalent to increasing the production cycle of the CO2 huff and puff development.

3.2.2. Comparison of Oil Recovery and Oil–Gas Replacement Rate

After six cycles of CO2 huff and puff, the production fluid metering system was used to measure the oil production and recovery factor in real time during the huff and puff process. As shown in Figure 10, the recovery factor (RF) increased rapidly in the first four cycles, indicating that the oil recovery capacities in these cycles were relatively strong. For case one and case two, its contribution to the total recovery rate reached 85.54% and 83.34%, respectively. The final recovery factor of case one (conventional CO2 huff and puff) was 16.11%, while that of case two (CO2 huff and puff assisted by pumping production and water injection disturbance) was 23.29%. Compared with conventional CO2 huff and puff, the developed new method of CO2 huff and puff assisted by pumping production and water injection disturbance could increase the recovery factor by 7.18%. This method could promote the contact and interaction between CO2 and crude oil, and circulate it to increase the formation energy, thus, effectively prolonging the development cycle. It was an effective technology to improve the oil recovery of shale reservoirs, and the results proved the potential of CO2 huff and puff assisted by pumping production and water injection disturbance to improve the oil recovery.
Figure 11 shows the recovery factor and the oil–gas replacement rate under these two cases. The oil–gas replacement rate under the two cases was 0.4523 and 1.2728, respectively, and the value of case two was significantly higher than that of case one. The water injection disturbance realized the combination of gas injection energy enhancement and water injection energy enhancement, water could replace CO2 to supplement part of the energy of the formation, so the CO2 injection volume was greatly reduced, and the gas injection utilization rate was improved. At the same time, water could control the flow rate of CO2 in the formation, so that the CO2 flooding distance was longer, and the economic cost was effectively controlled while increasing the spread area.
The problem of conventional CO2 huff and puff was that the gas was easy to break through prematurely along the high-permeability channel and quickly entered the vicinity of the production well, resulting in inefficient utilization and development of the gas, thereby affecting the recovery factor. To delay gas channeling, Christensen et al. took the lead in using the WAG method to conduct test experiments and received good results [29]. Zahoor et al. conducted a comprehensive evaluation of the WAG method and found that WAG flooding could increase the recovery by approximately 5% [30]. In this article, we developed a new method of CO2 huff and puff assisted by pumping production and water injection disturbance. Compared with simple gas injection, the gas flow rate could be controlled after water injection. The displacement front of the gas affected the pressure fluctuation boundary, which transformed it from a conical shape to an elliptical shape, which made the pressure boundary more stable. Moreover, the process of disturbance realized the seepage interaction of heterogeneous reservoirs. According to the pressure field distribution diagram of case two, the pressure distribution was more uniform after disturbance, and the pressure sweep rate was greatly increased. The fluid was redistributed under the influence of disturbance pressure, and spread to the previously unaffected area, which was beneficial to the exploitation of crude oil in small pores and extremely low-permeability areas.

4. Conclusions

With the help of a 3D physical simulation system, the problems of unknown pressure field characterization of 1D and 2D models, early gas breakthrough and low efficiency of gas injection existing in conventional CO2 huff and puff were resolved, and a new method of CO2 huff and puff assisted by pumping production and water injection disturbance was developed. The potential of this new method to improve the oil recovery of shale reservoirs was proved by comparing the recovery degree and the oil–gas replacement rate. The key findings can be summarized as follows:
(1)
The dynamic characteristics and pressure field distribution of soaking under case one and case two schemes were revealed. The soaking stage could be divided into three stages: differential pressure driving, diffusion driving and dissolution driving. In the differential pressure driving stage, the pressure showed a step-by-step drop, while in the diffusion driving stage, the pressure drop was relatively stable and linear, and the dissolution drive was mainly caused by the dissolution of CO2 in crude oil.
(2)
Compared with the conventional CO2 huff and puff, the new method of CO2 huff and puff assisted by pumping production and water injection disturbance increased the oil recovery by 7.18%. Compared with the pressure field distribution, the pressure propagation range after disturbance was wider, and the water plug could control the gas velocity, making the leading edge more uniform and stable, indicating that the water injection disturbance could effectively expand the sweep range of CO2.
(3)
Comparing the oil recovery of each cycle of case one and case two, the contribution of oil recovery was concentrated in the first four cycles, but the oil recovery gap between case one and case two was not obvious in the first three cycles, and the gap increased gradually after the fourth cycle, indicating that the water injection disturbance had a good effect on the subsequent cycles of oil recovery, which could effectively supplement the formation energy and increase the development cycle.
(4)
The oil–gas replacement rate for case two was 1.2728, which was much higher than that of 0.4523 for case one. After water injection disturbance, water replaced gas for formation energy enhancement, which realized the combination of water injection energy enhancement and gas injection energy enhancement and improved the economic adaptability of gas injection huff and puff.

Author Contributions

Conceptualization, Z.J. and C.Y.; methodology, C.Y., Z.J. and X.C.; software, C.Y.; validation, Z.J. and C.Y.; formal analysis, C.Y. and Z.J.; investigation, J.Z., L.X. and Y.M.; resources, C.Y. and Y.G.; data curation, J.Z., L.X. and Y.M.; writing—original draft preparation, Z.J. and C.Y.; writing—review and editing, C.Y., Z.J. and C.H.; visualization, J.Z.; supervision, C.Y.; project administration, C.Y.; funding acquisition, C.Y. and Z.J. All authors have read and agreed to the published version of the manuscript.

Funding

This research was funded by PetroChina Company Limited (grant number 2019E-2608), the National Natural Science Foundation of China (grant number 51974341) and the Fundamental Research Funds for the Central Universities (grant number 20CX06070A).

Institutional Review Board Statement

Not applicable.

Informed Consent Statement

Not applicable.

Data Availability Statement

Not applicable.

Acknowledgments

The results of this study could not have been possible without the efforts of the staff on the research team, and, at the same time, we sincerely thank the editors and reviewers for spending their valuable time reviewing and providing valuable comments.

Conflicts of Interest

The authors declare no conflict of interest.

References

  1. Zou, C.N.; Zhu, R.K.; Bai, B.; Yang, Z.; Hou, L.H.; Zha, M.; Fu, J.H.; Shao, Y.; Liu, K.Y.; Cao, H.; et al. Significance, Geologic Characteristics, Resource Potential and Future Challenges of Tight Oil and Shale Oil. Bull. Mineral. Petrol. Geochem. 2015, 34, 3–17. [Google Scholar]
  2. Clark, A.J. Determination of Recovery Factor in the Bakken Formation, Mountrail County, ND. In Proceedings of the All Days, New Orleans, LA, USA, 4 October 2009. [Google Scholar]
  3. Yu, W.; Lashgari, H.; Sepehrnoori, K. Simulation Study of CO2 Huff-n-Puff Process in Bakken Tight Oil Reservoirs. In Proceedings of the SPE Western North American and Rocky Mountain Joint Meeting, Denver, CO, USA, 17 April 2014. [Google Scholar]
  4. Huang, Y.J.; Geng, J.K.; Bai, Y.B.; Sun, B.H.; Huang, L. Geochemical characteristics and oil-source correlation of crude oils in 6th and 7th members of Yanchang Formation, Fuxian area, Ordos Basin. Pet. Geol. Exp. 2020, 42, 281–289. [Google Scholar]
  5. Zhou, D.S.; Shi, Y.H.; Li, M.; Zhang, Z.; Liu, S. Study on spontaneous imbibition feature of tight sandstone based NMR experiment. J. Xian Shiyou Univ. (Nat. Sci. Ed.) 2018, 33, 51–57. [Google Scholar]
  6. Zhang, Z.H.; Wei, X.S.; Gong, H.J.; Xue, W.Z.; Chen, B.; Shi, W.X. Diagenesis characteristics and evolution of porosity of Chang 7 tight sandstone reservoir in Dingbian Oilfield, Ordos Basin. Pet. Geol. Recovery Effic. 2020, 27, 43–51. [Google Scholar]
  7. Wang, Y.; Zhang, L.; Deng, J.; Wang, Y.; Ren, S.; Hu, C. An Innovative Air Assisted Cyclic Steam Stimulation Technique for Enhanced Heavy Oil Recovery. J. Pet. Sci. Eng. 2017, 151, 254–263. [Google Scholar] [CrossRef]
  8. Wang, Y.; Zhang, Y.; Liu, Y.; Zhang, L.; Ren, S.; Lu, J.; Wang, X.; Fan, N. The Stability Study of CO2 Foams at High Pressure and High Temperature. J. Pet. Sci. Eng. 2017, 154, 234–243. [Google Scholar] [CrossRef]
  9. Rathmell, J.J.; Stalkup, F.I.; Hassinger, R.C. A Laboratory Investigation of Miscible Displacement by Carbon Dioxide. In Proceedings of the Fall Meeting of the Society of Petroleum Engineers of AIME, New Orleans, LA, USA, 3 October 1971. [Google Scholar]
  10. Wang, Y.; Ren, S.; Zhang, L.; Peng, X.; Pei, S.; Cui, G.; Liu, Y. Numerical Study of Air Assisted Cyclic Steam Stimulation Process for Heavy Oil Reservoirs: Recovery Performance and Energy Efficiency Analysis. Fuel 2018, 211, 471–483. [Google Scholar] [CrossRef]
  11. Wang, Y.; Ren, S.; Zhang, L. Mechanistic Simulation Study of Air Injection Assisted Cyclic Steam Stimulation through Horizontal Wells for Ultra Heavy Oil Reservoirs. J. Pet. Sci. Eng. 2019, 172, 209–216. [Google Scholar] [CrossRef]
  12. Peng, L.; Yin, H.; Zhong, C. A search of Application and Development of Carbon Dioxide Flooding. Guangdong Chem. Ind. 2017, 44, 143–144. [Google Scholar]
  13. Pranesh, V. Subsurface CO2 Storage Estimation in Bakken Tight Oil and Eagle Ford Shale Gas Condensate Reservoirs by Retention Mechanism. Fuel 2018, 215, 580–591. [Google Scholar] [CrossRef]
  14. Deng, R.; Tian, W.; Li, Z.; Zhao, L.; Dai, H. Microscopic Limits of Reservoir Producing for Carbon Dioxide Flooding. Spec. Oil Gas. Reserv. 2019, 26, 133–137. [Google Scholar]
  15. Chung, F.T.H.; Jones, R.A.; Nguyen, H.T. Measurements and Correlations of the Physical Properties of CO2-Heavy Crude Oil Mixtures. SPE Reserv. Eng. 1988, 3, 822–828. [Google Scholar] [CrossRef]
  16. Xiao, P.; Yang, Z.; Wang, X.; Xiao, H.; Wang, X. Experimental Investigation on CO2 Injection in the Daqing Extra/Ultra-Low Permeability Reservoir. J. Pet. Sci. Eng. 2017, 149, 765–771. [Google Scholar] [CrossRef]
  17. Lang, D.; Lun, Z.; Lyu, C.; Wang, H.; Zhao, Q.; Sheng, H. Nuclear Magnetic Resonance Experimental Study of CO2 Injection to Enhance Shale Oil Recovery. Pet. Explor. Dev. 2021, 48, 702–712. [Google Scholar] [CrossRef]
  18. Ding, M.; Yuan, F.; Wang, Y.; Xia, X.; Chen, W.; Liu, D. Oil Recovery from a CO2 Injection in Heterogeneous Reservoirs: The Influence of Permeability Heterogeneity, CO2-Oil Miscibility and Injection Pattern. J. Nat. Gas. Sci. Eng. 2017, 44, 140–149. [Google Scholar] [CrossRef]
  19. Ren, B.; Zhang, L.; Huang, H.; Ren, S.; Chen, G.; Zhang, H. Performance Evaluation and Mechanisms Study of Near-Miscible CO2 Flooding in a Tight Oil Reservoir of Jilin Oilfield China. J. Nat. Gas. Sci. Eng. 2015, 27, 1796–1805. [Google Scholar] [CrossRef]
  20. Li, L.; Sheng, J.J.; Xu, J. Gas Selection for Huff-n-Puff EOR in Shale Oil Reservoirs Based upon Experimental and Numerical Study. In Proceedings of the SPE Unconventional Resources Conference, Calgary, AB, Canada, 15 February 2017. [Google Scholar]
  21. Sun, J.; Zou, A.; Sotelo, E.; Schechter, D. Numerical Simulation of CO2 Huff-n-Puff in Complex Fracture Networks of Unconventional Liquid Reservoirs. J. Nat. Gas. Sci. Eng. 2016, 31, 481–492. [Google Scholar] [CrossRef]
  22. Chen, C.; Gu, M. Investigation of Cyclic CO2 Huff-and-Puff Recovery in Shale Oil Reservoirs Using Reservoir Simulation and Sensitivity Analysis. Fuel 2017, 188, 102–111. [Google Scholar] [CrossRef]
  23. Song, C.; Yang, D. Experimental and Numerical Evaluation of CO2 Huff-n-Puff Processes in Bakken Formation. Fuel 2017, 190, 145–162. [Google Scholar] [CrossRef]
  24. Li, F.; Luo, Y.; Luo, X.; Wang, L.; Nagre, R.D. Experimental Study on a New Plugging Agent during CO2 Flooding for Heterogeneous Oil Reservoirs: A Case Study of Block G89-1 of Shengli Oilfield. J. Pet. Sci. Eng. 2016, 146, 103–110. [Google Scholar] [CrossRef]
  25. Alfarge, D.; Wei, M.; Bai, B. Factors Affecting CO2-EOR in Shale-Oil Reservoirs: Numerical Simulation Study and Pilot Tests. Energy Fuels 2017, 31, 8462–8480. [Google Scholar] [CrossRef]
  26. Meng, X.; Sheng, J.J.; Yu, Y. Evaluation of Enhanced Condensate Recovery Potential in Shale Plays by Huff-n-Puff Gas Injection. In Proceedings of the SPE Eastern Regional Meeting, Morgantown, WV, USA, 13 October 2015. [Google Scholar]
  27. Song, C.; Yang, D. Performance Evaluation of CO2 Huff-n-Puff Processes in Tight Oil Formations. In Proceedings of the SPE Unconventional Resources Conference, Calgary, AB, Canada, 5 November 2013. [Google Scholar]
  28. Hao, H.; Hou, J.; Zhao, F.; Song, Z.; Hou, L.; Wang, Z. Gas Channeling Control during CO2 Immiscible Flooding in 3D Radial Flow Model with Complex Fractures and Heterogeneity. J. Pet. Sci. Eng. 2016, 146, 890–901. [Google Scholar] [CrossRef]
  29. Christensen, R.; Stenby, E.H.; Skauge, A. Review of WAG Field Experience. SPE Res. Eval. Eng. 2001, 4, 97–106. [Google Scholar] [CrossRef]
  30. Zahoor, M.K.; Derahman, M.N.; Yunan, M.H. WAG process design–An updated review. Braz. J. Pet. Gas 2011, 5, 109–121. [Google Scholar] [CrossRef]
Figure 1. Three-dimensional physical model: (a) the model profile; (b) the pressure measuring point.
Energies 15 07220 g001
Figure 2. Three-dimensional physical simulation system for huff and puff.
Energies 15 07220 g002
Figure 3. Experimental scenario design: (a) case 1: CO2 huff and puff; (b) case 2: CO2 huff and puff assisted by pumping production and water injection disturbance.
Energies 15 07220 g003
Figure 4. Pressure dynamic curve during the soaking of case one.
Energies 15 07220 g004
Figure 5. Pressure dynamic curve during the soaking of case two.
Energies 15 07220 g005
Figure 6. Dynamic distribution of pressure field in soaking of case one: (a) soaking for 10 min; (b) soaking for 5 h; (c) soaking for 10 h.
Energies 15 07220 g006
Figure 7. Dynamic distribution of pressure field in soaking of case two: (a) soaking for 10 min; (b) soaking for 5 h; (c) soaking for 10 h.
Energies 15 07220 g007
Figure 8. Cumulative oil production of each cycle of case one.
Energies 15 07220 g008
Figure 9. Cumulative oil production of case one and case two.
Energies 15 07220 g009
Figure 10. Recovery factor of case one and case two.
Energies 15 07220 g010
Figure 11. Oil–gas replacement rate of case one and case two.
Energies 15 07220 g011
Publisher’s Note: MDPI stays neutral with regard to jurisdictional claims in published maps and institutional affiliations.

