The Environmental Life Cycle Assessment of Electricity Production in New York State from Distributed Solar Photovoltaic Systems
Abstract
:1. Introduction
2. Materials and Methods
2.1. Goal and Scope
2.2. Inventory Data and Modelling
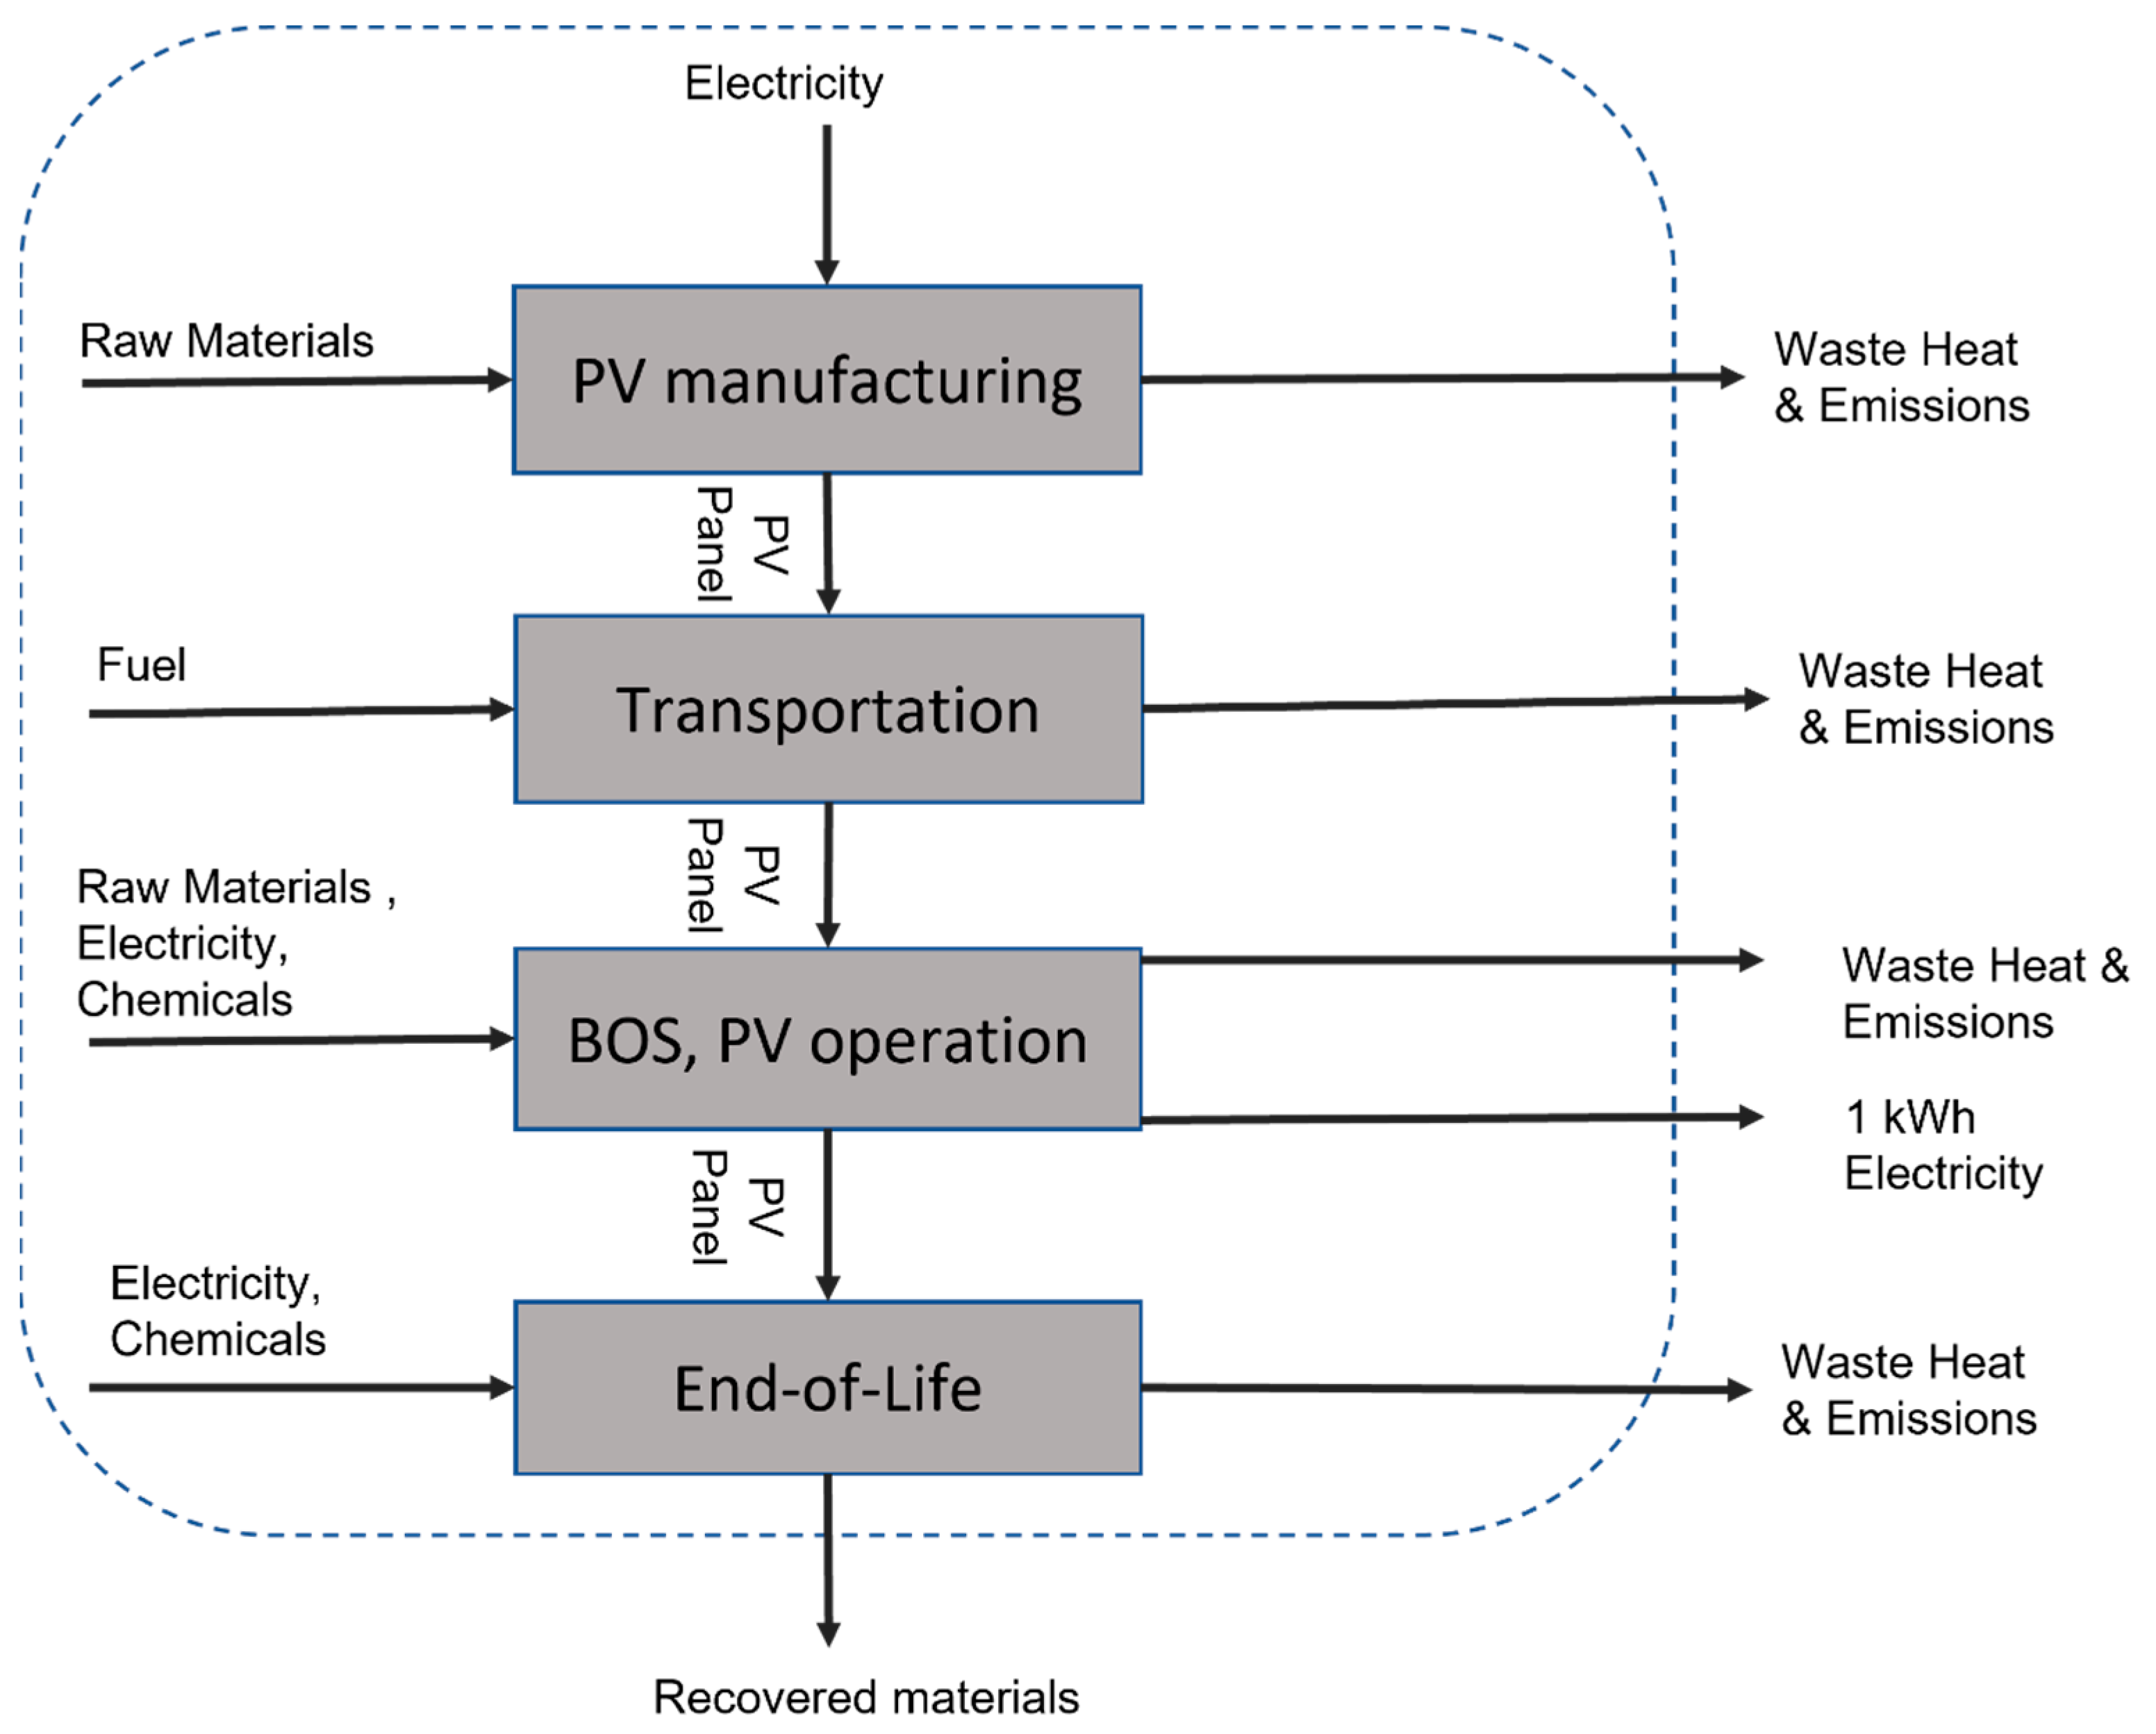
2.2.1. Manufacturing of PV Panels
2.2.2. Transportation
2.2.3. BOS Components Manufacturing, Installation, and Operation of PV System
2.2.4. End-of-Life (EoL)
2.3. Life Cycle Impact Assessment
2.4. Statistical Analysis
2.5. Estimation of Future Land Requirements
3. Results
3.1. Environmental Life Cycle Results
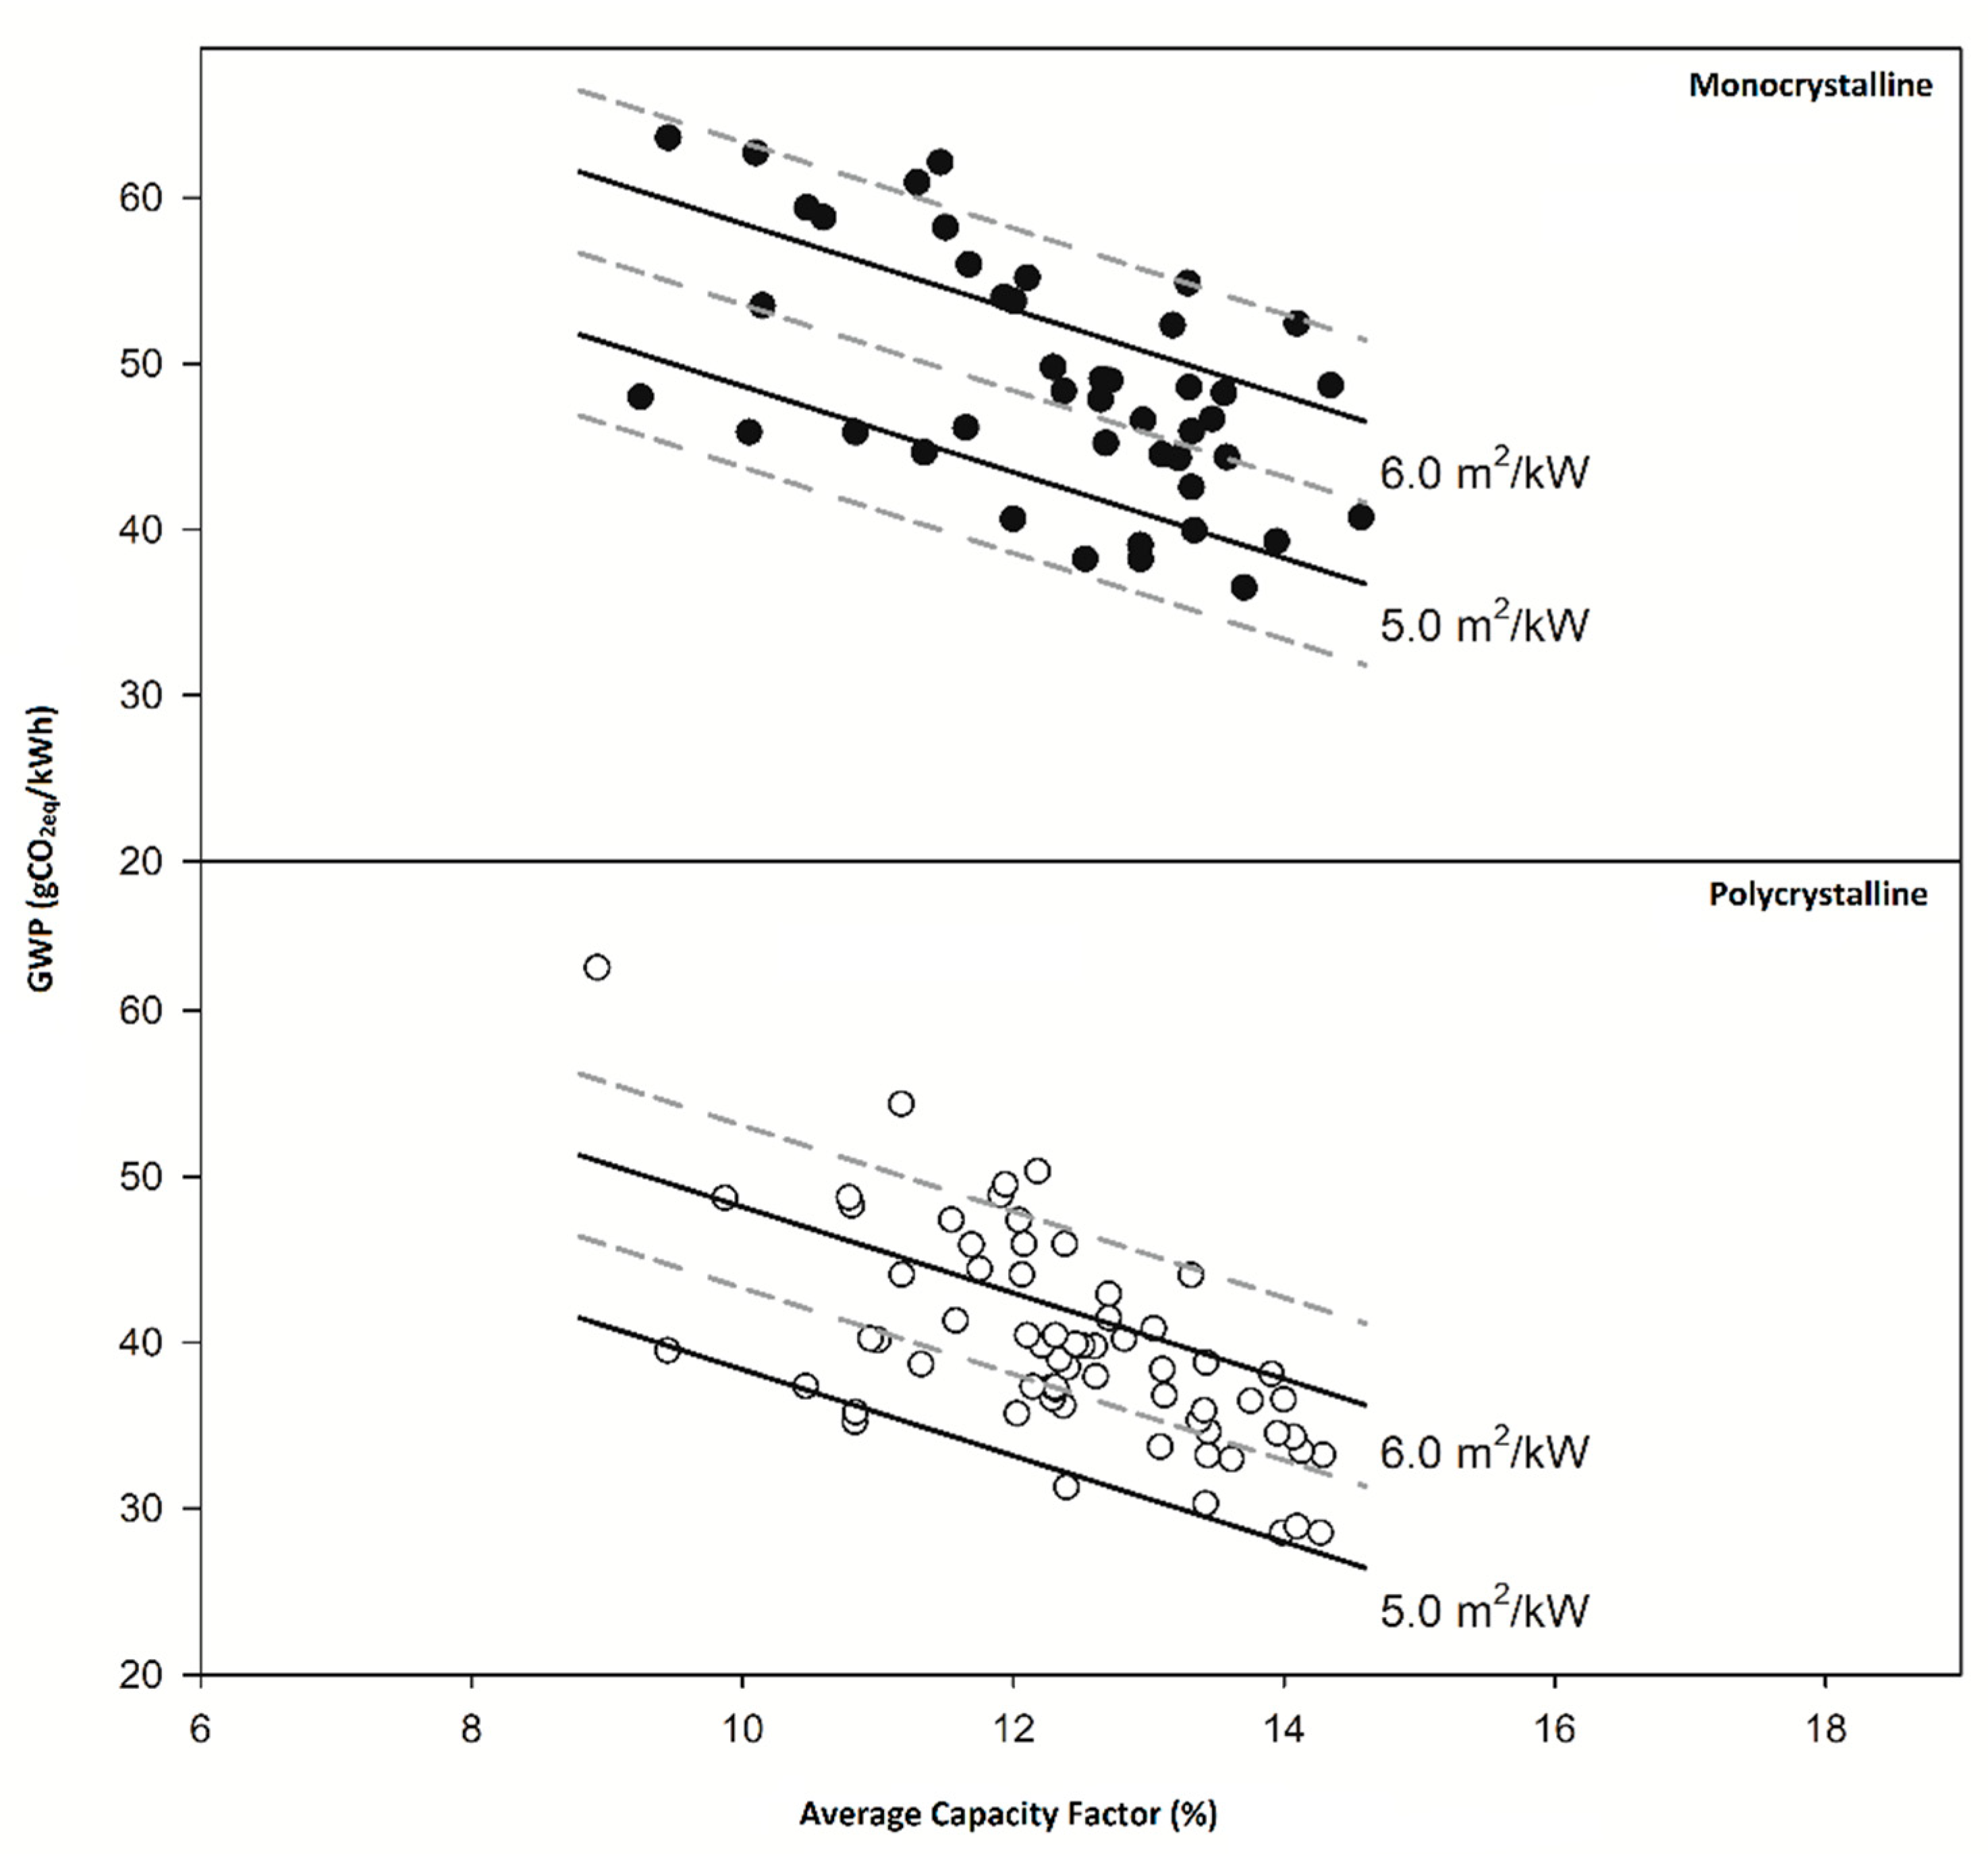
3.2. Statistical Analysis Findings
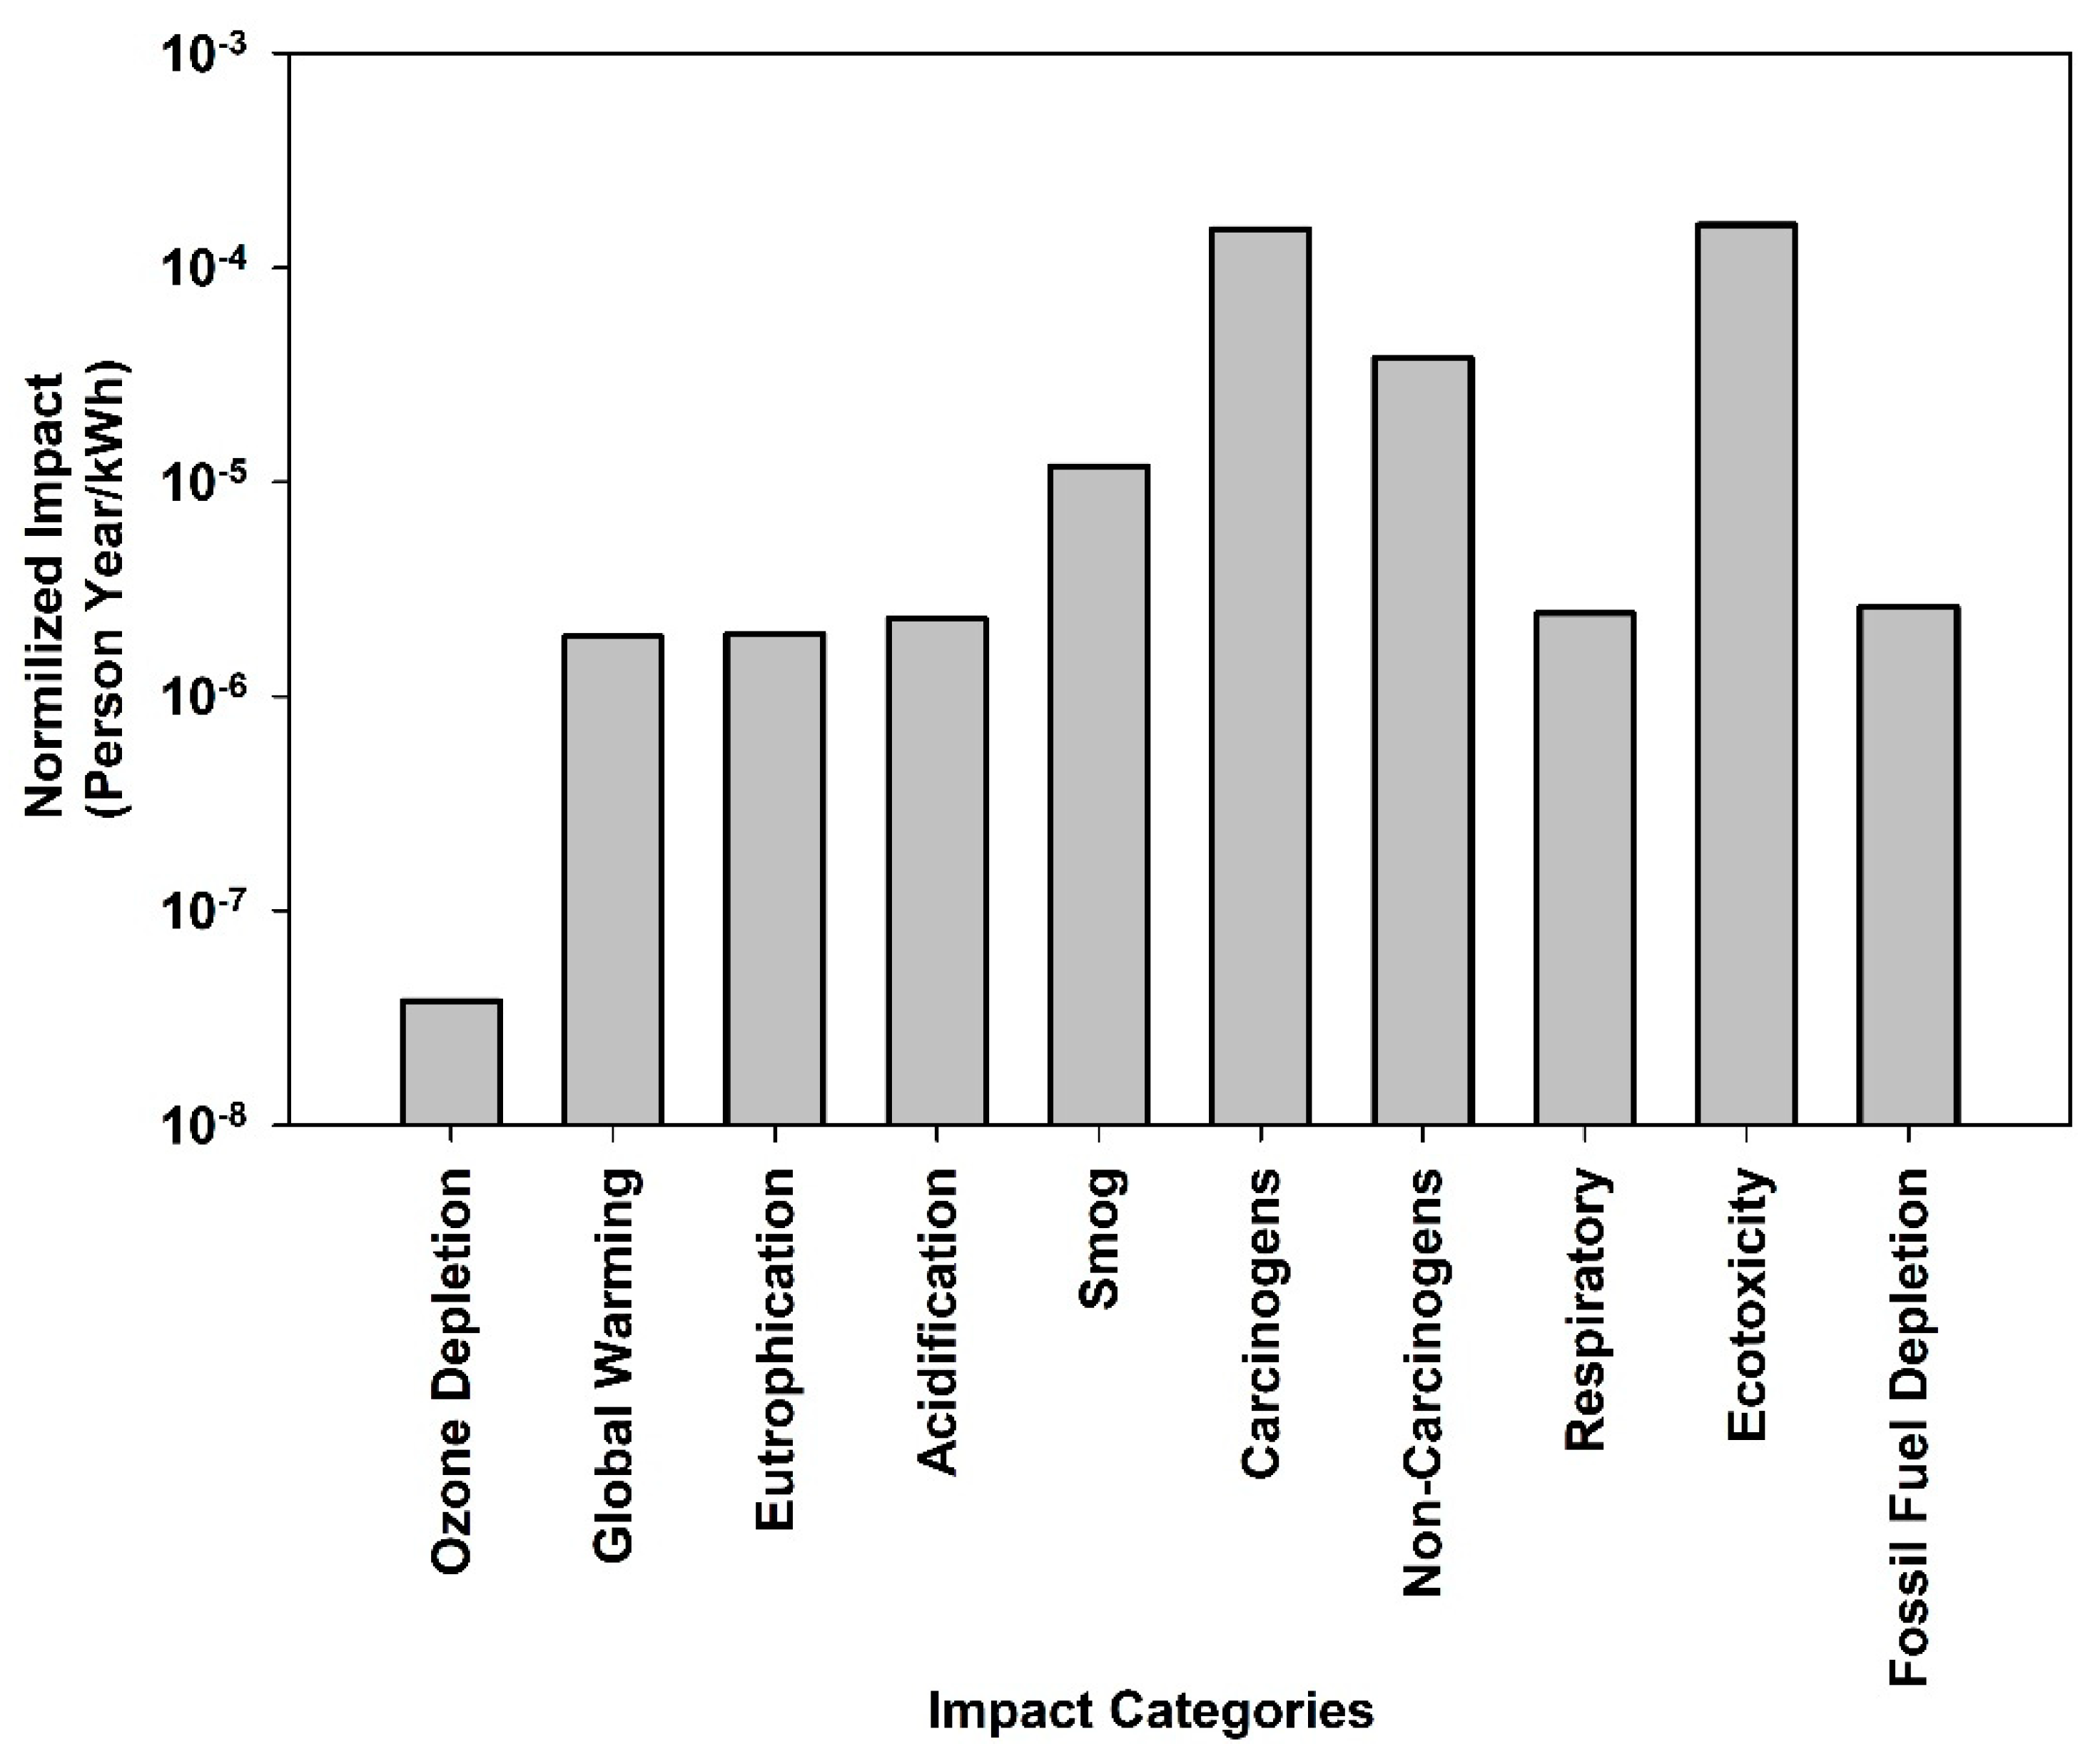
3.3. Environmental Normalization Results
4. Discussion
4.1. Comparisons with Other Solar PV LCAs
4.2. Comparisons with Other Electricity Generation Systems’ LCAs
4.3. Implications for NYS’s CLCPA
4.4. Limitations
5. Conclusions
Supplementary Materials
Author Contributions
Funding
Data Availability Statement
Acknowledgments
Conflicts of Interest
References
- EIA. Annual Energy Outlook 2022 with Projections to 2050; EIA: Washington, DC, USA, 2022. [Google Scholar]
- Sah, D.; Chitra; Kumar, S. Recovery and Analysis of Valuable Materials from a Discarded Crystalline Silicon Solar Module. Sol. Energy Mater. Sol. Cells 2022, 246, 111908. [Google Scholar] [CrossRef]
- Fields, J.D.; Ahmad, M.I.; Pool, V.L.; Yu, J.; Van Campen, D.G.; Parilla, P.A.; Toney, M.F.; van Hest, M.F.A.M. The Formation Mechanism for Printed Silver-Contacts for Silicon Solar Cells. Nat. Commun. 2016, 7, 11143. [Google Scholar] [CrossRef] [PubMed] [Green Version]
- Azeumo, M.F.; Germana, C.; Ippolito, N.M.; Franco, M.; Luigi, P.; Settimio, S. Photovoltaic Module Recycling, a Physical and a Chemical Recovery Process. Sol. Energy Mater. Sol. Cells 2019, 193, 314–319. [Google Scholar] [CrossRef]
- Kaminsky, T. Senate Bill S6599. 2019. Available online: https://www.nysenate.gov/legislation/bills/2019/s6599 (accessed on 20 July 2022).
- EEE Inc. Pathways to Deep Decarbonization in New York State; Energy and Environmental Economics, Inc.: San Francisco, CA, USA, 2020. [Google Scholar]
- IRENA. Renewable Power Generation Costs in 2019, International Renewable Energy Agency, Abu Dhabi; IRENA: Abu Dhabi, United Arab Emirates, 2020. [Google Scholar]
- Fthenakis, V.M.; Kim, H.C. Photovoltaics: Life-Cycle Analyses. Sol. Energy 2011, 85, 1609–1628. [Google Scholar] [CrossRef]
- Fu, Y.; Liu, X.; Yuan, Z. Life-Cycle Assessment of Multi-Crystalline Photovoltaic (PV) Systems in China. J. Clean. Prod. 2015, 86, 180–190. [Google Scholar] [CrossRef]
- Hsu, D.D.; O’Donoughue, P.; Fthenakis, V.; Heath, G.A.; Kim, H.C.; Sawyer, P.; Choi, J.-K.; Turney, D.E. Life Cycle Greenhouse Gas Emissions of Crystalline Silicon Photovoltaic Electricity Generation. J. Ind. Ecol. 2012, 16, S122–S135. [Google Scholar] [CrossRef]
- Mason, J.E.; Fthenakis, V.M.; Hansen, T.; Kim, H.C. Energy Payback and Life-Cycle CO2 Emissions of the BOS in an Optimized 3·5 MW PV Installation. Prog. Photovolt. Res. Appl. 2006, 14, 179–190. [Google Scholar] [CrossRef]
- Muteri, V.; Cellura, M.; Curto, D.; Franzitta, V.; Longo, S.; Mistretta, M.; Parisi, M.L. Review on Life Cycle Assessment of Solar Photovoltaic Panels. Energies 2020, 13, 252. [Google Scholar] [CrossRef] [Green Version]
- Pacca, S.; Sivaraman, D.; Keoleian, G.A. Parameters Affecting the Life Cycle Performance of PV Technologies and Systems. Energy Policy 2007, 35, 3316–3326. [Google Scholar] [CrossRef]
- Grant, C.; Garcia, J.; Hicks, A. Environmental Payback Periods of Multi-Crystalline Silicon Photovoltaics in the United States—How Prioritizing Based on Environmental Impact Compares to Solar Intensity. Sustain. Energy Technol. Assess. 2020, 39, 100723. [Google Scholar] [CrossRef]
- Mustafa, R.J.; Gomaa, M.R.; Al-Dhaifallah, M.; Rezk, H. Environmental Impacts on the Performance of Solar Photovoltaic Systems. Sustainability 2020, 12, 608. [Google Scholar] [CrossRef] [Green Version]
- Sengupta, M.; Xie, Y.; Lopez, A.; Habte, A.; Maclaurin, G.; Shelby, J. The National Solar Radiation Data Base (NSRDB). Renew. Sustain. Energy Rev. 2018, 89, 51–60. [Google Scholar] [CrossRef]
- EPA. EGRID Summary Table; EPA: Washington, DC, USA, 2020.
- IEA. Global Energy and CO2 Status Report 2019; IEA: Paris, France, 2019. [Google Scholar]
- NREL. Life Cycle Greenhouse Gas Emissions from Solar Photovoltaics; NREL: Golden, CO, USA, 2012.
- EPA. Tool for the Reduction and Assessment of Chemical and Other Environmental Impacts (TRACI) TRACI Version 2.1; EPA/600/R-12/554 2012 2012; EPA: Washington, DC, USA, 2012.
- ISO 14040; Environmental Management: Life Cycle Assessment; Principles and Framework. ISO: Geneva, Switzerland, 2006.
- ISO 14044; Environmental Management—Life Cycle Assessment—Requirements and Guidelines. ISO: Geneva, Switzerland, 2006.
- PRé Sustainability Inc. Introduction to LCA with SimaPro 2016; PRé: Amersfoort, The Netherlands, 2016. [Google Scholar]
- LTS. DATASMART LCI Package; LTS: Huntington, VT, USA, 2021; Available online: https://ltsexperts.com/wp-content/uploads/2021/12/LTS-DATASMART-Whats-New_2021.pdf (accessed on 20 July 2022).
- NYSERDA DER Search DER Facilities in New York State. Available online: https://der.nyserda.ny.gov/search/ (accessed on 15 April 2021).
- NERC. Distributed Energy Resources: Connection Modeling and Reliability Considerations 2017; NERC: Atlanta, GA, USA, 2017. [Google Scholar]
- Latunussa, C.E.L.; Ardente, F.; Blengini, G.A.; Mancini, L. Life Cycle Assessment of an Innovative Recycling Process for Crystalline Silicon Photovoltaic Panels. Sol. Energy Mater. Sol. Cells 2016, 156, 101–111. [Google Scholar] [CrossRef]
- Ports.com Port of Shenzhen, China to Port of New York, United States Distance. Available online: http://ports.com/sea-route/port-of-shenzhen,china/port-of-new-york,united-states/ (accessed on 8 March 2022).
- Jordan, D.C.; Kurtz, S.R. Photovoltaic Degradation Rates—an Analytical Review. Prog. Photovolt. Res. Appl. 2013, 21, 12–29. [Google Scholar] [CrossRef] [Green Version]
- Boretti, A.; Castelletto, S.; Al-Kouz, W.; Nayfeh, J. Capacity Factors of Solar Photovoltaic Energy Facilities in California, Annual Mean and Variability. E3S Web Conf. 2020, 181, 02004. [Google Scholar] [CrossRef]
- SAS Institute Inc. SAS Documentation for SAS 9.3 and Earlier 2011; SAS Institute Inc.: Cary, NC, USA, 2011. [Google Scholar]
- Mallows, C.L. Some Comments on C p. Technometrics 1973, 15, 661–675. [Google Scholar] [CrossRef]
- Wisnowski, J.W.; Montgomery, D.C.; Simpson, J.R. A Comparative Analysis of Multiple Outlier Detection Procedures in the Linear Regression Model. Comput. Stat. Data Anal. 2001, 36, 351–382. [Google Scholar] [CrossRef]
- Ryberg, M.; Vieira, M.D.M.; Zgola, M.; Bare, J.; Rosenbaum, R.K. Updated US and Canadian Normalization Factors for TRACI 2.1. Clean Technol. Environ. Policy 2014, 16, 329–339. [Google Scholar] [CrossRef]
- Kim, B.; Lee, J.; Kim, K.; Hur, T. Evaluation of the Environmental Performance of Sc-Si and Mc-Si PV Systems in Korea. Sol. Energy 2014, 99, 100–114. [Google Scholar] [CrossRef]
- Stylos, N.; Koroneos, C. Carbon Footprint of Polycrystalline Photovoltaic Systems. J. Clean. Prod. 2014, 64, 639–645. [Google Scholar] [CrossRef]
- Kouloumpis, V.; Kalogerakis, A.; Pavlidou, A.; Tsinarakis, G.; Arampatzis, G. Should Photovoltaics Stay at Home? Comparative Life Cycle Environmental Assessment on Roof-Mounted and Ground-Mounted Photovoltaics. Sustainability 2020, 12, 9120. [Google Scholar] [CrossRef]
- Collier, J.; Wu, S.; Apul, D. Life Cycle Environmental Impacts from CZTS (Copper Zinc Tin Sulfide) and Zn3P2 (Zinc Phosphide) Thin Film PV (Photovoltaic) Cells. Energy 2014, 74, 314–321. [Google Scholar] [CrossRef]
- Bergesen, J.D.; Heath, G.A.; Gibon, T.; Suh, S. Thin-Film Photovoltaic Power Generation Offers Decreasing Greenhouse Gas Emissions and Increasing Environmental Co-Benefits in the Long Term. Environ. Sci. Technol. 2014, 48, 9834–9843. [Google Scholar] [CrossRef]
- Lunardi, M.M.; Moore, S.; Alvarez-Gaitan, J.P.; Yan, C.; Hao, X.; Corkish, R. A Comparative Life Cycle Assessment of Chalcogenide/Si Tandem Solar Modules. Energy 2018, 145, 700–709. [Google Scholar] [CrossRef]
- Şengül, H.; Theis, T.L. An Environmental Impact Assessment of Quantum Dot Photovoltaics (QDPV) from Raw Material Acquisition through Use. J. Clean. Prod. 2011, 19, 21–31. [Google Scholar] [CrossRef]
- García-Valverde, R.; Cherni, J.A.; Urbina, A. Life Cycle Analysis of Organic Photovoltaic Technologies. Prog. Photovolt. Res. Appl. 2010, 18, 535–558. [Google Scholar] [CrossRef]
- Parisi, M.L.; Basosi, R. Environmental Life Cycle Analysis of Nonconventional Thin-Film Photovoltaics: The Case of Dye-Sensitized Solar Devices. In Energy Security and Development: The Global Context and Indian Perspectives; Reddy, B.S., Ulgiati, S., Eds.; Springer: New Delhi, India, 2015; pp. 195–210. ISBN 978-81-322-2065-7. [Google Scholar]
- EPRI EPRI (Electric Power Research Institute). Literature Review and Sensitivity Analysis of Biopower Life-Cycle Assessments and Greenhouse Gas Emission; Electric Power Research Institute: Palo Alto, CA, USA, 2013; p. 1026852. [Google Scholar]
- Burkhardt, J.J., III; Heath, G.; Cohen, E. Life Cycle Greenhouse Gas Emissions of Trough and Tower Concentrating Solar Power Electricity Generation. J. Ind. Ecol. 2012, 16, S93–S109. [Google Scholar] [CrossRef]
- DOE U.S. Department of Energy. Wind Vision: A New Era for Wind Power in the United States; US Department of Energy: Washington, DC, USA, 2015.
- Eberle, A.; Heath, G.A.; Petri, A.C.C.; Nicholson, S.R. Systematic Review of Life Cycle Greenhouse Gas Emissions from Geothermal Electricity; National Renewable Energy Lab. (NREL): Golden, CO, USA, 2017. [CrossRef]
- DOE. Hydropower Vision: A New Chapter for America’s First Renewable Electricity Source; Appendix G; U.S. Department of Energy: Washington, DC, USA, 2016.
- IPCC. Renewable Energy Sources and Climate Change Mitigation; IPCC: Geneva, Switzerland, 2011. [Google Scholar]
- Whitaker, M.; Heath, G.A.; O’Donoughue, P.; Vorum, M. Life Cycle Greenhouse Gas Emissions of Coal-Fired Electricity Generation. J. Ind. Ecol. 2012, 16, S53–S72. [Google Scholar] [CrossRef]
- O’Donoughue, P.R.; Heath, G.A.; Dolan, S.L.; Vorum, M. Life Cycle Greenhouse Gas Emissions of Electricity Generated from Conventionally Produced Natural Gas. J. Ind. Ecol. 2014, 18, 125–144. [Google Scholar] [CrossRef]
- Warner, E.S.; Heath, G.A. Life Cycle Greenhouse Gas Emissions of Nuclear Electricity Generation. J. Ind. Ecol. 2012, 16, S73–S92. [Google Scholar] [CrossRef]
- NYSERDA. Toward a Clean Energy Future: A Strategic Outlook through 2022–2025; NYSERDA: Albany, NY, USA, 2022. [Google Scholar]
- EPA. What Is RE-Powering. Available online: https://www.epa.gov/re-powering/what-re-powering (accessed on 29 March 2022).
- Turney, D.; Fthenakis, V. Environmental Impacts from the Installation and Operation of Large-Scale Solar Power Plants. Renew. Sustain. Energy Rev. 2011, 15, 3261–3270. [Google Scholar] [CrossRef]
- NEI. Economic Impacts of The Indian Point Energy Center. An Analysis by the Nuclear Energy Institute; NEI: Washington, DC, USA, 2015. [Google Scholar]


| Parameter | Mean | Range | Unit | Sources |
|---|---|---|---|---|
| Panel Characteristics | ||||
| Panel area | 1.96 | 1.62–2.25 | m2 | Panel manufacturers |
| Panel weight | 23.40 | 18.6–27.7 | kg | Panel manufacturers |
| Efficiency | 17.66 | 15.48–22.2 | % | Panel manufacturers |
| Installation System | ||||
| Ground mounting | 80 | - | % | [25] |
| Roof mounting | 20 | - | % | [25] |
| Monocrystalline panel | 32.5 | - | % | Panel manufacturers |
| Polycrystalline panels | 67.5 | - | % | Panel manufacturers |
| Electricity Production Parameters by Site | ||||
| Average power capacity | 2256 | 230–6300 | kW | [25] |
| Average number of panels | 6486 | 720–17,472 | - | [25] |
| Average capacity factor (monthly) | 12.2 | 8.93–18.74 | % | [25] |
| Average Annual Electricity Production | 2406 | 213–7105 | MWh | [25] |
| Process | Input/Output | Flows | Quantity | Unit |
|---|---|---|---|---|
| PV panels manufacturing | Output | PV panel | ||
| –Mono | 1.81 × 10⁻⁴ | m2 | ||
| –Poly | 1.87 × 10⁻⁴ | |||
| Transportation of PV panels | Input | Transport (road) | 6.24 × 10⁻⁴ | tkm |
| Transport (ocean) | 5.29 × 10⁻² | tkm | ||
| Balance of system components, installation, and operation | Input | Heat | 1.23 × 10⁻³ | MJ |
| Electricity | 1.2 × 10⁻⁴ | kWh | ||
| Diesel | 3.35 × 10⁻⁵ | Liters | ||
| Steel | 1.27 × 10⁻³ | kg | ||
| Aluminum | 2.96 × 10⁻⁴ | kg | ||
| Transport (road) | 9.1 × 10⁻³ | tkm | ||
| Concrete (only ground mounting) | 1.49 × 10⁻³ | kg | ||
| Oil (vegetable) | 6.83 × 10⁻⁶ | kg | ||
| Plywood | 2.39 × 10⁻⁴ | kg | ||
| Water | 1.37 × 10⁻³ | kg | ||
| Plastics | 1.33 × 10⁻⁴ | kg | ||
| Inverters | 1.15 × 10⁻⁴ | kg | ||
| Copper | 1.71 × 10⁻⁴ | kg | ||
| Output | Electricity (main product) | 1 | kWh | |
| End-of-life— materials recovery, landfilling, and incineration | Input | Transport (road) | 6.41 × 10⁻⁴ | tkm |
| Net electricity | 1.12 × 10⁻⁴ | kWh | ||
| Diesel | 1.1 × 10⁻⁴ | MJ | ||
| Water | 7.81 × 10⁻⁴ | kg | ||
| Nitric acid | 1.78 × 10⁻⁵ | kg | ||
| Lime | 9.2 × 10⁻⁵ | kg | ||
| Output | Heat | 1.27 × 10⁻³ | MJ | |
| Aluminum | 4.6 × 10⁻⁴ | kg | ||
| Glass | 1.73 × 10⁻³ | kg | ||
| Copper | 1.1 × 10⁻⁵ | kg | ||
| Silicon | 8.74 × 10⁻⁵ | kg | ||
| Silver | 1.26 × 10⁻⁶ | kg | ||
| Nitrogen oxides | 5.04 × 10⁻⁶ | kg | ||
| Fly ash, contaminated glass, and sludge for Landfilling | 9.39 × 10⁻⁴ | kg | ||
| Ethylene vinyl acetate, poly vinyl fluoride, and plastics from cable for incineration | 2.18 × 10⁻⁴ | kg |
| Impact Category | Units | Mean Value n = 120 | Standard Deviation |
|---|---|---|---|
| Global Warming | kgCO2eq/kWh | 4.56 × 10⁻² | 1.19 × 10⁻² |
| Ozone Depletion | kgCFC-11eq/kWh | 6.52 × 10⁻⁹ | 1.55 × 10⁻⁹ |
| Smog | kgO3eq/kWh | 2.92 × 10⁻³ | 7.49 × 10⁻⁴ |
| Acidification | kgSO2eq/kWh | 2.25 × 10⁻⁴ | 5.74 × 10⁻⁵ |
| Eutrophication | kgNeq/kWh | 2.81 × 10⁻⁴ | 6.88 × 10⁻⁵ |
| Carcinogenics | CTUh/kWh | 7.32 × 10⁻⁹ | 1.73 × 10⁻⁹ |
| Non-carcinogenics | CTUh/kWh | 4.07 × 10⁻⁸ | 9.62 × 10⁻⁹ |
| Respiratory Effects | kgPM2.5eq/kWh | 6.29 × 10⁻⁵ | 1.68 × 10⁻⁵ |
| Ecotoxicity | CTUe/kWh | 1.87 | 0.44 |
| Fossil Fuel Depletion | MJ surplus/kWh | 4.76 × 10⁻² | 1.18 × 10⁻² |
| Variable | Parameter Estimate | Standard Error | F Value | Pr > |t| |
|---|---|---|---|---|
| Intercept | 15.31 | 6.18 | 6.13 | 0.0149 |
| Monocrystalline | 10.27 | 0.67 | 231.77 | ˂0.0001 |
| Area Power Ratio | 9.79 | 0.79 | 153.01 | ˂0.0001 |
| Average Capacity Factor | −2.59 | 0.27 | 91.95 | ˂0.0001 |
| Studied Solar Panels | GHG (gCO2eq/kWh) | Location | Source | |
|---|---|---|---|---|
| First Generation | ||||
| Monocrystalline and polycrystalline (cradle-to-grave) | 45.6 | New York State | This study | |
| Monocrystalline and Polycrystalline (cradle-to-grave) | 40 | Global | [19] | |
| Monocrystalline with PCS (cradle-to-grave) | 41.8 | Korea | [35] | |
| Polycrystalline with PCS (cradle-to-grave) | 31.5 | |||
| Polycrystalline (cradle-to-use) | 58.8 | Greece | [36] | |
| Polycrystalline (cradle-to-gate) | 50.9 | China | [9] | |
| Ground mounted Polycrystalline(cradle-to-gate) | 42.7 | Greece | [37] | |
| Roof mounted Monocrystalline(cradle-to-gate) | 54.3 | Greece | [37] | |
| Second Generation | ||||
| Copper Zinc Tin Sulfide (CZTS) (cradle-to-gate) | 38 | Laboratory scale | [38] | |
| Zinc Phosphide (ZN3P2) (cradle-to-gate) | 30 | |||
| Copper Indium Gallium Selenide (CIGS) (cradle-to-grave) | 22 | United States | [39] | |
| Cadmium Telluride (CdTe) (cradle-to-grave) | 20 | |||
| CIGS/Si (cradle-to-grave) | 29 | China | [40] | |
| CZTS/Si (cradle-to-grave) | 26 | |||
| AZTS/Si (cradle-to-grave) | 25 | |||
| Third Generation | ||||
| Heterojunction Organic Cell (cradle-to-gate) | 54.9 | Laboratory scale | [42] | |
| Quantum Dot PV (QDPV) (cradle-to-gate) | 5 | Laboratory scale | [41] | |
| Dye-Sensitized Solar Devices (DSSD) (cradle-to-gate) | 22.3 | Laboratory scale | [43] |
| Technology | GHG (gCO2eq/kWh) | Source | |
|---|---|---|---|
| Renewable Energy Systems | Solar PV (crystalline based) | 45.6 | This study |
| Biomass | 52 | [44] | |
| Photovoltaic (thin film and Si-based) | 43 | [10] | |
| Concentrated Solar Power -CSP (tower and trough) | 28 | [45] | |
| Wind (land-based and offshore) | 13 | [46] | |
| Geothermal | 37 | [47] | |
| Hydropower | 21 | [48] | |
| Ocean | 8 | [49] | |
| Fossil Fuel-based and Non-renewable Energy Systems | Oil | 840 | [49] |
| Coal | 1001 | [50] | |
| Natural Gas | 486 | [51] | |
| Nuclear | 13 | [52] |
Publisher’s Note: MDPI stays neutral with regard to jurisdictional claims in published maps and institutional affiliations. |
© 2022 by the authors. Licensee MDPI, Basel, Switzerland. This article is an open access article distributed under the terms and conditions of the Creative Commons Attribution (CC BY) license (https://creativecommons.org/licenses/by/4.0/).
Share and Cite
Ali, A.; Koch, T.W.; Volk, T.A.; Malmsheimer, R.W.; Eisenbies, M.H.; Kloster, D.; Brown, T.R.; Naim, N.; Therasme, O. The Environmental Life Cycle Assessment of Electricity Production in New York State from Distributed Solar Photovoltaic Systems. Energies 2022, 15, 7278. https://doi.org/10.3390/en15197278
Ali A, Koch TW, Volk TA, Malmsheimer RW, Eisenbies MH, Kloster D, Brown TR, Naim N, Therasme O. The Environmental Life Cycle Assessment of Electricity Production in New York State from Distributed Solar Photovoltaic Systems. Energies. 2022; 15(19):7278. https://doi.org/10.3390/en15197278
Chicago/Turabian StyleAli, Atif, Theodore W. Koch, Timothy A. Volk, Robert W. Malmsheimer, Mark H. Eisenbies, Danielle Kloster, Tristan R. Brown, Nehan Naim, and Obste Therasme. 2022. "The Environmental Life Cycle Assessment of Electricity Production in New York State from Distributed Solar Photovoltaic Systems" Energies 15, no. 19: 7278. https://doi.org/10.3390/en15197278
APA StyleAli, A., Koch, T. W., Volk, T. A., Malmsheimer, R. W., Eisenbies, M. H., Kloster, D., Brown, T. R., Naim, N., & Therasme, O. (2022). The Environmental Life Cycle Assessment of Electricity Production in New York State from Distributed Solar Photovoltaic Systems. Energies, 15(19), 7278. https://doi.org/10.3390/en15197278


