Abstract
Hydrogen is seen as a future energy carrier since its chemical compounds make up a large part of the Earth’s surface. This study sought to analyze the impact related to the inclusion of hydrogen and oxygen gases produced on demand by an alkaline electrolyzer to the engine added directly through the fuel intake line. For this purpose, performance parameters were monitored, such as liquid fuel consumption and greenhouse gas emissions, and correlated to any effect observed on the engine’s power output and combustion behavior. A 58 kVA nominal power motor-generator was used, coupled with a resistive load bank (20 kW), where two fuel configurations were tested (diesel injection only and a mixture of diesel, hydrogen and oxygen) and compared. A total of 42 tests were performed considering both the admission gases into the fuel intake line and also diesel supply only for baseline. A substantial decrease in fuel consumption was observed (7.59%) when the blend configuration was used despite a decrease in the engine’s work (1.07%). It was also possible to see a common pattern between NO and NO2 emissions for both fuel configurations, while the behavior of the CO2 and CO emissions indicated a higher complete diesel burning fraction when using the gases on demand. Therefore, we can verify that the use of hydrogen and oxygen gases produced on demand in the fuel intake line is a promising alternative to provide a decrease in liquid fuel consumption and an overall improvement in engine combustion.
1. Introduction
Population increase, industrial development, high urbanization rate and increased vehicular flow during the last decades have generated an increase in the use of fossil fuels and an increase in the world energy demand, which consequently is directly related to the increase in greenhouse gas emissions [1]. For power and heat generation, thermoelectric power plants are considered the largest emitters of greenhouse gases that typically use coal, natural gas, and oil as primary energy sources [2]. Considering thermal power plants powered by diesel and heavy oil, the gases emitted by the engines can be classified into two groups: those that offer direct risks to health and ecosystems, and these are subdivided into compounds in which the emission is regulated, which are CO, hydrocarbons (HC), nitrogen oxides (NOX), sulfur oxides (SOX) and particulate matter (PM); and those that do not cause direct harm to health, namely O2, CO2, H2O and N2.
Hydrogen is seen as a future energy carrier, since its chemical compounds make up a large part of the Earth’s surface. A variety of primary resources, including fossil fuels and solar, wind, hydro and nuclear energy, can be used for its production [3]. There are several reasons to make hydrogen a fuel option, either in replacement or partial use, improving energy efficiency over fossil fuels. The possibility of using H2 combined with conventional fuels in internal combustion engines without significant change in the vehicle has been gaining momentum due to the cost of petroleum products [4].
According to THANIGAIVELAN et al. [5], through experimental research using a diesel engine fueled by a mixture of B20 biodiesel (20% CNSL (cashew nut shell liquid) + 80% diesel) with ethanol in the proportions (5%, 10% and 15% by volume), different flows of hydrogen gas (4 lpm, 8 lpm and 12 lpm) were introduced into the engine intake port in order to examine the system performance. The experimental results showed that the B20 fuel mixed with 10% ethanol and 8 lpm H2 flow rate, provides the maximum heat-to-work (BTE) conversion efficiency. The B20 blend with 10% ethanol and 8 lpm of hydrogen flow provides the maximum BTE of 37.9%, which is higher than the efficiency of the engine powered by diesel fuel alone, which at full load achieves a maximum BTE of 33.6%. In addition, this fuel combination led to maximum CO and HC emission reduction levels.
According to KANTH et al. [6], hydrogen enrichment in the mixture of biodiesel honge and diesel is used in a compression ignition engine. Biodiesel is derived from honge oil and mixed with diesel oil at 20% (v/v). After that, hydrogen at different volume flow rates (10 and 13 lpm) is introduced into the intake manifold. The results of hydrogen enrichment on performance, combustion and emission characteristics are investigated by examining heat-to-work conversion efficiency, fuel consumption, HC, CO, CO2, NOx emissions, cylinder pressure, combustion duration and heat release rate. The engine fueled with biodiesel honge blend is found to improve thermal efficiency and combustion characteristics. Compared to diesel, BTE increased 2.2% and reduced fuel consumption by 6% for the HB20 + 13 H2 blend. In addition, reductions in exhaust emissions such as CO and HC are achieved by 21% and 24%, respectively.
According to CASTRO et al. [7], the engine performance and maximum replacement of diesel by hydrogen in a turbocharged four-cylinder direct injection engine with the measurements made at three engine loads (30%, 60%, 100%), keeping the engine speed constant (2400 rpm), according to the experimental measurements, the maximum hydrogen energy replacements were 80%, 60% and 40% corresponding to engine loads of 30%, 60% and 100%, respectively. The maximum reduction in diesel consumption was 54.2% compared to the 100% diesel operation with 30% engine load and 80% hydrogen energy substitution, where carbon dioxide emissions were reduced in most cases, while the effect on NO emissions depends on the engine load level. At low engine load, a reduction in NO emissions was observed as the hydrogen addition increased.
Other studies using hydrogen gas generated by the electrolysis of water to reduce gaseous emissions show a reduction for CO and CO2 gases [8], but a slight increase in NOx emissions [9]. In addition, there are also examples of this application in fuel intake in the Otto cycle, in the operation of hydrogen–diesel bi-fuel in a low-capacity compression ignition engine, and in the use of a natural gas engine [10,11]. Therefore, the use of hydrogen in moto generators used in thermoelectric power plants is an alternative that favors the reduction in gas emissions, helping to mitigate greenhouse effects [12] in addition to obtaining a reduction in fuel consumption [13].
Given the above, there have been numerous studies regarding the use of hydrogen and oxygen gases as part of the fuel mixture with the objective of modifying the combustion behavior and consequently reducing the emission of greenhouse gases and analyzing the impact of this modification on engine fuel consumption. Although the method of injection of the analyzed gases is normally carried out through aspiration of these in the air intake line [14,15,16], few studies seek to analyze different configurations of liquid and gaseous fuel injections, such as, for example, the emulsion of these directly in the fuel inlet line [17]. In addition, studies that seek to analyze the impact of the use of gases in combustion typically make use of stored hydrogen, while the on-demand use of gases is still an underdeveloped topic in the literature and may present a good relationship between electric energy consumption during electrolysis and consumption of liquid fuel and greenhouse gases reduction. Thus, the study sought to analyze the quantitative emission of gases, liquid fuel consumption and the profile of the internal combustion curves of the system using hydrogen and oxygen gases produced on demand by an alkaline electrolyzer in the direct injection of the engine fuel.
2. Materials and Methods
The experiments performed in this research were developed at the Advanced Technology and Innovation Institute (IATI), located in the city of Recife and the state of Pernambuco, Brazil, using S10 diesel fuel enriched with a low proportion of hydrogen and oxygen gases immediately before injection. The data acquisition system can be seen in Figure 1, in which the proportion of the exhaust gas was monitored by the TESTO 350 analyzer by clamping the analyzer’s probe against the gas flow from the engine’s exhaust duct. The cylinder combustion pressure and crankshaft rotation angle signals were captured using the AVL GH15DK and Cranck Angle piezoelectric pressure transducer and AVL 366C encoder, respectively, coupled to the AVL Indimicro for proper processing of the acquired signals. In addition, in order to ensure safety during the development of the experiment, the hydrogen gas detector HY ALERT 500 was used to check for possible gas leaks into the environment. Finally, a safety system formed by hydrogen gas sensors coupled to the fuel intake and return lines was implemented, ensuring that there is no excessive amount of hydrogen in the fuel tank.
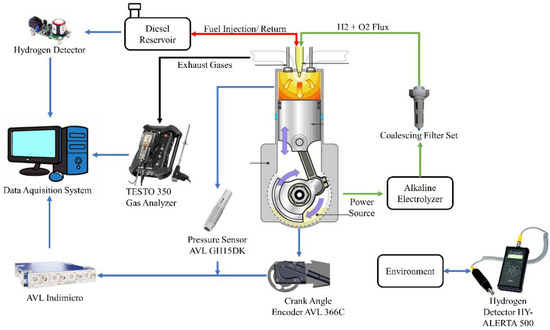
Figure 1.
Flowchart of the test.
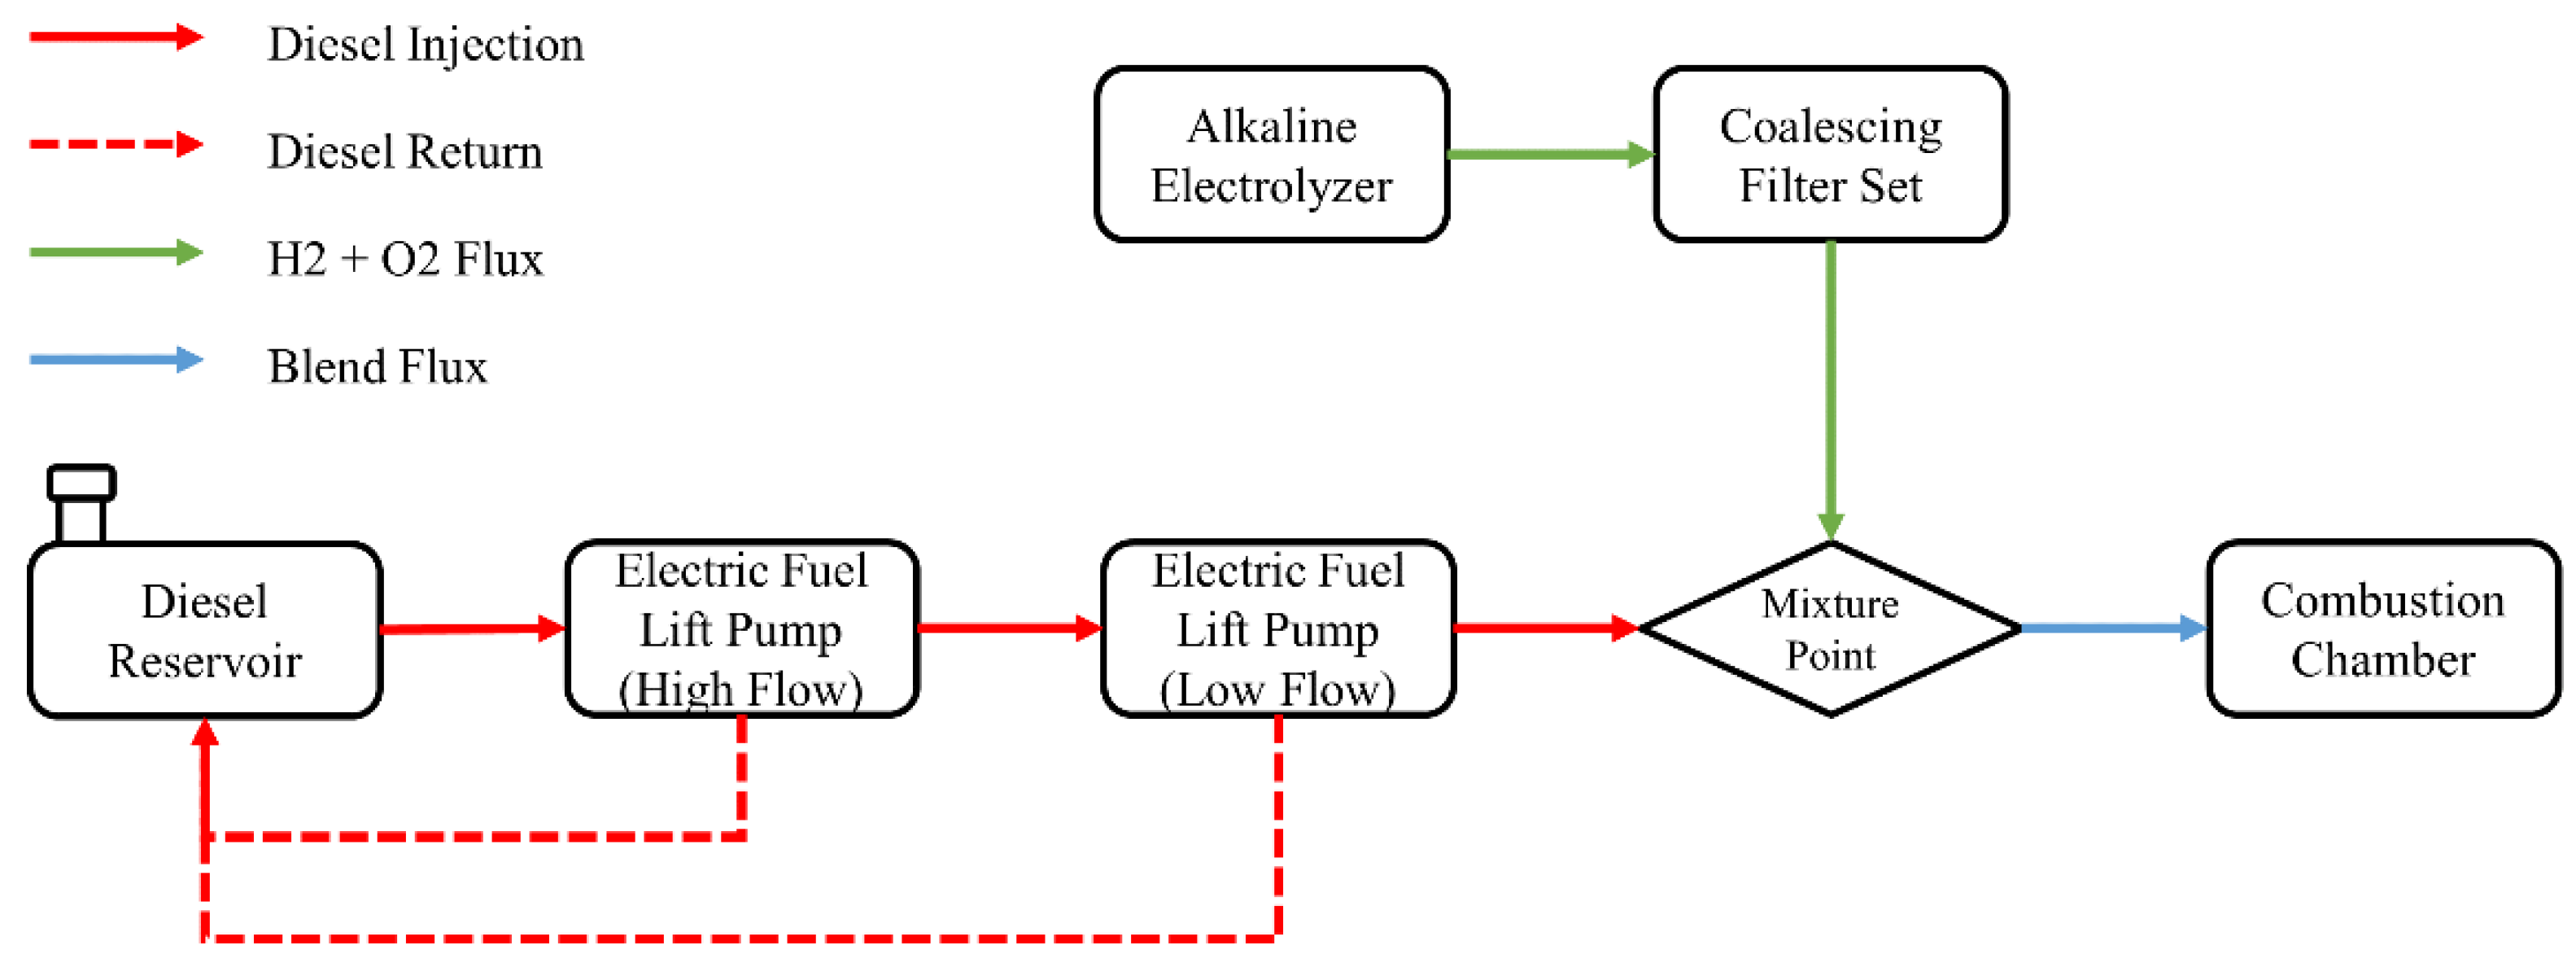
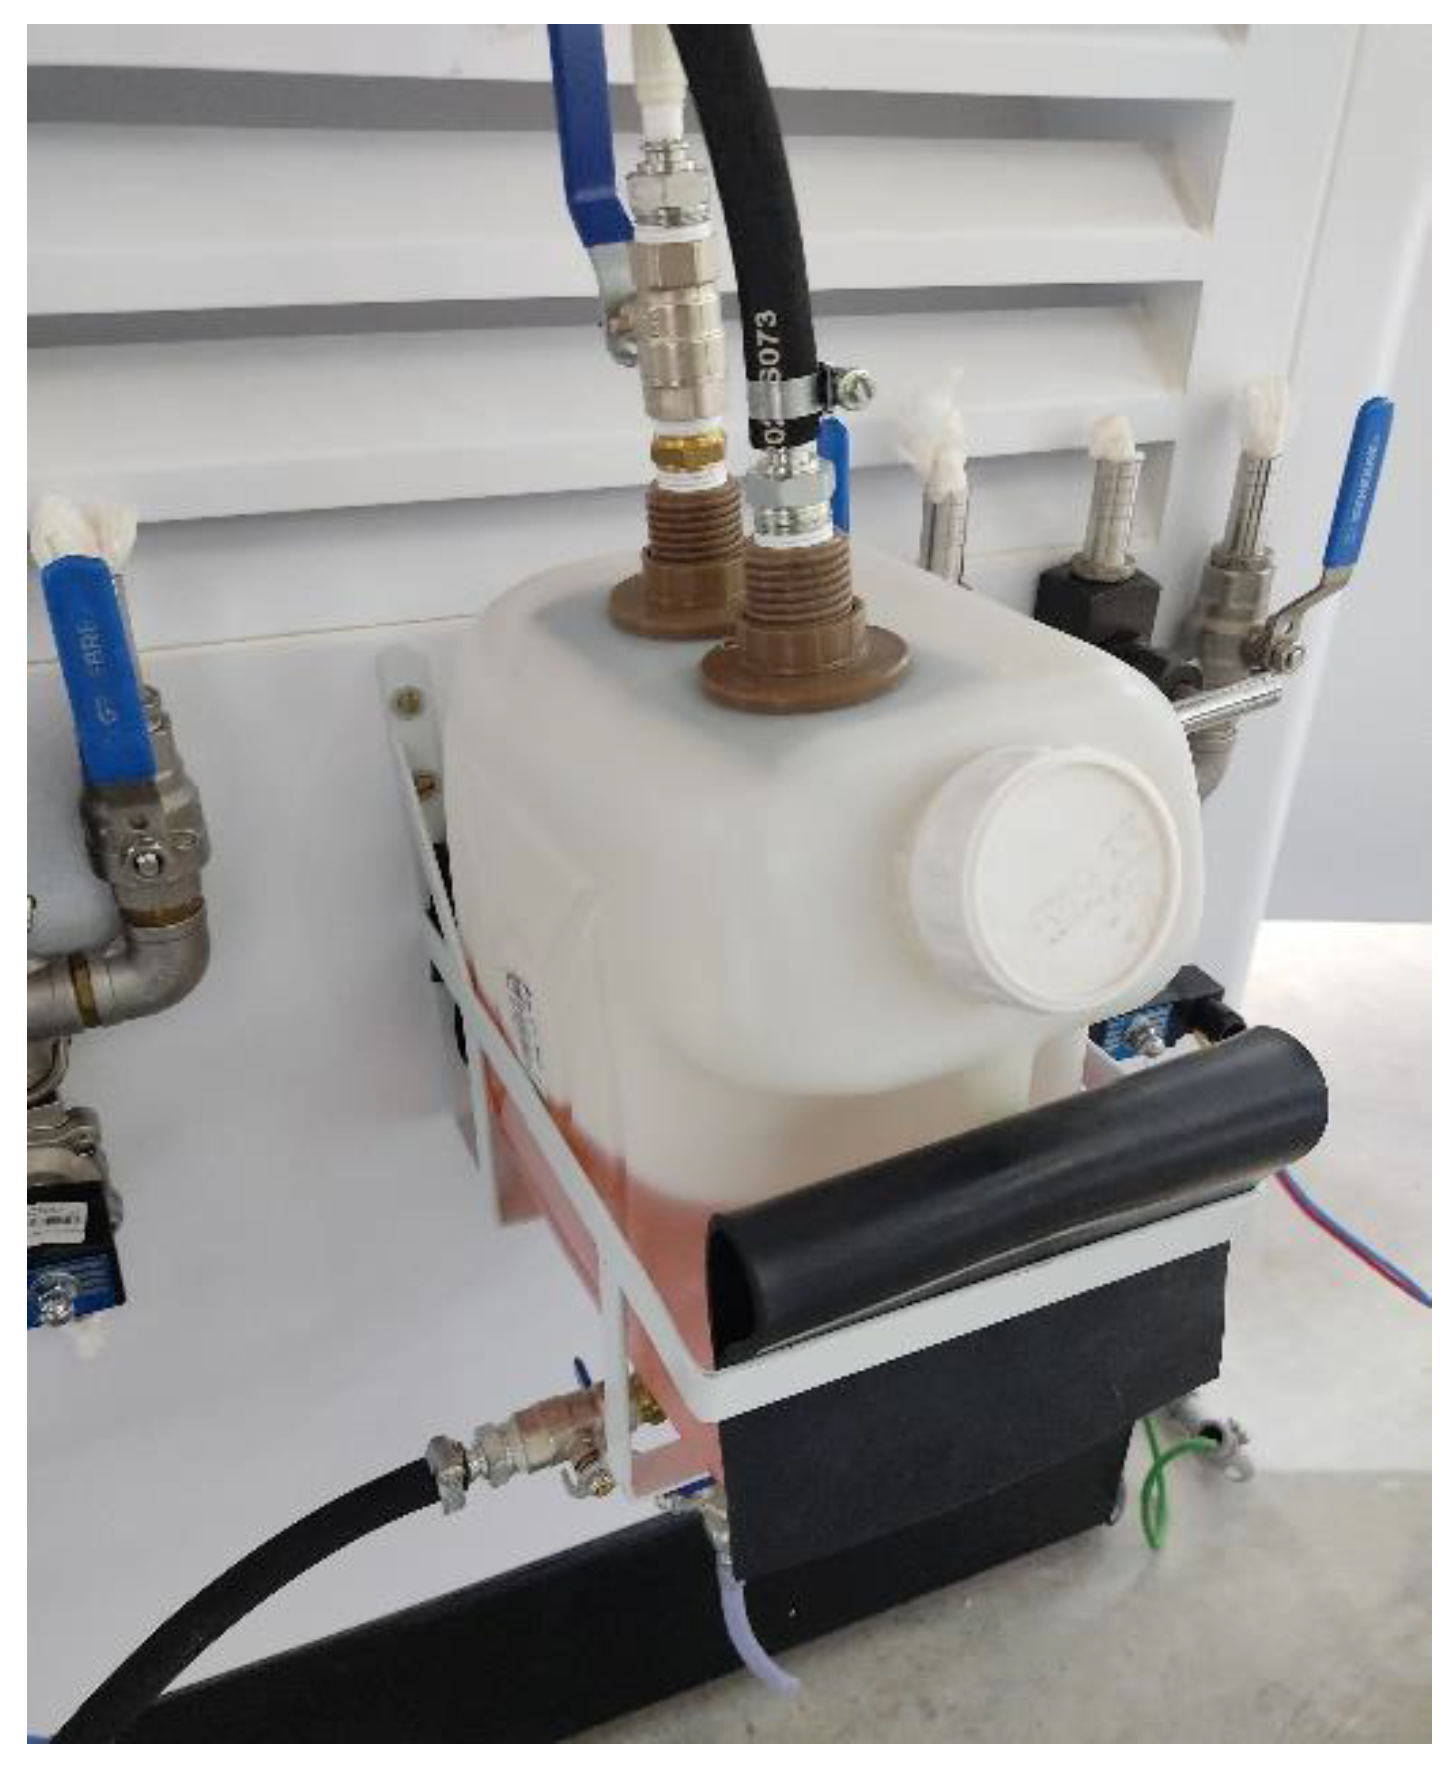
In order to analyze the behavior of greenhouse gases emissions, consumption of liquid fuel and combustion profile, experiments were carried out according to the configuration of supply, return and mixture of fuels shown in Figure 2. The supply of this fuel took place through the use of two electric pumps (high- and low-flow) in order to supply the fuel, provide the necessary amount and return the unused amount to the installed tank. The difference between the amount of fuel given and returned to the tank consisted of the actual mass consumption of the motor generator during the test period. The alkaline electrolyzer responsible for producing the hydrogen and oxygen gases on demand was connected to a set of coalescing filters to remove any moisture present in the gas stream, and the resulting gases were mixed with the liquid fuel immediately before inlet.

Figure 2.
Fuel supply configuration flowchart.
To guarantee a better performance in hydrogen and oxygen gas production from the alkaline electrolyzer, the water purification process was carried out before the tests. For this, the Millipore Direct-Q3 UV system was used, which provides water treated by reverse osmosis and ultra-pure water with a standard resistivity of 18.2 MΩ.cm at 25 °C to supply the electrolyzer. To measure the actual conductivity value related to the water used in each experiment, the Peak Tech 5125-Ultrapure Water Conductivity Meter was used.
The weighing procedure consisted of filling a reference reservoir up to the initial standard value of 7000 g ± 1 g using a precision balance METTLER TOLEDO BBA 242 point. After the initial weighing, the fuel was transferred from the reference tank to the fixed tank shown in Figure 3. To avoid error propagation due to uncertainties in fuel transfer, a second weighing of the reference tank was carried out, making it possible to determine the total fuel fed to the engine. Finally, after the operation period, the remaining fuel was drained in order to calculate the final consumption of each test.

Figure 3.
Fixed tank for diesel supply.
At the beginning of each batch of tests, the engine was pre-heated during a period of 30 min in order to guarantee the stationarity in consumption values collected. For the heating process, the system used the same resistive load fixed during the tests themselves (20 kW). Finally, given the 30 min of pre-heating, all the remaining fuel available in the tank was drained in order to accurately quantify the amount of fuel consumed during each test performed. It was possible to perform a total of 42 tests, 30 of which lasted 30 min and 12 tests lasted 60 min. Among the 30-min configuration, 15 tests were carried out without the usage of the alkaline electrolyzer (diesel only) and 15 with the mixture of liquid and gaseous fuel. In order to mitigate any long-term effects on the performance of the electrolyzer, the test settings were alternated between diesel only and blended fuel. The 60-min tests followed the same method used for the 30-min tests.
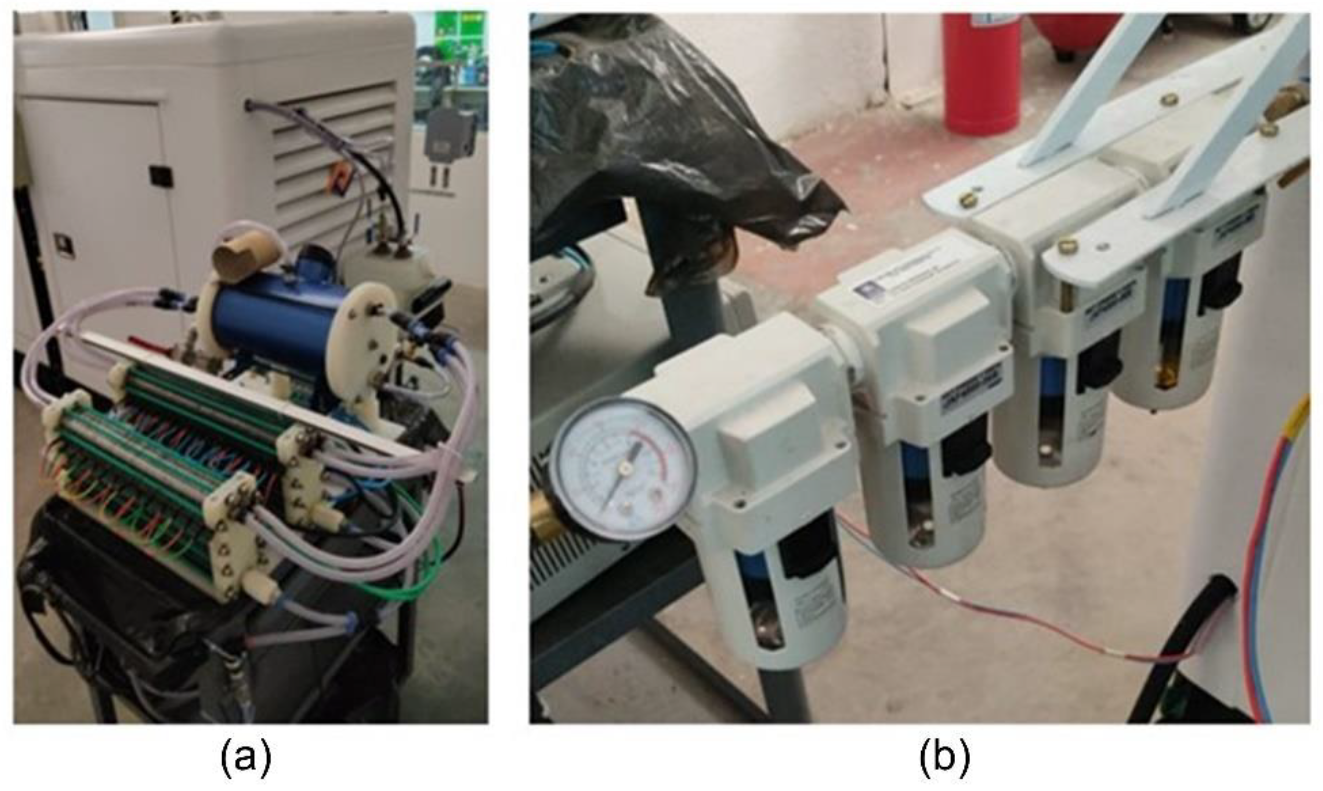
Perkins 1104A-44G 4-stroke diesel engine was used for the test set at a speed of 1800 rpm. The simulation and control of the load used by the engine was given by coupling a Micateck CRES 1110 (30 kW) resistive load bank, in which only 20 kW (28.4 A) was used, equivalent to about 38.46% of the total load supported by the motor-generator, as we can see in Figure 4.
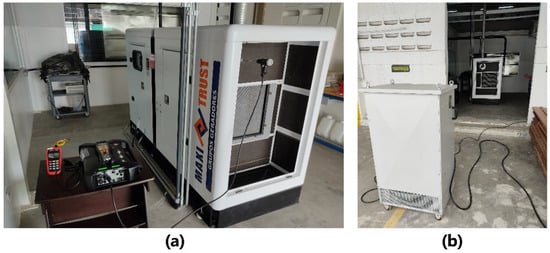
Figure 4.
(a) Test setup with the TESTO 350 and (b) test setup with the resistive load bank.
In order to generate hydrogen and oxygen to be used in the combustion, benchtop alkaline electrolyzers coupled to a gas and fluid recirculation tank that held the generated gases were used, as in Figure 5a. In addition, the skid–electrolyzer–moto generator connection took place through the humidity retention dryer assembly by means of an adaptation of the low pressure diesel feed line Figure 5b. Using Omega FMA1000 gas flow meter, it was possible to verify the flow of hydrogen and oxygen gases from the electrolysis and, from this, determine the total gas production during the operation. This flow was set at 365 L/h, considering the power consumption of 134.5 ± 35.4 watts for the alkaline electrolyzer, at an ambient temperature of 33.7 °C and local humidity of 63.9% RH during the test.

Figure 5.
(a) Physical arrangement of the experiment and (b) filter connected to the system.
Combustion of hydrocarbons can be simplistically characterized as an overall two-step process: the first step involves the breakdown of fuel to carbon monoxide, while the second step is the final oxidation of carbon monoxide to carbon dioxide. It is known that the oxidation of CO is a relatively slow process unless hydrogen-containing chemical species are present. Even small amounts of H2O or H2 can have a big effect on the rate of oxidation. Thus, when water is the main hydrogen-bearing chemical species, the following four steps describe the oxidation of CO:
According to Turns and Haworth [18], the step described in Equation (1) is slow, so it does not significantly contribute to the formation of CO2, but it acts as an initiator of the chain reaction. The CO oxidation step itself (Equation (3)) is also a propagation step, which produces H that reacts with O2 to form OH and O (Equation (4)). These radicals, in turn, feed the oxidation step (Equation (3)) and the step (Equation (2)). Equation (3) represents the main reaction in the chain reaction scheme.
In turn, when H2 is used as a catalyst, the following steps are involved:
With the presence of hydrogen, the entire kinetic mechanism of the H2–O2 system involves a series of reactions that need to be considered to describe the oxidation of CO. According to Turns and Haworth [18], depending on the temperature, pressure and degree of progress of the reaction, the reverse reactions of all these listed reactions can be important. Therefore, in the modeling of the H2–O2 system, depending on the temperature, pressure and degree of progress of the reaction, a sequence of 20 reactions that can be important, including their reverse ones, indicates that up to 40 elementary reactions must be considered, involving eight chemical species: H2, O2, H2O, OH, O, H, HO2 and H2O2. Turns and Haworth [18] indicate that, with the presence of HO2, another route for CO oxidation opens, represented in Equation (7). However, this reaction is not as important as the attack of OH on CO (Equation (3)).
This way, mechanisms that adopt the presence of H2 or even the presence of water tend to produce an increase in the CO oxidation rate. On the other hand, according to Lilik [19], 95% of the NOx emitted in internal combustion engines corresponds to NO. Furthermore, in the atmosphere, NO oxidizes to NO2. It also highlights that the presence of unburned hydrocarbons and sunlight increase the rate of oxidation of NO into NO2. In the combustion of fuels that do not contain nitrogen in their elemental composition, nitric oxide is formed through four chemical mechanisms, which involve nitrogen from the air: the thermal (Zeldovich mechanism), the Fenimore (also called immediate mechanism), the N2O-mediated mechanism and the NNH mechanism. The thermal mechanism dominates NO formation in high-temperature combustion over a rather wide range of equivalence ratios, while the Fenimore mechanism is particularly important in rich combustion.
Regarding the formation of NO in the combustion of hydrocarbons, two mechanisms are more relevant, as presented in Turns and Haworth [18]. The first of these, the Fenimore mechanism, is closely linked to the chemistry of hydrocarbon combustion, in which Turns cites Fenimore, who found that some NO was rapidly produced in the flame zone of premixed laminar flames long before there was time available for combustion formation of NO by the thermal mechanism, and this rapidly formed NO is immediately designated NO. The general scheme of the Fenimore mechanism is described as the reaction of hydrocarbon radicals with molecular nitrogen forming amines or compounds with the cyano group (–C≡N), which are converted to intermediate compounds and which then go on to form NO. Without demonstrating initiating steps that form CH radicals, the Fenimore mechanism can be written as Equations (8) and (9) where Equation (8) is the main route and the sequence that limits the rate of NO formation.
Another more recently discovered mechanism, called the NNH mechanism, has two main steps that can be represented by Equations (10) and (11). For Turns and Haworth [18], this route is particularly important in the combustion of hydrogen and for hydrocarbons with a high value of the ratio between carbon and hydrogen atoms.
Released into the atmosphere, we have nitric oxide, which oxidizes to form nitrogen dioxide, NO2, important in the production of acid rain and photochemical smog. Many combustion processes, however, emit significant fractions of their total nitrogen oxides (NOx = NO + NO2) in the form of NO2. The formation of NO2 before exhaustion of combustion products can be described through the following steps (Equations (12–14)).
Finally, Turns and Haworth [18] clarifies that HO2 radicals (represented in Equation (15)) are formed in regions of relatively low temperature. Thus, the formation of NO2 occurs when the NO molecules from the high-temperature regions undergo diffusion or are advected by the flow into the HO2-rich regions, and the NO2 destruction reactions, (Equations (13) and (14), are active at high temperatures, preventing the formation of NO2 in high temperature regions.
Regarding exhaust gas emission levels data acquisition, these signals were collected by the gas analyzer considering a test duration of 30 min, with measurements being taken each minute of operation. Concomitantly, 1000 combustion cycles were captured referring to cylinder pressure and crankshaft rotation angle, making it possible to obtain sufficient information about the work performance performed by the engine during the considered operation.
The calculation regarding the quantitative emission levels given by the gas analyzer TESTO 350 considers diesel fuel with 3% oxygen reference and 15.6% CO2 reference. The equations below show the logic of the calculation for each of the gases analyzed as indicated by the manufacturer [20].
where:
- CO2max—Specific value of carbon dioxide;
- O2ref—Oxygen reference value;
- O2—Measured oxygen content in %;
- CO—Measured carbon monoxide content;
- NO—Measured value of nitrogen monoxide;
- NO2add—Nitrogen monoxide addition factor.
To measure the influence of the hydrogen and oxygen gases addition on combustion performance and the work performed by the engine, the combustion chamber pressure data and the displaced volume referring to the piston position during each cycle were used. To calculate the displaced volume, it was necessary to provide inputs to the signal analysis software handled by the AVL Indimicro. In all, information about the engine structure was fixed, such as the number of cylinders, the type of fuel used, and the combustion sequence of the system. In addition, engine geometry measurements (cylinder bore, connecting rod size, engine stroke) and the combustion-related polytropic coefficients were also provided as input. Figure 6 illustrates the parameterization scheme required by the software (a), as well as the information that was fixed as input (b).
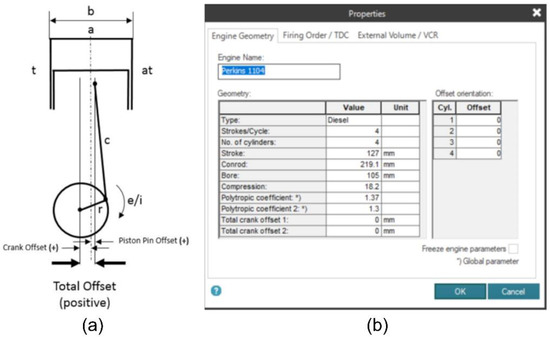
Figure 6.
(a) Geometric values required by the software (b) input of Perkins 1104A-44G engine information into the software.
The choice of the performance parameter to be monitored took into consideration not only the goal of analyzing the engine’s work, but also of guaranteeing the parameter’s application coverage, regardless of the system’s generation capacity. Thus, the monitoring of the indicated mean effective pressure (IMEP) was chosen, which considers the theoretical pressure that would be required to produce the same gross work under the cylinder without considering friction losses in both tests [21]. The IMEP calculation can be given by the ratio of the net work performed (Wi) during the combustion cycle by the displaced cylinder volume (Vd), presented in Equation (19) [22].
Finally, a very important factor to be analyzed when simulating a combustion model is the fraction of fuel burned during complete combustion. This rate is called the Wiebe combustion model and predicts the mass fraction of fuel burned (x) as a function of the engine crankshaft rotation angle () during the combustion cycle, the combustion duration (), the start of combustion (), an efficiency parameter (a), and the form factor (m) as shown in Equation (20) [23].
3. Results and Discussion
Descriptive statistics of the central tendency and dispersion of the crank angle referring to a fraction of 5% and 90% of burned fuel mass are shown in Table 1. These values were generated by the crossing engine rotation angle information provided by the AVL 366C encoder and the pressure data captured by AVL GH15DK piezoelectric pressure transducer over 1000 combustion cycles considering a load of 20 kW. Both the starting angle of the combustion (5%) and the angle referring to the end of the cycle (90%) were anticipated in the blend configuration by 4.54% and 5.27%, respectively. This can be explained due to the lower minimum ignition energy of the blend when compared to pure diesel (0.63 MJ) due to the minimum ignition energy of hydrogen gas (0.02 MJ), which makes the mixture more sensitive the ignition. In addition, the laminar speed of the flame propagation of the proposed blend is also higher since the hydrogen gas flame is able to propagate at a much higher speed (291 cm/s) than the diesel flame speed (33 cm/s), which leads the blend having a shorter combustion duration (26.229 deg from 5% to 90% for the diesel configuration and 24.797 deg for the blend configuration) [24].

Table 1.
Mass fraction burned statistics at 5% and 90%.
The frequency distribution of the mass fraction burned angle values (5% and 90%) can be seen in Figure 7 for 1000 combustion cycles analyzed. Mann–Whitney U test confirmed (95% of confidence) that there is a significant statistical difference between the distribution of crank angles for 5% and 90% of mass fraction burned between the two analyzed configurations (p-value < 0.05). Cohen’s D test revealed that the impact of hydrogen gas on the burning distribution at the beginning of combustion (5%) is greater than the impact at the end of combustion (90%), with values equal to 1.577 and 0.878, respectively. As the proportion of hydrogen and oxygen gases introduced into the blend is low and these are burned faster, the effect of accelerating flame propagation is concentrated at the beginning of combustion.
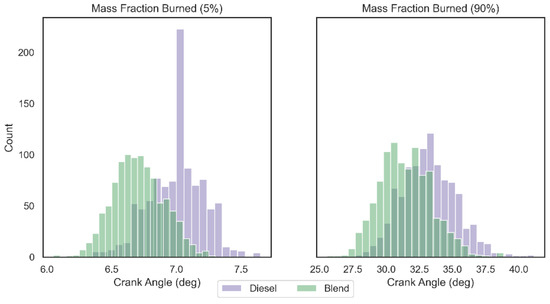
Figure 7.
Crank angle histogram for mass fraction burned at 5% and 90%.
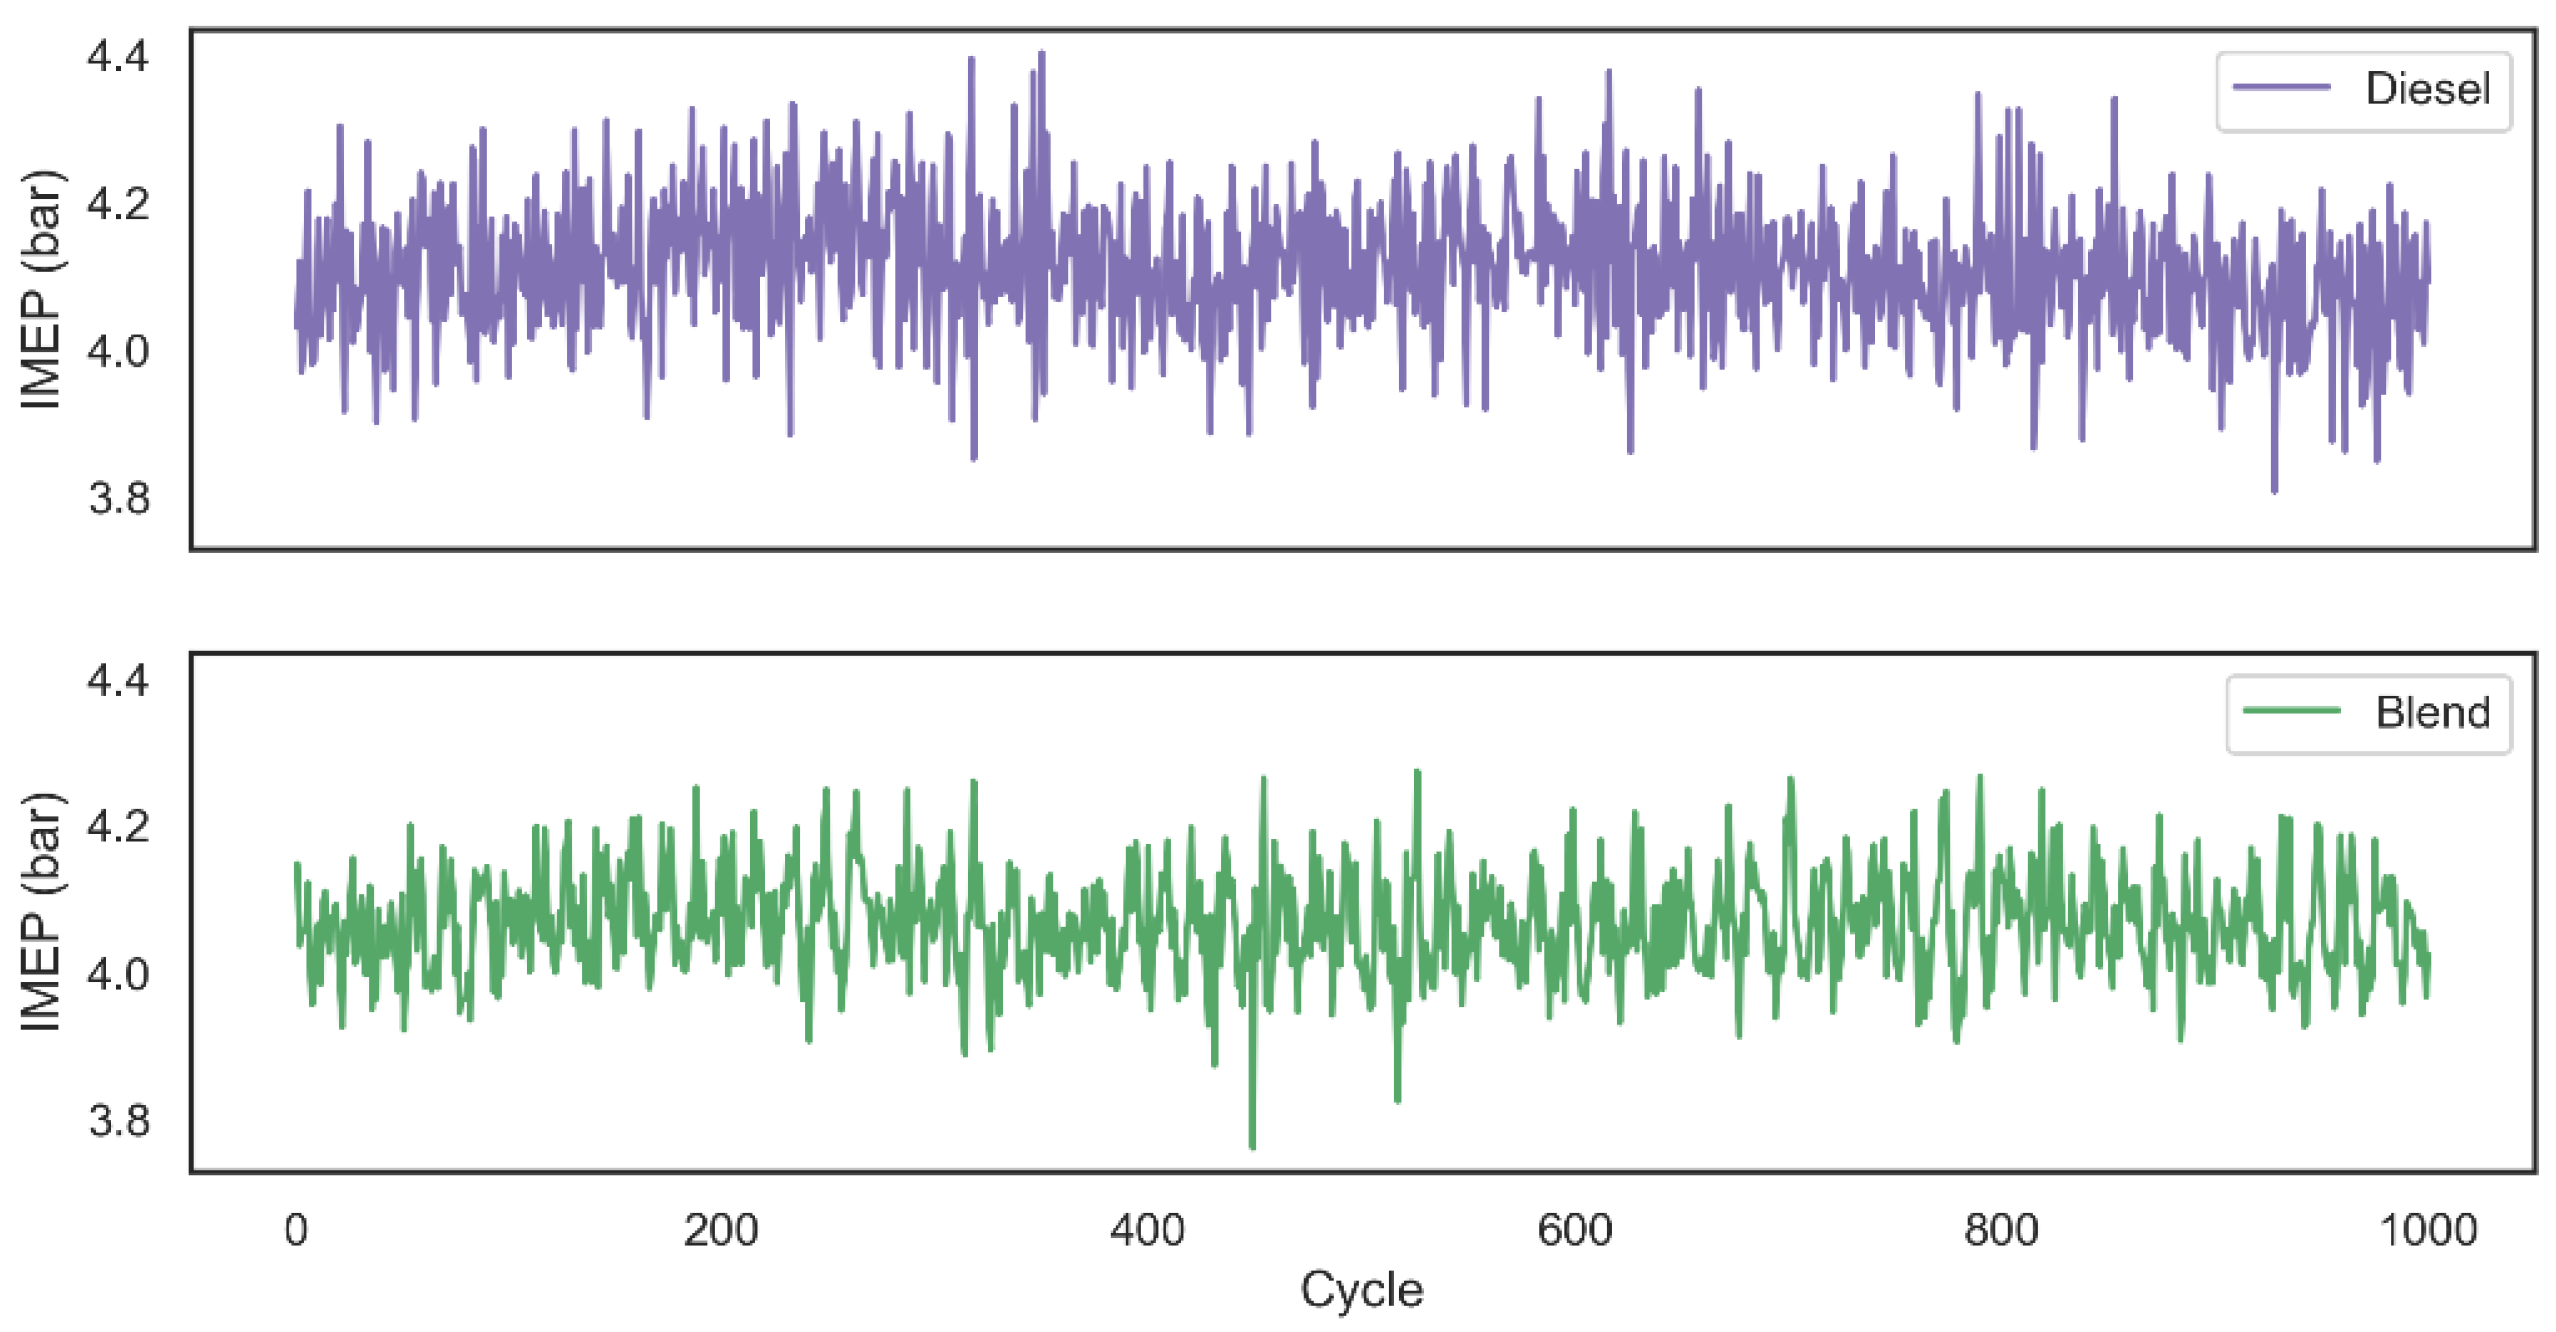
Descriptive statistics of central tendency and dispersion for IMEP related to each one of the 1000 cycles are shown in Table 2. As expected, since the blend combustion duration was shorter than the first configuration analyzed, the IMEP average for blend tests was 1.07% lower than the combustion that used only diesel as fuel. It was also possible to observe that the introduction of hydrogen and oxygen gases into the system ensured a more stable combustion, since the standard deviation of the work performed in each cycle decreased. The decay related to the work performed by the system can also be related by the fact that the production of hydrogen and oxygen gases by the alkaline electrolyzer had as its power source the output of the motor generator in a range of 134.5 ± 35.4 W.
Table 2.
IMEP statistics for both configurations.
AVL Indimicro software calculated IMEP values related to 1000 combustion cycles using two tested configurations are graphically represented through Figure 8. Based on the literature review, it was observed that studies which analyze the combustion after the introduction of hydrogen gas into the system are normally assisted through pressurized gas tanks. Although this configuration makes it possible to analyze the impact of the addition of gas on parameters such as duration and flammability of combustion, fuel consumption and exhaust gas emission [25], it is not possible to analyze the impact of combustion assistance in a real situation that would produce the gas on demand using the engine’s own power as the energy source for the electrolysis process. In view of this, the diesel fuel consumption and the gas emissions of the two configurations were analyzed using the assistance of hydrogen and oxygen on demand.
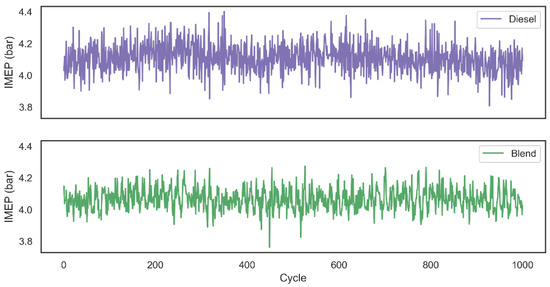
Figure 8.
IMEP for both configurations over 1000 combustion cycles.
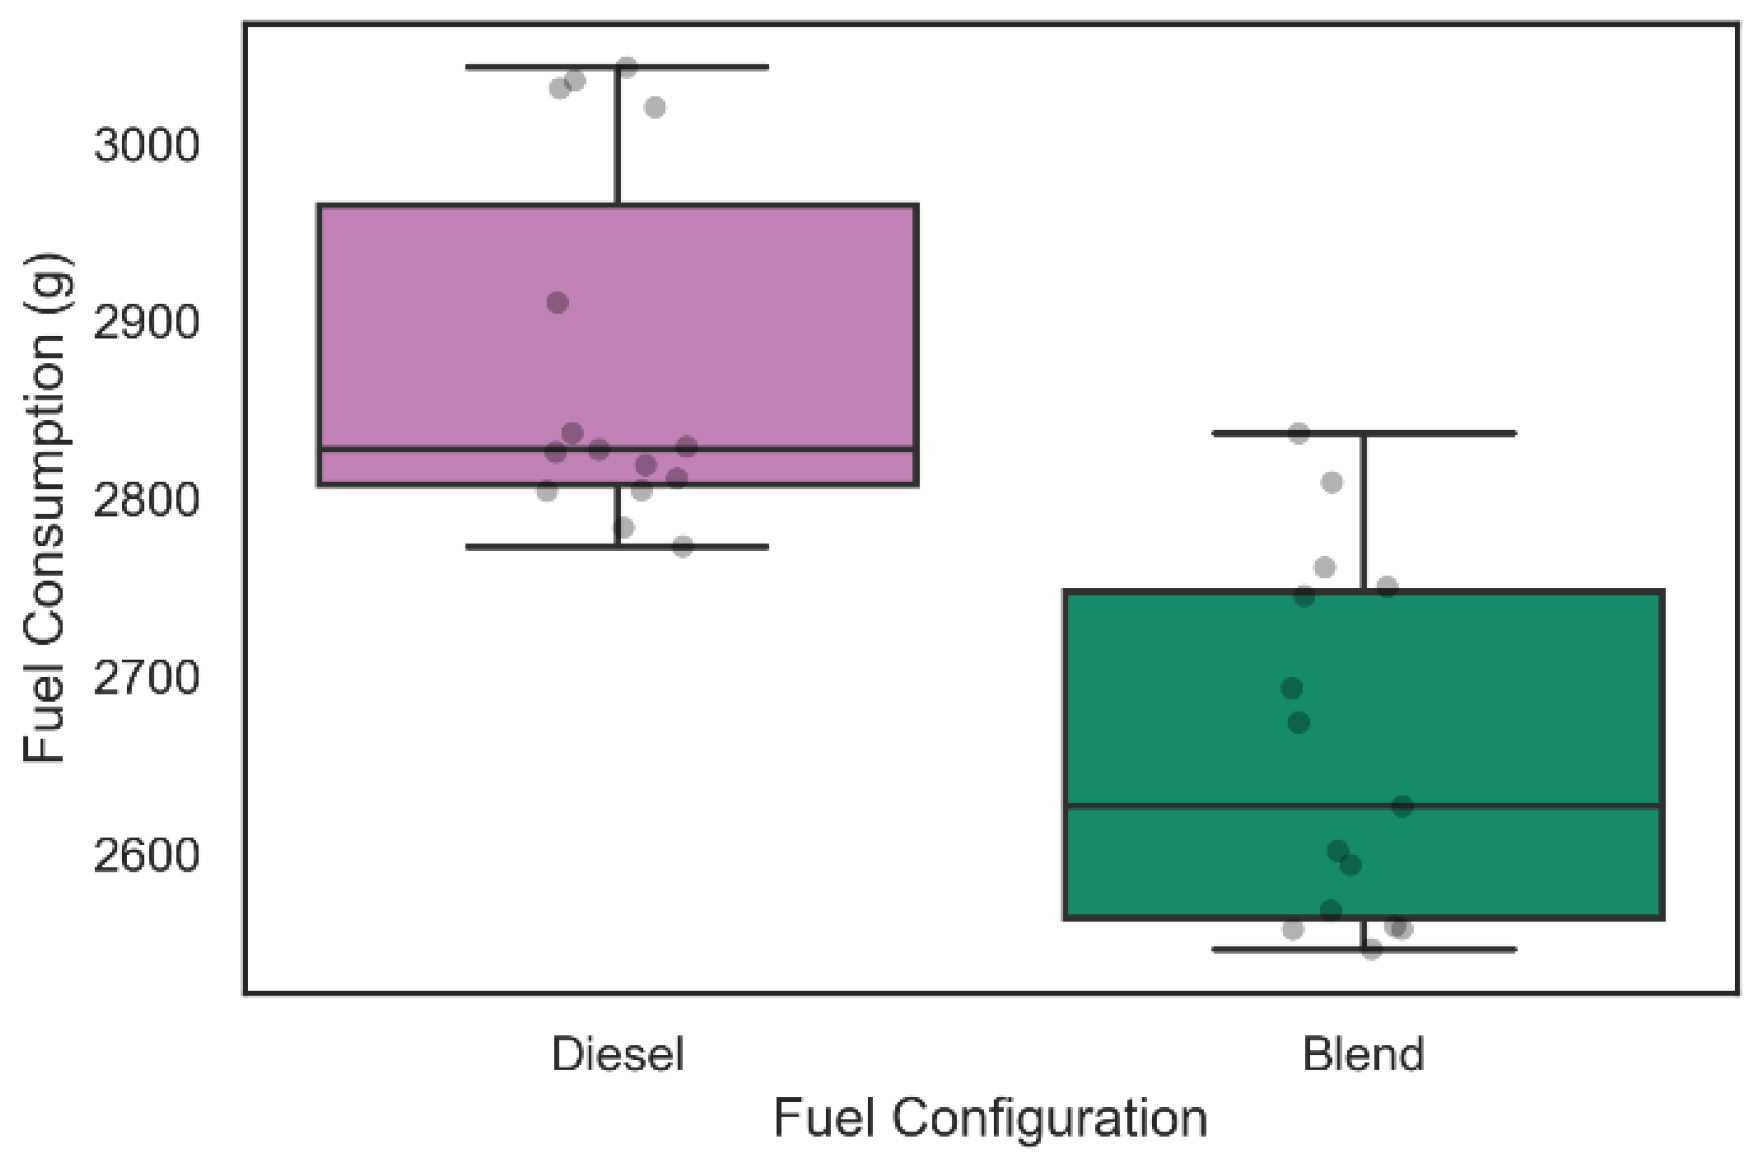
Regarding the analysis of fuel consumption in the 42 tests carried out, the weighing process was performed in each of the tests as described above. Figure 9 and Figure 10 show the distribution of diesel fuel consumption for the 30 tests of 30 min and for the 12 tests of 60 min, respectively.

Figure 9.
Diesel consumption during 30-min tests.
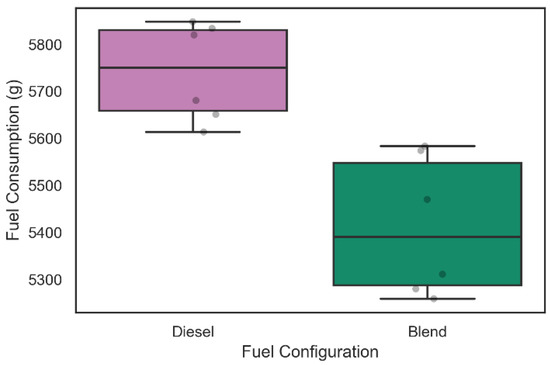
Figure 10.
Diesel consumption during 60-min tests.
From the data shown in Figure 9, it was possible to verify that the average diesel consumption of the 15 30-min experiments that considered only the admission of diesel was 2876.9 ± 153.3 g with a reliability level of 95%. In addition, it is possible to observe that the average diesel consumption of the configuration with the inclusion of the electrolyzer in the intake system was 2658.4 ± 151.8 g following the same level of reliability. A two-sample Kolmogorov–Smirnov test was performed and rejected the null hypothesis that the samples were taken from the same population (p-value = 5609 × 10−6). This information suggests a level of fuel consumption reduction of 7.59% during 30 min of operation with the admission of gaseous fuels on demand in the engine.
Similarly, the diesel consumption related to the six 60-min tests illustrated in Figure 10 was 5741.0 ± 157.1 g when only diesel was used in admission, while with the inclusion of the electrolyzer in the intake system, the diesel consumption was 5412.8 ± 223.6 g. A Kolmogorov–Smirnov test for two samples was performed and rejected the null hypothesis that the samples were taken from the same population (p-value = 2165 × 10−3). This information suggests a level of fuel consumption reduction of 6.06% during 60 min of operation with the admission of gaseous fuels on demand in the engine. The increase in fuel consumption in the blend configuration for the 60-min tests compared to the 30-min tests may have occurred due to alkaline electrolyzer performance decrease during operation that can be related to the device heating and consequent generation of steam in the work circulation fluid.
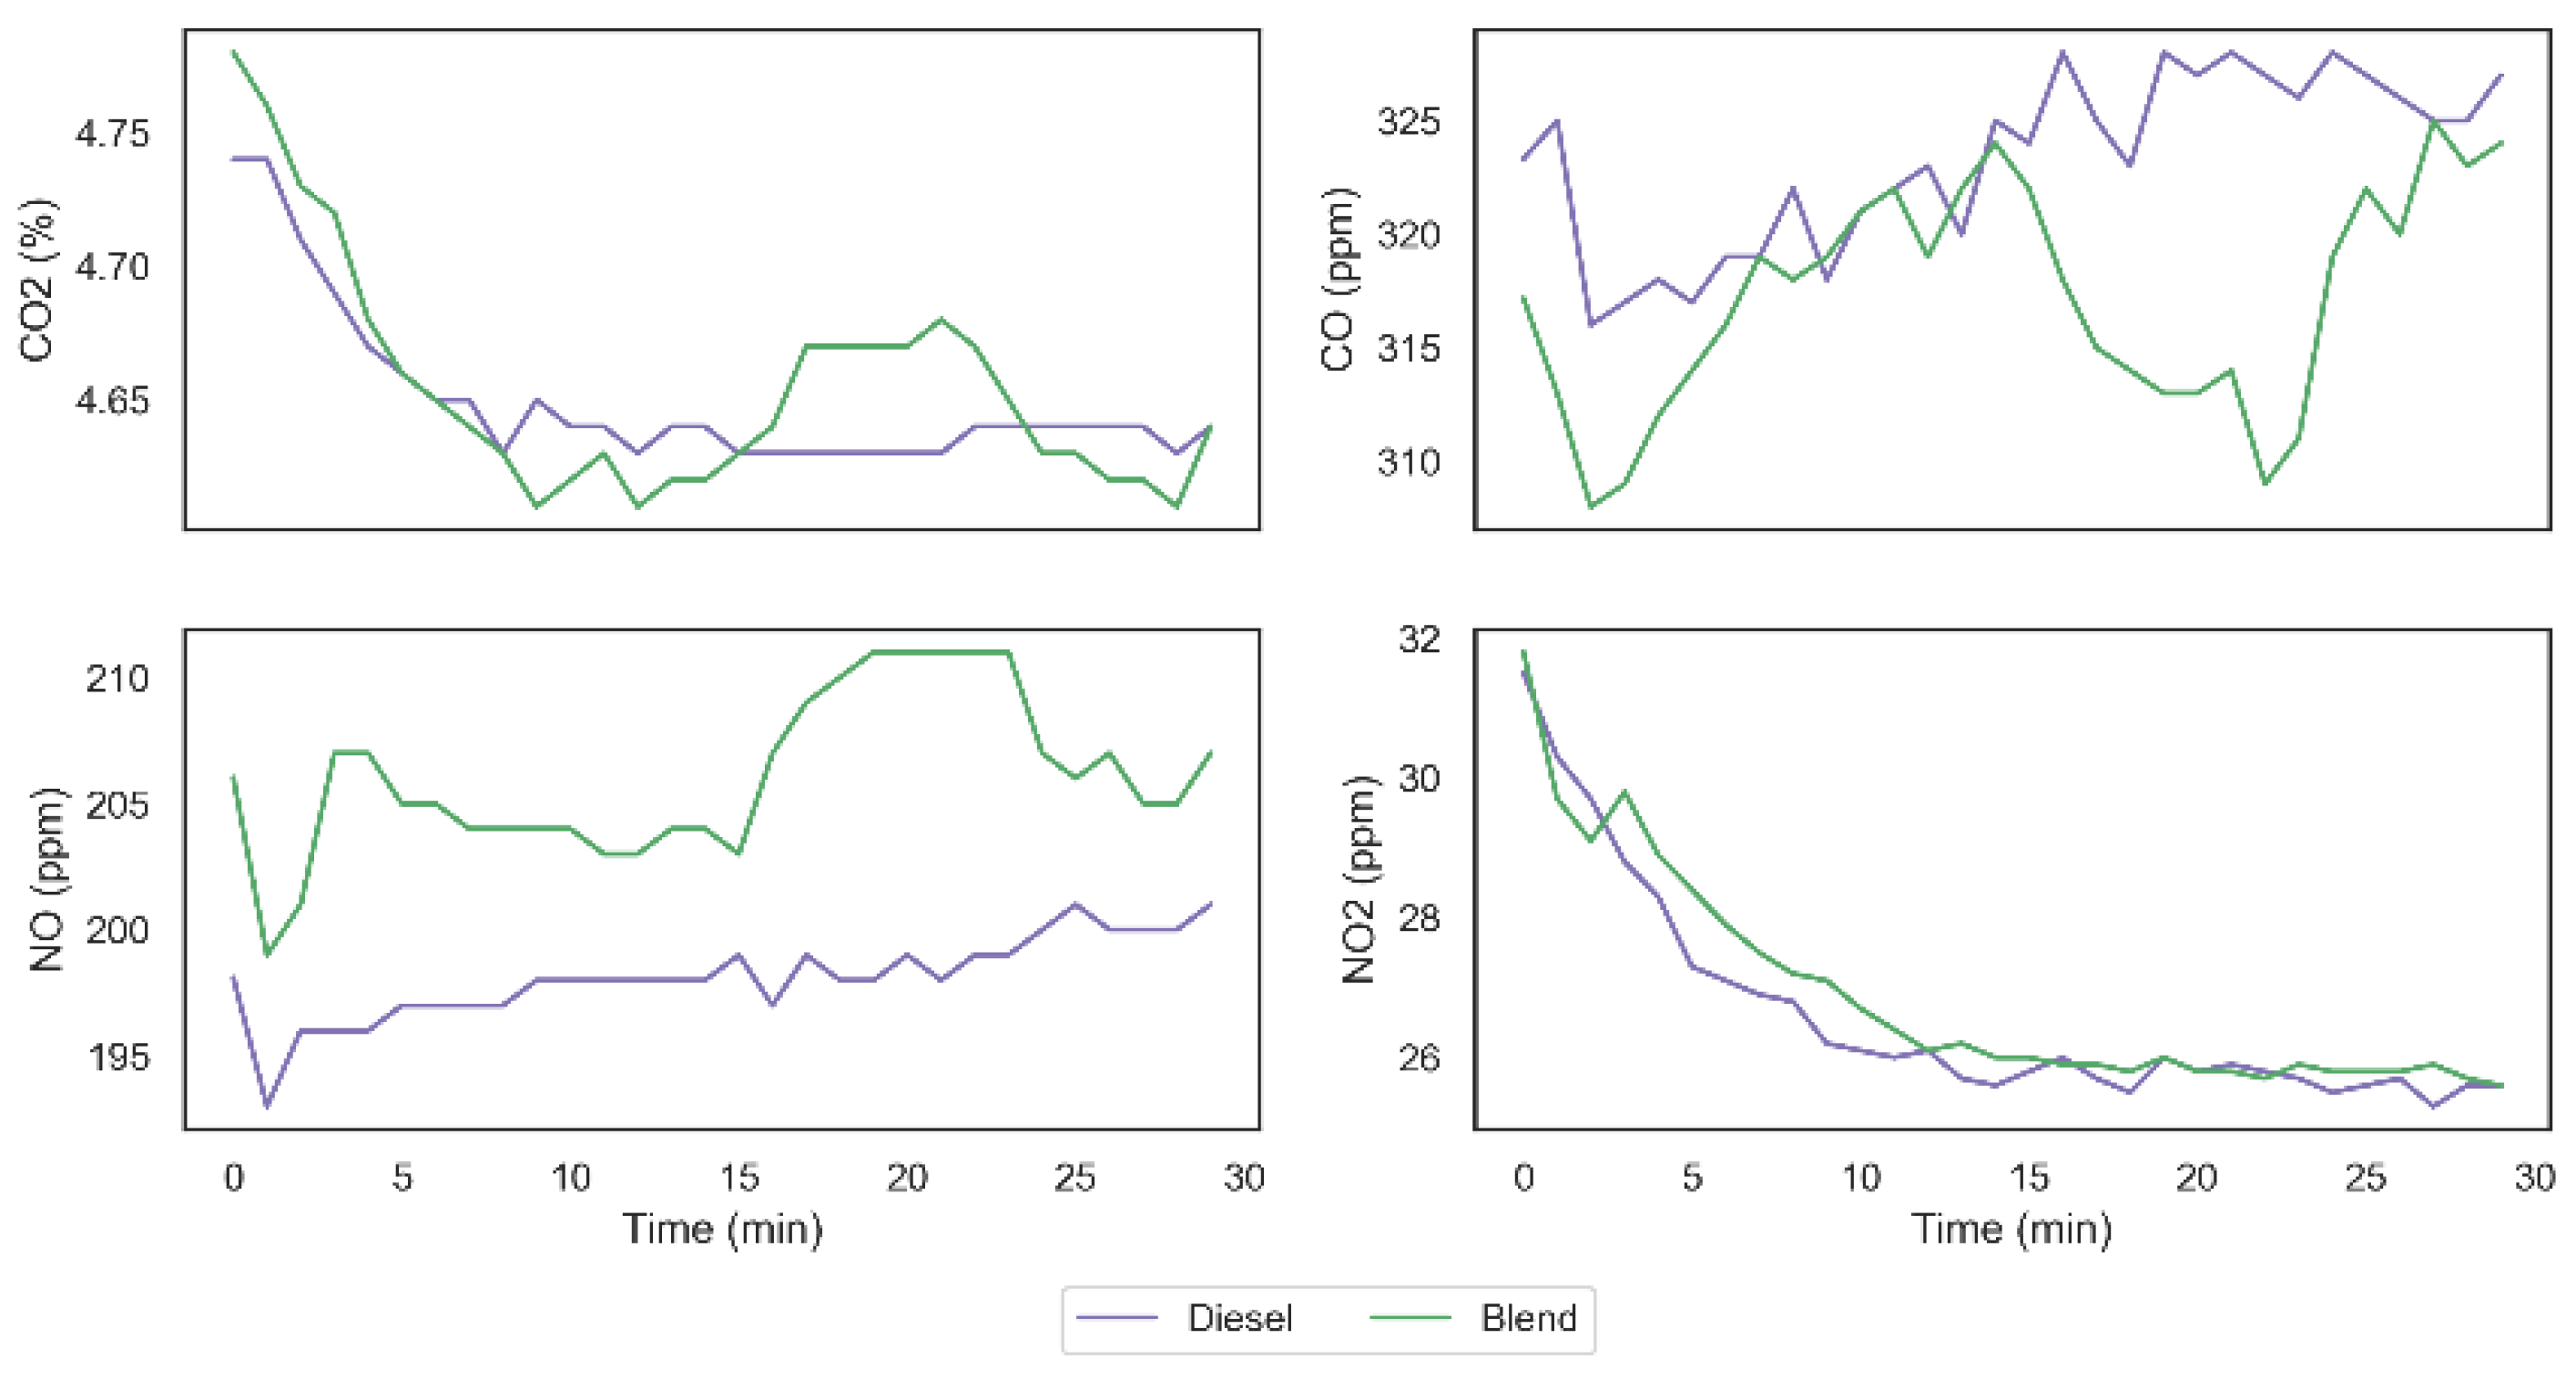
Regarding the study related to the engine’s exhaust gas emission behavior after the addition of hydrogen and oxygen in the fuel intake line, the data were collected through TESTO 350 gas analyzer during two tests lasting 30 min using the same previously analyzed load (20 kW) and both fuel configurations. Descriptive statistics of the central and dispersion tendency for each one of the analyzed exhaust gases are shown in Table 3.
Table 3.
Exhaust gas emissions statistics for both configurations.
From data obtained in the two tests carried out, it was possible to observe that the carbon monoxide (CO) emission was reduced from 323.31 ppm to 317.17 ppm, which represents a decrease of 1.9% in the total emission of this gas. The emission of carbon dioxide (CO2), on the other hand, remained unchanged with the presence of the gases in the system. However, it was possible to observe that the emission of nitrogen monoxide (NO) was increased from 198.10 ppm to 206.03 ppm, generating an increase of 3.9% in the emission of this gas, similar to what can be seen in the work of Adaileh and AlQdah [13]. Finally, despite a larger increase observed in the nitrogen monoxide emission, it was possible to observe a smaller growth in the nitrogen dioxide (NO2) emission from 26.60 ppm to 26.87 ppm. Figure 11 shows the exhaust gas emissions’ behavior in both tests and it is possible to observe that NO and NO2 emissions have similar behavior in both fuel configurations, while the behavior of the CO2 and CO emissions indicate a higher complete diesel burning fraction when using the gases on demand. Similar results were found in [26], which supports the hypothesis that hydrogen and oxygen gases inclusion can impact on burning behavior even with small gas addition proportions.
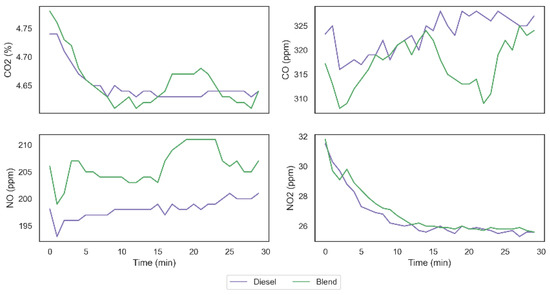
Figure 11.
Exhaust gas emissions behavior.
Considering the results obtained in the tests, we can observe that the addition of H2 and O2 on the combustion mechanism resulted on an increase in the CO oxidation rate culminating in an increase in the efficiency of diesel combustion. Furthermore, the higher temperature obtained with the injection of the gases for the combustion of diesel (specially between 15 and 25 min) can explain the promotion of NO2 destruction in the direction of NO formation, as can be seen in Figure 11 and in Equations (12)–(14), without, however, implying on relevant increase in NO2 emission, since the conditions are not so favorable in this direction.
4. Conclusions
The objective of this work was to analyze the impact related to the inclusion of hydrogen and oxygen gases produced on demand on the engine, when added directly through fuel intake line. Fuel consumption and the amount of greenhouse gas emissions were chosen as monitoring variables to analyze the engine performance parameters. For a better understanding regarding any positive or negative effects related to the combustion profile, parameters such as IMEP and combustion duration for two configurations were analyzed (diesel only and blend). It was possible to develop criteria and standardization for each one of the performed tests, as well as to find differences and correlations between the two used fuel intake configurations.
The introduction of hydrogen and oxygen gases produced by the alkaline electrolyzer brought statistically significant changes to the engine’s combustion profile, also in performance parameters such as fuel consumption and exhaust gas emission. The choice to produce the gases on demand brought about a very interesting alternative compared to studies that normally use only stored hydrogen gas, in which the energy quantification related to the expense to produce such fuel is not accounted for.
It is possible to notice that in both the 30-min and the 60-min tests, there was a substantial decrease in fuel consumption (7.59% and 6.06%, respectively) despite a decrease in the average IMEP performed by the engine (1.07%) with the blend introduction. There is a high performance related to the alkaline electrolyzer production and the used configuration when considering the low electrical consumption provided between the batch of tests (134.5 ± 35.4 W) in contrast to the load generated by the engine (20 kW).
Regarding the exhaust gases emission levels, it was observed that the addition of H2 and O2 gases ensured a temperature combustion increase that caused a more complete burning of diesel and modified the quantity and behavior of greenhouse gas emissions, even with the addition in small proportions. With the change in combustion temperature, it was possible to observe a decrease in CO emission levels and an increase in NOx levels due to the necessity of a higher air flux to complete the combustion mechanism, which indicates an increase in diesel fuel burning efficiency.
Finally, further studies regarding the use of the proposed configuration will be important in order to find any correlations between the engine performance parameters and the constancy of gases production through the alkaline electrolyzer. It is worth mentioning the importance of evaluating new configurations for the introduction of gases, such as: the admission of mixed H2 in the fuel intake line and the addition of aspirated O2; aspirated H2 and O2 added in the diesel intake line; perform the reduction in N2 aspirated from atmospheric air; and, finally, H2 both aspirated and mixed in the engine’s diesel intake line.
Author Contributions
Conceptualization, R.d.C.S.B., E.A.S.-F., A.I.R.D.S. and F.W.B.d.O.; validation, R.d.C.S.B., E.A.S.-F., A.I.R.D.S., F.W.B.d.O., P.B.M.B., R.L.M.d.S. and V.d.A.J.; writing—original draft preparation, E.A.S.-F. and A.I.R.D.S.; writing—review and editing, R.d.C.S.B., E.A.S.-F., A.I.R.D.S. and F.W.B.d.O.; visualization, R.d.C.S.B., E.A.S.-F., A.I.R.D.S., F.W.B.d.O., M.D. and L.A.S.; supervision, R.d.C.S.B.; project administration, R.d.C.S.B.; funding acquisition, R.d.C.S.B. All authors have read and agreed to the published version of the manuscript.
Funding
This research received no external funding.
Data Availability Statement
Not applicable.
Acknowledgments
The authors are grateful to the Instituto Avançado de Tecnologia e Inovação (IATI) and its team at the person of Maira Farias de Andrade Lira (Lira, M.F.A.) for her efforts at the preparation of the original draft and visualization, and Thermoelectric ENERGÉTICA SUAPE II S.A and its team such as Diogo Campos de Albuquerque Silva (Silva, D.C.A.) and Luzivan da Cruz Moura (Moura, L.C.) for the support in data and info validation for this article. This study was funded by the Programa de Pesquisa e Desenvolvimento da Agência Nacional de Energia Elétrica (ANEEL) and the Thermoelectric ENERGÉTICA SUAPE II S.A. as the project ”Desenvolvimento de dispositivo utilizando hidrogênio e oxigênio para redução de gases poluentes no ciclo de combustão carburante”-PD-06599-0007/2019.
Conflicts of Interest
The authors declare no conflict of interest.
Nomenclature
| Abbreviations | |
| BTE | Brake thermal efficiency |
| CN | Cyanide |
| CNSL | Cashew nut shell liquid |
| CO | Carbon monoxide |
| CO2 | Carbon dioxide |
| CO2max | Specific value of carbon dioxide |
| H | Hydrogen |
| H2 | Hydrogen gas |
| HC | Hydrocarbons |
| HCN | Hydrogen cyanide |
| H2O | Water |
| H2O2 | Hydrogen peroxide |
| HO2 | Hydroperoxy radical |
| IMEP | Indicated Mean Effective Pressure |
| IATI | Advanced Technology and Innovation Institute |
| Lpm | Liter per minute |
| N2 | Nitrogen gas |
| NO | Nitrogen monoxide |
| NO2 | Nitrogen dioxide |
| NO2add | Nitrogen monoxide addition factor |
| NOx | Nitrogen oxides |
| O | Oxygen |
| O2 | Oxygen gas |
| O2ref | Oxygen reference value |
| OH | Hydroxide |
| PCI | Lower calorific value |
| PM | Particulate matter |
| SOx | Sulfur oxides |
| Vd | Displaced cylinder volume |
| Wi | Net work |
| Symbols | |
| X | Mass fraction of fuel burned |
| Engine crankshaft rotation angle | |
| Combustion duration | |
| Start of combustion | |
| Efficiency parameter | |
| m | Form factor |
References
- Bourotte, C.; Forti, M.-C.; Taniguchi, S.; Bícego, M.C.; Lotufo, P.A. A winter study of PAHs in fine and coarse aerosols in the city of São Paulo, Brazil. Atmos. Environ. 2005, 39, 3799–3811. [Google Scholar] [CrossRef]
- IEA. Global Energy & CO2 Status Report; IEA: Paris, France, 2019; Available online: https://www.iea.org/reports/global-energy-co2-status-report-2019 (accessed on 10 May 2022).
- Holladay, J.D.; Hu, J.; King, D.L.; Wang, Y. An overview of hydrogen production technologies. Catal. Today 2009, 139, 244–260. [Google Scholar] [CrossRef]
- Farias, C.B.B.; Barreiros, R.C.S.; Da Silva, M.D.; Casazza, A.A.; Converti, A.; Sarubbo, L.A. Use of hydrogen as fuel: A trend of the 21 st century. Energies 2022, 15, 311. [Google Scholar] [CrossRef]
- Thanigaivelan, V.; Loganathan, M.; Vikeswaran, M.; Venkatramananan, S.; Manickan, M. Effect of hydrogen and ethanol addition in direct injection (DI) diesel engine with cashew nutshell. Int. J. Hydrogen Energy 2022, 47, 5111–5149. [Google Scholar] [CrossRef]
- Kanth, S.; Debbarma, S.; Das, B. Effect of hydrogen enrichment in the intake air of diesel engine fuelled with honge biodiesel blend and diesel. Int. J. Hydrogen Energy 2020, 45, 32521–32533. [Google Scholar] [CrossRef]
- Castro, N.; Toledo, M.; Amandor, A. An experimental investigation of the performance and emissions of a hydrogen-diesel dual fuel compression ignition internal combustion engine. Appl. Therm. Eng. 2019, 156, 660–667. [Google Scholar] [CrossRef]
- Bakar, R.; Widudo; Kadirgama, K.; Ramasamy, D.; Yusaf, T.; Karmarulzaman, M.; Sivaraos; Aslfatahi, N.; Samylingan, L.; Alwayszy, S.H. Experimental analysis on the performance, combustion/emission characteristics of a DI diesel engine using hydrogen in dual fuel mode. Int. J. Hydrogen Energy 2022, in press. [Google Scholar] [CrossRef]
- Thiyagarajan, S.; Varuvel, E.; Karthickeyan, V.; Sonthalia, A.; Kumar, G.; Saravanan, C.G.; Dhinesh, B.; Pugazhendhi, A. Effect of hydrogen on compression-ignition (CI) engine fueled with vegetable oil/biodiesel from various feedstocks: A review. Int. J. Hydrogen Energy 2022, in press. [Google Scholar] [CrossRef]
- Deng, J.; Ma, F.; Li, S.; He, Y.; Wang, M.; Jiang, L.; Zhão, S. Experimental study on the combustion and emission characteristics of a hydrogen-enriched compressed natural gas engine at idling conditions. Hydrogen Energy 2011, 36, 13150–13157. [Google Scholar] [CrossRef]
- Estrada, L.; Moreno, E.; Quiroga, A.G.; Bula, A.; Forero, D.J. Experimental evaluation of performance and emissions for dual hydrogen-diesel fuel operation in a low displacement compression ignition engine. Heliyon 2022, 8, e09285. [Google Scholar] [CrossRef] [PubMed]
- Ruiz, J.D.B.; Huerta, R.G.G.; Gracida, J.; Reyes, A.A.; Bobadilla, G.M. Using green-hydrogen fuels in internal combustion engines to reduce emissions. Int. J. Hydrogen Energy 2019, 44, 12324–12332. [Google Scholar] [CrossRef]
- Adaileh, W.M.; Alqdah, K.S. Performance improvement and emission reduction of gasoline engine by adding hydrogen gas into the intake manifold. Mater. Today Proc. 2022, 60, 1769–1778. [Google Scholar] [CrossRef]
- Shu, J.; Fu, J.; Liu, J.; Zhang, L.; Zhao, Z. Experimental and computational study on the effects of injection timing on thermodynamics, combustion and emission characteristics of a natural gas (NG)-diesel dual fuel engine at low speed and low load. Energy Convers. Manag. 2018, 160, 426–438. [Google Scholar] [CrossRef]
- Kanth, S.; Debbarma, S.; Das, B. Experimental investigations on the effect of fuel injection parameters on diesel engine fuelled with biodiesel blend in diesel with hydrogen enrichment. Int. J. Hydrogen Energy 2022, in press. [Google Scholar] [CrossRef]
- Bão, L.Z.; Sun, B.G.; Luo, Q.H.; Wang, X.; Niu, Q.Y. Experimental study of the polytropic index of the compression stroke for a direct injection hydrogen engine. Hydrog. Energy 2020, 45, 28196–28203. [Google Scholar] [CrossRef]
- Fu, j.; Zhong, L.; Zhao, D.; Liu, Q.; Shu, J.; Zhou, F.; Liu, J. Effects of hydrogen addition on combustion, thermodynamics and emission performance of high compression ratio liquid methane gas engine. Fuel 2021, 283, 119348. [Google Scholar] [CrossRef]
- Turns, S.R.; Haworth, D.C. An Introduction to Combustion: Concepts and Applications; McGraw-Hill: London, UK, 2021. [Google Scholar]
- Lilik, G.K. Hydrogen Assisted Diesel Combustion. Master’s Thesis, The Pennsylvania State University, State College, PA, USA, 2008. [Google Scholar]
- Testo. Testo 350-S in Combination with Testo 350-S/-XL Flue Gas Analyzer—Instruction Manual; TESTO AG: Smørum, Denmark, 2008. [Google Scholar]
- Gervásio, D.T. Methodology for Correlation and Analysis of 1d Fluid-Dynamic Models for Internal Combustion Engines. Master’s Thesis, Federal University of Pernambuco, Recife, Brazil, 2017; p. 128. [Google Scholar]
- Santos, E.M.D.O. Estudo Comparativo de Cálculos Térmicos de um Motor de Combustão Interna Ciclo otto com Resultados de Ensaios Experimentais. Master’s Thesis, Energy Engineering, Federal University of São João Del Rei, São João Del Re, Brazil, 2016; p. 111. [Google Scholar]
- Yeliana, Y.; Cooney, C.; Worm, J.; Michalek, D.J.; Naber, J.D. Estimation of double-Wiebe function parameters using least square method for burn durations of ethanol-gasoline blends in spark ignition engine over variable compression ratios and EGR levels. Appl. Therm. Eng. 2011, 31, 2213–2220. [Google Scholar] [CrossRef]
- Wang, B.; Yang, C.; Wang, H.; Wang, Y. Effect of Diesel-Ignited Ammonia/Hydrogen mixture fuel combustion on engine combustion and emission performance. Fuel 2023, 331, 125865. [Google Scholar] [CrossRef]
- Luo, J.; Liu, Z.; Wang, J.; Xu, H.; Tie, Y.; Yang, D.; Zhang, Z.; Zhang, C.; Wang, H. Investigation of hydrogen addition on the combustion, performance, and emission characteristics of a heavy-duty engine fueled with diesel/natural gas. Energy 2022, 260, 125082. [Google Scholar] [CrossRef]
- Jamrozik, A.; Rogaliński, K.G.; Tutak, W. Hydrogen effects on combustion stability, performance and emission of diesel engine. Int. J. Hydrogen Energy 2020, 45, 19936–19947. [Google Scholar] [CrossRef]


Publisher’s Note: MDPI stays neutral with regard to jurisdictional claims in published maps and institutional affiliations. |
© 2022 by the authors. Licensee MDPI, Basel, Switzerland. This article is an open access article distributed under the terms and conditions of the Creative Commons Attribution (CC BY) license (https://creativecommons.org/licenses/by/4.0/).