Article

Hemp Biocomposite Boards Using Improved Magnesium Oxychloride Cement

1
Department of Building Materials and Building Products, Institute of Materials and Structures, Faculty of Civil Engineering, Riga Technical University, Kipsalas Street 6B, LV-1048 Riga, Latvia
2
3D Concrete Printing Laboratory, Institute of Materials and Structures, Faculty of Civil Engineering, Riga Technical University, Kipsalas Street 6B, LV-1048 Riga, Latvia
*
Author to whom correspondence should be addressed.
Energies 2022, 15(19), 7320; https://doi.org/10.3390/en15197320
Submission received: 9 September 2022 / Revised: 26 September 2022 / Accepted: 29 September 2022 / Published: 5 October 2022
(This article belongs to the Special Issue Advanced Building Materials for Energy Saving)

Abstract

:
The share of bio-based materials in modern construction needs to grow more rapidly due to increasingly stringent environmental requirements as a direct result of the climate emergency. This research aims to expand the use of hemp concrete in construction by replacing traditional lime binder with magnesium oxychloride cement, which provides a faster setting and higher strength, opening the door for industrial production. However, the negative feature of this binder is its low water resistance. In this work, the water resistance of magnesium cement was studied, and the possibilities of improving it by adding fly ash, various acids and nano-silica were considered. Nano-silica and citric acid showed the most significant impact, increasing the binder water resistance up to four times, reaching softening coefficient of 0.80 while reducing the compressive strength of the magnesium cement in a dry state by only 2–10%. On the downside, citric and phosphoric acid significantly extended the setting of the binder, delaying it 2–4 times. Regarding board production, prototype samples of hemp magnesium biocomposite demonstrated compressive strength of more than 3.8 MPa in the dry state but only 1.1–1.6 MPa in the wet state. These results did not correlate with binder tests, as the additives did not increase the strength in the wet state.

1. Introduction

Scientists have warned for several years that we are facing a climate emergency related to the increase in the amount of greenhouse gas (GHG) in the atmosphere [1]. Therefore, the European Union (EU) has adopted the EU Climate law [2], which sets the requirements for reducing the amount of CO2, and the Green Deal, which stipulates that net-zero GHG emissions must be achieved by 2050 [3]. The construction industry has a significant impact on the environment and it is predicted that building energy and construction material use, and thus CO2 and related emissions, will continue to increase over the next decades if no action is taken [4]. This is related to both the high consumption of Portland cement as a binder and the insufficient use of bio-based materials [5].
In order to reduce this impact and the excessive consumption of resources, more emphasis should be placed on the bioeconomy, which is based on the use of biological materials; such an emphasis is also the main basis of the EU Bioeconomy Strategy. Therefore, alternative cement binder materials with plant aggregates can bring environmental and economic benefits [6]. One of the products that fit the abovementioned conditions is hemp concrete. Based on hemp shives, a by-product of hemp fibre production, hemp concrete has excellent thermal insulation properties. The application of it in insulation material, boards or blocks can reduce the long-term energy consumption of the building [7]. It has a low environmental impact, excelling in reducing GHG emissions [8], as the hemp plant absorbs CO2 during growth and is stored in the material [9].
Hydrated lime (Ca(OH)2) and hydraulic lime are traditionally used as binding agents for hempcrete [10]. However, the main disadvantages of lime-hemp compositions are long hardening time and low strength Studies have shown that replacing lime with magnesium oxychloride cement (MOC) significantly increases its strength [11] and accelerates hardening. Furthermore, a life cycle assessment study showed that both magnesium and lime biocomposites have similarly low environmental impacts [12].
MOC is an air-hardening cement with high early strength, developed in the late 19th century and known as Sorel cement [13,14]. MOC is used in construction as fire protection, thermal insulation and floor material due to its fire resistance, low thermal conductivity and good wear resistance properties. MOC has good compatibility with organic fillers; sugars and other organic extractives do not cause retardation, allowing it to be used with various agricultural and industrial by-products as well as solidification of sewage sludge [15].
Inadequate resistance to water is the main disadvantage of MOC [16] and will be the main focus of this research. Researchers have suggested the inclusion of various dispersing additives and fillers in MOC to improve water resistance [17]. The most commonly adapted additives are citric acid, phosphoric acid, soluble phosphates [18] and various active SiO2 mineral additives [19]. The improvement of the water resistance of MOC compositions modified with fly ash can be attributed to the amorphous aluminium silicate gel formed by the reaction of reactive SiO2 and Al2O3 pozzolan contained in fly ash [20,21,22]. The inclusion of fly ash in MOC can improve workability and flowability, delay setting time and improve water resistance while reducing compressive strength [23].
Another SiO2-based material of interest to this publication is nano-silica (NS). Due to high chemical reactivity and ultrafine size, NS has gained significant interest. The performance of NS in concrete is much better, with a smaller amount of additive required compared to fly ash. NS products available on the market claim to improve workability, stability and durability, accelerate setting time, and enhance the early strength of cement. From the producers’ side, typically declared dosages are 1–5 wt%; on the other hand, in the limited amount of research on this topic, NS dosages range from a very low 0.1 wt% up to a very high 10 wt% [24].
Another option is to use various acids for the improvement of water durability. Chen [18] investigated the effect of various additives for Mg oxy-sulphate cement. Several types of additives were used, such as phosphoric acid, sodium dihydrogen phosphate, citric acid and compound additive. The results show that citric acid (CA) can significantly improve the physical and mechanical properties of MOC. The optimal mix proportion: MgO/MgSO4 molar ratio was 20, MgO/MgSO4 molar ratio was 12, and the citric acid content was 1.5%. It was found that the compressive strength and water resistance can be improved by the addition of CA 1.5% by mass.
Yan et al. [25] studied ways to increase the water resistance of magnesium cement using a complex addition of phosphoric acid and fly ash. The phosphoric acid dosage varied from 0 to 1.5%, and the dosage of fly ash from 0, 5, 10, 15, 20, and 25%. It was proven that the water resistance of the MOC was improved by using the additives. By studying the microstructure, the formation of a new Ca2MgSi2O7 phase and the glass phase were detected. Furthermore, Mg2+ diffusing outside MOC was effectively prevented by adding 15% fly ash; the crystals of MOC with an addition of 1% phosphoric acid provided a plate-bar shape and intergrowth with a bundled shape.
Research on MOC binder so far has mainly focused on improving its water resistance, but very little attention and research have been focused on MOC biocomposite water resistance, although this is a frequent use of MOC and bio-based filler can greatly affect it. This work aims to improve the water-resistance of MOC by using different additives, as well as to evaluate the effect of the developed composition on the properties of the magnesium-hemp biocomposite; this is the novelty of this research, because such a comparison has not been made before. This study is divided into two parts—the first part includes the improvement of the MOC binder with various additives and testing and the second part includes the production and testing of MOC/hemp biocomposites. It is expected that the selected binders will be able to improve the water-resistance of the MOC binder. The goal is to observe whether this trend also persists for MOC/hemp biocomposites and to use micro and macro-level test methods to explain differences and dependencies.

2. Materials and Methods

2.1. Materials Used

The chemical composition of raw materials is given in Table 1. Caustic magnesia RKMH-F (RHI AG Ltd., Vienna, Austria), calcined at the temperature of 750 °C, was used. The particle size distribution of 90% of particles is <30 μm. This specific MgO has been chosen because it is technically appropriate (calcination temperature and particle size) for the production of MOC cement, its purity is sufficient but not too high, so it is also economically justified, and in previous studies it has proven its compatibility with bio-based fillers. Five different additives were chosen based on the literature review: fly ash (FA), two types of nano-silica, colloidal silica dispersions—CB8 (NS1) and CB50 (NS2) (Levasil), and citric acid (CA) 50% and phosphoric acid (PA) 85% solutions. The pH value of CB50 is 10, for CB8 this is 9.5, and the viscosity of dispersions is less than 10 mPas. Fly ash used is supplied by Schwenk Ltd. (Broceni, Latvia). and delivered from Kozienice power station (Kozienice, Poland), one of the closest production sites to Latvia. The used FA is a dark grey powder; the cumulative content of oxides SiO2 + Al2O3 + Fe2O is equal to 84.7% thereof it is classified as Class F fly ash in accordance with ASTM 618. Magnesium chloride hexahydrate was used for the preparation of MgCl2 brine solution.
As bio-based fillers, hemp shives processed by the company Natural Fiber (Natūralus Pluoštas, Lithuania) were used (Figure 1). This is the largest regional processor whose supplied hemp shives are suitable for making building materials. Most of the particles (64%) have sizes from 1 to 20 mm, (Table 2). The bulk density of the shives is 80 kg/m3, and the compacted bulk density is 115 kg/m3. The compacted bulk density is more relevant to the material production process than the bulk density. The thermal conductivity of the shives in a compacted state is 0.043 W/m·°K.

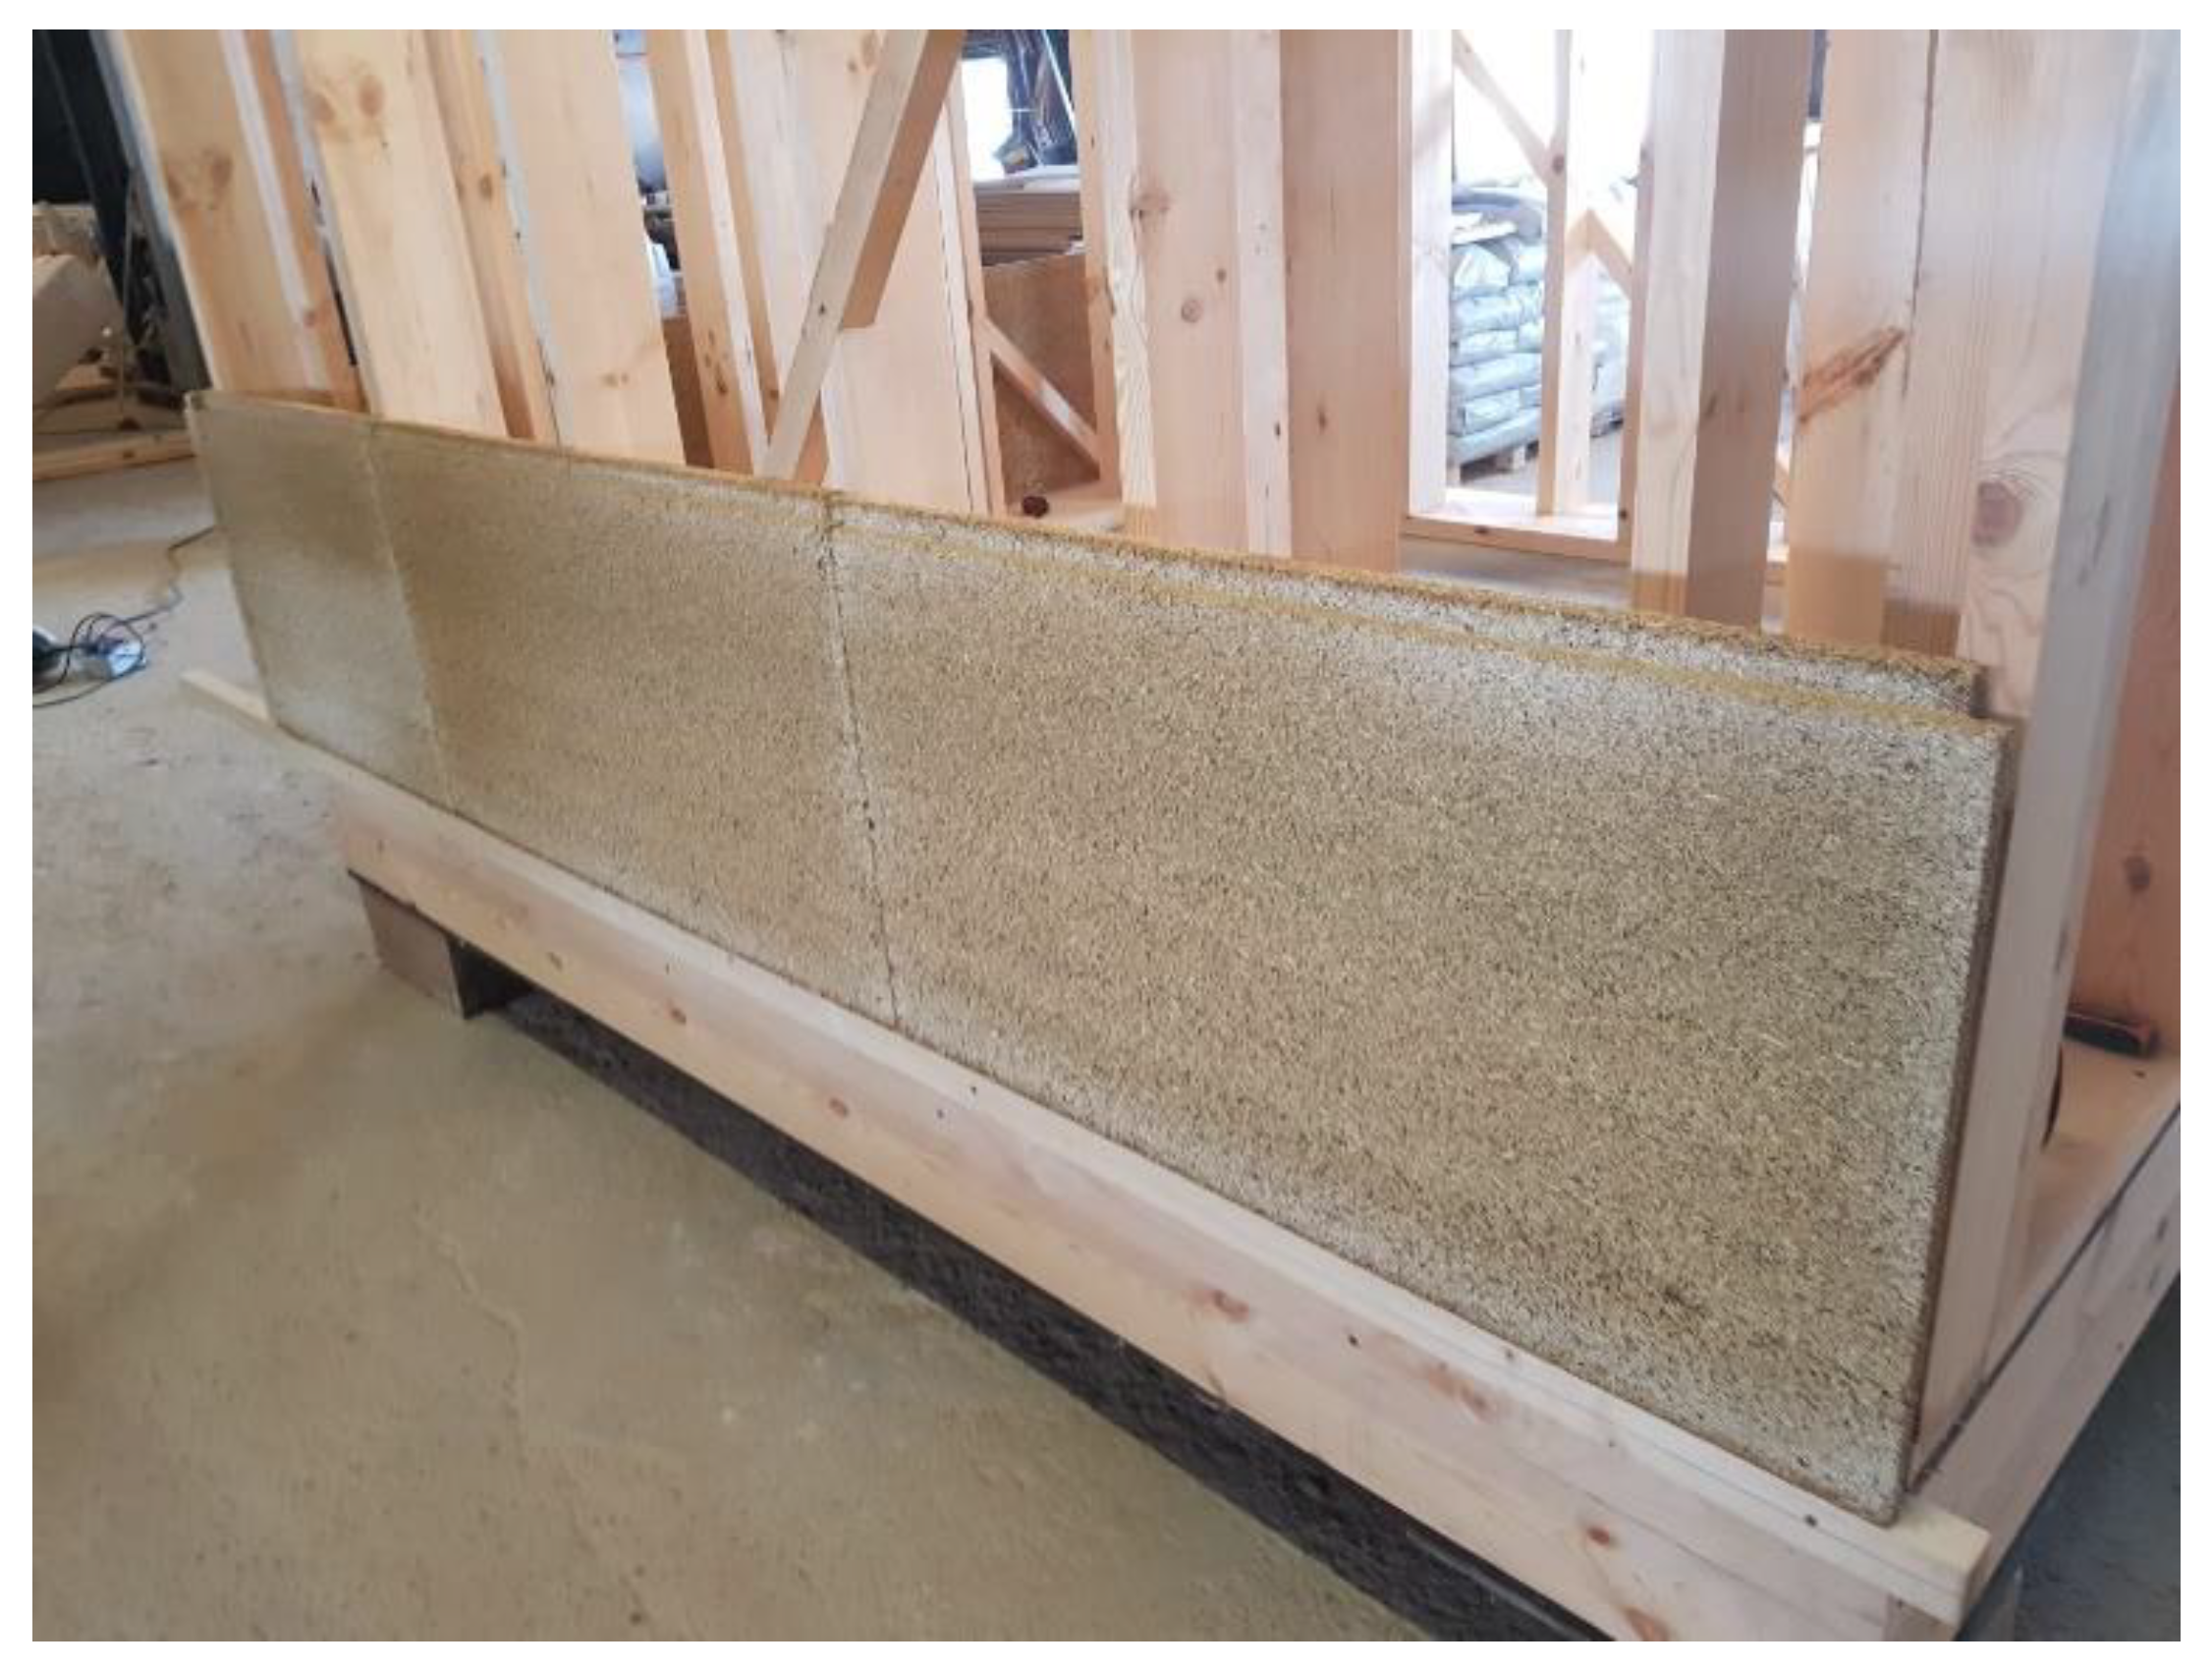
2.2. Mixing Technology

The mixing technology used has been elaborated on during previous research work of the authors. A solution of magnesium chloride was prepared before producing the mixtures. It was obtained by diluting magnesium chloride hexahydrate in water 1:1 by weight. After production, the salt solution was kept at a constant temperature (22 ± 2 °C), which is important because it affects the setting time of the binder.
The compositions of the mixtures prepared in the first part of this study are given in Table 3. Reference mixtures are marked with -REF (FA-REF, NS1-REF, NS2-REF, PA-REF and CA-REF). Their mixing procedure involves first manually mixing the magnesium oxide powder with MgCl2 solution for 0.5 min and then mixing with twin-shaft mixer for 1 min, at a speed of 60 rpm. In the same way, all compositions were mixed, the only difference being the order of inclusion of additives. CB8, CB50, CA and PA are solutions and were first poured into a 1:1 solution of MgCl2 mixed; only then was the solution combined with MgO. The fly ash was first homogenised with MgO and then MgCl2 solution was added.
The number of additives in the mixture corresponded to the literature review and the information provided by the manufacturer described in the Section 1. Four compositions ranging from 10 to 30% fly ash, 1 to 7% both nano-silicas, 0.2 to 1.5 PA and 0.5 to 2% CA were prepared for each additive (five for PA). In each mixture, the amount of powdered material (MgO and FA) was the same; also, the ratio between MgO and MgCl2 remained unchanged—0.6. Due to their overall higher surface area, for mixtures with higher amounts of FA—20 and 30%—it was necessary to add more water to ensure the same workability as low FA mixtures.
The second part of the study is devoted to hemp biocomposites. Since hemp shives are hydrophilic, they were mixed with water in a ratio of 1:1 before making the biocomposites. The binder was made in the same way described above; after its preparation, it was mixed with hemp shives manually in a ratio of 1:4 by mass. The compositions of the biocomposites can be seen in Table 4.

2.3. Curing Conditions and Testing of the Samples

Curing conditions and testing methods were chosen based on the authors’ previous work with MOC binders and biocomposites. After production, fresh binder properties—setting time and workability—were tested. The setting time was measured with a Vicat apparatus according to EN 193-3:2005. Workability was determined according to EN 459-2:2021 using a flow table.
After the determination of fresh binder properties, 20 × 20 × 20 mm (Figure 2a) samples were made to test compressive strength; they were formed in polyurethane moulds that offer excellent dimension stability and easy demoulding. Their demoulding was carried out after 20 h. All the samples were not stored in the same conditions—one part was held in laboratory conditions (20 ± 2 °C and 40 ± 10 %RH) and tested in dry form at the specified time and the other samples were immersed in water after 7 days of hardening and tested in both wet and dry form. The “dried” specimens were removed from the water and dried in the drying chamber at 40 ± 2 °C temperature for one day before testing to remove the absorbed water.
Biocomposites were moulded in steel moulds with dimensions 50 × 50 × 50 mm. Thermal conductivity samples were made in 350 × 350 × 50 mm moulds. Demoulding of samples was carried out after 24 h, storage—20 ± 2 °C and 40 ± 10 %RH. The compressive strength of the air-cured samples was tested on the 2nd, 7th and 28th day. To determine the water resistance, part of the samples were immersed in water on the 21st day and tested wet after 7 days. The compressive strength was tested perpendicular to the direction of manufacture and until the sample collapsed. The compressive strength tests were performed with a Controls semi-automatic press.
The XRD patterns were taken for three materials: the raw magnesia powder and two powdered samples tested on the 28th day after dry and wet curing. The testing was made for the REF mix to determine the reactions that lower the strength of the specimens in wet curing, as well as to see why some samples showed fine cracks on the surface after wet curing (Figure 2b). The XRD patterns were performed using a BRUKER-AXS D8 ADVANCE X-ray diffractometer, using CuKα1, α2 radiation in the range of 5–70° (2θ), to clarify the significance of curing conditions. The microstructure of the same samples was determined with the scanning electron microscope (SEM) TESCAN Mira\LMU Field-Emission-Gun.
The coefficient of thermal conductivity of the biocomposite specimens was tested using the heat flow measurement device LaserComp FOX 600. The thermal conductivity was determined according to EN 12667. The tested samples were placed between two metal plates with a temperature difference of 20 °C (the bottom plate was the warm part (+20 °C) and the upper plate was the cold part (0 °C)).

3. Results and Discussion

3.1. Binder Properties

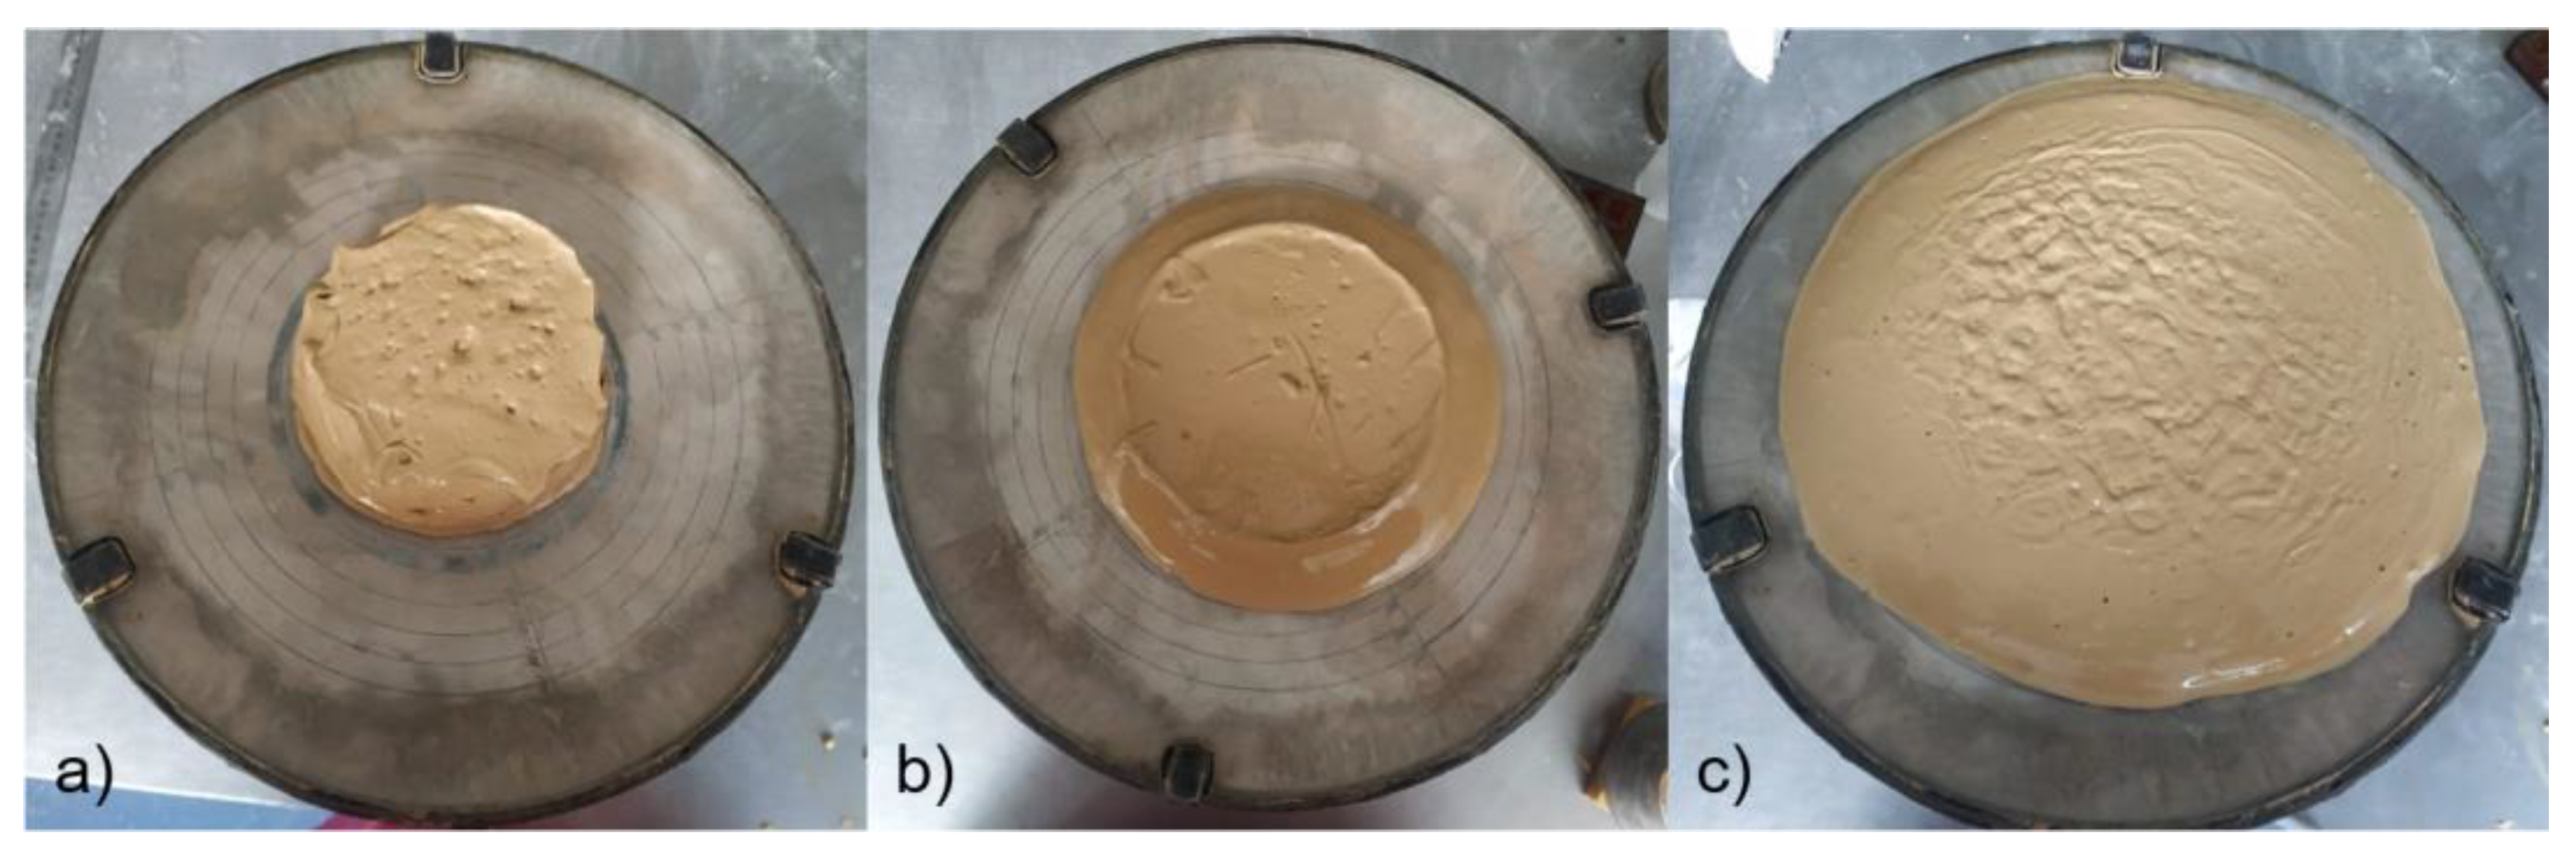
3.1.1. Workability and Setting Time

Table 5 shows the results of fresh binder properties—workability measured by mini-cone flow diameter and setting time. FA had the greatest effect on reducing the initial flow diameter—the samples did not flow at all but kept a ring diameter of 100 mm (Figure 3a)—and flowed only after jolting; a comparison with higher viscosity samples’ initial flow (in this case NS1-5) can be seen in Figure 3.
It can also be seen from the table that increasing the amount of FA reduces the workability, as even the compositions in which additional water was added (FA-20 and FA-30) show a slight decrease of 5 to 10%. The decrease in workability is proportional to the amount of FA, which can be explained by the higher surface area of fly ash. Regarding nano-silicas, the workability slightly rises with the incorporation of NS2 and significantly increases with the use NS1, as the NS1 solution works as a plasticiser for MOC.
All used additives affected the setting time—silica-based additives show a smaller effect than acid-based ones. The addition of fly ash gave a slight extension of the initial setting time by 4–18% at small amounts of FA (5–10%). The effect on the final setting time was also average—max 32 min (21%) at FA-30. The largest effect on the initial binding time was the addition of 7% NS 2, which extended it from 62 to 80 min. 1% of NS1 and NS2 showed slight retardation of the final setting time but, as the concentration increases to 7%, the retardation effect disappears and the results become close to REF.
The addition of phosphorus and citric acid significantly prolongs the setting time and the workability is slightly affected. PA additive—0.2%—worked like plasticiser—it increased flow diameter, then with the higher amounts, the flow diameter decreased. Initial and final setting time is increased two-fold. CA additive significantly increases setting time—with 2% CA, the final setting time is 6 h and 20 min, while CA-REF is 2 h, on average shows a three-fold increase. CA influence on workability is insignificant. The results coincide with findings from other research where citric acid is used as an additive to improve MOC’s water resistance but also significantly extends the setting time [26].

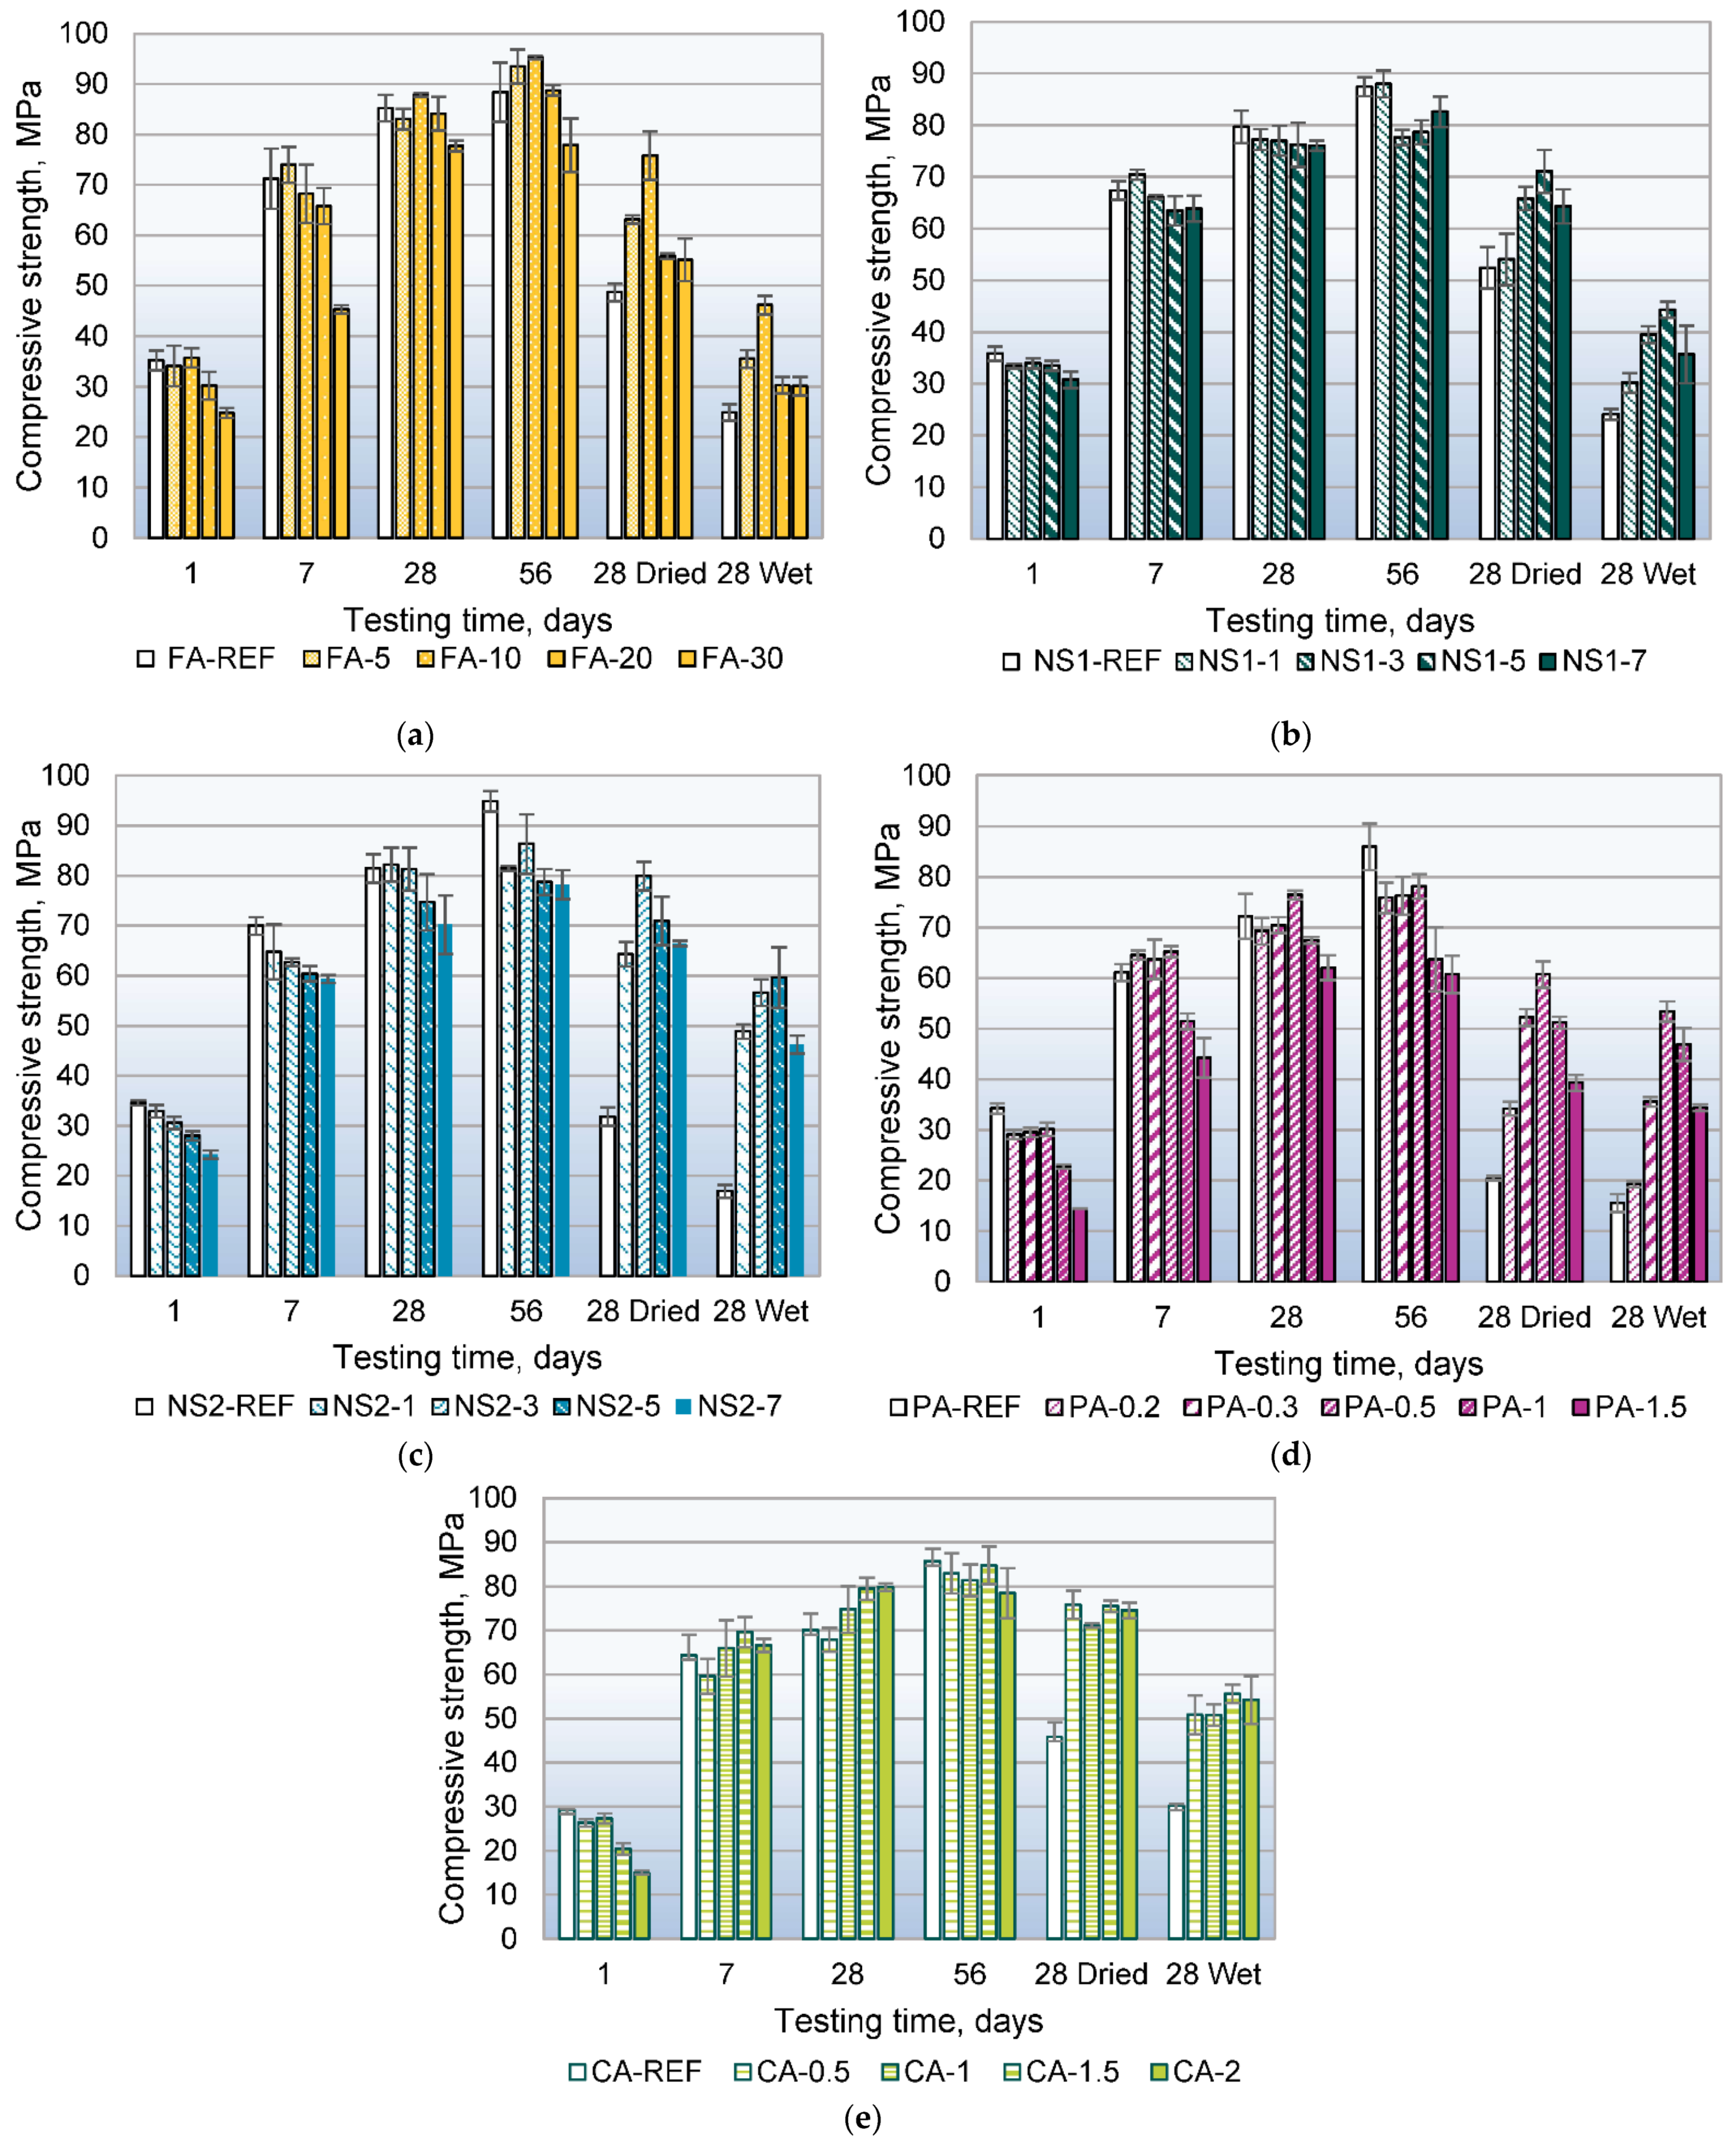
3.1.2. Compressive Strength and Softening Coefficient

The compressive strength test results can be seen in Figure 4; in all of the graphs, the REF binder results are coloured in white. For specimens cured in laboratory conditions, the most rapid strength growth is noticed from the 1st to the 7th day, stabilising on the 28th–56th day, reaching 85.3 and 88.4 MPa for FA-REF. This tendency is similar for most of the binders. Overall, the strength results of dried specimens are up to 1.5 times higher than wet ones, which indicates that, after water impact, the dried material has the potential to partly regain its strength. This phenomenon was given further attention in results with additives incorporation.
In Figure 4a, it can be seen that the highest amount, equal to 30% of FA added, lowered the strength of dry specimens. A small amount of 5–10% did not significantly influence strength for 28 days compared to the REF. On the 56th day, a smaller amount of additive increased strength, with FA-10 showing the best result of 95.3 MPa. For wet cured specimens, a high amount of 20–30% of FA did not improve the water-resistance of the MOC, but 5–10% increased compressive strength, especially 10% with 46.2 and 75.8 MPa for wet and dried specimens. This is related to FA’s ability to optimise the pore structure and reduce volume deformation [27].
In general, NS1 and NS2 tended to lower the compressive strength of air curried samples compared to REF. Despite that, the water resistance is improved with: (1) addition of 3–7% of NS1, with best results of NS1-5 with 44.3 and 71.1 MPa for wet and dried specimens; (2) addition of 1–7%, especially NS2-3, 56.7 and 80.0 MPa.
Application of both acids had the most significant effect on early strength, reducing strength by 50% on the first day at the maximum concentration. This observation also correlates with the significant extension of the setting time that these additives provide. Higher concentrations of phosphoric acid reduce the strength by as much as 30% and such observations agree with those observed by other researchers [28]. The addition of orthophosphoric acid shows a similar effect on long-term strength as NS2—the 28th-day strength is close to that of REF and, at 56 days, there is a 9–30% reduction. The use of CA shows less effect on the long-term strength, showing equal strength to the REF samples at 28 and 56 days. The effect of using acids on long-term strength growth has not been widely studied and further research is beyond the scope of this study.
Both acids also significantly increase water resistance, most evident in the 28-day (dried) strengths. Adding PA in the amount of 0.5% gives a three-fold increase in strength; the achieved softening coefficient 0.7 coincides with 0.74 obtained by other authors using PA [28]. Using CA in all the added proportions makes it possible to obtain the same strength as for samples at 28 days of air hardening. Among all additives, CA and NS2 show the highest water resistance when evaluating dried samples.
As presented in Table S1, the softening coefficient (SF) is calculated by dividing the compressive strength on the 28th day with 28th (wet), thus showing the strength reduction in the wet state. It indicates that MOC has low water resistance with SF 0.21–0.43 and additives in all cases increased this relative to the given reference. MOC water resistance is also highly dependent on the type of MOC; in studies it varies from 0.05 to 0.6 [28,29], so its increase after adding additives should be determined for each MgO separately. The most promising results were for NS2, PA and CA, with the best SF (0.80) of NS2-5 (5% nano-silica), 0.5% CA gave SF 0.75, 0.5% PA gave SF 0.70. The findings align with other research, where both CA and PA showed a high water resistance increase [18,25]. Although silica fume has been used for a similar purpose with MOC, the addition and successful increase of water resistance with nano-silica is shown for the first time. FA also increases the SF, but to a lower extent, to 0.53 at 10% FA. NS1 shows a lower increase than NS2, reaching 0.58 at a 5% addition.
MOC shrinkage is very low [30], thus it was not studied in this work; however, visually no dimensional changes or cracking of MOC in the dry state were observed.

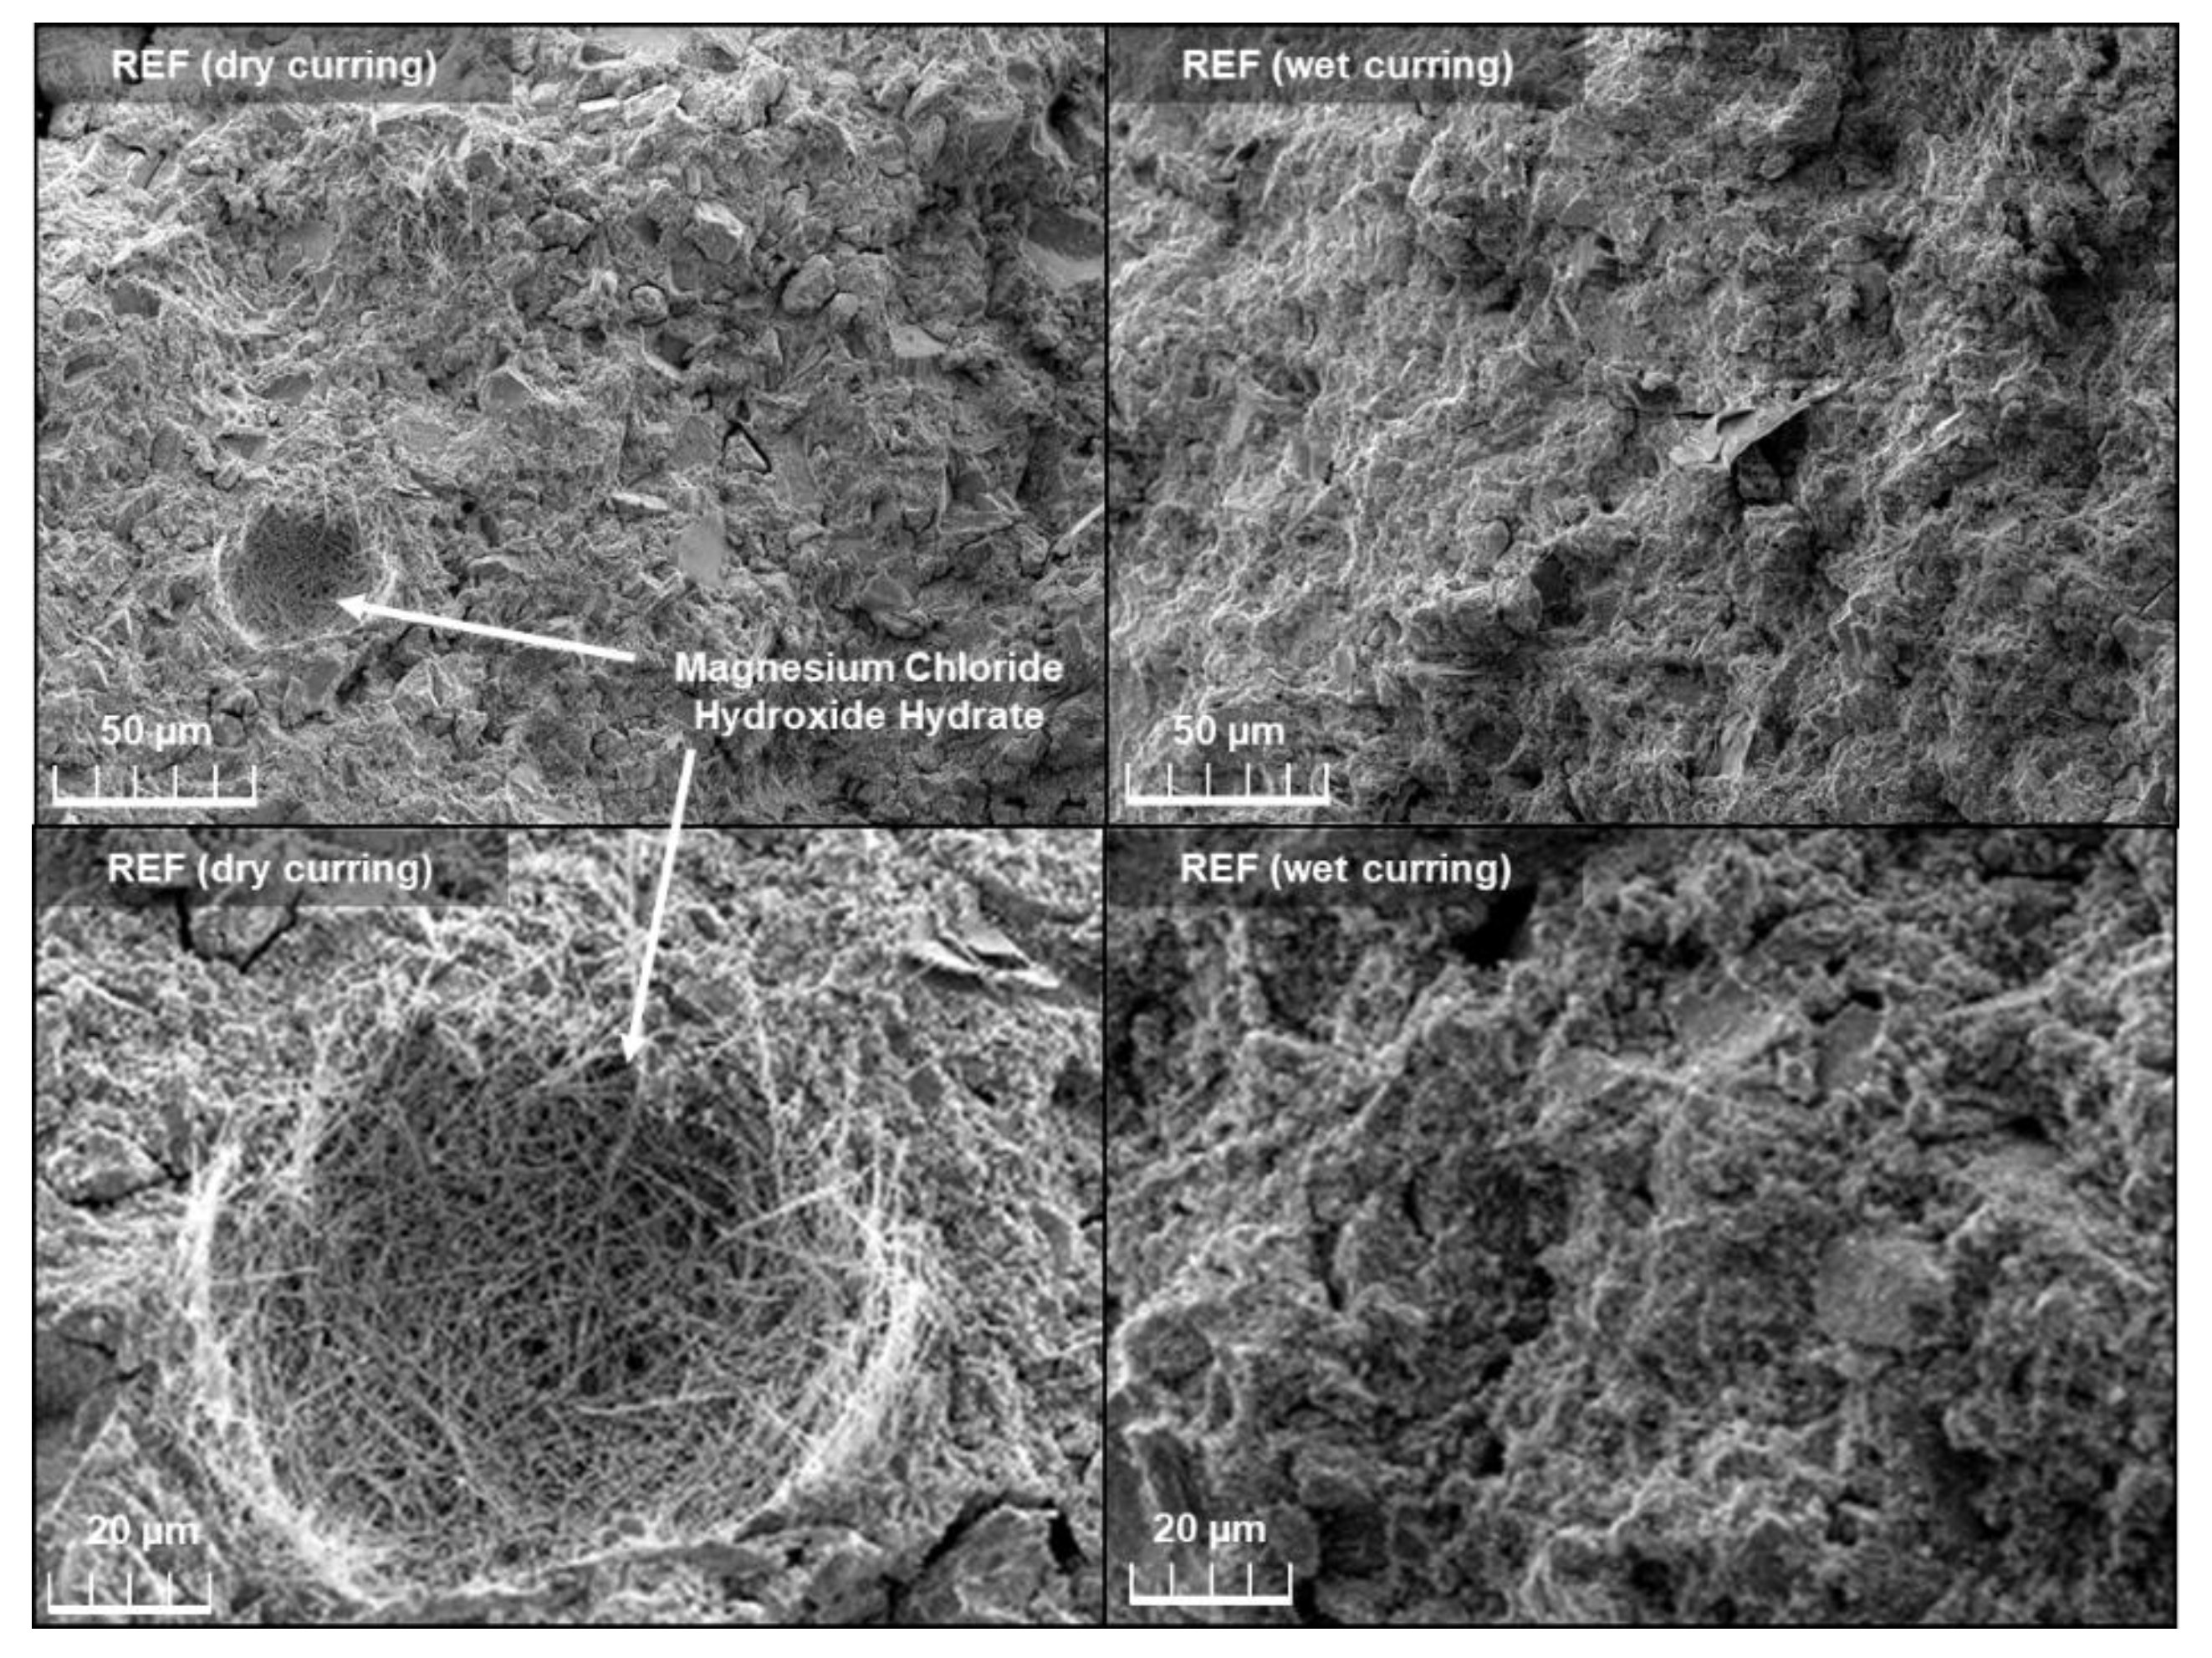
3.1.3. XRD and SEM Analysis

According to the XRD patterns performed, the following crystalline phases of Clinochlore ((Mg,Fe)6(Si,Al)4O10(OH)8), Talc (Mg3Si4O10(OH)2), Lizardite (Mg3Si2O5(OH)4), Dolomite (CaMg(CO3)2), Magnesia (MgO), Brucite (MgO·H2O) and Magnesite (MgCO3) in raw MgO was detected (Figure 5). The most intensive peaks correspond to Magnesite, Magnesia, Brucite and Talc. As can be seen in Table 1, Magnesia has a relatively large amount (~12%) of impurities in the composition, which explains the presence of Clinochlore, Talc and Lizardite. Meanwhile, the presence of Dolomite, Brucite and Magnesite indicates that full calcination has not taken place, due to calcination temperature being too low and/or calcination time too short [31].
Due to the hydration reaction, new crystalline phases such as Magnesium Chloride Hydroxide Hydrate (5-phase) (Mg3(OH)5Cl·4H2O) and Magnesium Hydroxide (Mg(OH)2) appear, the intensity of peaks presenting Talc, Magnesite, Brucite and Magnesia decreased, and peaks of Clinochlore disappear due to involvement of magnesium compounds in the hydration reactions. The type of curing (wet or dry) noteworthily affects the resulting mineralogical composition of MOC. As seen in Figure 5, wet curing ensures the significantly more intense formation of Magnesium Hydroxide and hence less intense formation of Magnesium Chloride Hydroxide Hydrate compared to dry curing. This correlates with the compressive strength measurements, as the Magnesium Chloride Hydroxide Hydrate gives the highest strength of all magnesium oxychloride cement compounds but is soluble in water, so wet cured samples have much less of this compound [14]. For wet cured samples, five-phase has dissolved and turned into Magnesium Hydroxide, which gives lower strength.
XRD analysis is also confirmed by SEM (Figure 6)—five-phase can be observed on the surface of dry curing samples as it is covered with needle-shaped crystals, the length of which even exceeds 20 µm. In accordance with the literature [32,33,34,35], crystals of Magnesium Chloride Hydroxide Hydrate are needle-shaped with the longest dimension ~10–20 µm, but crystals of Magnesium Hydroxide are parallelepiped crystals with the longest dimension ~1–3 µm. Meanwhile, no such intense crystal forming was detected on the surface after wet curing, where only Magnesium Hydroxide can be seen. This correlates with the compressive strength measurements of dry samples being superior to wet samples, as Magnesium Hydroxide provides much lower strength than Magnesium Chloride Hydroxide Hydrate [14].
The cracking of MOC has been detected by other authors [36], but the reasons are not definitive. From XRD and SEM analysis, it can be concluded that the five-phase is formed during curing in air; when the samples are cured in water, this compound dissolves and Mg(OH)2 is formed, which is expansive [14]. Similarly, when the samples are cured in air, the samples contain more free MgO, which turns into Magnesium Hydroxide when cured in water. Because it is expansive, the wet curing samples have cracks. This can cause problems for the application of the material, but it should be noted that these samples are pure binder samples; using them together with filler and bio-based fibres can eliminate this problem, as can be seen with MOC biocomposite samples of this study, where no cracking was observed.

3.2. Biocomposite Properties

For the fabrication of MOC hemp biocomposites, the best binder composition from every type of additive was used. The following mixtures were chosen—5% of FA, NS1 and NS2 and 0.5% PA and CA.

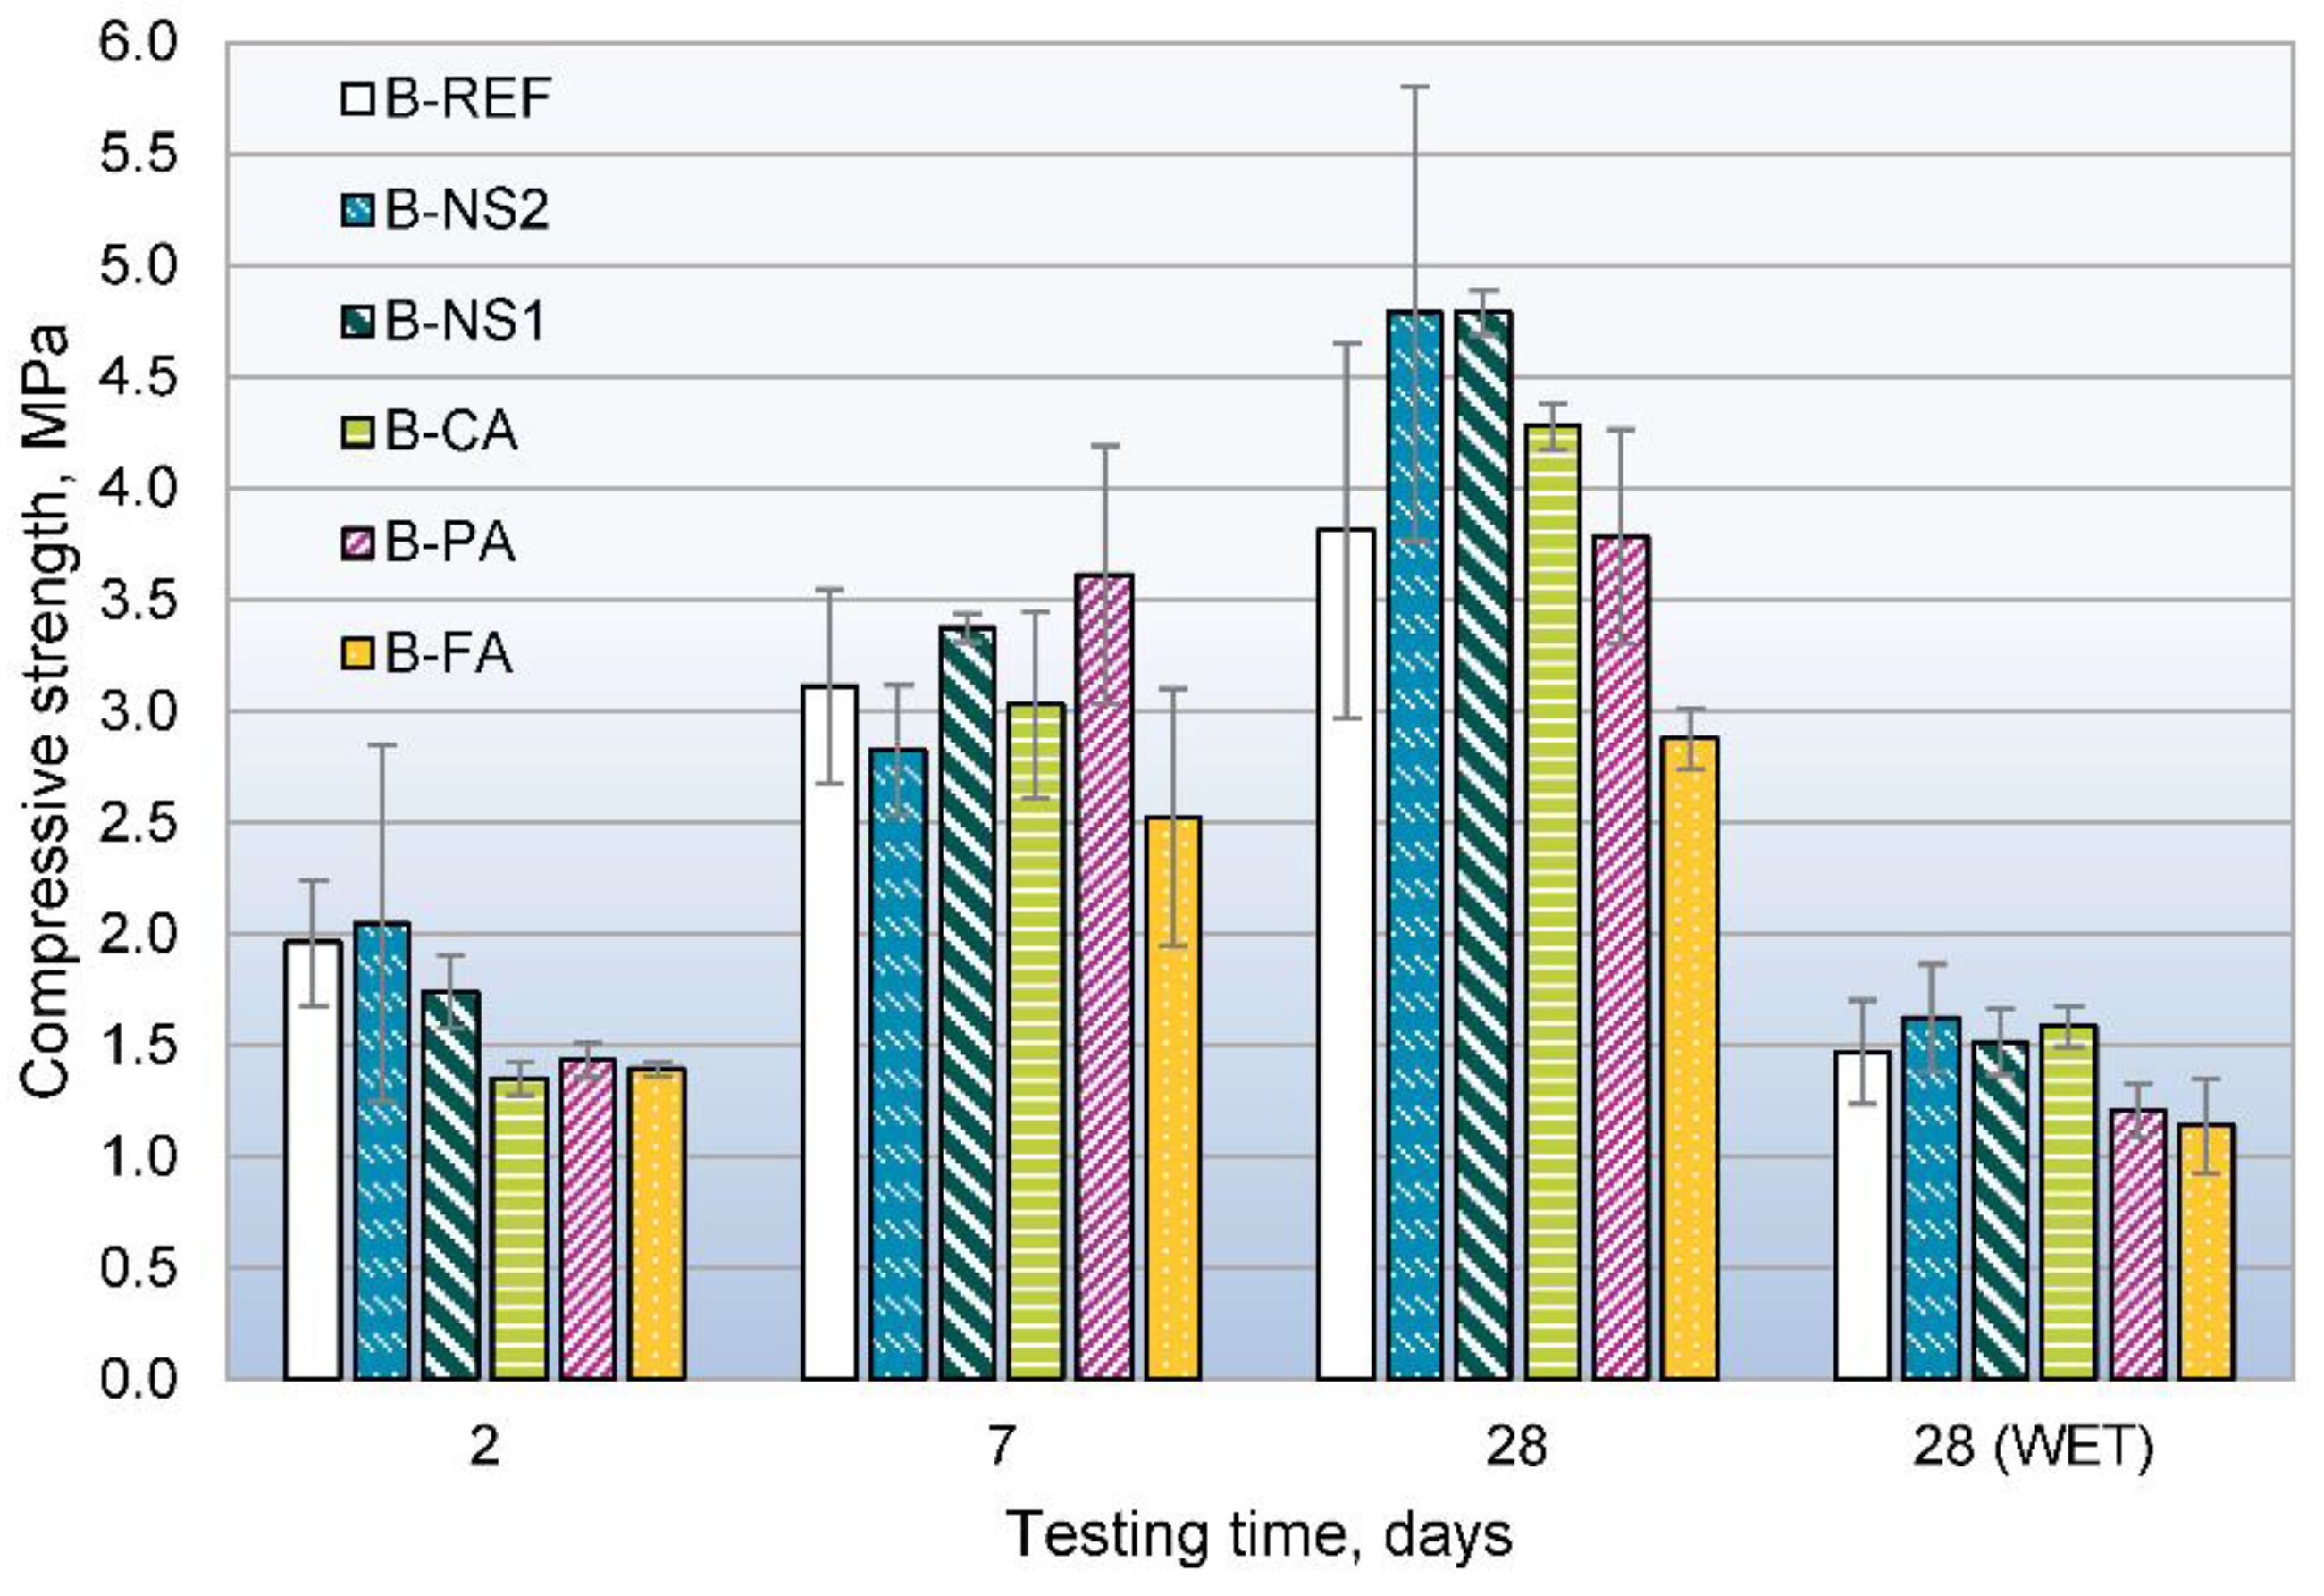
3.2.1. Compressive Strength and Softening Coefficient

The results of compressive strength can be seen in Figure 7. Early strength on the second day after production for B-REF was 2.0 MPa and it was similar for B-NS2-5 (2.1 MPa). NS1 showed lower early strength of 1.7 MPa. FA, CA and PA show similarly lower strength of 1.3–1.4, which can be explained by their slower setting.
After 7 days, the strength of all the samples was within the median error limits 2.5–3.6 MPa. For 28 days, both NS1 and NS2 noticeably increased the strength of bio-composites from 3.8 to 4.8 MPa, compared to B-REF. CA and PA showed similar strengths of 3.8–4.3 MPa, but the FA showed the lowest strength with bio-based filler—only 2.9 MPa. This reduced strength is probably due to the compounds that FA forms with MgO—magnesium silicates. Previous studies have shown that magnesium silicates are formed more slowly in the presence of biologically active substances released from bio-based components [37]. However, both nano-silicas were unaffected, as their biocomposites show even higher strength, so these processes should be studied in depth in the future.
The obtained strengths are slightly higher than magnesium bio-composite compositions made by other authors with both hemp shives and wheat husks, but in these studies, no binder modification was performed [38,39]. The obtained biocomposites have several times higher strength than lime hemp biocomposites, which are traditionally used as envelope and insulation material [10].
The results from water-cured specimens were unexpectedly low—1.6 MPa for B-NS2 and CA, respectively, 1.5 MPa for B-NS1, while B-REF also showed 1.5 MPa. PA and FE showed even lower strengths of 1.2 and 1.1 MPa (Table S2). This is either due to more water-soluble phases that are formed in the presence of organic compounds released by the bio-based filler, or the mechanical properties of the bio-based filler, which significantly deteriorate when soaked in water, and are the main determinants of the properties of the biocomposite. The lack of research on softening coefficient of similar biocomposites used as construction materials prevents a deeper comparison with other research.
Water absorption of biocomposites was less than 40 % by mass. Density was between 810 and 840 kg/m3. Density and water absorption were similar for all the samples, thus, a correlation between strength results and their possible influencing factors can be seen.

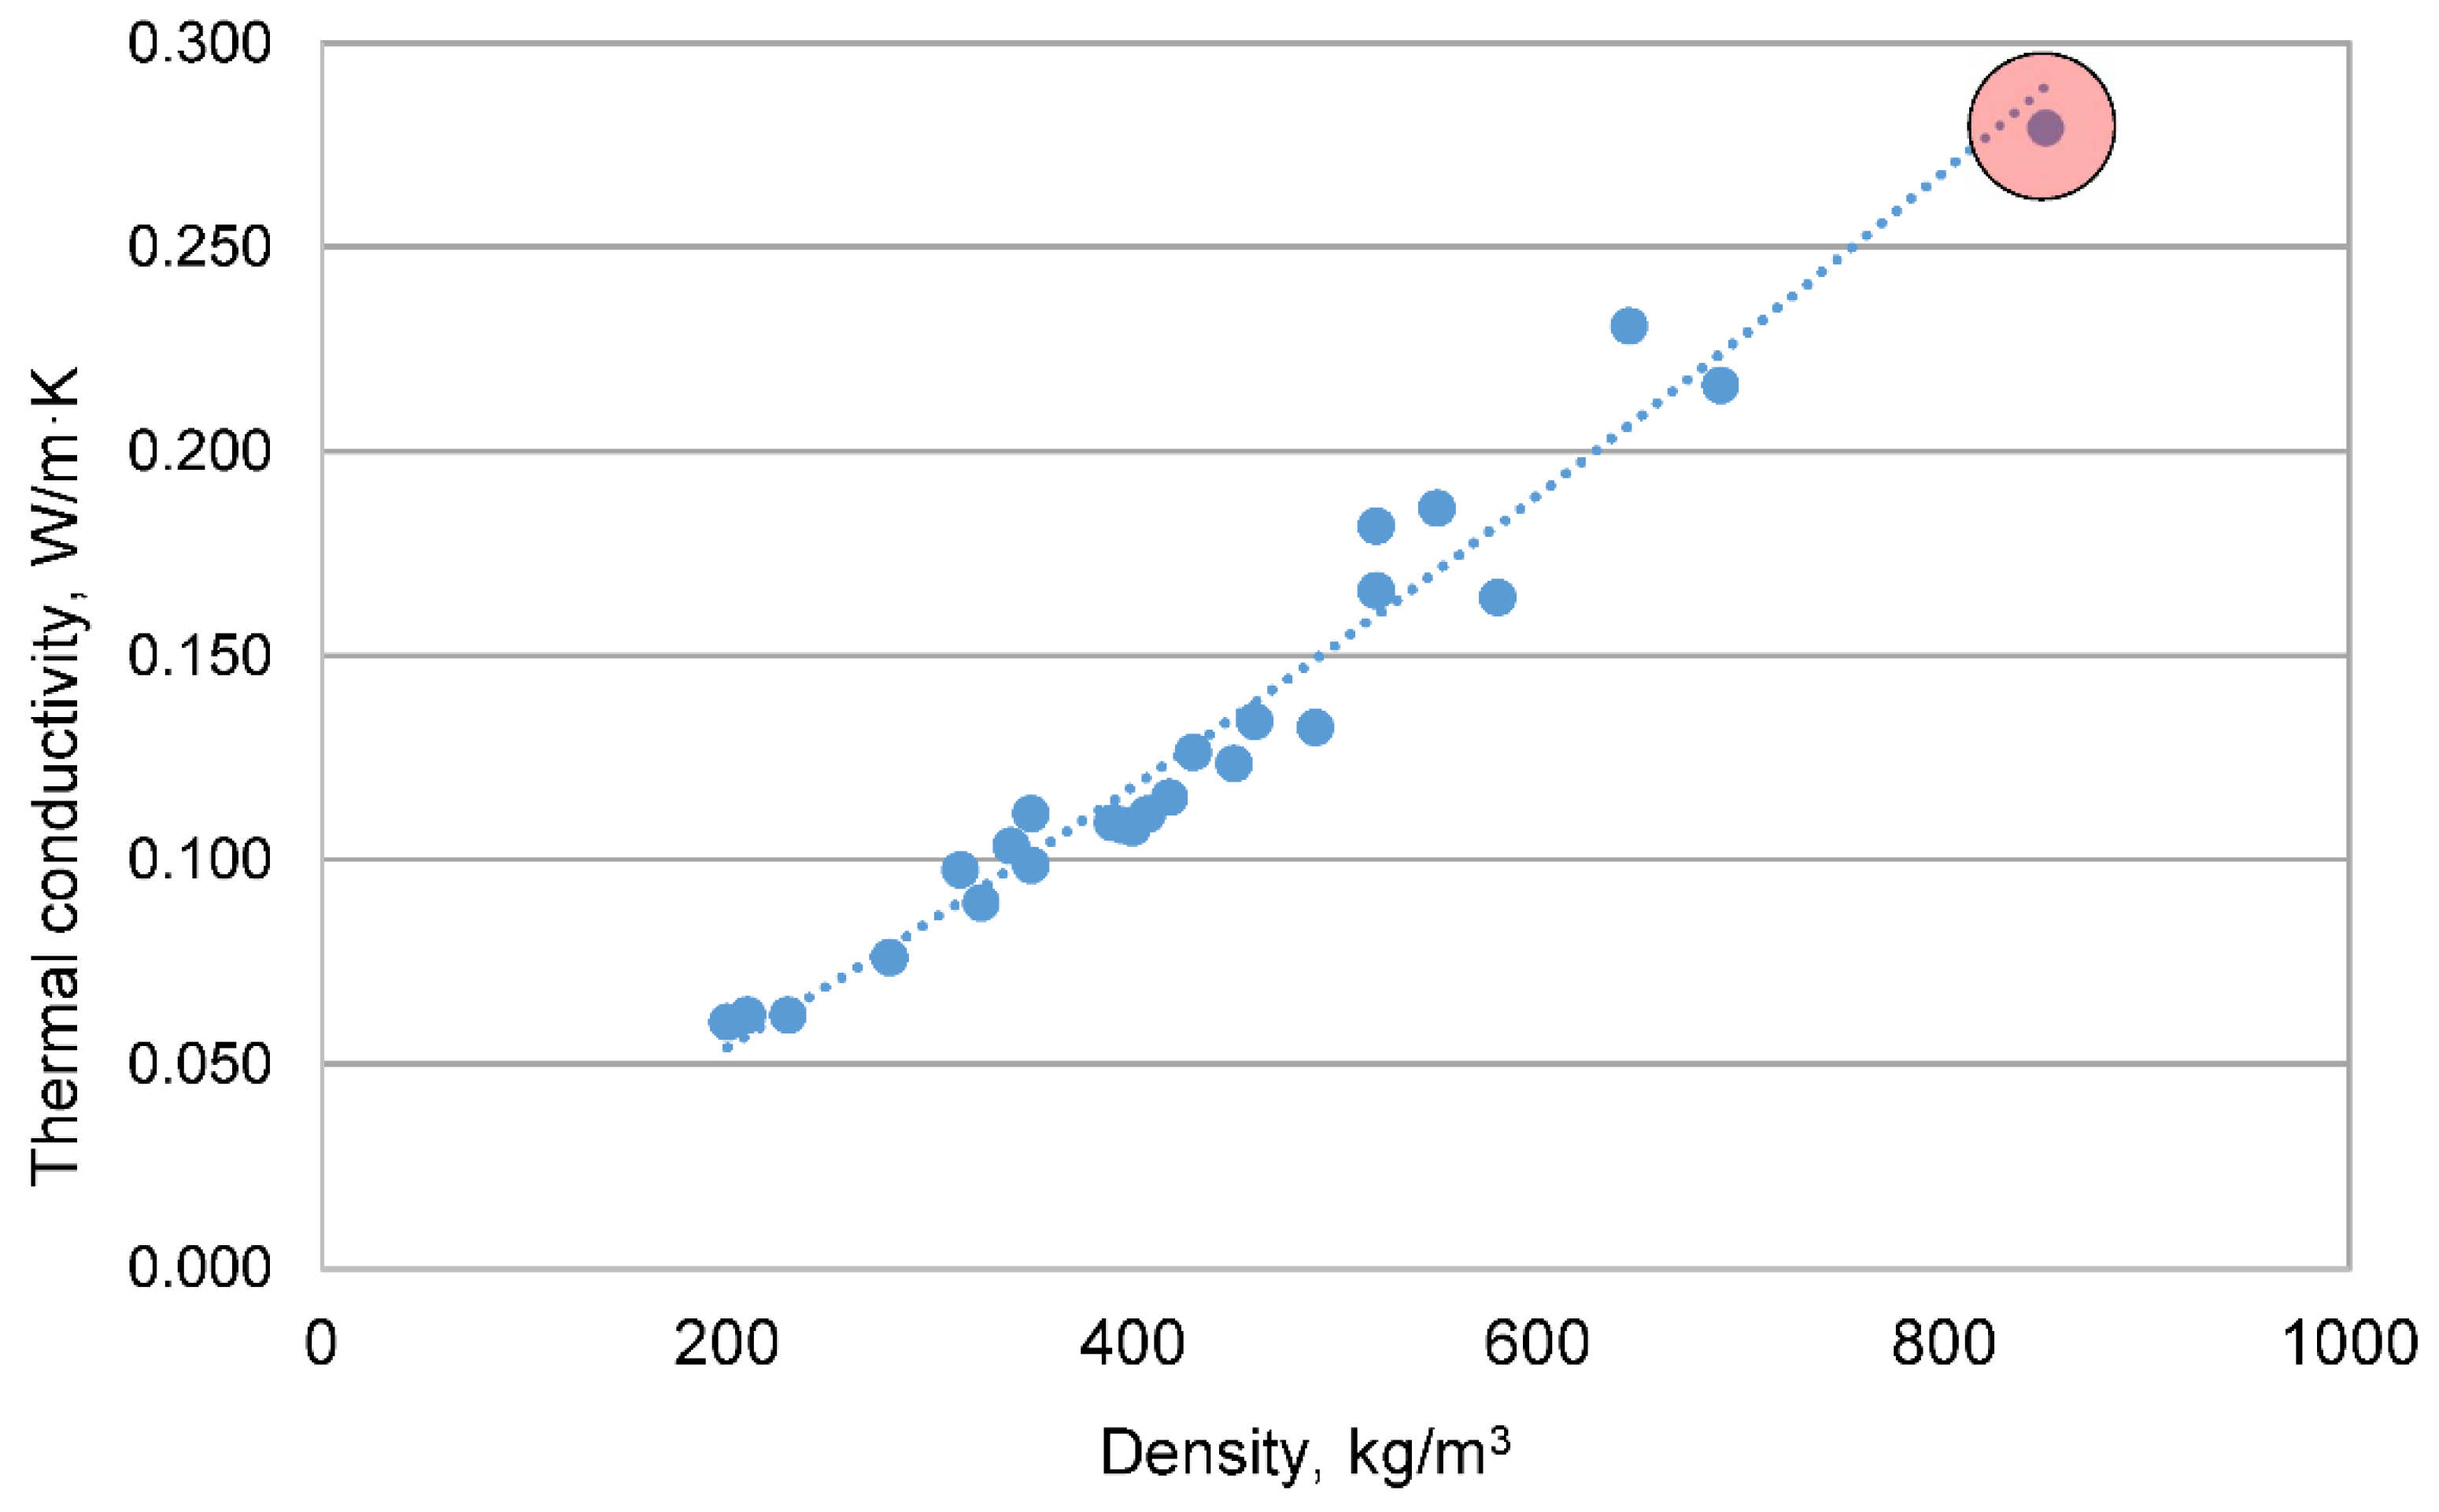
3.2.2. Thermal Conductivity

The coefficient of thermal conductivity was tested only for the reference biocomposite mix. The obtained coefficient of thermal conductivity for a specimen with a density of 850 kg/m3 was 0.275 W/m·K. The other mixtures were not tested because the results are expected to be similar depending on the samples’ dry density. It must be noted that this density is too high to achieve sufficient thermal resistance for a monolithic wall so that it corresponds to modern energy efficiency standards in northern climates, such as in Latvia. For instance, current requirements for wall thermal insulation in Latvia require wall thermal resistance R to be at least 5 m2·K/W to be provided. In this case, the required wall thickness should be at least 1.375 m (5 × 0.275 W/m·K). This indicates that the produced material could not be used as a monolithic wall material but rather as load-bearing material with partial thermal insulation function, as evidenced by compressive strength of more than 3 MPa, which is similar to autoclaved aerated concrete. Compositions with lower density are required to ensure effective thermal insulation.
The diagram in Figure 8 presents the relation between density and coefficient of thermal conductivity. The result of the tested mixture is marked with the red circle, but other results with lower densities are taken from previous studies made by the authors of this paper [12,40,41]. From them, it can be seen that using hemp concrete with a density of 300 kg/m3 (λ = 0.08 W/m·K), R-value of 5 m2·K/W can be achieved at a wall thickness of 40 cm (5 × 0.08 = 0.4 m).
High-density (810–840 kg/m3) MOC biocomposites studied in this research were designed for hemp biocomposite board manufacturing. They are designed to be used as an envelope together with a load-bearing timber frame; the inside partition will be filled with thermal insulation material (Figure 9). Similar hemp biocomposite can be used between the envelope boards as a thermal insulation material, but with a lower density, in a range of 300–400 kg/m3. Previous research on the thermal conductivity of MOC biocomposites with a density of 380 kg/m3 shows it to be 0.085 W/m·K, which is similar to lime-hemp biocomposites with the same density, but with a compressive strength that is two to three times higher [12]. The research shows that, in the case of hemp biocomposites, thermal conductivity is closely correlated to density but depends less on the binder used. Thus, this research is focused on improving MOCs’ compressive strength and water resistance using additives which can be used for insulation boards of different densities.

4. Conclusions

Bio-based building materials are becoming more popular nowadays because of their significant environmental benefits. The scope of this research was to expand the use of hemp concrete in construction by replacing traditional lime-based binder with magnesium oxychloride cement, which provides a faster setting time, thus allowing this material to be used in industrial production. However, the negative feature of this material is its low water resistance. In this work, the water resistance of magnesium cement was studied and the possibilities of improving it by adding fly ash, various acids and nano-silica were considered.
The low water resistance of MOC was evident in this work as compressive strength for wet-cured samples without additives reached only 21–43% of dry-cured sample strength, but the addition of the additives significantly increased this with all the additives used. Nano-silica and citric acid showed the most significant increase by up to four times while only reducing the compressive strength of the magnesium cement in a dry state by 2–10%.
The workability of a fresh paste lowered proportionally with the incorporation of fly ash into the mix due to the higher surface area of the additive. Nano-silica increased workability, by 35% at 7% addition, due to the ultrafine particle size, which reduces the friction between particles. Both acids significantly delay the start of the setting, as was expected from similar research. The best binder proportions were used in the second part of this research.
XRD and SEM analysis confirmed the compressive strength results—wet cured samples contain significantly less Magnesium Chloride Hydroxide Hydrate or five-phase than dry cured samples. Five-phase gives the highest strength of all magnesium oxychloride cement compounds but is soluble in water, so wet cured samples have much less of this compound but significantly more Mg(OH)2. This can also lead to some cracking as Mg(OH)2 is expansive, but biocomposites are unaffected by this due to hemp shives absorbing the expansion.
Prototype samples of hemp magnesium oxychloride biocomposite were produced, demonstrating promising results for the further production of hemp biocomposite boards and strength of more than 3.8 MPa was achieved. Both nano-silicas noticeably increased the strength of dry bio-composites after 28 days by 20%. Nevertheless, results from water-cured specimens were similar to the reference samples and did not correlate with pure binder tests, where an increase in water resistance was observed for binders with additives. This was either due to more water-soluble phases formed in the presence of organic compounds released by the bio-based filler or the mechanical properties of the bio-based filler, which significantly deteriorate when soaked in water and are the ones that mainly determine the properties of the biocomposite.
The obtained coefficient of thermal conductivity for a specimen with a density of 850 kg/m3 was 0.275 W/m·K. At the obtained compressive strength, it shows the best potential to be used as an envelope together with a load-bearing timber frame, the inside partition filled with thermal insulation material.

Supplementary Materials

The following supporting information can be downloaded at: https://www.mdpi.com/article/10.3390/en15197320/s1, Table S1: Binder properties; Table S2: Biocomposite properties.

Author Contributions

Conceptualization, M.S., G.S., A.K. and D.B.; methodology, M.S., G.S. and L.V.; software, J.Z. and L.V.; validation, M.S., G.S., L.V., A.K.; formal analysis, G.S., A.K. and D.B.; investigation, J.Z., G.S. and L.V.; resources, M.S., A.K. and D.B.; data curation, G.S., L.V. and D.B.; writing—original draft preparation, J.Z. and M.S.; writing—review and editing, J.Z., M.S., G.S., L.V. and D.B.; visualization, J.Z.; supervision, M.S., A.K. and D.B.; project administration, A.K. and D.B.; funding acquisition, M.S. and D.B. All authors have read and agreed to the published version of the manuscript.

Funding

This article is supported by the project: “Manufacturing technology of building products made of ecological high performance fibre composites with encapsulated PCM for the NZEB application” (HEMP4NZEB) M-Era.Net programme and Latvian Council of Science, Grant Agreement Nr. ESRTD/2020/8.

Data Availability Statement

Not applicable.

Conflicts of Interest

The funders had no role in the design of the study; in the collection, analyses, or interpretation of data; in the writing of the manuscript; or in the decision to publish the results.

References

  1. Ripple, W.J.; Wolf, C.; Newsome, T.M.; Barnard, P.; Moomaw, W.R. World Scientists’ Warning of a Climate Emergency. Bioscience 2020, 70, 8–12. [Google Scholar] [CrossRef]
  2. European Commission. Proposal for a Regulation of the European Parliament and of the Council Establishing the Framework for Achieving Climate Neutrality and Amending REGULATION (EU) 2018/1999 (European Climate Law); EN: Brussels, Belgium, 2020; pp. 1–58. [Google Scholar]
  3. Zlaugotne, B.; Ievina, L.; Azis, R.; Baranenko, D.; Blumberga, D. GHG Performance Evaluation in Green Deal Context. Environ. Clim. Technol. 2020, 24, 431–441. [Google Scholar] [CrossRef]
  4. Zhang, Y.; Wang, J.; Hu, F.; Wang, Y. Comparison of evaluation standards for green building in China, Britain, United States. Renew. Sustain. Energy Rev. 2017, 68, 262–271. [Google Scholar] [CrossRef]
  5. Pittau, F.; Krause, F.; Lumia, G.; Habert, G. Fast-growing bio-based materials as an opportunity for storing carbon in exterior walls. Build. Environ. 2018, 129, 117–129. [Google Scholar] [CrossRef]
  6. Sáez-Pérez, M.P.; Brümmer, M.; Durán-Suárez, J.A. A review of the factors affecting the properties and performance of hemp aggregate concretes. J. Build. Eng. 2020, 31, 101323. [Google Scholar] [CrossRef]
  7. Wang, L.; Lenormand, H.; Zmamou, H.; Leblanc, N. Effect of variability of hemp shiv on the setting of lime hemp concrete. Ind. Crop. Prod. 2021, 171, 113915. [Google Scholar] [CrossRef]
  8. Shang, Y.; Tariku, F. Hempcrete building performance in mild and cold climates: Integrated analysis of carbon footprint, energy, and indoor thermal and moisture buffering. Build. Environ. 2021, 206, 108377. [Google Scholar] [CrossRef]
  9. Arehart, J.H.; Nelson, W.S.; Srubar, W.V. On the theoretical carbon storage and carbon sequestration potential of hempcrete. J. Clean. Prod. 2020, 266, 121846. [Google Scholar] [CrossRef]
  10. Elfordy, S.; Lucas, F.; Tancret, F.; Scudeller, Y.; Goudet, L. Mechanical and thermal properties of lime and hemp concrete (“hempcrete”) manufactured by a projection process. Constr. Build. Mater. 2008, 22, 2116–2123. [Google Scholar] [CrossRef]
  11. Kidalova, L.; Terpakova, E.; Stevulova, N. MgO cement as suitable conventional binders replacement in hemp concrete. Pollack Period. 2011, 6, 115–122. [Google Scholar] [CrossRef]
  12. Sinka, M.; van den Heede, P.; de Belie, N.; Bajare, D.; Sahmenko, G.; Korjakins, A. Comparative life cycle assessment of magnesium binders as an alternative for hemp concrete. Resour. Conserv. Recycl. 2018, 133C, 288–299. [Google Scholar] [CrossRef]
  13. Qiao, H.; Cheng, Q.; Wang, J.; Shi, Y. The application review of magnesium oxychloride cement. J. Chem. Pharm. Res. 2014, 6, 180–185. [Google Scholar]
  14. Walling, S.A.; Provis, J.L. Magnesia-Based Cements: A Journey of 150 Years, and Cements for the Future? Chem. Rev. 2016, 116, 4170–4204. [Google Scholar] [CrossRef] [Green Version]
  15. Li, G.; Yu, Y.; Li, J.; Wang, Y.; Liu, H. Experimental study on urban refuse/magnesium oxychloride cement compound floor tile. Cem. Concr. Res. 2003, 33, 1663–1668. [Google Scholar] [CrossRef]
  16. Gong, W.; Wang, N.; Zhang, N.; Han, W.; Qiao, H. Water resistance and a comprehensive evaluation model of magnesium oxychloride cement concrete based on Taguchi and entropy weight method. Constr. Build. Mater. 2020, 260, 119817. [Google Scholar] [CrossRef]
  17. He, P.; Poon, C.S.; Tsang, D.C.W. Water resistance of magnesium oxychloride cement wood board with the incorporation of supplementary cementitious materials. Constr. Build. Mater. 2020, 255, 119145. [Google Scholar] [CrossRef]
  18. Chen, F. Study on preparation and properties of modified magnesium oxysulfate cements. Chem. Eng. Trans. 2017, 62, 973–978. [Google Scholar]
  19. Xu, K.; Xi, J.; Guo, Y.; Dong, S. Effects of a new modifier on the water-resistance of magnesite cement tiles. Solid State Sci. 2012, 14, 10–14. [Google Scholar] [CrossRef]
  20. Xu, B.; Ma, H.; Hu, C.; Yang, S.; Li, Z. Influence of curing regimes on mechanical properties of magnesium oxychloride cement-based composites. Constr. Build. Mater. 2016, 102, 613–619. [Google Scholar] [CrossRef]
  21. Chau, C.K.; Chan, J.; Li, Z. Influences of fly ash on magnesium oxychloride mortar. Cem. Concr. Compos. 2009, 31, 250–254. [Google Scholar] [CrossRef]
  22. Jin, Y.; Xiao, L.; Luo, F. Influence of fly ash on the properties of magnesium oxychloride cement. Adv. Mater. Res. 2013, 662, 406–408. [Google Scholar] [CrossRef]
  23. Li, Y.; Yu, H.; Zheng, L.; Wen, J.; Wu, C.; Tan, Y. Compressive strength of fly ash magnesium oxychloride cement containing granite wastes. Constr. Build. Mater. 2013, 38, 1–7. [Google Scholar] [CrossRef]
  24. Sikora, P.; Rucinska, T.; Stephan, D.; Chung, S.Y.; Elrahman, M.A. Evaluating the effects of nanosilica on the material properties of lightweight and ultra-lightweight concrete using image-based approaches. Constr. Build. Mater. 2020, 264, 120241. [Google Scholar] [CrossRef]
  25. Yuan, Z.Y.; Liu, X.L.; Jia, Y.F.; Liu, P.; Li, M.C. Modification research on the water-resistance of magnesium oxychloride cement. Appl. Mech. Mater. 2013, 423–426, 1027–1030. [Google Scholar] [CrossRef]
  26. Guan, B.; Tian, H.; Ding, D.; Wu, J.; Xiong, R.; Xu, A.; Chen, H. Effect of Citric Acid on the Time-Dependent Rheological Properties of Magnesium Oxychloride Cement. J. Mater. Civ. Eng. 2018, 30, 4018275. [Google Scholar] [CrossRef]
  27. Zhang, N.; Yu, H.; Gong, W.; Liu, T.; Wang, N.; Tan, Y.; Wu, C. Effects of low- and high-calcium fly ash on the water resistance of magnesium oxysulfate cement. Constr. Build. Mater. 2020, 230, 116951. [Google Scholar] [CrossRef]
  28. Huang, J.; Ge, S.; Wang, H.; Chen, R. Study on the improvement of water resistance and water absorption of magnesium oxychloride cement using long-chain organosilane-nonionic surfactants. Constr. Build. Mater. 2021, 306, 124872. [Google Scholar] [CrossRef]
  29. Li, M.; Gu, K.; Chen, B. Effects of flue gas desulfurisation gypsum incorporation and curing temperatures on magnesium oxysulfate cement. Constr. Build. Mater. 2022, 349, 128718. [Google Scholar] [CrossRef]
  30. Guan, H.; Lu, J.F.; Ba, H.J. On the volume stability of Magnesium oxychloride cement-based materials. J. Shenzhen Univ. Sci. Eng. 2009, 26, 296–300. [Google Scholar]
  31. Kastiukas, G.; Zhou, X.; Neyazi, B.; Wan, K.T. Sustainable Calcination of Magnesium Hydroxide for Magnesium Oxychloride Cement Production. J. Mater. Civ. Eng. 2019, 31, 04019110. [Google Scholar] [CrossRef] [Green Version]
  32. Ye, Q.; Wang, W.; Zhang, W.; Li, J.; Chen, H. Tuning the phase structure and mechanical performance of magnesium oxychloride cements by curing temperature and H2O/MgCl2 ratio. Constr. Build. Mater. 2018, 179, 413–419. [Google Scholar] [CrossRef]
  33. Kumari, L.; Li, W.Z.; Vannoy, C.H.; Leblanc, R.M.; Wang, D.Z. Synthesis, characterisation and optical properties of Mg(OH)2 micro-/nanostructure and its conversion to MgO. Ceram. Int. 2009, 35, 3355–3364. [Google Scholar] [CrossRef]
  34. Góchez, R.; Wambaugh, J.; Rochner, B.; Kitchens, C.L. Kinetic study of the magnesium oxychloride cement cure reaction. J. Mater. Sci. 2017, 52, 7637–7646. [Google Scholar] [CrossRef]
  35. Tan, Y.; Liu, Y.; Grover, L. Effect of phosphoric acid on the properties of magnesium oxychloride cement as a biomaterial. Cem. Concr. Res. 2014, 56, 69–74. [Google Scholar] [CrossRef]
  36. Aiken, T.A.; Russell, M.; McPolin, D.; Bagnall, L. Magnesium oxychloride boards: Understanding a novel building material. Mater. Struct. Constr. 2020, 53, 1–16. [Google Scholar] [CrossRef]
  37. Vitola, L.; Sinka, M.; Korjakins, A.; Bajare, D. Impact of Organic Compounds Extracted from Hemp-Origin Aggregates on the Hardening Process and Compressive Strength of Different Types of Mineral Binders. J. Mater. Civ. Eng. 2020, 32, 04020386. [Google Scholar] [CrossRef]
  38. Barbieri, V.; Gualtieri, M.L.; Manfredini, T.; Siligardi, C. Lightweight concretes based on wheat husk and hemp hurd as bio-aggregates and modified magnesium oxysulfate binder: Microstructure and technological performances. Constr. Build. Mater. 2021, 284, 122751. [Google Scholar] [CrossRef]
  39. Terpáková, E.; Kidalová, L.; Eštoková, A.; Čigášová, J.; Števulová, N. Chemical modification of hemp shives and their characterisation. Procedia Eng. 2012, 42, 931–941. [Google Scholar] [CrossRef] [Green Version]
  40. Sinka, M.; Sahmenko, G. Sustainable thermal insulation biocomposites from locally available hemp and lime. Vide. Tehnologija. Resur.-Environ. Technol. Resour. 2013, 1, 73–77. [Google Scholar] [CrossRef] [Green Version]
  41. Sinka, M.; Korjakins, A.; Bajare, D.; Zimele, Z.; Sahmenko, G. Bio-based construction panels for low carbon development. Energy Procedia 2018, 147, 220–226. [Google Scholar] [CrossRef]
Figure 1. Hemp shives used as a filler.
Energies 15 07320 g001
Figure 2. (a) Polyurethane mould; (b) cracking of the binder specimens after curing in water.
Energies 15 07320 g002
Figure 3. (a) Flow test of a fresh paste (FA-5); (b) initial flow diameter of a binder with higher viscosity (NS1-5); (c) diameter after jolting 15 times (FA-5).
Energies 15 07320 g003
Figure 4. Compressive strength of specimens; dried, wet/water cured; others are air cured. With various additives: (a) Fly ash; (b) Levasil CB8; (c) Levasil CB50; (d) Phosphoric acid; (e) Citric acid.
Energies 15 07320 g004
Figure 5. X-ray diffractograms of raw Magnesia and REF sample on Day 28 after wet and dry curing.
Energies 15 07320 g005
Figure 6. Microstructure of REF sample on Day 28 after wet and dry curing studied by SEM.
Energies 15 07320 g006
Figure 7. Compressive strength of the bio-composites.
Energies 15 07320 g007
Figure 8. Relation between density and coefficient of thermal conductivity. The result for a tested sample is marked with a red circle.
Energies 15 07320 g008
Figure 9. MOC biocomposite boards during construction of timber frame testing facility.
Energies 15 07320 g009
Table 1. Composition of the used raw materials.
NameMgO, %SiO2, %Al2O3, %CaO, %K2O, %SO3, %Fe2O3, %Na2O, %Density, g/cm3
Magnesia73.04.01.04.0--3.0-0.8
Fly ash1.3350.7727.512.892.220.656.430.6-
CB8-50------1.4
CB50-15------1.1
Table 2. Hemp particle size distribution.
Fibres, %Skins/
leaves, %
Part. < 1 mm, % Shives
1–5 mm,%5–10 mm, %10–15 mm, %15–20 mm, %20–25 mm, %25–30 mm, %30–35 mm, %35–40 mm, %
2.4911.182.0013.5721.9515.4712.774.585.644.196.15
Table 3. Binder mix proportions.
NameMgOMgCl2 1:1Add. WaterFANS1NS2PACA
FA-REF10.60------
FA-50.950.57-0.05----
FA-100.900.54-0.10----
FA-200.800.480.0250.20----
FA-300.700.420.0500.30----
NS1-REF10.6------
NS1-110.6--0.01---
NS1-310.6--0.03---
NS1-510.6--0.05---
NS1-710.6--0.07---
NS2-REF10.6------
NS2-110.6---0.01--
NS2-310.6---0.03--
NS2-510.6---0.05--
NS2-710.6---0.07--
PA-REF10.6------
PA-0.210.6----0.002-
PA-0.310.6----0.003-
PA-0.510.6----0.005-
PA-110.6----0.010-
PA-1.510.6----0.015-
CA-REF10.6------
CA-0.510.6-----0.005
CA-110.6-----0.010
CA-1.510.6-----0.015
CA-210.6-----0.020
Table 4. Bio-composite mix proportions.
NameMgOMgCl2 1:1
Solution
AdditiveHemp ShivesH2O for Hemp Shives
B-REF10.6-0.250.25
B-FA0.950.570.050.250.25
B-NS110.60.050.250.25
B-NS210.60.050.250.25
B-PA10.60.0050.250.25
B-CA10.60.0050.250.25
Table 5. Properties of the fresh MOC pastes.
NameInitial Flow
Diameter, mm
Diameter After
Jolting 15 Times, mm
Setting Time, min
tinitialtfinal
FA-REF11523058118
FA-510021071120
FA-1010020562140
FA-2010019555138
FA-3010018550150
NS1-REF10522557112
NS1-111022570135
NS1-312023563127
NS1-514524764123
NS1-716026065114
NS2-REF11523562118
NS2-111524550133
NS2-311525054126
NS2-511524572126
NS2-712024580125
PA-REF12524560130
PA-0.2150270122212
PA-0.3135255108213
PA-0.5125250120203
PA-1105190113243
PA-1.510017095225
CA-REF16526560120
CA-0.5170290130190
CA-1145255223318
CA-1.5155250233352
CA-2165260267380
Publisher’s Note: MDPI stays neutral with regard to jurisdictional claims in published maps and institutional affiliations.

