Article

Junction Temperature Prediction of Insulated-Gate Bipolar Transistors in Wind Power Systems Based on an Improved Honey Badger Algorithm

1
State Key Laboratory of Reliability and Intelligence of Electrical Equipment, Hebei University of Technology, Tianjin 300401, China
2
Key Laboratory of Electromagnetic Field and Electrical Apparatus Reliability of Hebei Province, Hebei University of Technology, Tianjin 300401, China
3
State Grid Hengshui Electric Power Supply Company, Hengshui 053000, China
4
Department of Mechatronics and Mechanical Engineering, Bochum University of Applied Sciences, 44801 Bochum, Germany
*
Author to whom correspondence should be addressed.
Energies 2022, 15(19), 7366; https://doi.org/10.3390/en15197366
Submission received: 12 September 2022 / Revised: 27 September 2022 / Accepted: 3 October 2022 / Published: 7 October 2022

Abstract

:
To reduce carbon dioxide emissions, wind power generation is receiving more attention. The conversion of wind energy into electricity requires frequent use of insulated-gate bipolar transistors (IGBTs). Therefore, it is important to improve their reliability. This study proposed a method to predict the junction temperature of IGBTs, which helps to improve their reliability. Limited by the bad working environment, the physical temperature measurement method proposed by previous research is difficult to apply. Therefore, a junction temperature prediction method based on an extreme learning machine optimized by an improved honey badger algorithm was proposed in this study. First, the data of junction temperature were obtained by the electro-heat coupling model method. Then, the accuracy of the proposed method was verified with the data. The results show that the average absolute error of the proposed method is 0.0303 °C, which is 10.62%, 11.14%, 91.67%, and 95.54% lower than that of the extreme learning machine optimized by a honey badger algorithm, extreme learning machine optimized by a seagull optimization algorithm, extreme learning machine, and back propagation neural network model. Therefore, compared with other models, the proposed method in this paper has higher prediction accuracy.

1. Introduction

In order to reduce environmental pollution, new energy generation technology has been rapidly developed [1,2]. Wind energy is a clean and renewable energy source, and wind power technology has gained importance as a result [3,4]. A wind turbine generator system can convert the kinetic energy of wind into electricity. It mainly consists of a wind wheel, a generator, and a power electronic converter [5,6]. The power electronic converter in wind turbines is also called a wind power converter, which can integrate the power generated by the generator into the grid [7,8]. The IGBT power module is the most vulnerable component in wind power converters, and 34 percent of the converter system failures are related to its failure [9]. Therefore, improving the reliability of IGBTs contributes to the stable operation of wind power systems.
The failure of IGBT power modules is mainly related to the junction temperature [10], which is the actual temperature of the device. Welded IGBT power modules are used in wind power converters [11]. The main causes of failure of the welded IGBTs are chip damage and package damage [12]. The chip damage refers to the damage of the IGBT chip and freewheeling diode (FWD) chip inside the module. The main causes of the chip damage are electrical overstress [13], high temperature, electrostatic damage, latch-up effects, and metal reconstruction, which are mostly related to temperature increases. The package damage includes fracture and detachment of bonding wires [14] and fatigue of solder layers [15]. The essential reason for package damage is material fatigue, which is mainly caused by temperature increases. Therefore, it is important to accurately predict the junction temperature of IGBT to improve its reliability. In past studies, the temperature-sensitive parameter (TSP) method was often used to obtain the junction temperature of IGBTs [16,17]. This approach is often based on artificial intelligence algorithms [18,19]. A machine learning model characterizing the relationship between TSPs and junction temperature needs to be built first. Then, the junction temperature can be obtained according to this model [20]. The TSP method is suitable for long-term tasks. Its efficiency depends on the performance of the machine learning model built [21,22]. Therefore, a well-performing machine learning model was proposed in this study.
This study contributes to a proposed prediction model based on an extreme learning machine optimized by an improved honey badger algorithm (IHBA-ELM). This model can accurately predict the junction temperature of IGBTs in wind power converters, improving the reliability of IGBTs as well as wind power converters. This model takes the wind speed and the cabin temperature of the generator as inputs, which are easy to obtain. Therefore, the model has a high practicality.
The remaining sections are as follows: Section 2 introduces the research on junction temperature prediction and extreme learning machines in recent years, and the gaps in this study; Section 3 is the method; Section 4 presents the results of the study; Section 5 is a discussion around the results; and Section 6 is the conclusion.

2. Review of the Literature

2.1. Junction Temperature Prediction of IGBTs in Wind Power Converters

The junction temperature of IGBTs has been studied a lot. The main methods to obtain the junction temperature are the physical temperature measurement method, TSP method, and mathematical method.
The physical temperature measurement method is to measure the temperature of the IGBT directly in an experiment. The literature [23] placed four temperature sensors inside the module to obtain the temperature. The average temperature of the four sensors represents the case temperature of the IGBT power module. However, this method has a large error and can only measure the case temperature. In the literature [24], thermocouples were installed on the chip surface, on the bottom of the module, and on the heat sink, so as to obtain the junction temperature of the module. This method requires the opening of the module package, which will destroy the structure of the module. In the literature [25], a coating with high emissivity was smeared on the chip surface. Thermal pictures of the chip surface were obtained using an infrared camera, then the distribution of temperature on the chip was obtained. The junction temperature obtained by this method is accurate. In the literature [26], the infrared temperature measurement method was compared with the TSP method in experiments. Finding that the average temperature of the chip surface obtained by these two methods is very close, this study verified the effectiveness of the TSP method.
The TSP method is mainly used to predict or monitor the junction temperature by building a machine learning model. In the literature [27], the peak values of the bus voltage ringing were planned to observe the junction temperature of the IGBT. The advantage is that it will not be affected by the degradation of the bonding wire. The literature [28] found that the change in junction temperature could change the capacitance inside the IGBT, which would affect the accuracy of the parameter measurement. Therefore, a monitoring model was proposed based on a stepwise regression algorithm for obtaining the junction temperature. The literature [29] found that the short-circuit current of the IGBT was a good temperature-sensitive parameter. The literature [30] concluded that there existed an error in observing the junction temperature of IGBTs based on a single TSP. Therefore, a machine learning model of saturation voltage drop, collector current, and aging cycle number with junction temperature was developed in this literature. Multiple parameters were accustomed to monitoring the junction temperature.
The mathematical model method is often used for junction temperature calculations. A method to calculate the power loss of IGBTs was proposed in the literature [31]. The junction temperature of the IGBT could be calculated by the power loss and heat network model. The literature [32] considered that the thermal coupling effect between adjacent IGBT chips had a great influence on the junction temperature. Therefore, a new model was proposed considering this effect. The literature [33] thought the potency of the present calculation methods of the junction temperature was low. Therefore, the power task profile was simplified and a more efficient calculation method was proposed.

2.2. Improved Honey Badger Algorithm—Extreme Learning Machine

The extreme learning machine (ELM) is developed from the back propagation neural network (BPNN) [34]. Presently, ELM has been widely used to solve prediction problems [35]. Weights and thresholds greatly affect the prediction performance of ELM. Therefore, they are often optimized by intelligent algorithms. For example, in the literature [36], in order to improve the accuracy of ELM, its parameters were optimized with an improved Grey Wolf Optimizer (GWO). The literature [37] optimized the weights and thresholds of ELM using an adaptive differential evolution strategy. Then, a new intelligent algorithm was proposed. In the literature [38], a more efficient algorithm was proposed by combining the simple crow search algorithm with ELM in order to improve the accuracy. In this study, the honey badger algorithm (HBA) was used to optimize the ELM. Although HBA-ELM has been used to solve practical problems [39], it still suffers from the problem of low convergence accuracy. Therefore, the cubic chaotic mapping, the wave state adaptive weights, and the Gaussian variance function were introduced in this study to improve the convergence of the HBA-ELM. These optimization strategies have proven to be effective in solving the problem of junction temperature prediction of IGBTs in wind power converters.

2.3. The Method in This Study

In this study, the junction temperature of an IGBT was determined using an electro-heat coupling model method first. Then, a simple model for predicting the junction temperature was proposed. It is theoretically supported by the IHBA and ELM. Only the wind speed and the cabin temperature of the generator needed to be known to obtain the junction temperature of the IGBT. Finally, the IHBA-ELM model was compared with other prediction models to verify its effectiveness. Although it can be used for junction temperature prediction of IGBTs, the IHBA-ELM model still has limitations. Its accuracy is related to the size of the training sample. If the training sample is small, its accuracy is low. Therefore, it is important to obtain as much training data as possible before application to improve the prediction accuracy of the IHBA-ELM model.

3. Method

3.1. Principle of Electro-Heat Coupling Model Method

IGBT power modules have both IGBT and FWD chips inside. The IGBT chip has energy losses in both conduction and switching states [40]. The same with the FWD chips. There are many IGBT loss modules that can be used to calculate the junction temperature of IGBTs [41,42], such as the Hefner–Diebolt model. These IGBT loss models are more accurate. However, the calculation is more complicated because there are so many factors to be considered and so much data to be collected [43]. To simplify the calculation, the junction temperature of IGBT is calculated using the electro-heat coupling model method [44].
First, calculate the energy loss of the IGBT chip and FWD chip, and then, by multiplying the thermal resistance, the temperature change can be calculated. This is the principle of the electro-heat coupling model method [31]. The electro-heat coupling model includes an electrical loss model and a heat network model. The electrical loss model can be performed to obtain the energy loss of the IGBT and FWD chips. The heat network model can be performed to obtain the temperature change [32]. These two models are coupled with each other.

3.1.1. Electrical Loss Model

1.
Equation (1) is utilized to obtain the loss of IGBT in the conduction state.
P k = { ( U I I ( t ) + R I I ( t ) 2 ) δ I I ( t ) > 0 0 I ( t ) 0
where, U I = U c e _ 25 + K U I ( T j I 25 ) , U I is the saturation voltage drop and K U I is its temperature coefficient, U c e _ 25 is the saturation pressure drop at 25 °C, T j I is the junction temperature. I ( t ) is the on-state current. R I = R I _ 25 + K R I ( T j I 25 ) . R I is the on-state resistance and K R I is its temperature coefficient, R I _ 25 is the on-state resistance at 25 °C. δ I = ( 1 ± m sin ( ω t + ϕ ) ) / 2 , δ I is the duty cycle of IGBT, the “+“ and “ “ in “ ± “, respectively, indicate that the IGBT is operating in inverter and rectifier modes, m is the degree of modulation, ϕ is the phase angle between the voltage and current, and ω is the angular frequency.
2.
Equation (2) is utilized to obtain the loss of FWD in the conduction state.
P D c = { ( U D I d + R D I d 2 ) δ D I d > 0 0 I d 0
where, U D = U D _ 25 + K U D ( T j D 25 ) , and R D = R D _ 25 + K R D ( T j D 25 ) . Where, U D _ 25 and R D _ 25 are the saturation voltage drop and the on-state resistance of the FWD chip at 25 °C, K U D and K R D are the temperature coefficients of the saturation voltage drop and on-state resistance, I d is the on-state current of the FWD chip, and T j D is the junction temperature of the FWD chip. δ D is the duty cycle, and δ D = ( 1 m sin ( ω t + ϕ ) ) / 2 . Where, the “ “ and “+“ in “ “, respectively, indicate that the FWD chip is operating in inverter and rectifier modes.
3.
Equation (3) is utilized to obtain the loss of IGBT in the switching state.
P I s = f s w E k s U d c I c U N I N [ 1 + K I s ( T j I 25 ) ]
where, f s w is the switching frequency. K I s is the temperature coefficient. E k s is the loss of IGBT under rated conditions in the switching state. U d c is the DC voltage. I c is the collector current. U N and I N are the voltage and current of the IGBT power module under rated conditions.
The losses of diodes include conduction losses and reverse recovery losses. The conduction loss is negligible compared to the reverse recovery loss. The reverse recovery loss of a diode is affected by the current which flows through the diode during the reverse recovery.
4.
Equation (4) is utilized to obtain the loss of FWD in the switching state.
P D s = f s w E r e f U d c I d c U N I N [ 1 + K D s ( T j D 25 ) ]
where, E r e f is the reverse recovery loss of the FWD chip under rated conditions, and K D s is the correction factor for the switching energy loss of the FWD chip. I d c is the current which flows through the FWD chip during the reverse recovery.
P I = P I c + P I s is the total loss of the IGBT chip, and P D = P D c + P D s is the total loss of the FWD chip.

3.1.2. Heat Network Model

The heat network model of the IGBT is usually a fourth-order Foster equivalent heat network model [32], as shown in Figure 1.
In Figure 1, Z I j and Z D j are the thermal impedance of the IGBT chip and the FWD chip to copper substrate, respectively. Z I C and Z D C are the thermal impedance from the copper substrate to the radiator for the IGBT chip and the FWD chip. Z 6 is the thermal impedance of the radiator. T a is the environmental temperature at which the IGBT power module is located. It can be taken as the cabin temperature of the generator.
Equations (5) and (6) are utilized to obtain the junction temperature of the IGBT chip and the FWD chip.
T j I = P I ( Z I j + Z I C ) + ( P I + P D ) Z 6 + T a
T j D = P D ( Z D j + Z D C ) + ( P I + P D ) Z 6 + T a

3.2. Simulation Validation

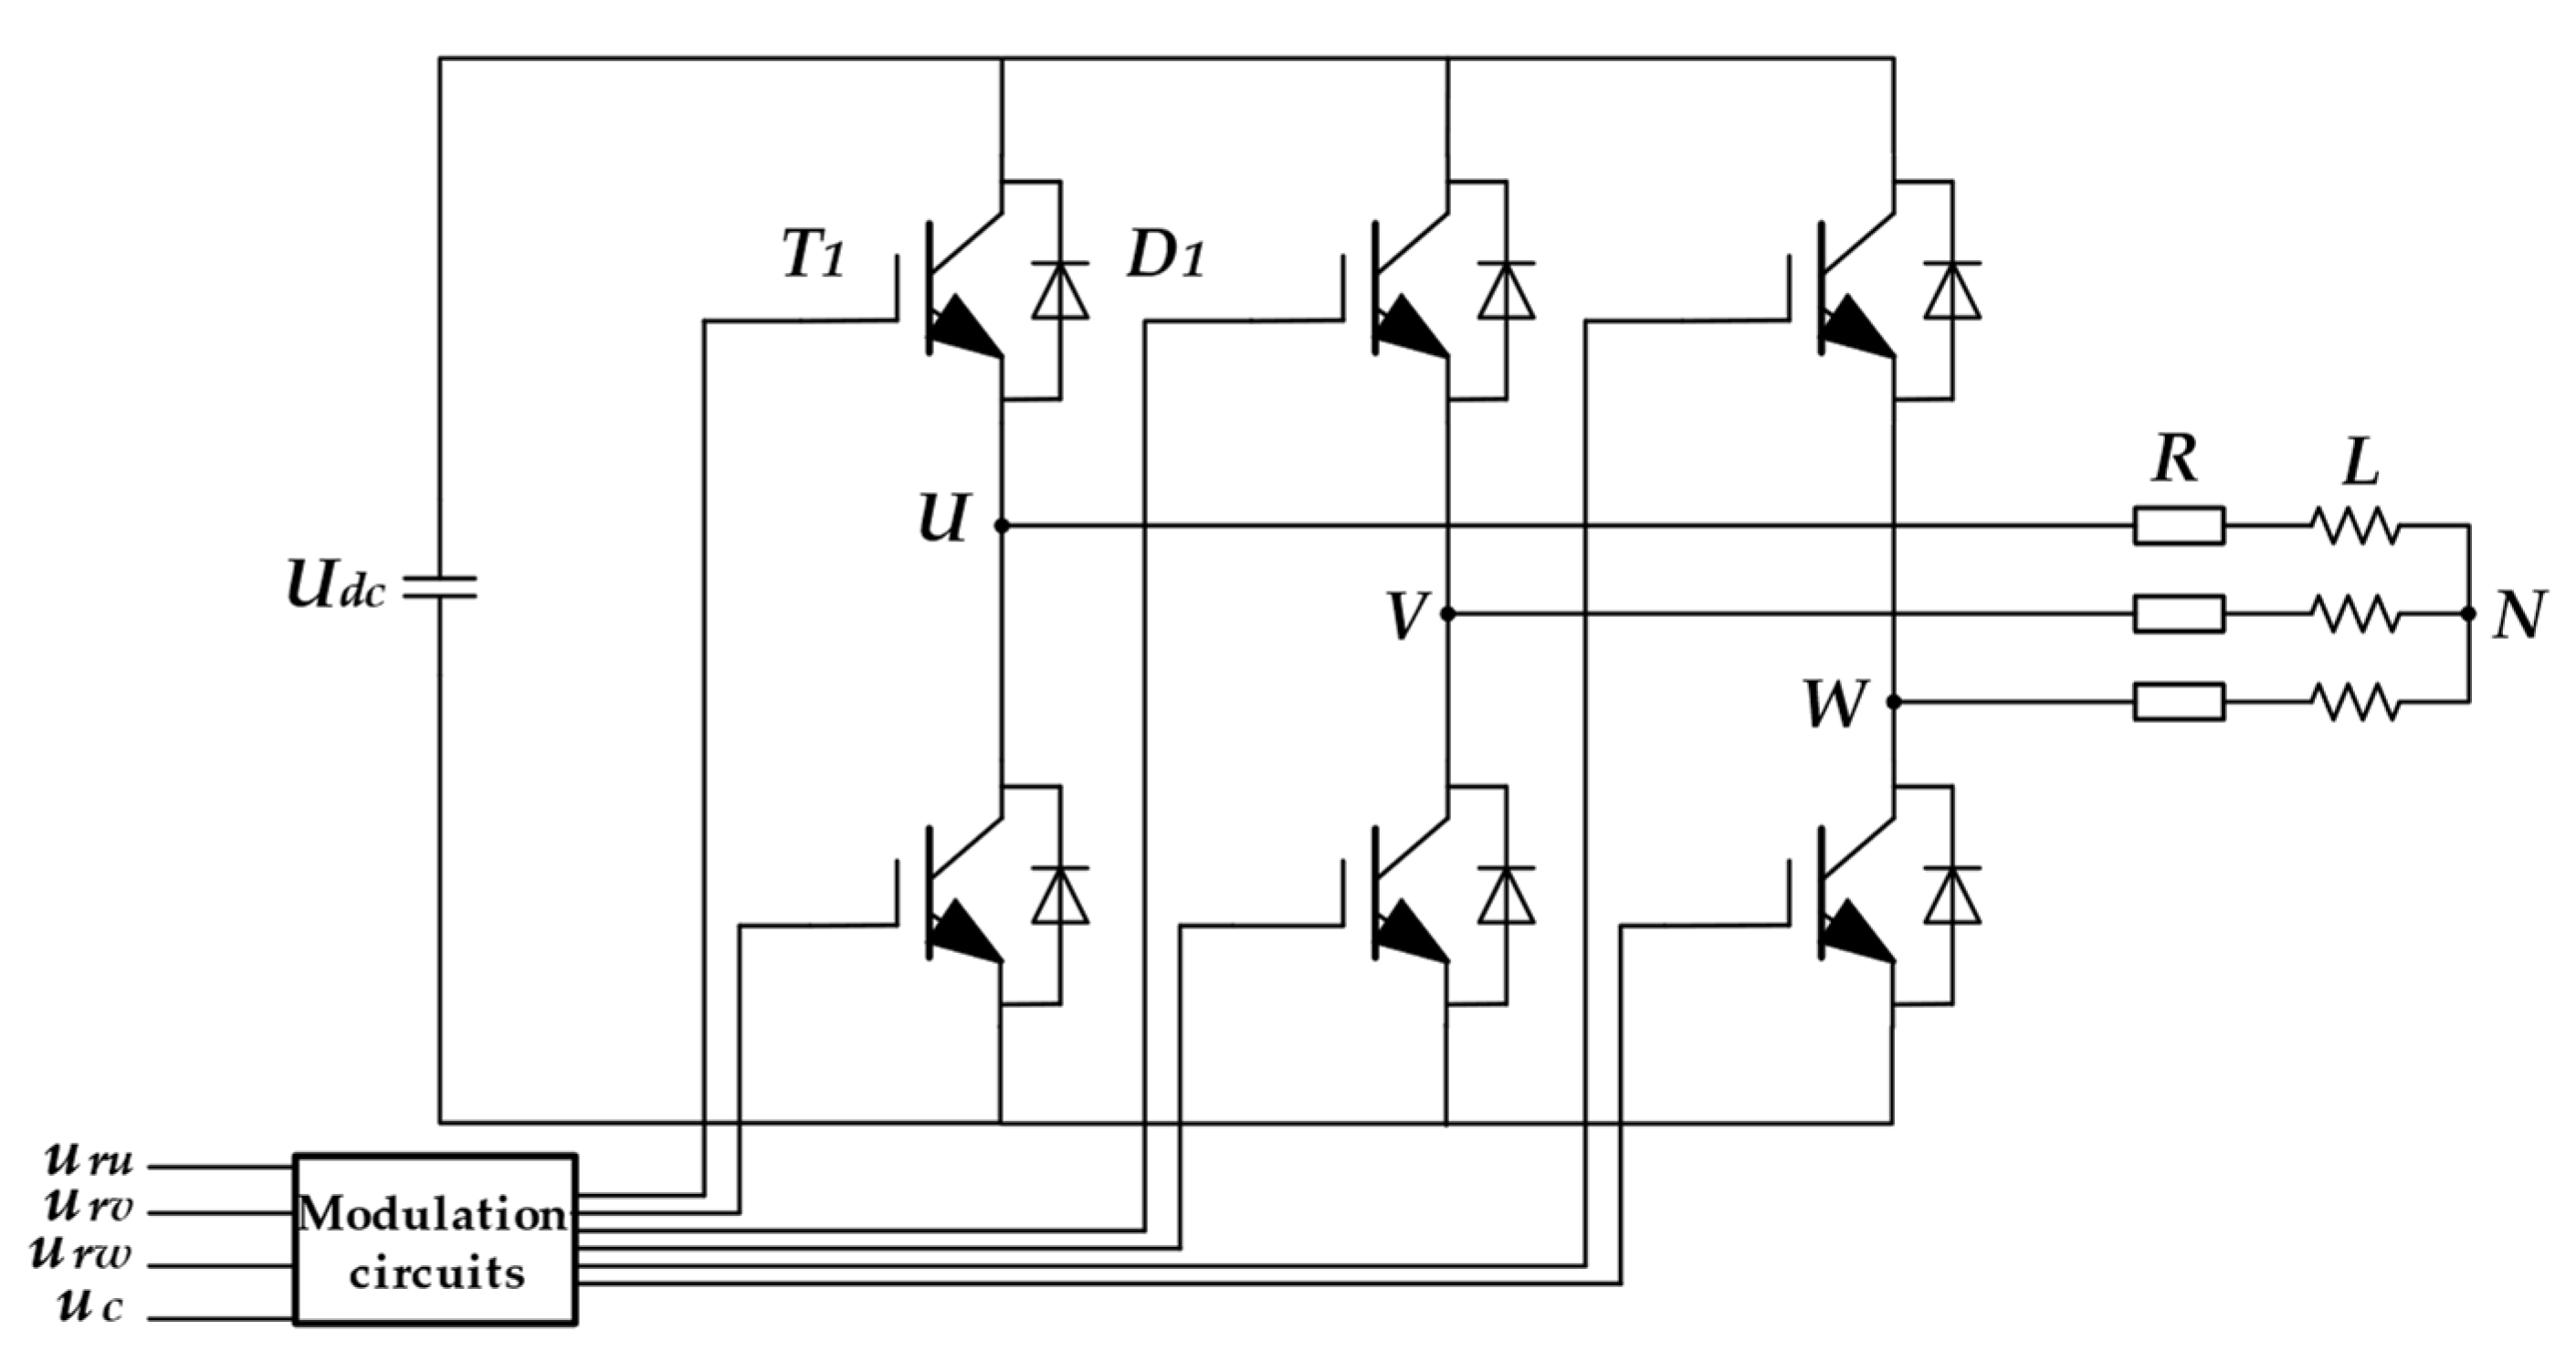
PLECS is a professional power electronics simulation software, which is widely used in circuit simulation [45,46]. PLECS can simulate the heat generated by losses in semiconductor devices, and is, therefore, widely used for thermal simulation of semiconductor devices [47,48]. Therefore, to validate the efficiency of the electro-heat coupling model method, a three-phase bridge inverter circuit using pulse-width modulation (PWM) was built on PLECS, as shown in Figure 2.
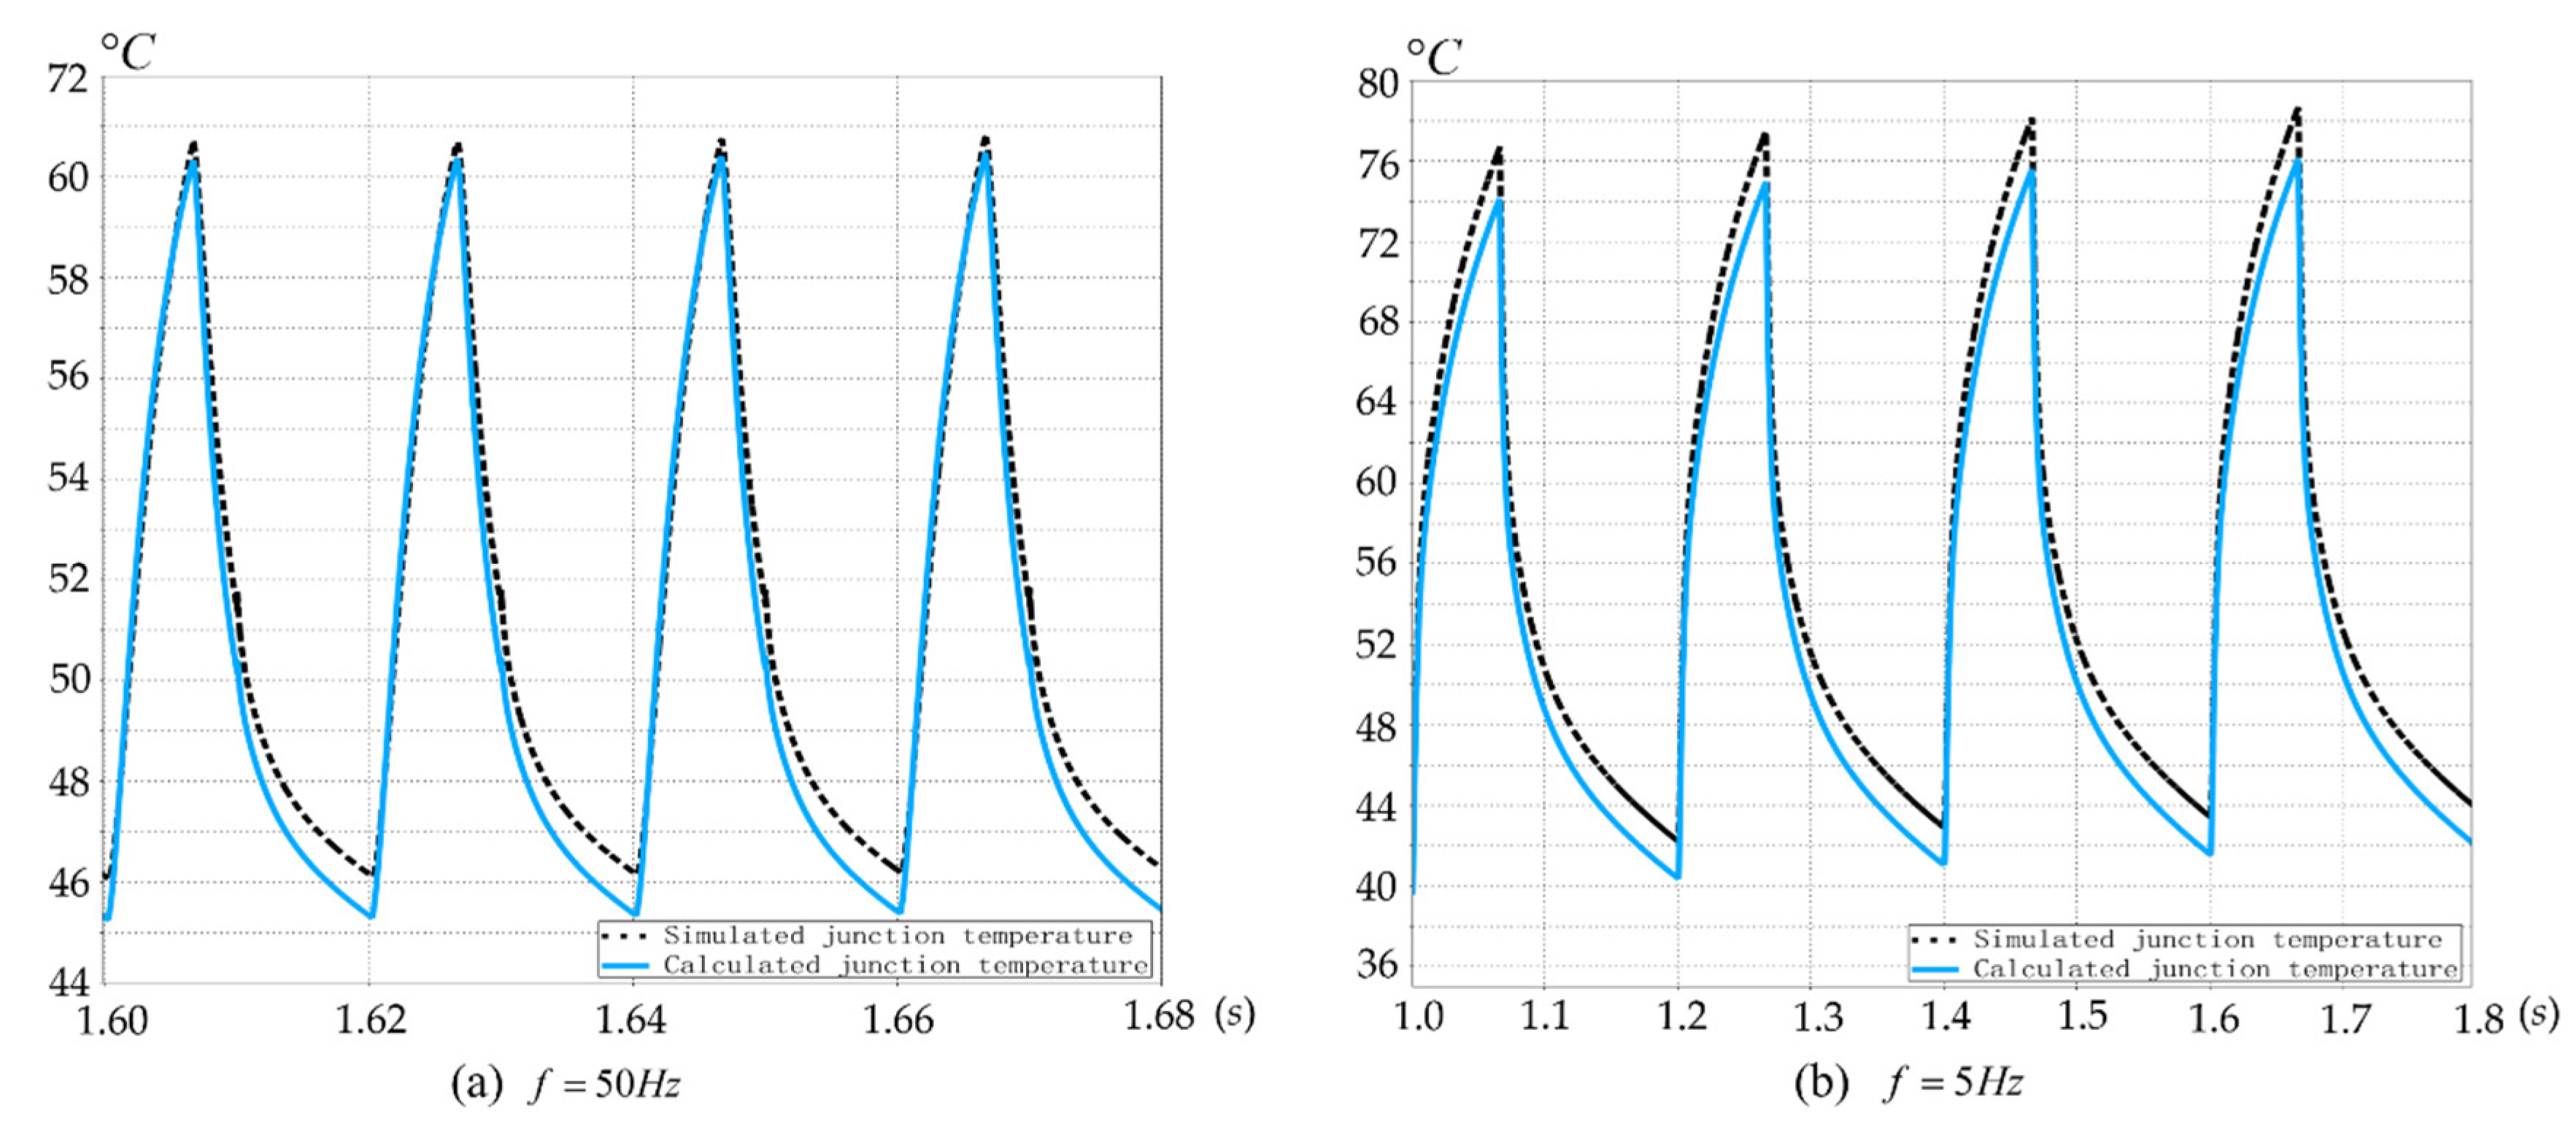
The IGBT power module in the circuit was FF300R17ME4. The DC side voltage U d c was set to 690 V. The load was a resistive inductive load, where the resistance was 5   Ω and the inductance was 10   m H . The junction temperature of the IGBT was obtained by two methods. One is to calculate the junction temperature using the electro-heat coupling model method, and the other is to measure the junction temperature directly using the thermal simulation function of the software. The results are shown in Figure 3.
The comparison of the junction temperature at an output frequency of 50   H z is shown in Figure 3a, while it at 5   H z is shown in Figure 3b. The black dashed line in Figure 3 indicates the junction temperature obtained by thermal simulation, while the blue solid line indicates the junction temperature obtained by the electro-heat coupling model method. When the output frequency was, the calculated junction temperature fluctuated at the same frequency as the simulated junction temperature. The amplitude of the wave of the calculated junction temperature was 15 °C, while that of the simulated junction temperature was 14.7 °C. The difference between the two was only 2.04%, which proves the effectiveness of the electro-heat coupling model method. When the frequency was reduced, the error of the fluctuation amplitude of the two was 3.88%. Therefore, the effectiveness of the electro-heat coupling model method will not suffer from the lower output frequency. It is available for obtaining the junction temperature of IGBTs.

3.3. Example of Junction Temperature Calculation of IGBTs in Wind Power Converters

3.3.1. Wind Turbine Model

Wind speed affects the output power and voltage of wind turbines. Equation (7) can be utilized to obtain output power [49].
P t = { 0 0 v < v s p 1 α + β v + χ v 2 v s p 1 v < v s p 2 P v s p 2 v < v s p 3 0 v v s p 3
where, P is the rated power. v is real-time wind speed. v s p 1 is cut-in wind speed. v s p 2 is rated wind speed. v s p 3 is cut-out wind speed. α , β and χ are constants, which can be calculated by Equation (8), Equation (9), and Equation (10), respectively.
α = v s p 1 ( v s p 1 + v s p 2 ) 2 v s p 1 ( v s p 1 v s p 2 ) 3 ( v s p 1 + v s p 2 )
β = 2 ( v s p 1 + v s p 2 ) 4 / v s p 2 ( 3 v s p 1 + v s p 2 ) ( v s p 1 v s p 2 ) 2
χ = 2 2 ( v s p 1 + v s p 2 ) 3 / v s p 2 ( v s p 1 v s p 2 ) 2
A wind power converter consists of two parts. One part is adjacent to the rotor of the generator and the other part is adjacent to the grid. Equation (11) is utilized to obtain the line voltage of the part adjacent to the rotor of the generator [49].
U g = { 0 0 v < v s p 1 K U f K f v v v s p 1 v < v s p 2 K U f K f v v s p 2 v s p 2 v < v s p 3 0 v v s p 3
where, K U f = 2 π N n K n Φ , N n is the number of winding turns, K n is the winding distribution factor, and Φ is the magnetic flux. K f v = p d ω / ( 2 π v ) , ω is the angular velocity of the rotor, p d is the number of pole pairs of the generator.
Equation (12) is utilized to obtain the current in the converter.
I 2 P t 3 U g cos ϕ
where, cos ϕ is power factor angle.

3.3.2. Junction Temperature Calculation Process

To gain the junction temperature, the voltage and current within the converter should first be computed based on the wind speed and the technical manual of the wind turbine. Then, the junction temperature can be gotten from the electrical loss model and the heat network model. The calculation process is shown in Figure 4.
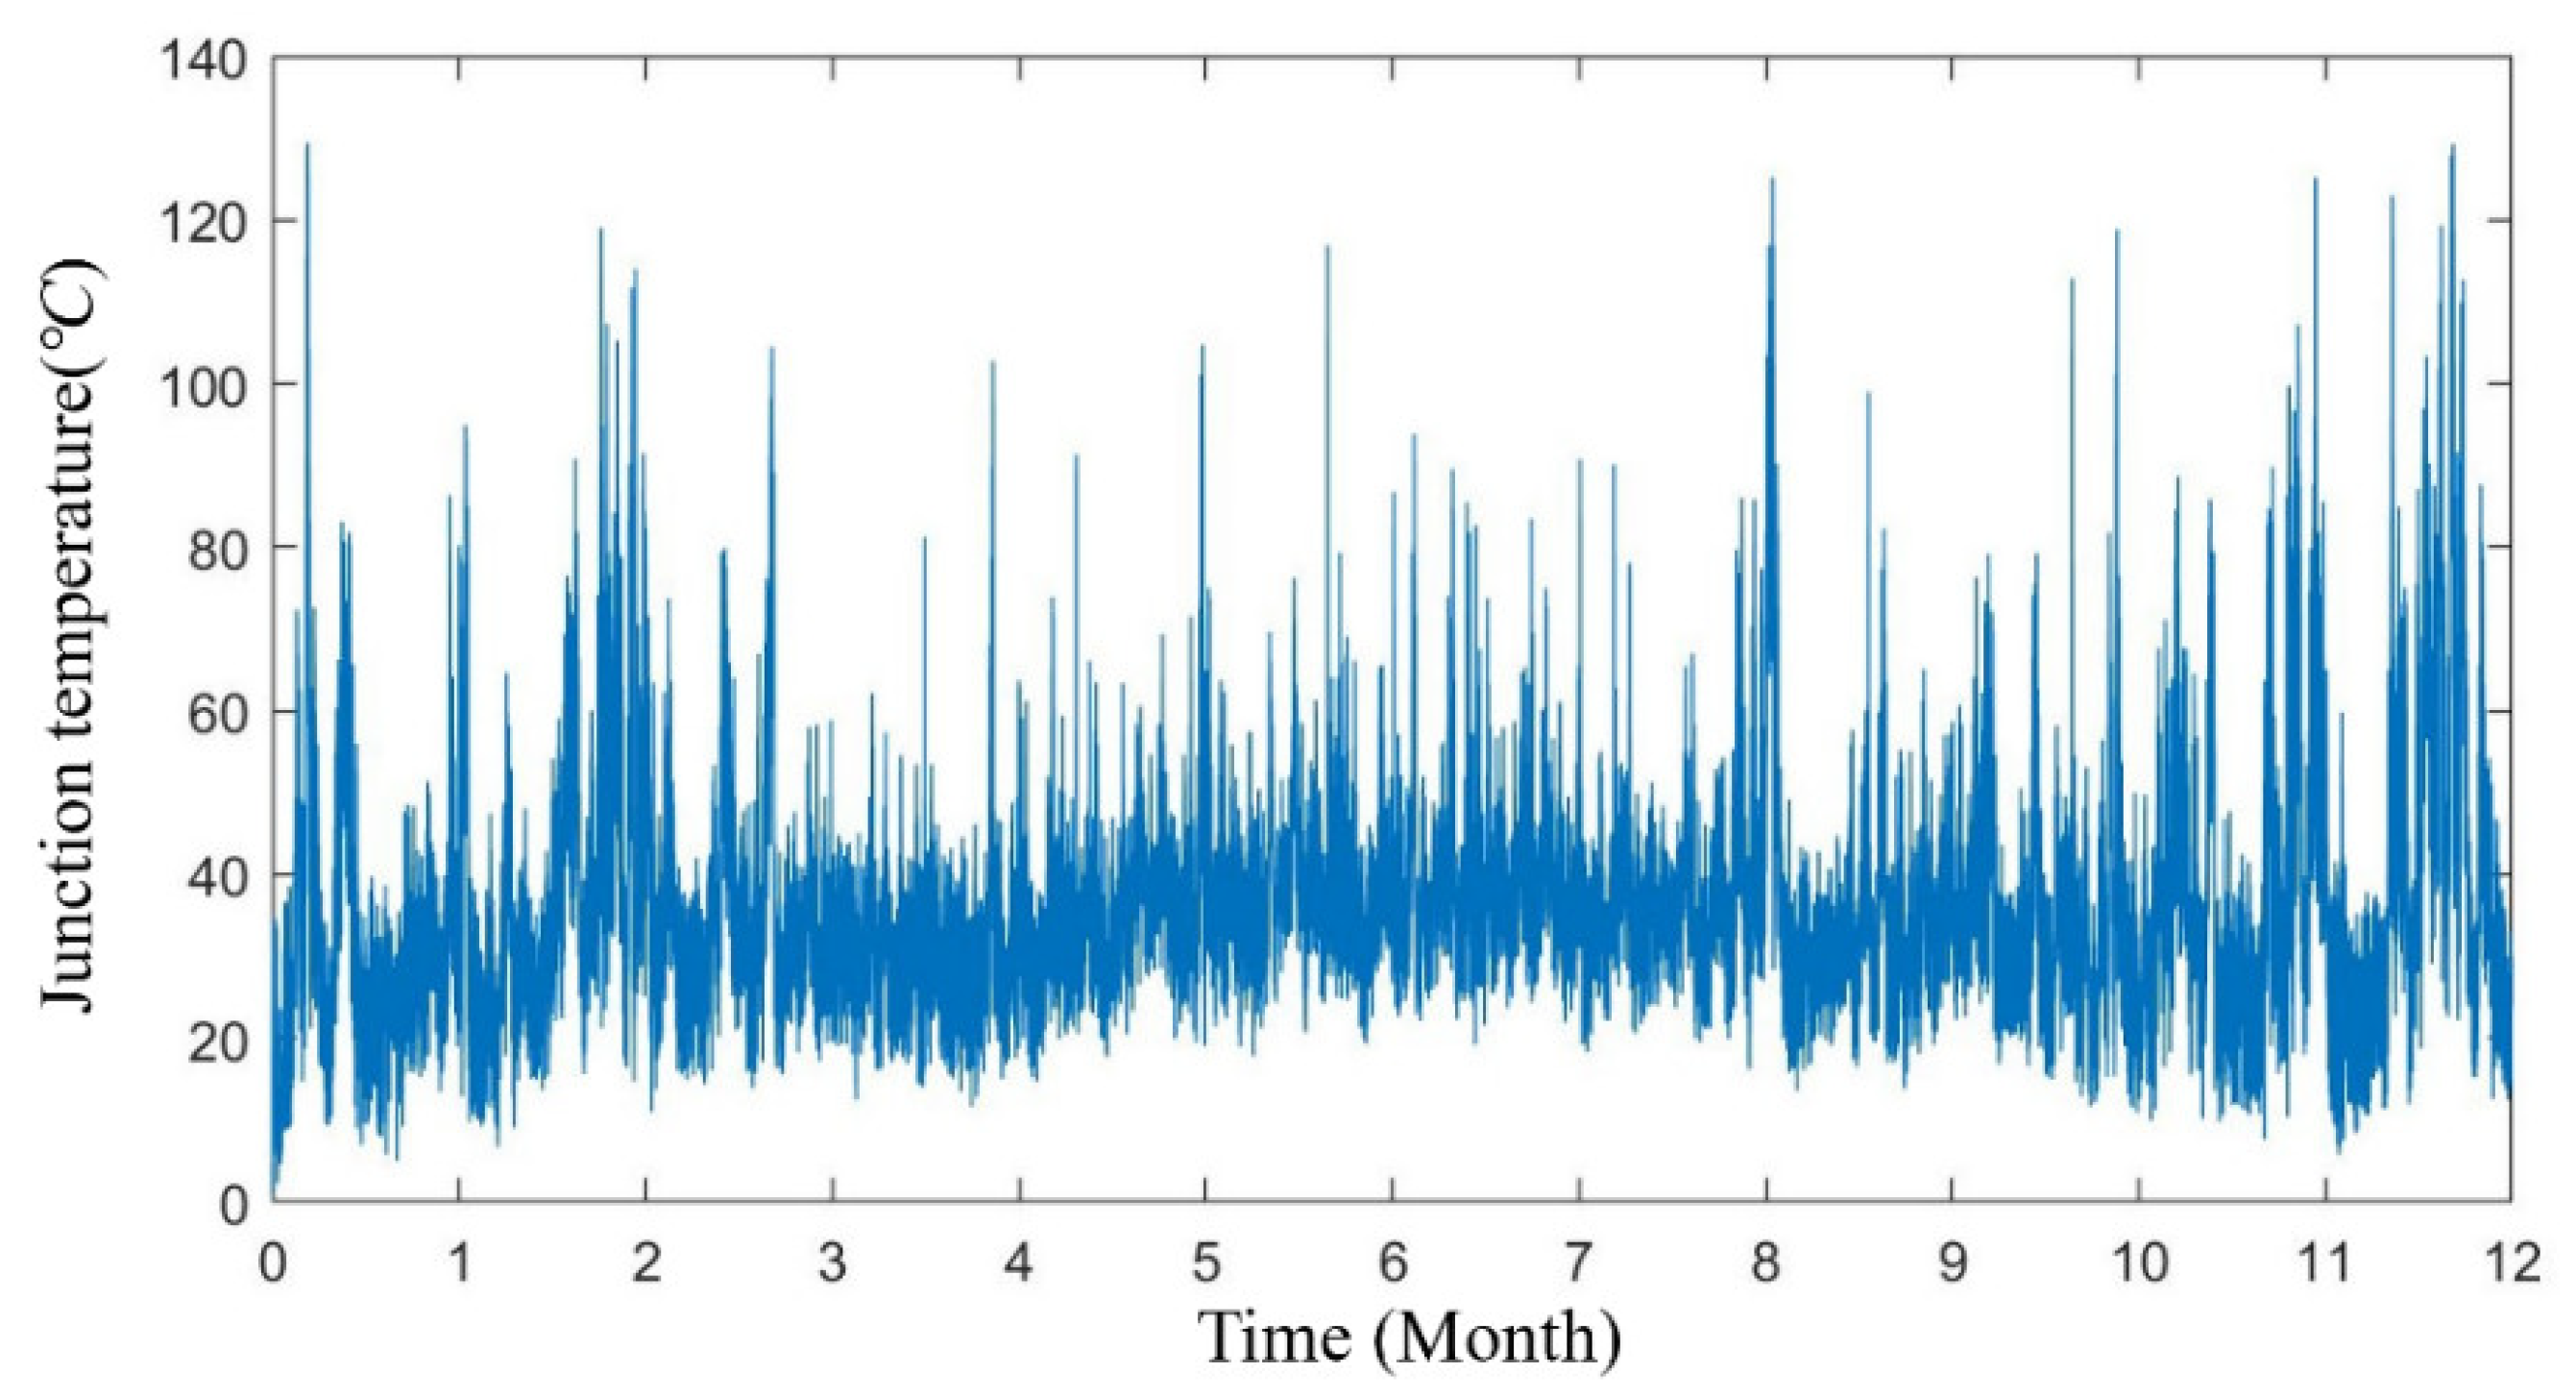
In this study, data for one year from a 2 MW wind turbine in China was collected. And it was used to calculate the junction temperature of the IGBT. The sensors collected one set of wind speed and cabin temperature every ten minutes. Therefore, a total of 52,560 sets of data were collected throughout one year. The junction temperature wave for one year is shown in Figure 5.

3.4. Modeling of Junction Temperature Prediction Based on IHBA-ELM

The electro-heat coupling model method is accurate. However, it is too complex, and there are many sensors that need to be set up in order to obtain the operation data of wind turbines. It is not suitable for performing long-term tasks. Therefore, in this section, a simple junction temperature prediction model was proposed. According to Section 3, the junction temperature of IGBTs was mainly related to wind speed and cabin temperature. Therefore, the junction temperature prediction model proposed in this study took them as input quantities.

3.4.1. Principle of Extreme Learning Machine and Honey Badger Algorithm

The network structure of the ELM consists of an input layer with n variables, a hidden layer with l variables, and an output layer with m variables.
Suppose there are F samples. The input matrix of the samples is X = [ x 1 j ,   x 2 j ,   ,   x n j ] T and the output matrix is Y = [ y 1 j ,   y 2 j ,   ,   y m j ] T , where, j = 1 ,   2 ,   ,   F . The goal of the ELM is to obtain a set of desired outputs Y . Thus,
j = 1 F y j y j < ε
where, ε is an arbitrarily infinitesimal positive value.
Set A ( x ) as the hidden layer’s activation function. In this paper, A ( x ) = 1 / ( 1 + e x ) . Set o as the weight value joining the input layer to the hidden layer. o = [ o 1 k ,   o 2 k ,   ,   o l k ] T , k = 1 ,   2 ,   ,   n . Set β as the weight value joining the hidden layer with the output layer. β = [ β 1 p ,   β 2 p ,   ,   β l p ] T , p = 1 ,   2 ,   ,   m . Set e as the threshold of the hidden layer. e = [ e 1 ,   e 2 ,   ,   e l ] T . Let J be the output matrix of the hidden layer. Then,
J ( x ,   o ,   e ) = [ A ( o 1 x 1 + e 1 ) A ( o l x 1 + e l ) A ( o 1 x F + e 1 ) A ( o l x F + e l ) ] F × l
The desired output of ELM is Y = J β .
The honey badger algorithm (HBA) was created in 2021. It mainly describes the behavior of a honey badger searching for honey [50]. Honey badgers obtain honey in two ways. One is to obtain honey through its own sense of smell, and the other is to find honey with the help of guide birds. The steps of the HBA are shown below.
1.
Initialization of algorithm parameters. That is, set the problem’s dimension, the number of honey badgers and their initial position.
2.
Calculate honey attractiveness. Honey attractiveness is the degree of attraction of the hive to honey badgers. Equation (15) is used to obtain it.
I j = r × D 4 π l j 2
where, r is a number that is located within (0, 1) at random, D = ( x i ,   j x i ,   j + 1 ) 2 , and l j = x g x i ,   j . x i ,   j is the position of the jth honey badger at the ith iteration, and x g is the position of the hive.
3.
Update the location of honey badgers. There are two location update formulas. Let p be a number that is located within ( 0 ,   1 ) at random. If p 0.5 , the location of the honey badger can be updated by Equation (16).
x i + 1 ,   j = x i ,   j + G × γ × I × x g + G × k 1 × η × l j × | cos ( 2 π k 2 ) × [ 1 cos ( 2 π k 3 ) ] |
where, k 1 , k 2 and k 3 are numbers located within (0, 1) at random. γ denotes the ability of the honey badger to obtain food, and in general, γ = 6 . η is the density factor, and η = A × exp ( n / n m ) , where, n is the number of iterations in real time, n m is the largest value of iterations, and A is generally taken as 2. G can be utilized to adjust the forward direction of the honey badger.
G = { 1 k 4 0.5 1 k 4 > 0.5
where, k 4 is a number that is located within (0, 1) at random.
If p > 0.5 , the location of the honey badger can be updated by Equation (18).
x i + 1 ,   j = x i ,   j + G × k 5 × η × l j
where, k 5 is a number that is located within (0, 1) at random.

3.4.2. Improvement of the HBA

When dealing with complex high-dimensional problems, the global convergence of the HBA is poor, and it can easily fall to the local optimum. Therefore, in order to solve this problem, the IHBA was obtained by making the following improvements in this paper.
1.
The initialization of the population was improved. To enhance the quality of the initial population and the diversity of population individuals, cubic chaotic mapping was introduced in this paper [51]. As shown in Equation (19).
y ( o + 1 ) = 4 y ( o ) 3 3 y ( o )
where, 1 < y ( o ) < 1 , o = 1 ,   2 ,   ,   n , and y ( o ) 0 . In generating the initial population, the first individual could be created randomly first. Then, the remaining individuals could be obtained by iterating over each dimension of the first individual according to Equation (19).
2.
The wave state adaptive weights S were introduced. In the position update formula of the honey badger population, the coefficient in front of x i ,   j is 1, which could lead to local rigidity in position updates. Therefore, the wave state adaptive weights S were introduced as coefficients of x i ,   j to improve the optimization ability.
S = 1 + sin ( π × n ) 2 n m + π
3.
The Gaussian variance function was introduced. In late iterations, the population diversity of the honey badger algorithm decreases; thus, the local optimum tends to be obtained. Therefore, the Gaussian variation function was introduced to make the population more prosperous. After obtaining the new population by Equation (16) or Equation (18). Let
x i + 1 ,   j = x i + 1 ,   j × ( 0.5 + k 6 g )
where, k 6 is a number that is located within (0, 1) at random. g is a random number that matched the standard normal distribution.
Six test functions listed in Table 1 were chosen to test the efficiency of the IHBA.
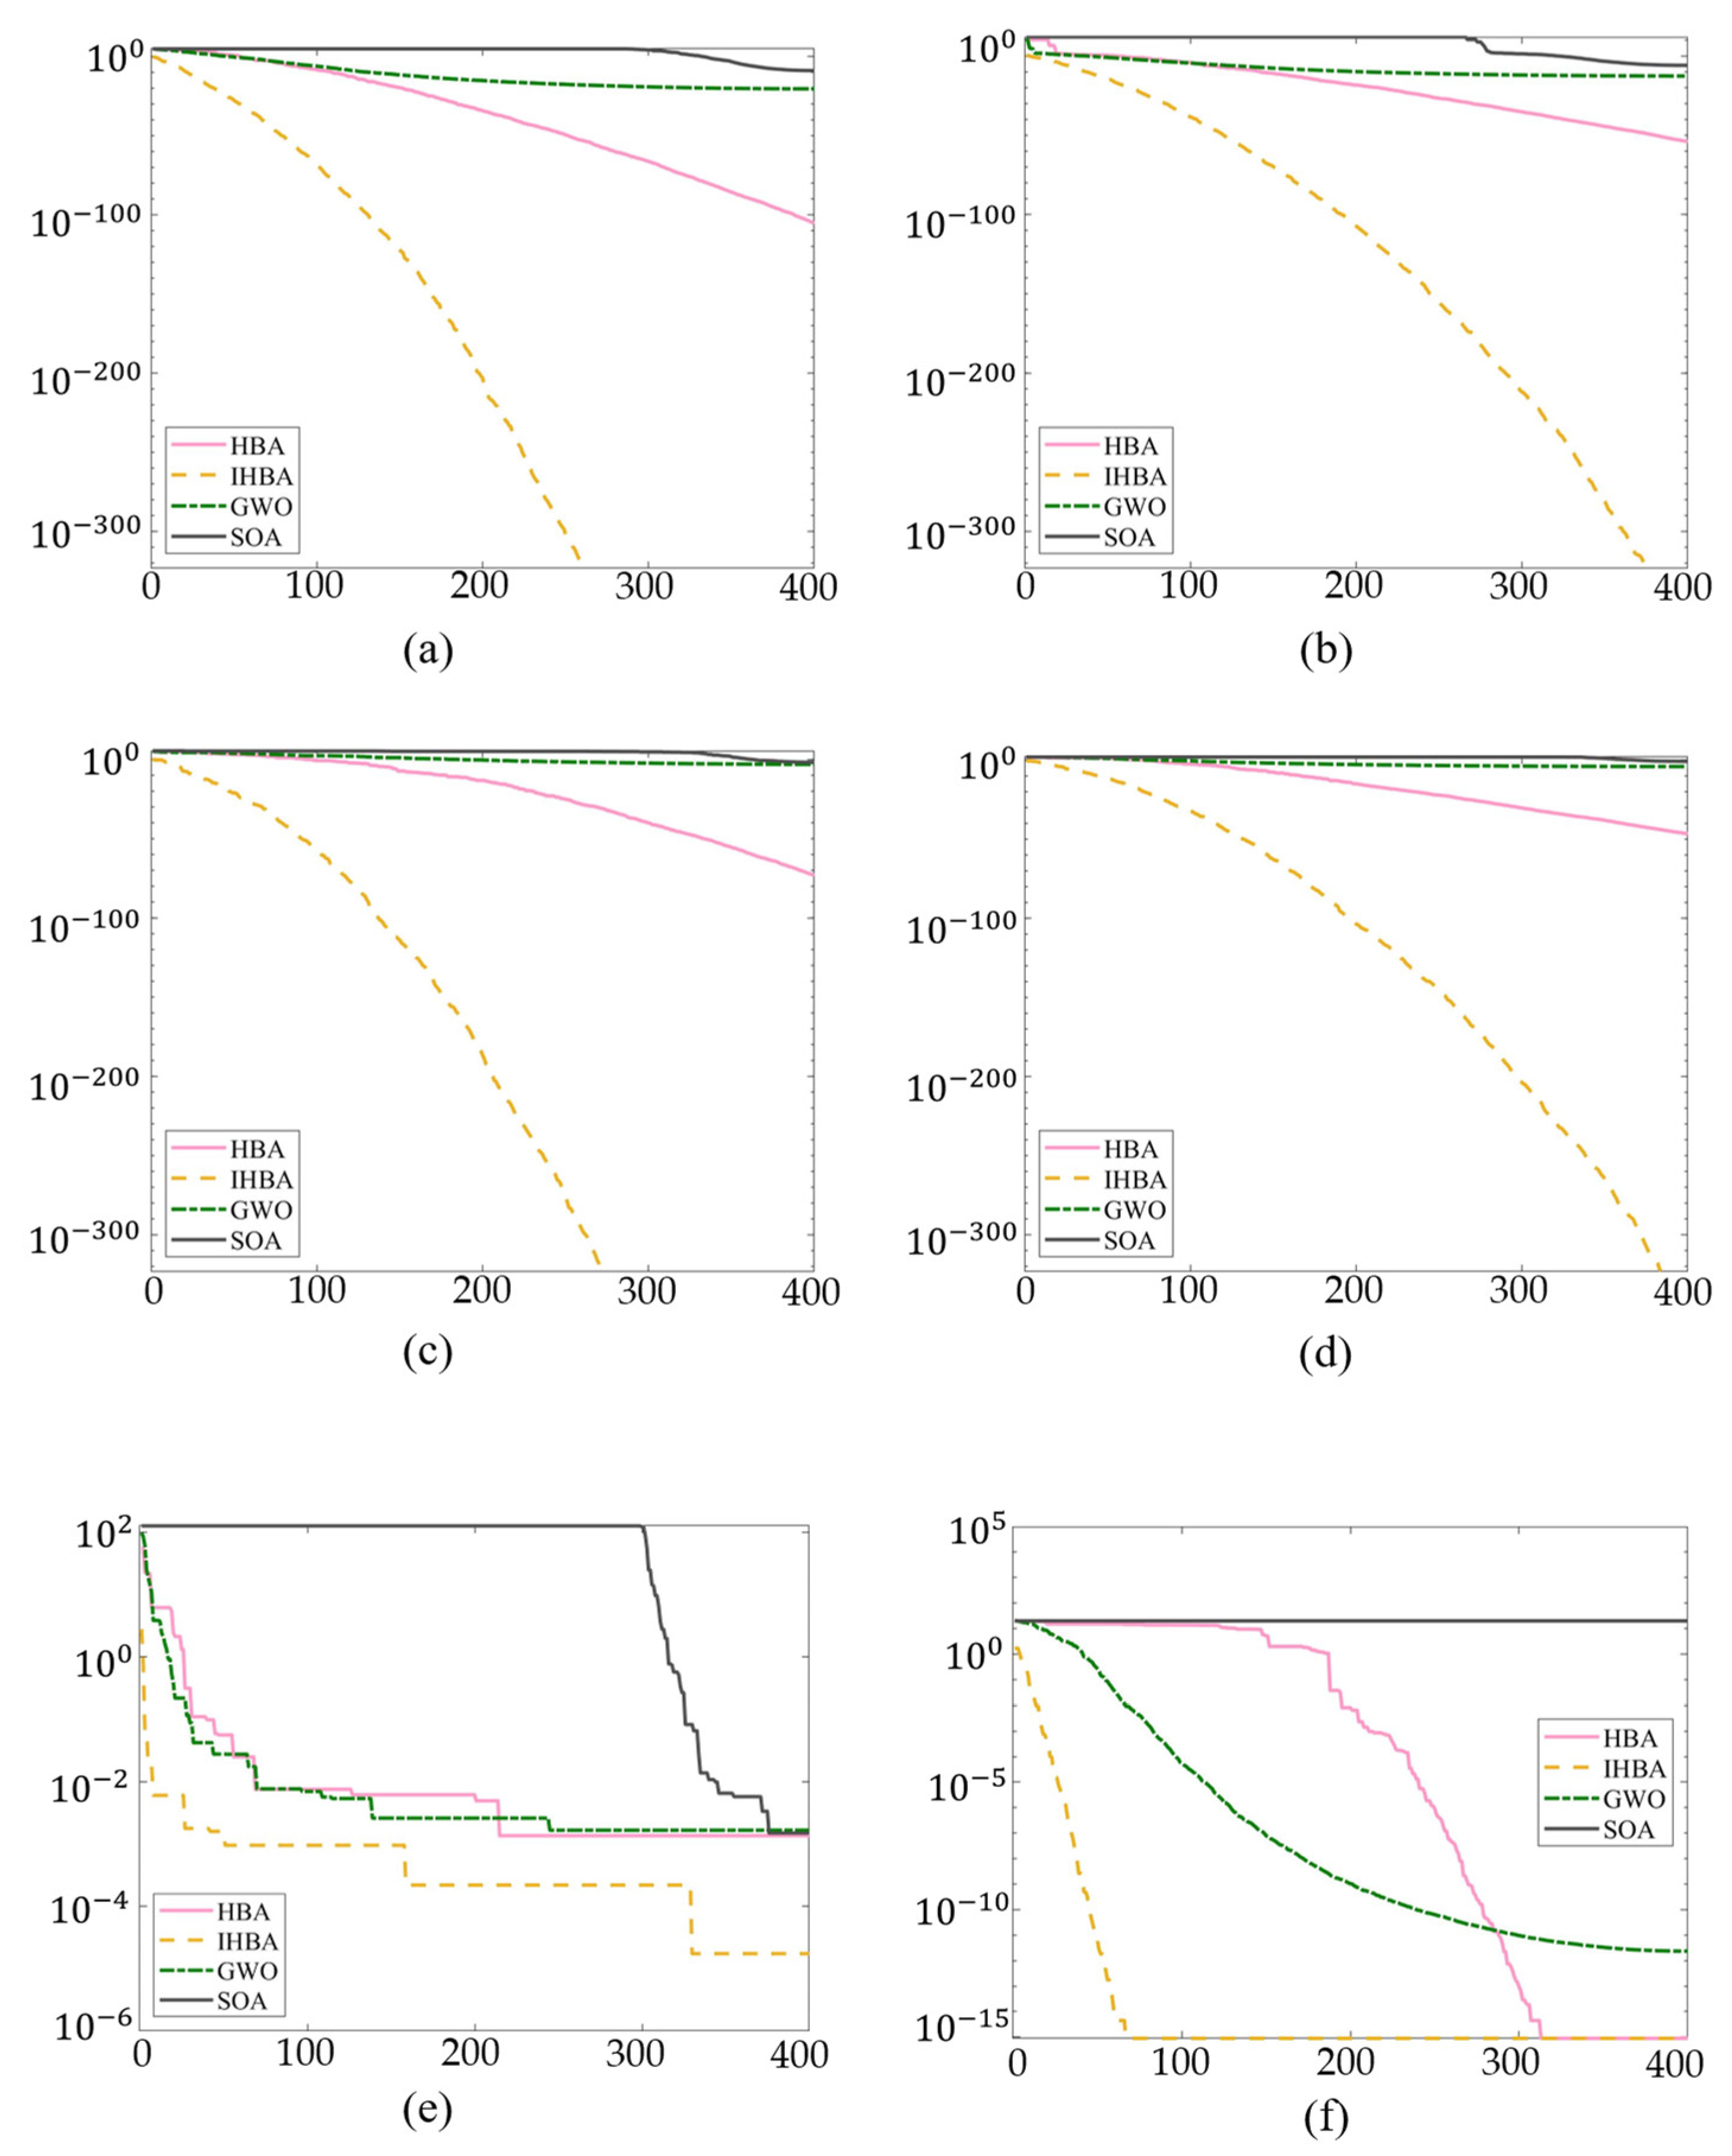
The experiments in this study were conducted on MATLAB R2019a. In order to fully validate the convergence and optimization ability of the IHBA, the HBA, the GWO [52], and the seagull optimization algorithm (SOA) [53] were selected to solve the test functions in Table 2. Each test function was solved 30 times by these algorithms. We set the population size and the dimension of the variable to 30. We set the largest value of iterations to 400. The evaluation metrics of the algorithm are the worst value, the best value, the average value, and the variance. The test results are shown in Table 2. One result of the 30 solutions was taken, as shown in Figure 6.
According to Table 2, the worst, best, and average values of the HBA were better than those of the GWO and SOA for either test function. This proves the correctness of choosing the HBA algorithm. Figure 6 (f) indicates that, although HBA converges more slowly than GWO in solving the test function f 6 ( x ) , the final result is better than that of GWO. In addition, the worst value, best value, average value, and variance of the IHBA are smaller compared to the HBA. This shows that the IHBA has better global searching capability and better stability. This also proves the correctness of the algorithm improvement strategy. Compared with other intelligent algorithms, the IHBA algorithm converges more quickly and yields better results. It can be used to optimize ELM.

3.4.3. The Process and Evaluation Index of IHBA-ELM

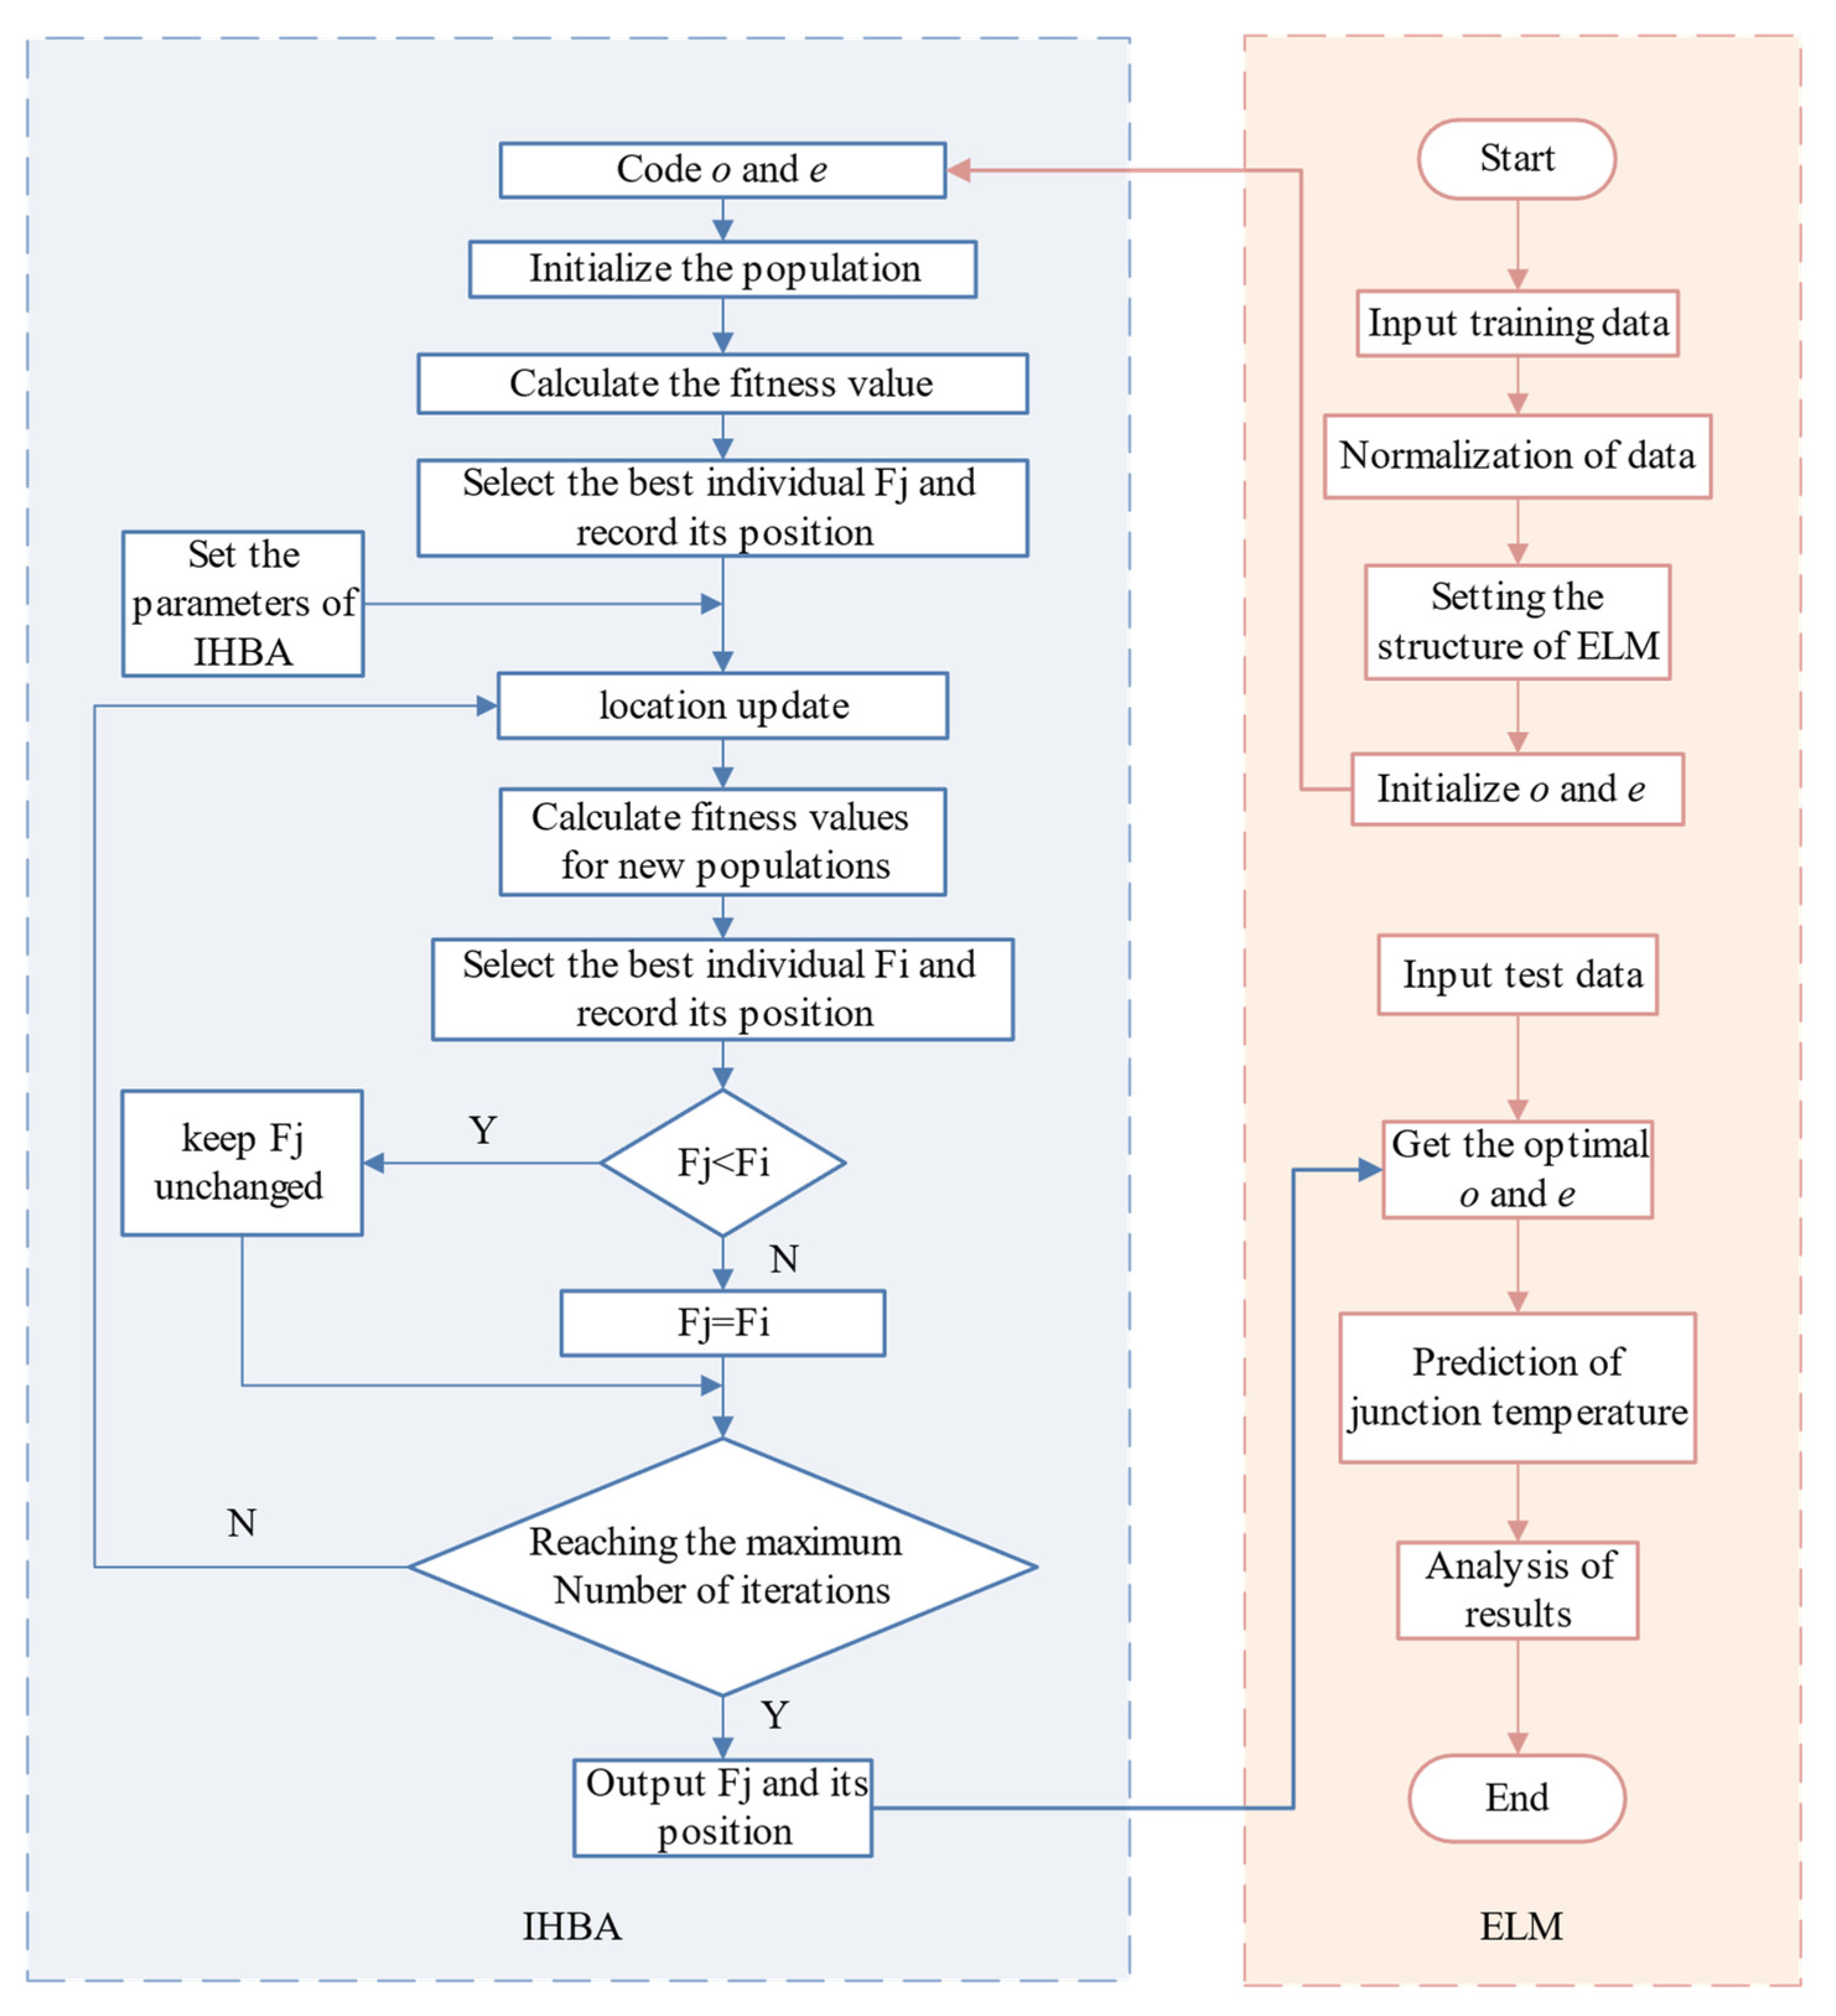
According to Section 3.4.1, each ELM can be uniquely defined by its weight value o , β , and the hidden layer’s threshold e . Since β can be obtained computationally, o and e can determine whether the ELM is good or bad. Therefore, to improve the prediction accuracy of the ELM, the IHBA was used to find the optimal o and e .
IHBA treats o and e as a set of solutions (locations of honey badger populations) to be optimized. The optimal individual ( o and e ) that satisfies the computational accuracy requirement can be obtained by iterating continuously. The prediction model of the junction temperature based on the IHBA-ELM can be obtained by substituting the optimal o and e into the ELM. Figure 7 illustrates the specific process.
Evaluate the efficiency of these models by mean absolute error (MAE), root mean square error (RMSE), and R-square (R2). A smaller MAE indicates that the model has higher accuracy. A smaller RMSE indicates better stability of the model. A smaller difference between R2 and 1 indicates a better correlation between the input and output.
M A E = 1 n i = 1 n | y ^ i y i |
R M S E = 1 n i = 1 n ( y ^ i y i ) 2
R 2 = 1 i = 1 n ( y ^ i y i ) 2 i = 1 n ( y ¯ i y i ) 2

4. Results

To verify the prediction performance, the IHBA-ELM was compared with the ELM model optimized by the HBA (HBA-ELM), the ELM model optimized by the SOA (SOA-ELM), the ELM, and the BPNN. In Section 3, the IGBT junction temperature was obtained by the electro-heat coupling model method. From which, 500 sets of data were randomly picked to test these prediction models. The inputs were wind speed and cabin temperature, and the outputs were the junction temperatures. The order of these 500 sets of data were randomly arranged. The training data are the first 200 sets of them, while the testing data are the last 300 sets of them. We set the learning rate of the BPNN model to 0.1 and the learning target to 0. We set the number of hidden layers of all prediction models to 10, the maximum number of iterations to 100, and the number of populations to 30. To avoid inaccurate results, the experimental environment for all prediction models was MATLAB R2019a, Intel(R) Core (TM) i5-8250U processor, and Windows 10 as the operating system.
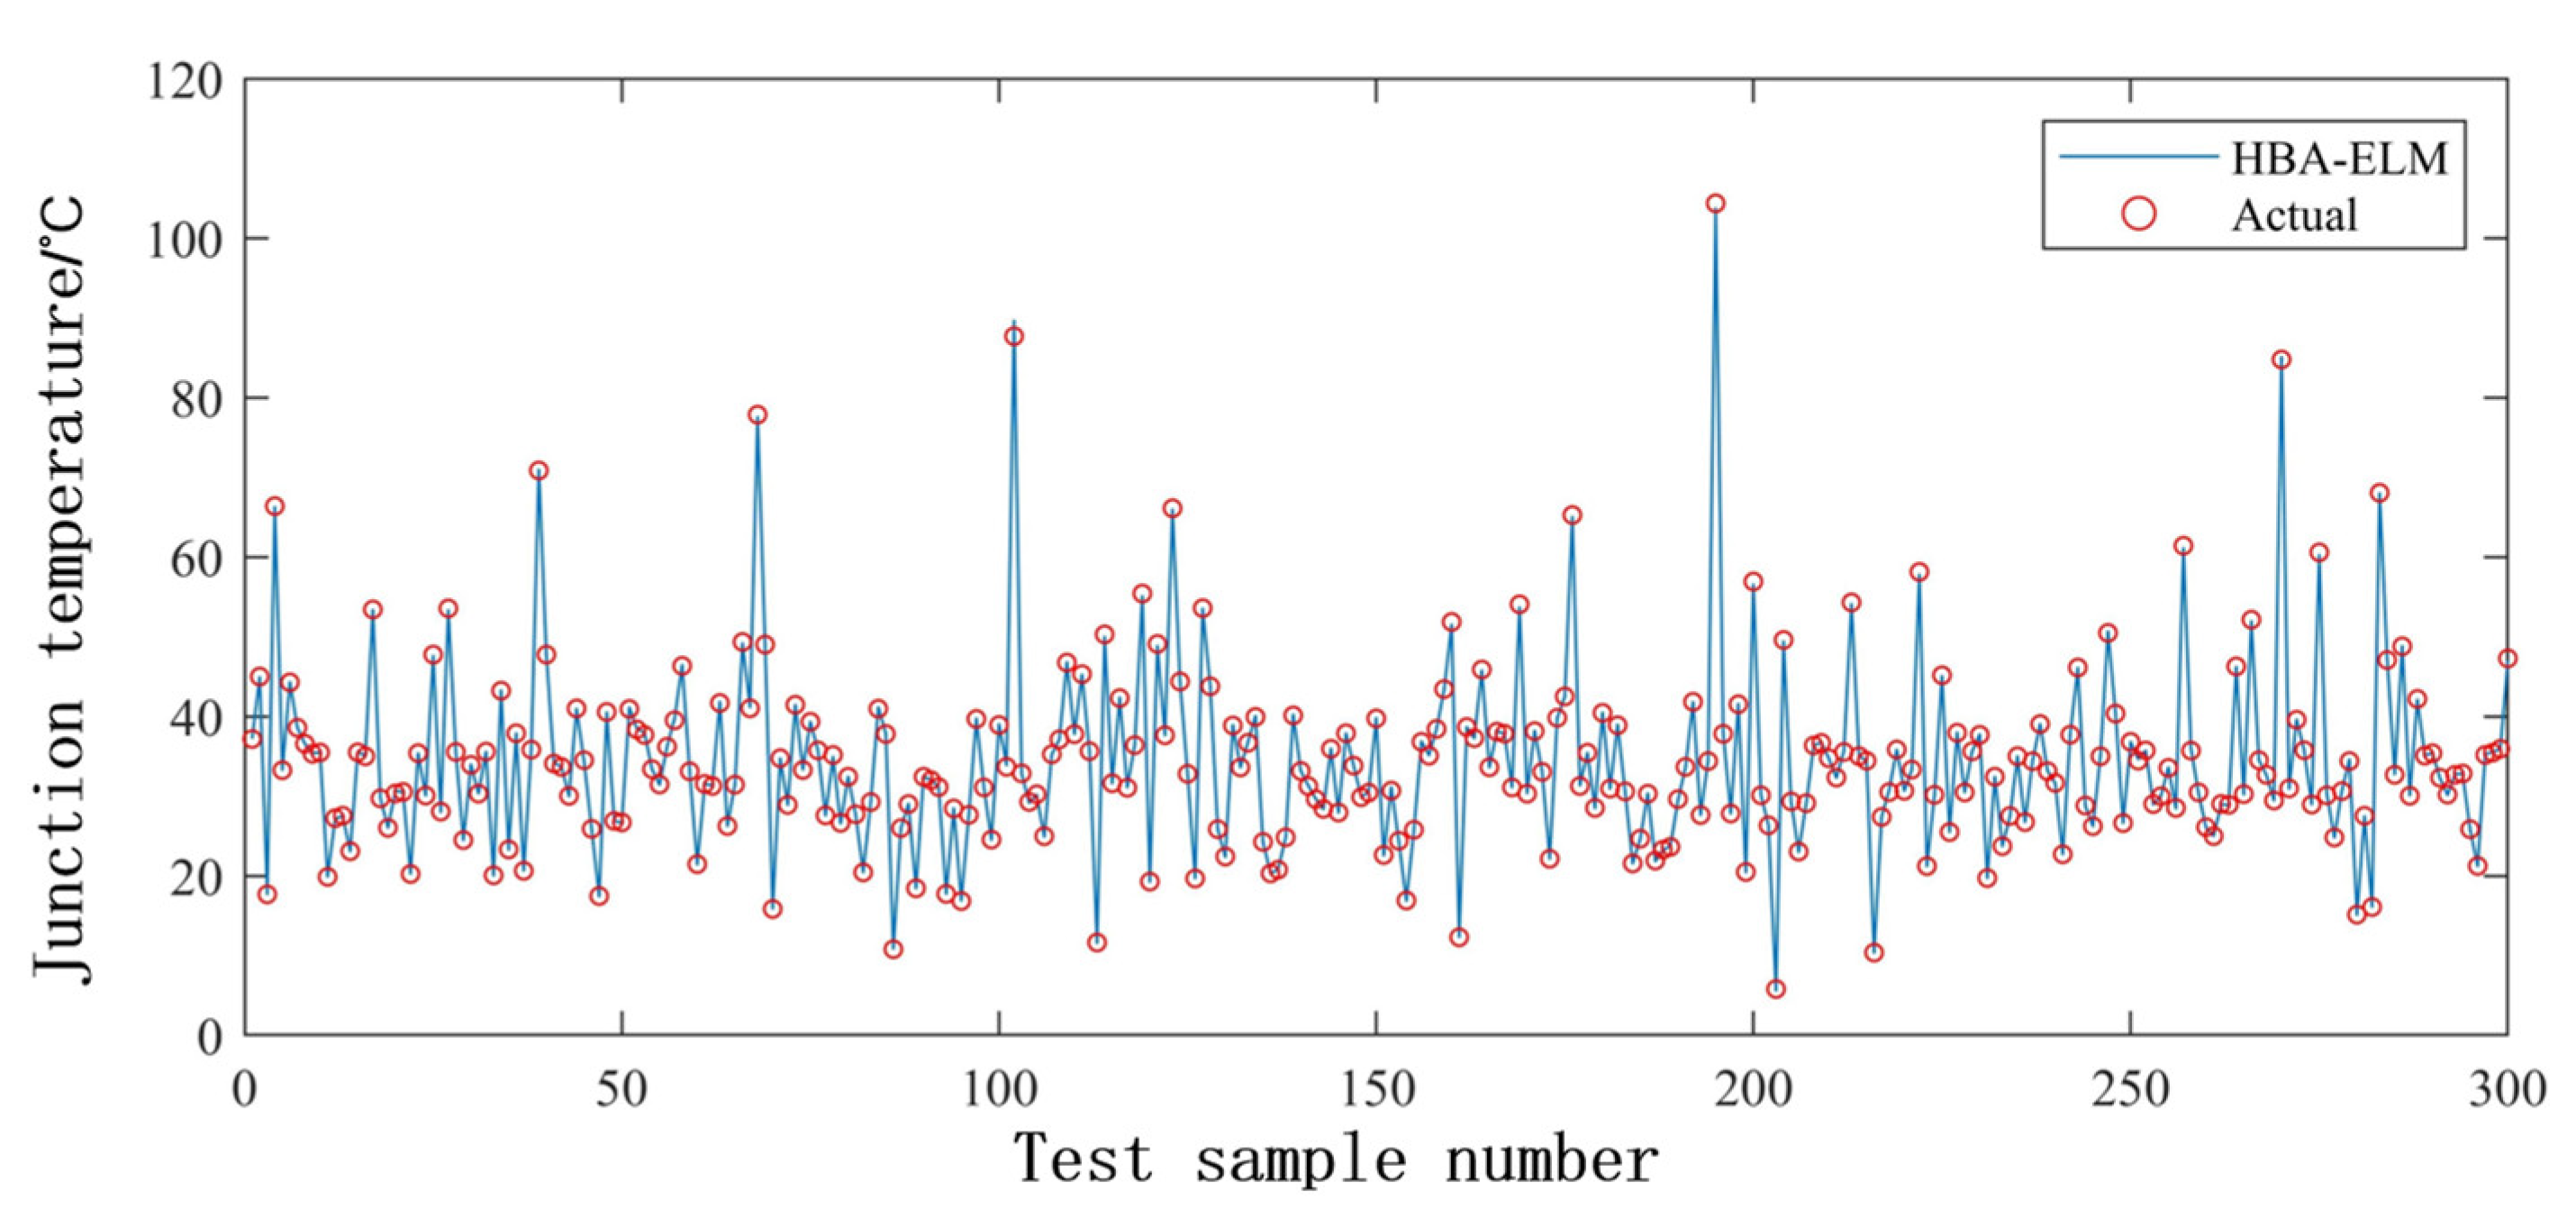
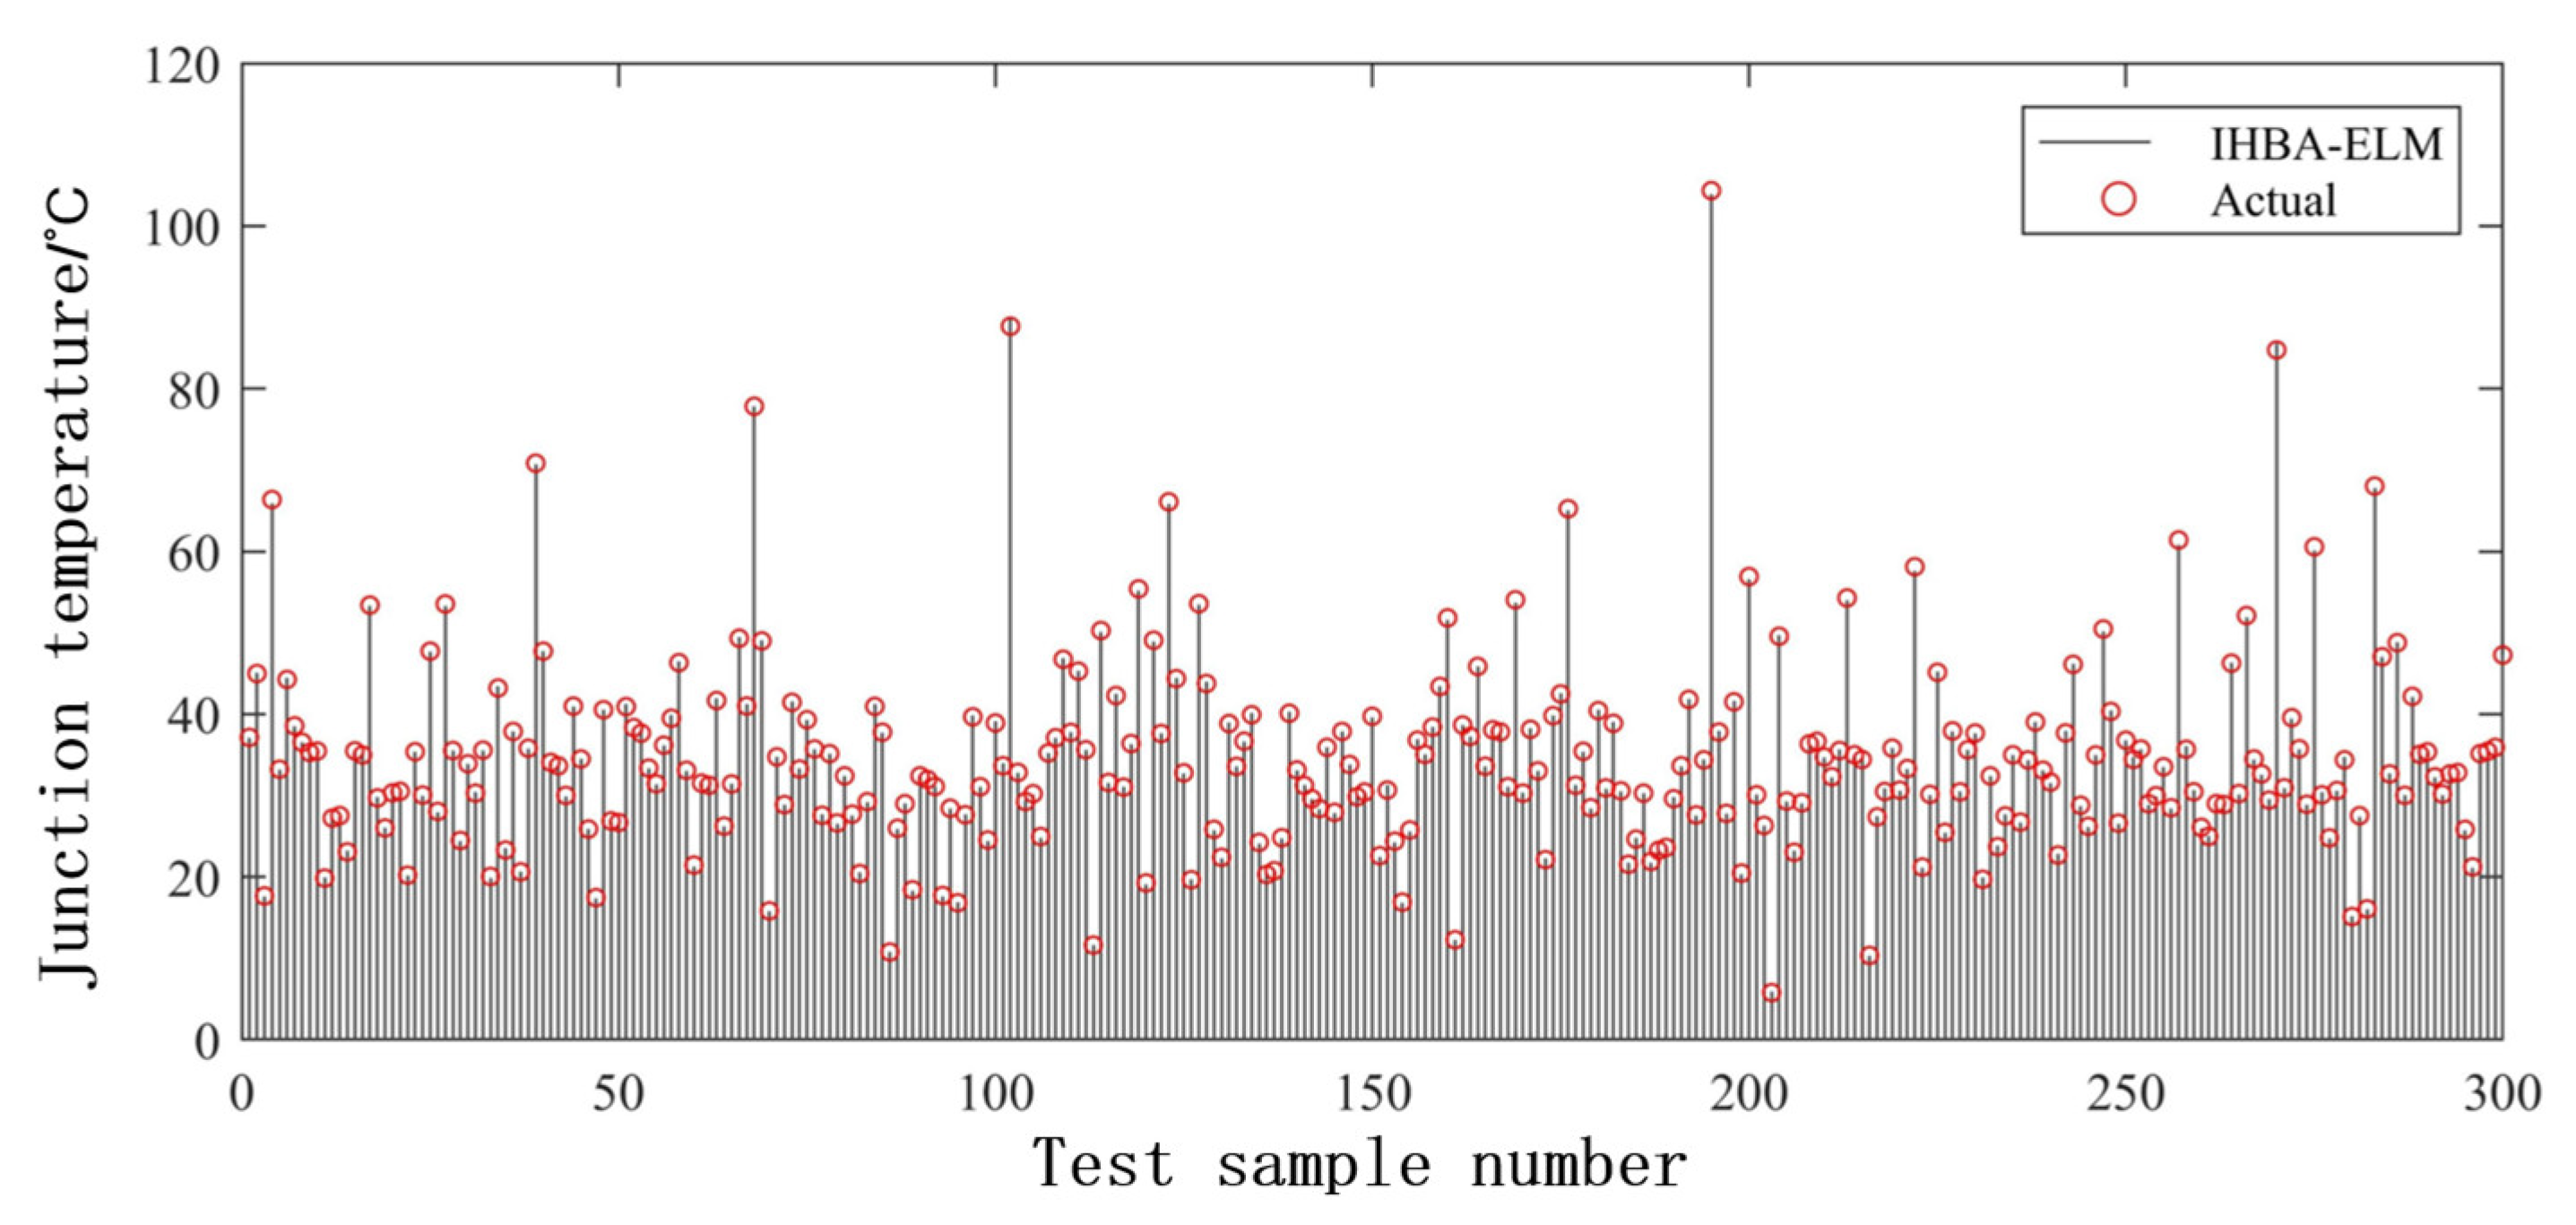
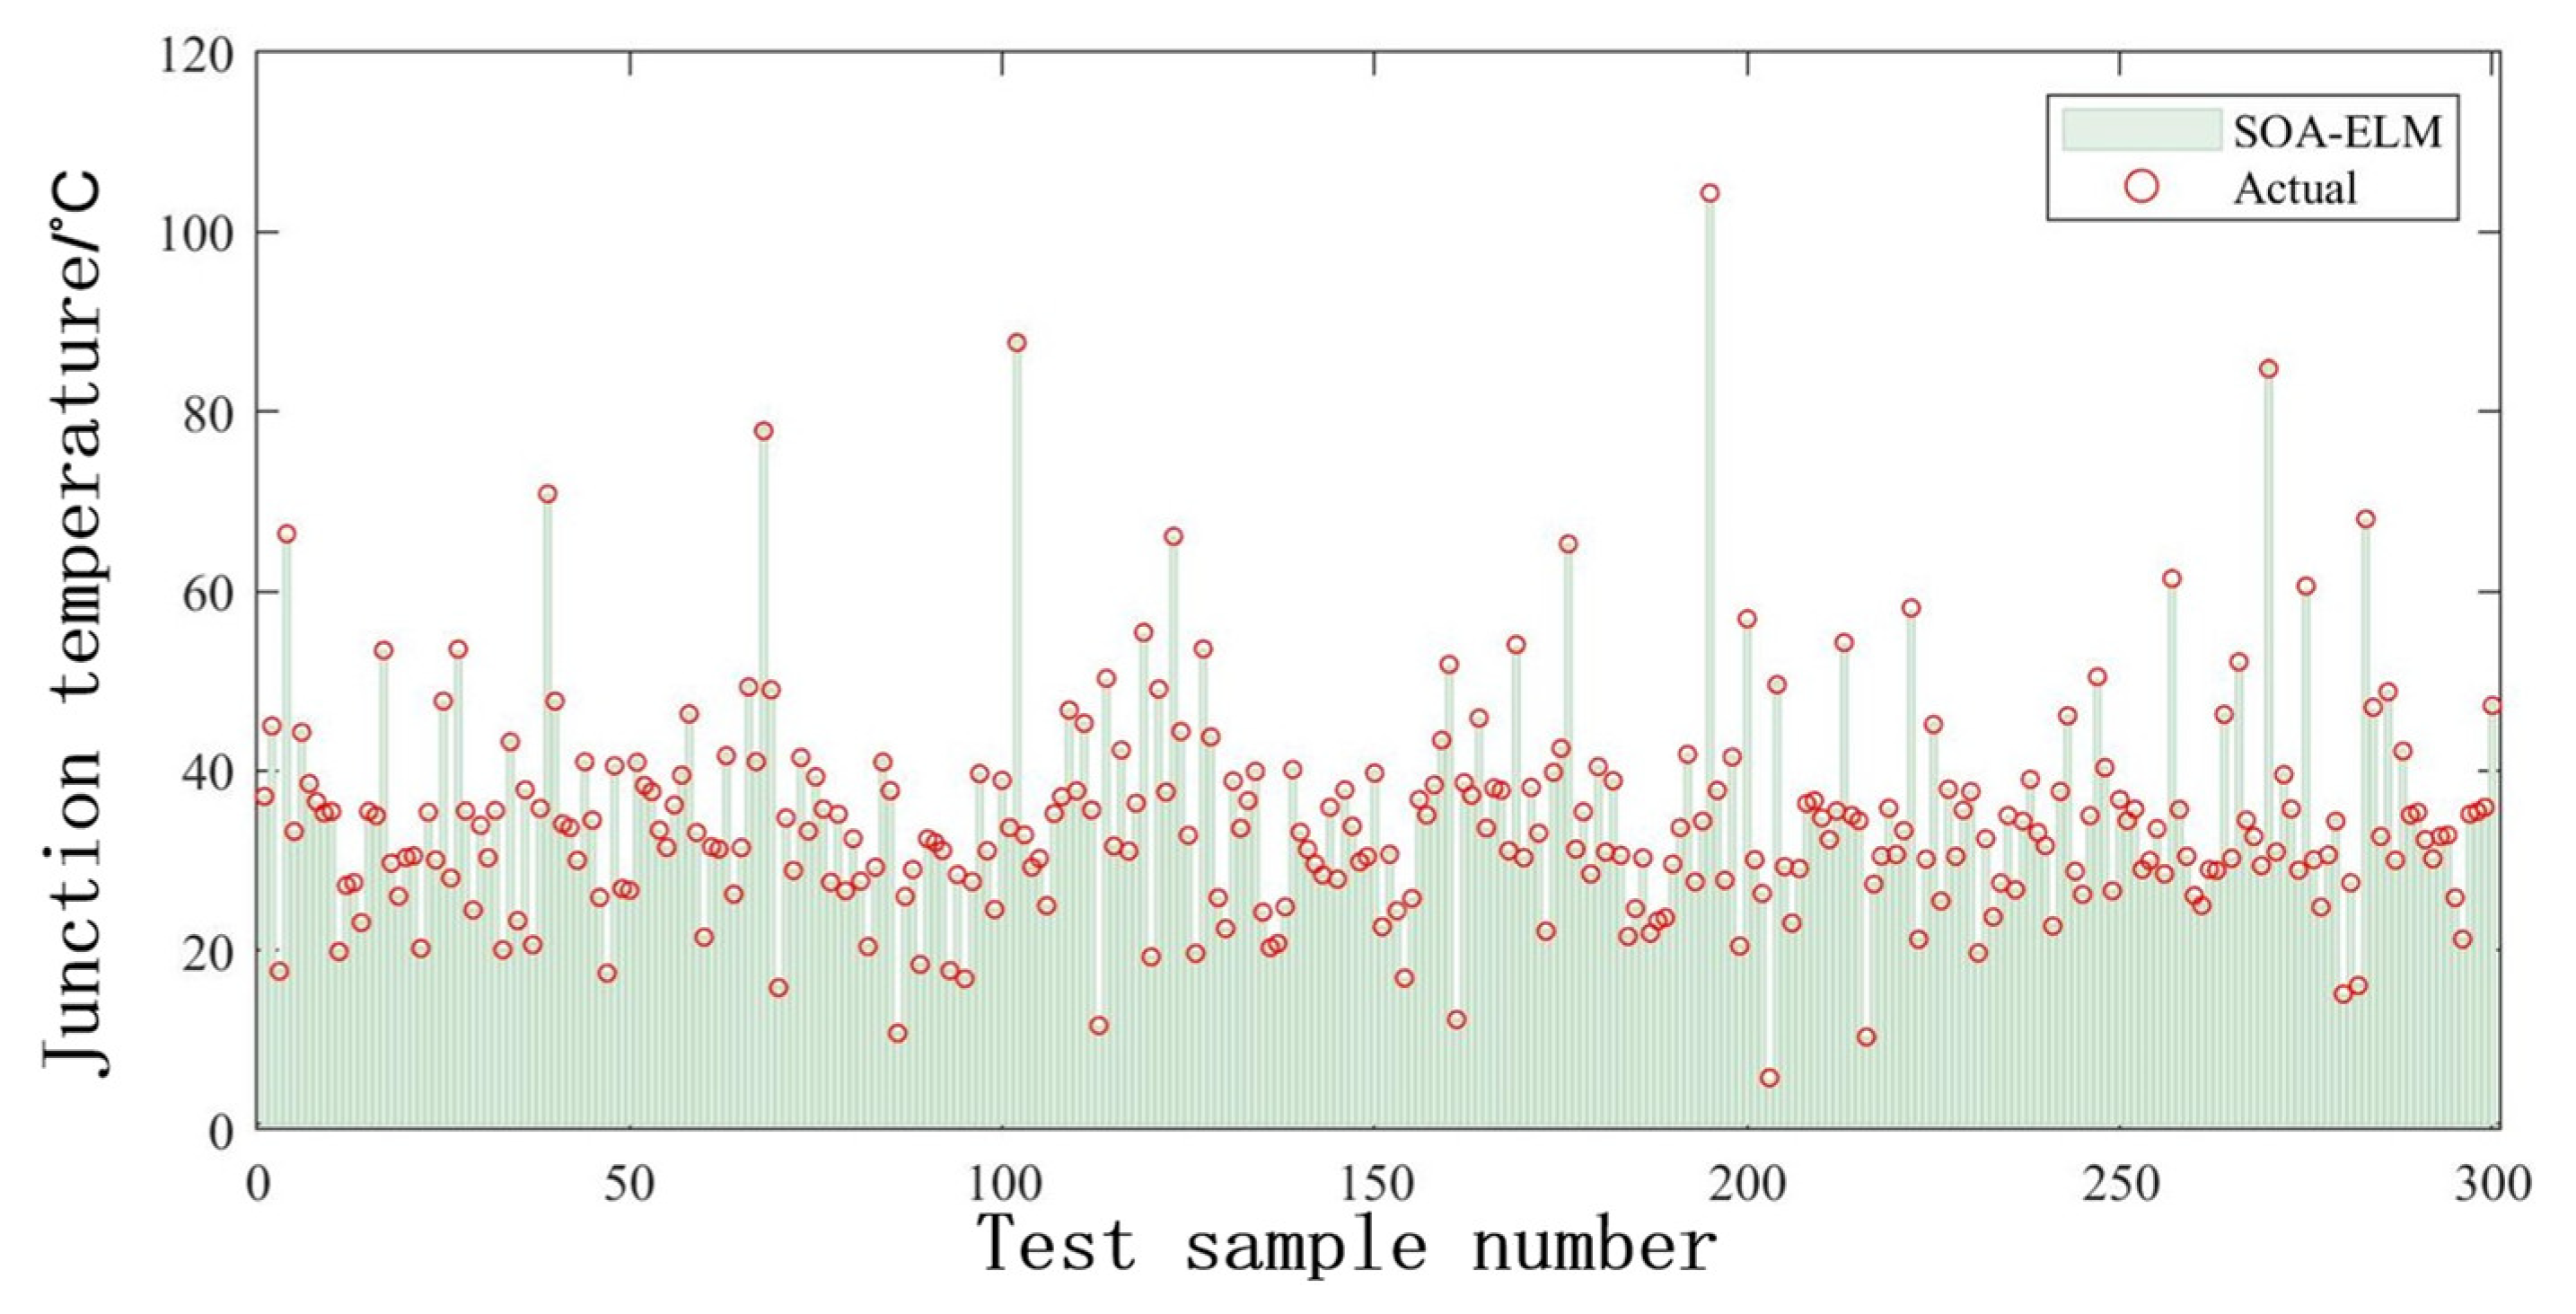
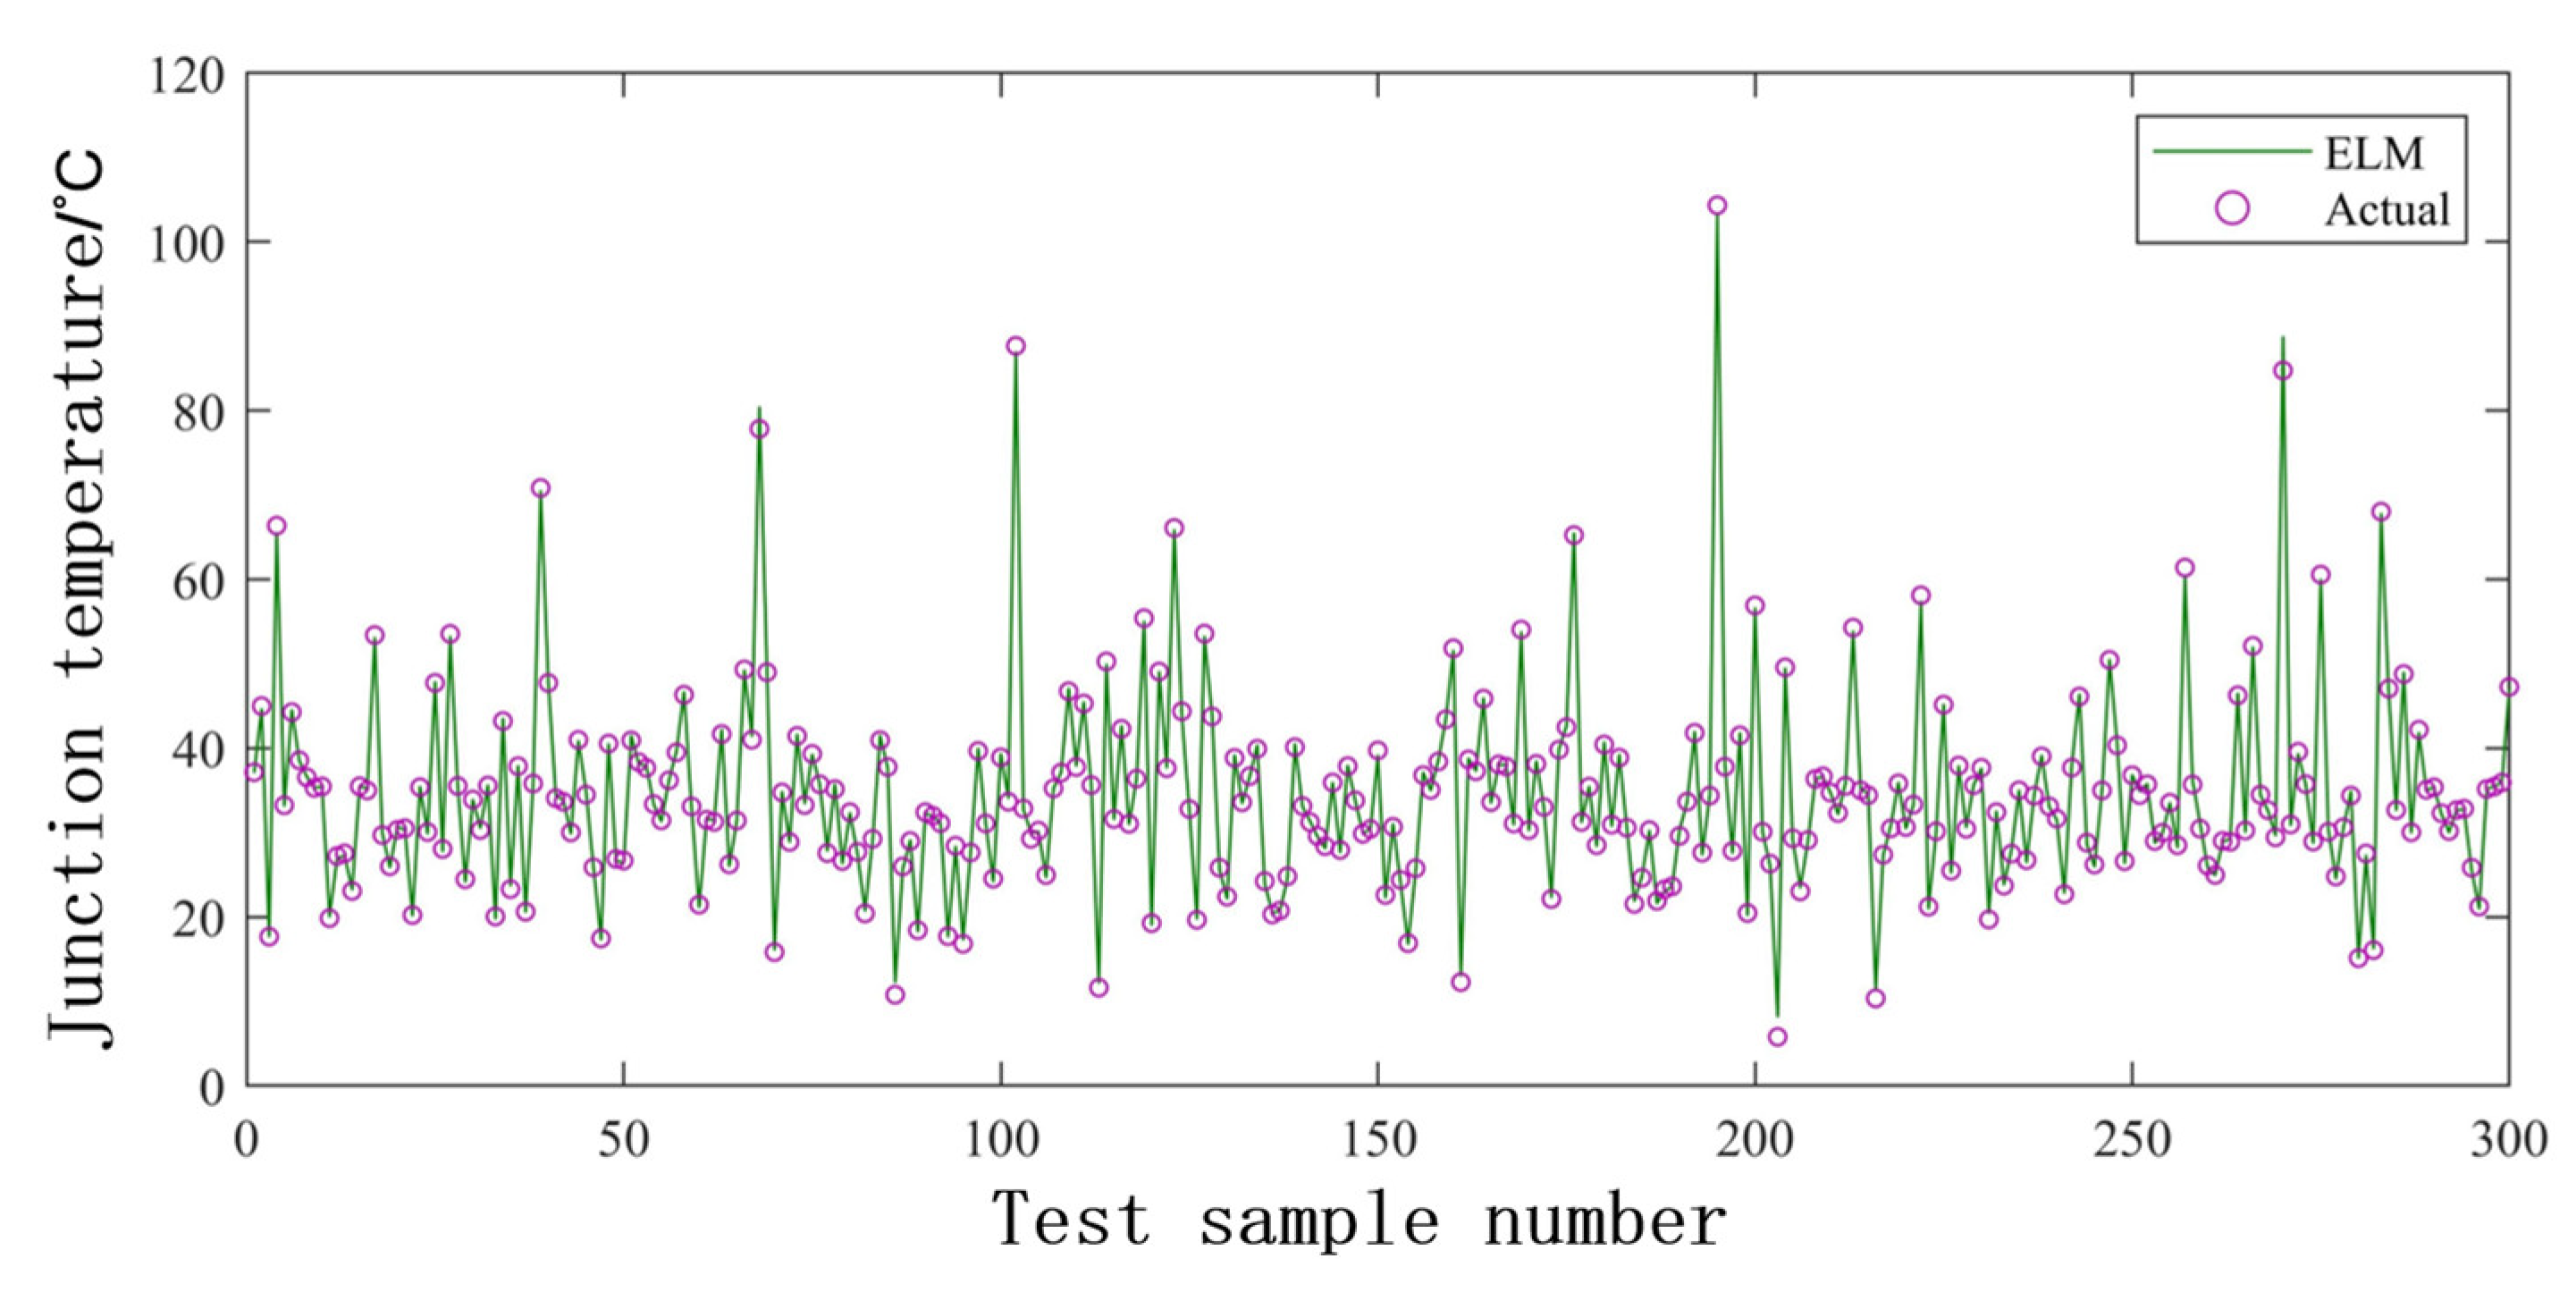
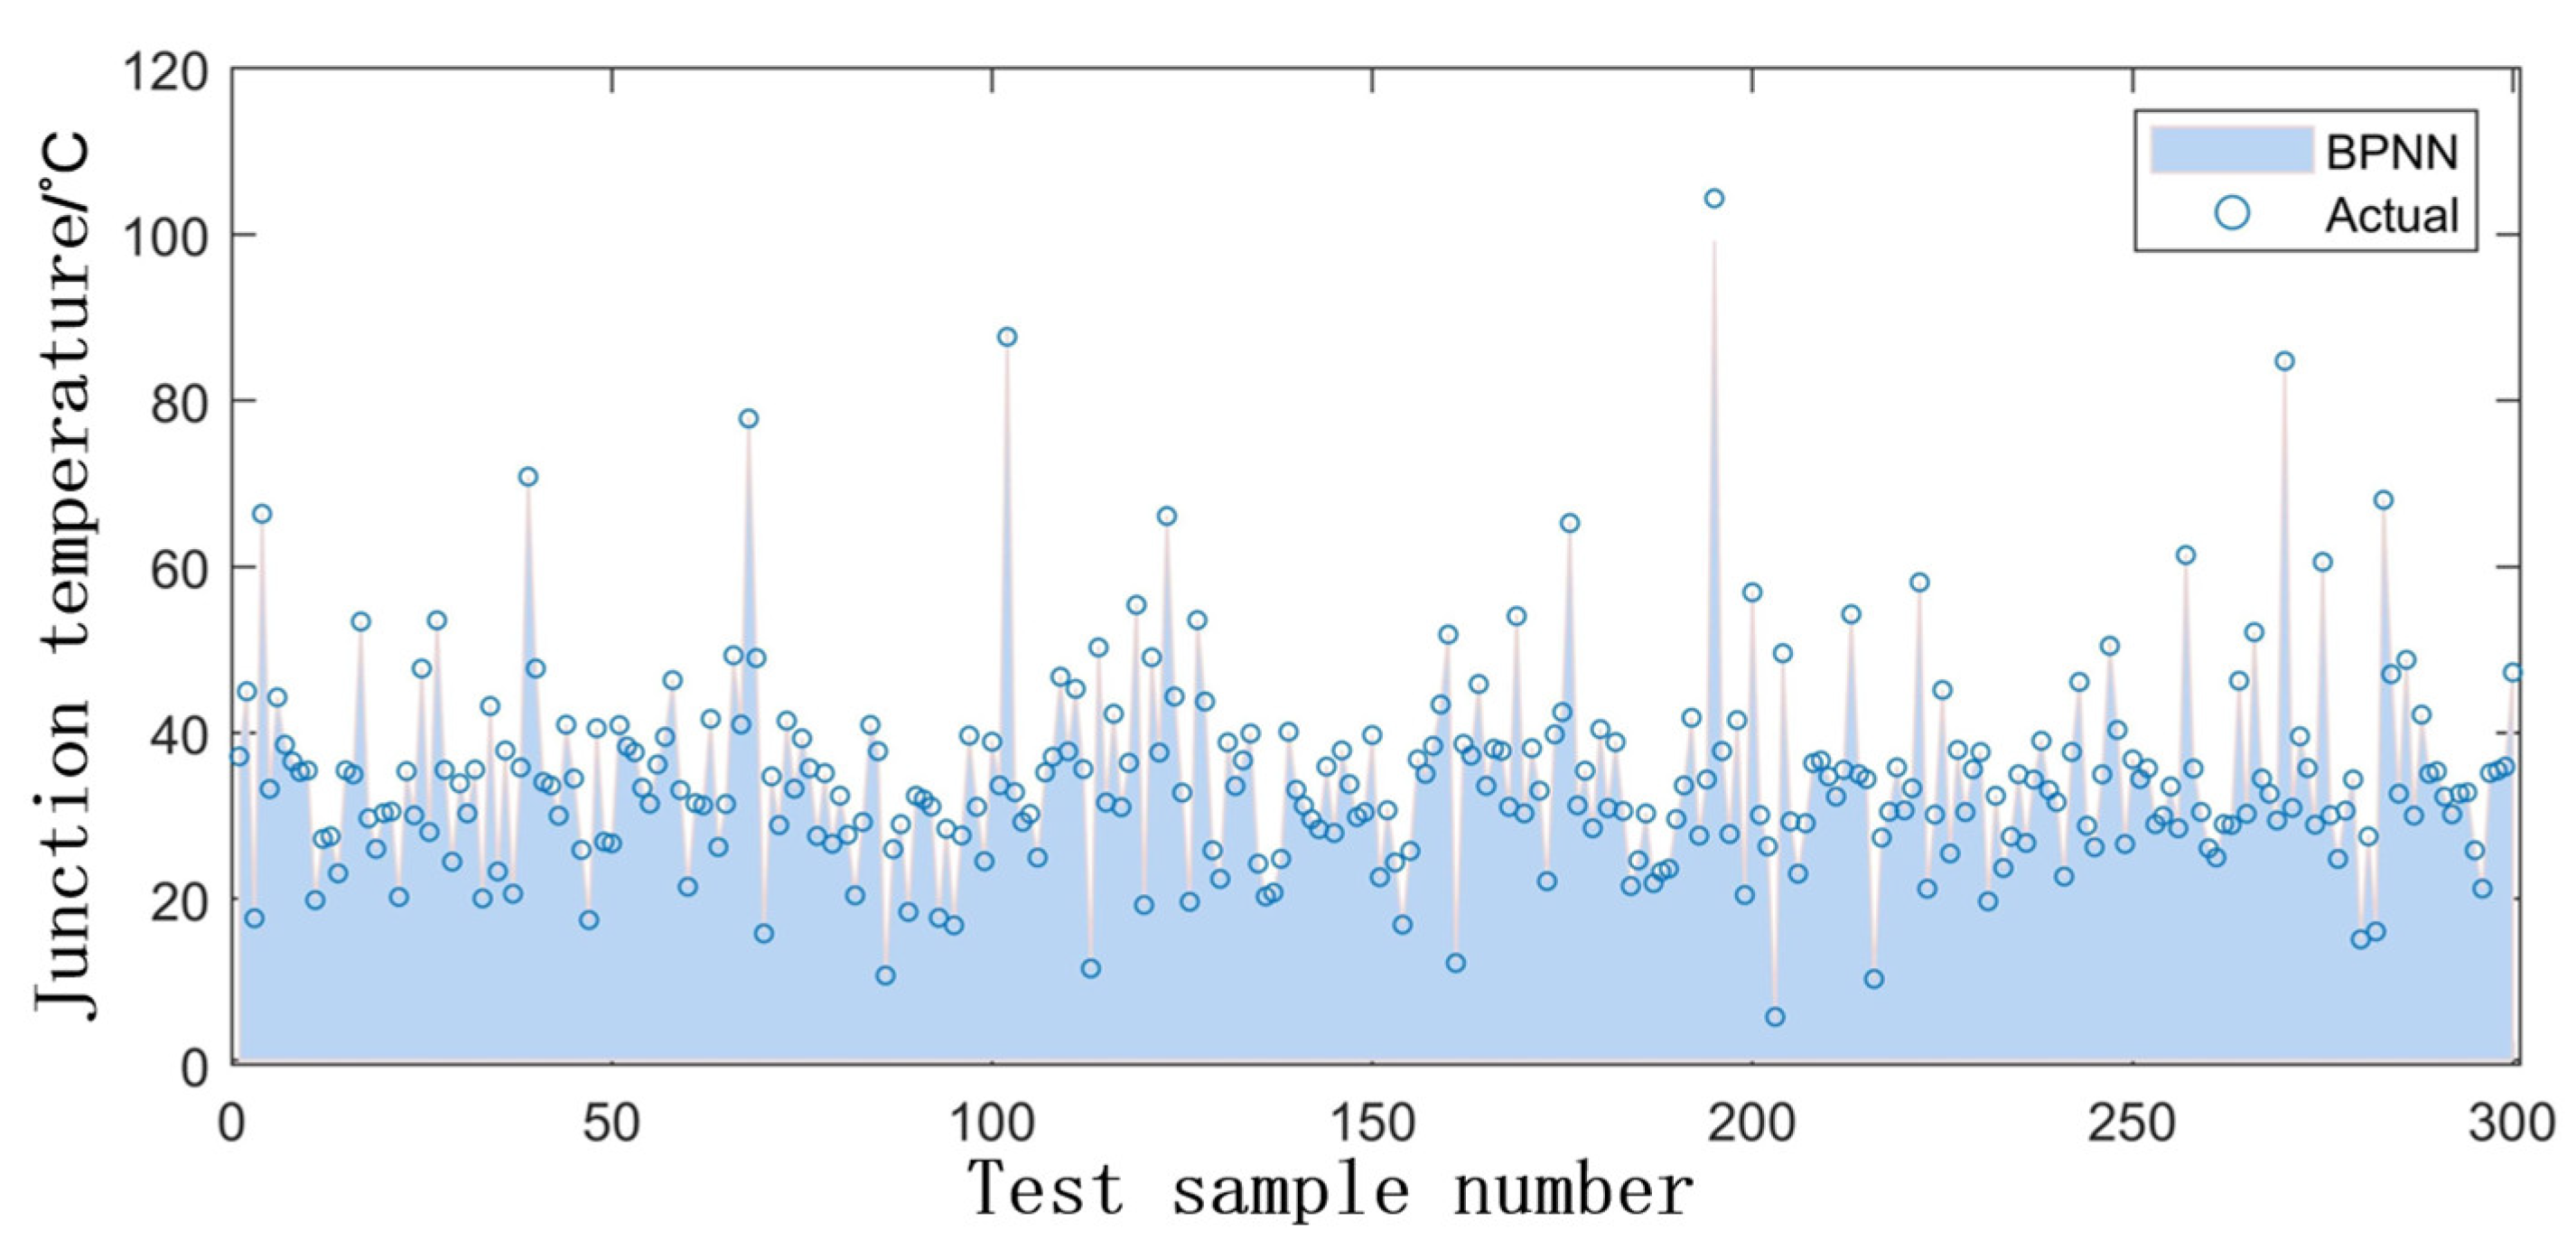
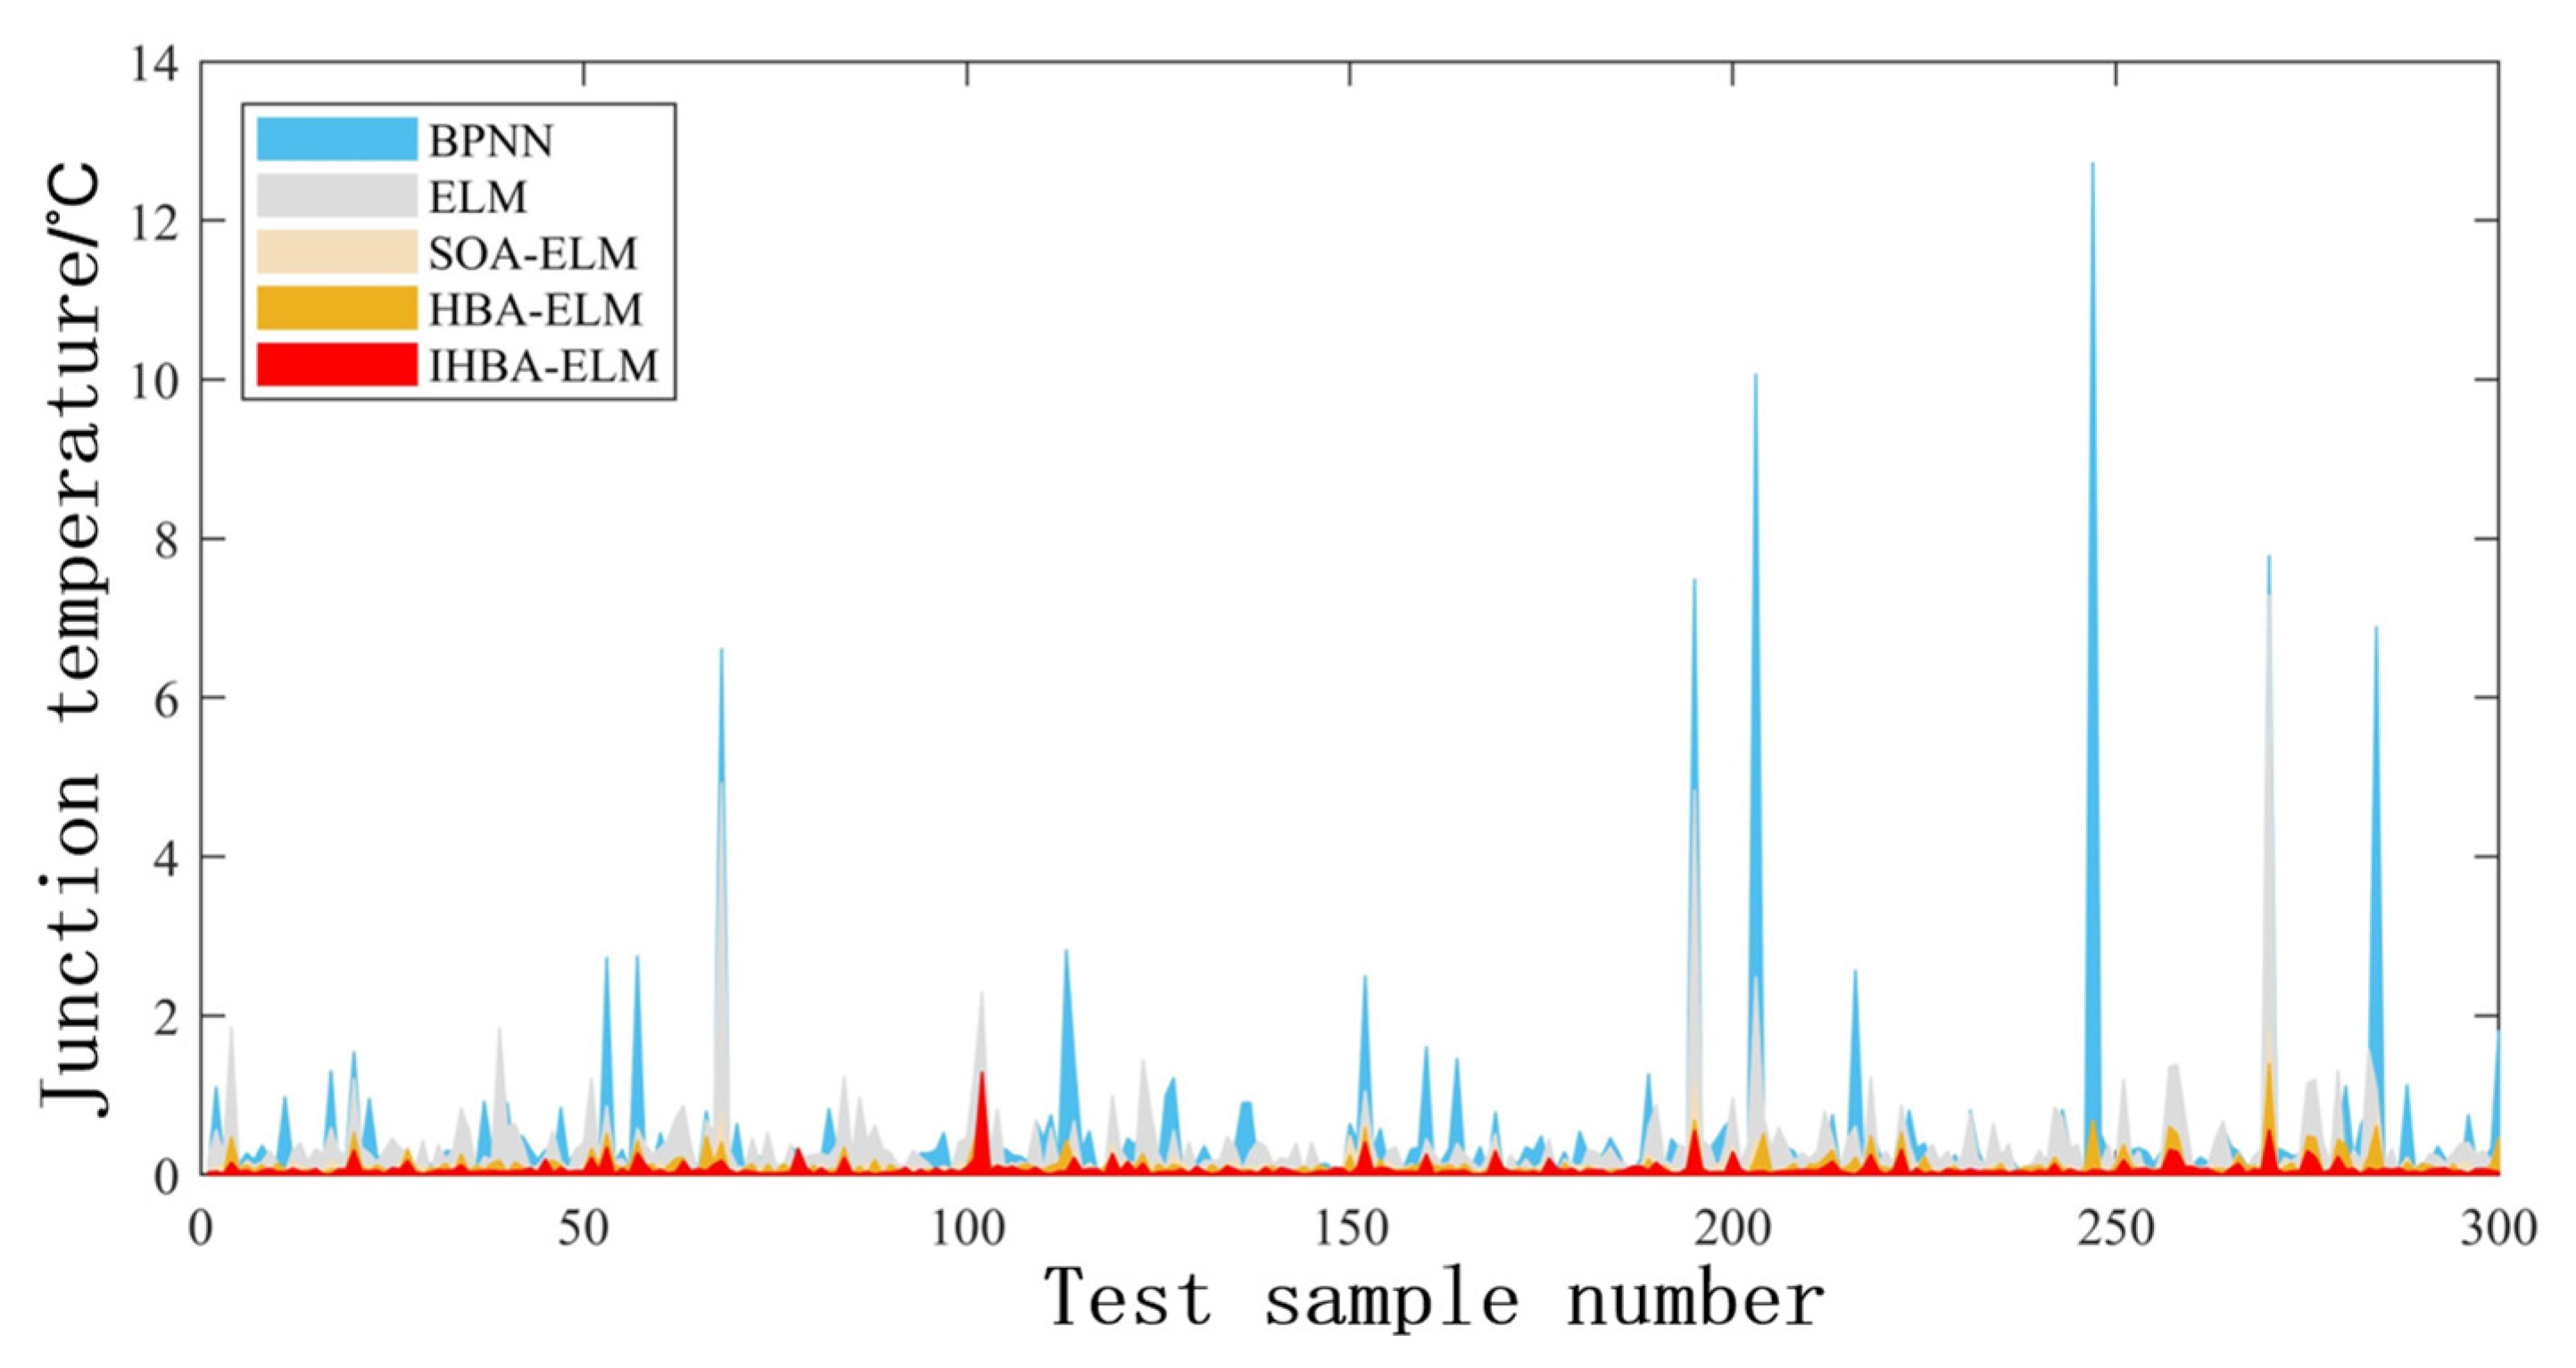
Each prediction model was run 30 times. From the results of the 30 runs, one was randomly selected for analysis. Figure 8, Figure 9, Figure 10, Figure 11, Figure 12 and Figure 13 illustrate the predicted junction temperature and the absolute error.
As can be seen from Figure 8, Figure 9, Figure 10, Figure 11 and Figure 12, all of these models are valid, but the ELM model and the BPNN model have poorer prediction results. Figure 13 shows the absolute error of the predicted junction temperature versus the actual junction temperature for these models. Figure 13 indicates that the prediction errors of the BPNN and ELM models are larger. The maximum prediction error of the BPNN is 12.7 °C. The IHBA-ELM model has the smallest prediction error and the highest prediction accuracy. Table 3 shows the evaluation indicators of each prediction model obtained after 30 runs.
Table 3 explains that the average value of MEA for the IHBA-ELM model is 0.0303 °C, which is 10.62%, 11.14%, 91.67%, and 95.54% lower than that of the HBA-ELM model, SOA-ELM model, ELM model, and BPNN model. This proves that the IHBA-ELM has good predictive performance. The values of these evaluation indicators for both the HBA-ELM model and the SOA-ELM model are close to each other. This indicates that the prediction of junction temperature by both of them is not very different. They are both inferior to the IHBA-ELM model. The mean value of the MEA of the ELM model is 0.3637 °C, which is a poor result. The RMSE and R2 of the ELM model are also worse than those of the IHBA-ELM, HBA-ELM, and SOA-ELM models, which proves the necessity of optimizing the ELM model. The mean value of the MEA of the BPNN model is 0.6791 °C, which is the worst among all of the prediction models. It also has a larger RMSE, indicating poor stability. The performance of the BPNN model is inferior to that of the ELM model, which proves the rationality of choosing the ELM model.

5. Discussion

5.1. Junction Temperature Acquisition

In this study, the junction temperature was obtained using the electro-heat coupling model method. This method is effective. The reasons are as follows:
(1)
Due to the thermal resistance, the energy loss of the IGBT power module can be converted into heat. If it cannot be dissipated in time, the heat will accumulate, which leads to an increase in junction temperature. Since the electro-heat coupling model is based on the principle of heat generation, the junction temperature obtained by this method is accurate.
(2)
This method has been used in the literature [30,31,32,44] to calculate the IGBT junction temperature.
(3)
In Section 3, the accuracy of this method has been verified by simulation methods. PLECS is a professional system-level power electronic circuit simulation software. Therefore, the simulation circuit was built on PLECS, and the junction temperature of the IGBT was obtained by two methods. One method was to calculate the junction temperature using the electro-heat coupling model method, and the other was to measure the junction temperature directly, using the thermal simulation function of the software. The acquired junction temperature was imported to the oscilloscope. Then, the waveform can be obtained as shown in Figure 3. According to Figure 3, it can be seen that the fluctuations of the junction temperature obtained by these two methods are almost equal. This indicates that the calculation of the junction temperature by the electro-heat coupled model method is accurate.
The electro-heat coupling model method also has some limitations. This model is computationally efficient, but slightly less accurate. This model is computationally efficient. However, the accuracy of this model is slightly lower because factors, such as gate resistance and coupling effects between multiple chips, are not considered. In future research, the above factors can be taken into account to improve the accuracy of the model if there is a requirement for computational accuracy. If real data are available, it is better to train the model with real data.

5.2. Improved Honey Badger Algorithm—Extreme Learning Machine

The IHBA-ELM model proposed in this study can be used for junction temperature prediction of IGBTs in wind power converters. The reasons are as follows:
(1)
In this study, the initialization strategy and iteration strategy of the HBA were improved with the cubic chaotic mapping, the wave state adaptive weights, and the Gaussian variance function, and the IHBA was obtained. The HBA, IHBA, GWO, and SOA were compared using six test functions, as shown in Table 1. The results prove that the IHBA has higher convergence accuracy and faster convergence speed.
(2)
The algorithm used for the BPNN is the gradient descent (GD) method, which requires several iterations and a long training time. Furthermore, the BPNN can easily fall into the local minimum, resulting in poor convergence accuracy. Compared with the BPNN, the ELM randomly generates the weight value joining the input layer to the hidden layer and the threshold of the hidden layer during the iteration, which does not need to be adjusted during the training process. Therefore, the ELM has faster convergence and better generalization ability than the BPNN. It has been proved that the MEA of ELM is lower than that of BPNN in this study. Therefore, ELM is more suitable for junction temperature prediction. In addition, good results have been achieved using artificial intelligence algorithms to optimize the ELM. The SOA-ELM, HBA-ELM, and IHBA-ELM all have lower MEA and RMSE than the ELM. This is because the artificial intelligence algorithm can find the best weights and thresholds, thus improving the accuracy of the ELM. The design principles of different artificial intelligence algorithms are different, and their search performance and computational efficiency also vary. However, there is no absolute superiority or inferiority between different intelligent algorithms. Each type of problem has its own best suited artificial intelligence algorithm. By comparing several models, it can be found that the IHBA-ELM model used in this study has higher accuracy in predicting the junction temperature of IGBTs in wind power systems.
(3)
Based on the IHBA-ELM, the junction temperature of the IGBT can be obtained by inputting the wind speed and the cabin temperature of the generator. Both wind speed and temperature can be easily measured. Therefore, the proposed method was easy to apply.
The IHBA-ELM model proposed in this study also has limitations. This study trained this model with the calculated junction temperature. It would be more accurate if trained with real data.

6. Conclusions

Based on a new junction temperature prediction method, this study fills the gap from solving the junction temperature prediction problem of IGBTs in wind power converters. In order to ensure the stable operation of wind power systems and to achieve the goal of carbon neutrality, it is necessary to improve the reliability of IGBTs. Accurate junction temperature prediction is important to improve the reliability of IGBTs. Therefore, a junction temperature prediction model based on the IHBA-ELM was proposed in this study. First, the junction temperature of the IGBT was obtained based on the electro-heat coupling model method, and a simulation model was built to verify the accuracy of this method. Second, the IHBA was obtained based on the HBA and various optimization strategies. The performance of the IHBA was verified using test functions. Finally, a junction temperature prediction model based on the IHBA-ELM was proposed. By comparing with the HBA-ELM, SOA-ELM, ELM, and BPNN, it is demonstrated that the IHBA-ELM can be used for the junction temperature prediction of wind power converters. The contributions are as follows:
(1)
A junction temperature prediction model based on the IHBA-ELM was proposed. The model can effectively predict the junction temperature of IGBTs in wind power converters and ensure the stable operation of wind power systems.
(2)
Based on the proposed model, the junction temperature of the IGBT can be obtained by inputting the wind speed and the cabin temperature of the generator. The wind speed and the cabin temperature of the generator are easy to measure, and no additional sensors are needed.
(3)
Compared with other prediction models, the model proposed in this study is more suitable for junction temperature prediction of IGBTs in wind power systems.
(4)
The proposed IHBA-ELM model is not only suitable for junction temperature prediction of IGBTs in wind power systems, but also can provide reference for prediction in other fields.
Although the IHBA-ELM model is effective in predicting the junction temperature of IGBTs, there are some limitations. When obtaining the original junction temperature data, a simple electro-heat coupling model was chosen to improve computational efficiency. This model does not take too much into account the effect of other factors on the junction temperature. In future research, the impact of gate resistance, thermal coupling between multiple chips, and material aging on the junction temperature will be considered to improve the accuracy of the proposed junction temperature prediction model. Furthermore, if real data are available in the future, these will be used to verify the accuracy of the proposed model.

Author Contributions

Conceptualization, C.Z., B.G. and L.L.; Data curation, B.G. and H.Y.; Formal analysis, C.Z., X.Z. and J.L.; Methodology, C.Z., J.L. and L.L.; Software, C.Z., H.Y. and X.Z.; Writing — original draft, C.Z., B.G., H.Y., X.Z., J.L. and L.L.; Writing — review & editing, B.G., H.Y. and L.L. All authors have read and agreed to the published version of the manuscript.

Funding

This work was supported by the key project of the Tianjin Natural Science Foundation [Project No. 19JCZDJC32100] and the Natural Science Foundation of Hebei Province of China [Project No. E2018202282].

Data Availability Statement

Restrictions apply to the availability of this data. Data was obtained from the State Grid Hengshui Electric Power Supply Company and is available from the authors with the permission of the State Grid Hengshui Electric Power Supply Company.

Conflicts of Interest

The authors declare no conflict of interest.

References

  1. Shah, S.A.A.; Sayyad, M.H.; Khan, K.; Guo, K.; Shen, F.; Sun, J.; Tareen, A.K.; Gong, Y.; Guo, Z. Progress towards High-Efficiency and Stable Tin-Based Perovskite Solar Cells. Energies 2020, 13, 5092. [Google Scholar] [CrossRef]
  2. Lotfi, M.; Javadi, M.; Osorio, G.J.; Monteiro, C.; Catalao, J.P.S. A Novel Ensemble Algorithm for Solar Power Forecasting Based on Kernel Density Estimation. Energies 2020, 13, 216. [Google Scholar] [CrossRef] [Green Version]
  3. Zhou, F.; Tu, X.; Wang, Q. Research on offshore wind power system based on Internet of Things technology. Int. J. Low-Carbon Technol. 2022, 17, 645–650. [Google Scholar] [CrossRef]
  4. Rasool, S.; Muttaqi, K.M.; Sutanto, D.; Hemer, M. Quantifying the reduction in power variability of co-located offshore wind-wave farms. Renew. Energy 2021, 185, 1018–1033. [Google Scholar] [CrossRef]
  5. Jiang, Y.; Liu, S.; Zao, P.; Yu, Y.; Zou, L.; Liu, L.; Li, J. Experimental evaluation of a tree-shaped quad-rotor wind turbine on power output controllability and survival shutdown capability. Appl. Energy 2022, 309, 118350. [Google Scholar] [CrossRef]
  6. Wang, Z.; Hu, G.; Zhang, D.; Kim, B.; Xu, F.; Xiao, Y. Aerodynamic Characteristics of a Square Cylinder with Vertical-Axis Wind Turbines at Corners. Appl. Sci. 2022, 12, 3515. [Google Scholar] [CrossRef]
  7. Srinivasan, P.; Jagatheeswari, P. Machine Learning Controller for DFIG Based Wind Conversion System. Intell. Autom. Soft Comput. 2023, 35, 381–397. [Google Scholar] [CrossRef]
  8. Pape, M.; Kazerani, M. A Generic Power Converter Sizing Framework for Series-Connected DC Offshore Wind Farms. IEEE Trans. Power Electron. 2022, 37, 2307–2320. [Google Scholar] [CrossRef]
  9. Choi, U.-M.; Blaabjerg, F.; Lee, K.-B. Study and Handling Methods of Power IGBT Module Failures in Power Electronic Converter Systems. IEEE Trans. Power Electron. 2015, 30, 2517–2533. [Google Scholar] [CrossRef]
  10. Luo, H.; Chen, Y.; Sun, P.; Li, W.; He, X. Junction Temperature Extraction Approach with Turn-Off Delay Time for High-Voltage High-Power IGBT Modules. IEEE Trans. Power Electron. 2016, 31, 5122–5132. [Google Scholar] [CrossRef]
  11. Hu, Y.; Shi, P.; Li, H.; Yang, C. Health Condition Assessment of Base-Plate Solder for Multi-Chip IGBT Module in Wind Power Converter. IEEE Access 2019, 7, 72134–72142. [Google Scholar] [CrossRef]
  12. Abuelnaga, A.; Narimani, M.; Bahman, A.S. A Review on IGBT Module Failure Modes and Lifetime Testing. IEEE Access 2021, 9, 9643–9663. [Google Scholar] [CrossRef]
  13. Tsai, H.-W.; Ker, M.-D. Layout Consideration and Circuit Solution to Prevent EOS Failure Induced by Latchup Test in a High-Voltage Integrated Circuits. IEEE Trans. Device Mater. Reliab. 2014, 14, 493–498. [Google Scholar] [CrossRef] [Green Version]
  14. Hu, Z.; Ge, X.; Xie, D.; Zhang, Y.; Yao, B.; Dai, J.; Yang, F. An Aging-Degree Evaluation Method for IGBT Bond Wire with Online Multivariate Monitoring. Energies 2019, 12, 3962. [Google Scholar] [CrossRef] [Green Version]
  15. Wang, C.; He, Y.; Wang, C.; Li, L.; Wu, X. Multi-Chip IGBT Module Failure Monitoring Based on Module Transconductance with Temperature Calibration. Electronics 2020, 9, 1559. [Google Scholar] [CrossRef]
  16. Yang, J.; Che, Y.; Ran, L.; Du, M.; Jiang, H.; Xiao, M. Monitoring Initial Solder Layer Degradation in a Multichip IGBT Module via Combined TSEPs. IEEE Trans. Device Mater. Reliab. 2021, 22, 26–35. [Google Scholar] [CrossRef]
  17. Shao, L.; Xu, G.; Li, P. A Hybrid Model of Turn-Off Loss and Turn-Off Time for Junction Temperature Extraction. IEEE J. Electron Devices Soc. 2021, 10, 3–12. [Google Scholar] [CrossRef]
  18. Liu, Z.F.; Li, L.L.; Liu, Y.W.; Liu, J.Q.; Li, H.Y.; Shen, Q. Dynamic economic emission dispatch considering renewable energy generation: A novel multi-objective optimization approach. Energy 2021, 235, 121407. [Google Scholar] [CrossRef]
  19. Li, L.-L.; Liu, Z.-F.; Tseng, M.-L.; Zheng, S.-J.; Lim, M.K. Improved tunicate swarm algorithm: Solving the dynamic economic emission dispatch problems. Appl. Soft Comput. 2021, 108, 107504. [Google Scholar] [CrossRef]
  20. Wei, W.; Zhu, W.; Liu, T.; Xu, G. Junction Temperature Online Extraction Method for Power MOSFET by Current Fall Time. IEEE Trans. Electron Devices 2022, 69, 3811–3819. [Google Scholar] [CrossRef]
  21. Xu, C.Q.; Zhao, B.; Zhang, X.Y.; Chen, Z.Y.; Liu, J.P.; Zhou, W.P.; Zeng, R. Full-Time Junction Temperature Extraction of IGCT Based on Electrothermal Model and TSEP Method for High-Power Applications. IEEE Trans. Ind. Electron. 2020, 68, 47–58. [Google Scholar] [CrossRef]
  22. Polom, T.A.; Lorenz, R.D. Power Device Interface Characterization with Low-Cost Thermal System Identification. IEEE J. Emerg. Sel. Top. Power Electron. 2021, 10, 1342–1352. [Google Scholar] [CrossRef]
  23. Ji, B.; Song, X.; Cao, W.; Pickert, V.; Hu, Y.; Mackersie, J.W.; Pierce, G. In Situ Diagnostics and Prognostics of Solder Fatigue in IGBT Modules for Electric Vehicle Drives. IEEE Trans. Power Electron. 2014, 30, 1535–1543. [Google Scholar]
  24. Du, B.; Hudgins, J.L.; Santi, E.; Bryant, A.T.; Palmer, P.R.; Mantooth, H.A. Transient Electrothermal Simulation of Power Semiconductor Devices. IEEE Trans. Power Electron. 2009, 25, 237–248. [Google Scholar]
  25. Schmidt, R.; Scheuermann, U. Using the Chip as a Temperature Sensor—The Influence of Steep Lateral Temperature Gradients on the V-CE(T)-Measurement. Epe J. 2011, 21, 5–10. [Google Scholar] [CrossRef]
  26. Dupont, L.; Avenas, Y.; Jeannin, P.-O. Comparison of Junction Temperature Evaluations in a Power IGBT Module Using an IR Camera and Three Thermosensitive Electrical Parameters. IEEE Trans. Ind. Appl. 2013, 49, 1599–1608. [Google Scholar] [CrossRef] [Green Version]
  27. Yang, Y.; Zhang, P. A Novel Converter-Level IGBT Junction Temperature Estimation Method Based on the Bus Voltage Ringing. IEEE Trans. Power Electron. 2021, 37, 4553–4563. [Google Scholar] [CrossRef]
  28. Shao, L.; Hu, Y.; Xu, G. A High Precision On-Line Detection Method for IGBT Junction Temperature Based on Stepwise Regression Algorithm. IEEE Access 2020, 8, 186172–186180. [Google Scholar] [CrossRef]
  29. Xu, Z.; Xu, F.; Wang, F. Junction Temperature Measurement of IGBTs Using Short-Circuit Current as a Temperature-Sensitive Electrical Parameter for Converter Prototype Evaluation. IEEE Trans. Ind. Electron. 2015, 62, 3419–3429. [Google Scholar] [CrossRef]
  30. Liu, B.; Chen, G.; Lin, H.-C.; Zhang, W.; Liu, J. Prediction of IGBT junction temperature using improved cuckoo search-based extreme learning machine. Microelectron. Reliab. 2021, 124, 114267. [Google Scholar] [CrossRef]
  31. Xu, D.W.; Lu, H.W.; Huang, L.P.; Azuma, S.S.; Kimata, M.H.; Uchida, R.H. Power loss and junction temperature analysis of power semiconductor devices. IEEE Trans. Ind. Appl. 2002, 38, 1426–1431. [Google Scholar]
  32. Li, H.; Liao, X.; Zeng, Z.; Hu, Y.; Li, Y.; Liu, S.; Ran, L. Thermal Coupling Analysis in a Multichip Paralleled IGBT Module for a DFIG Wind Turbine Power Converter. IEEE Trans. Energy Convers. 2016, 32, 80–90. [Google Scholar] [CrossRef] [Green Version]
  33. Zhang, Y.; Wang, H.; Wang, Z.; Yang, Y.; Blaabjerg, F. A Simplification Method for Power Device Thermal Modeling with Quantitative Error Analysis. IEEE J. Emerg. Sel. Top. Power Electron. 2019, 7, 1649–1658. [Google Scholar] [CrossRef]
  34. Sang, B. Application of genetic algorithm and BP neural network in supply chain finance under information sharing. J. Comput. Appl. Math. 2020, 384, 113170. [Google Scholar] [CrossRef]
  35. Pan, Z.; Meng, Z.; Chen, Z.; Gao, W.; Shi, Y. A two-stage method based on extreme learning machine for predicting the remaining useful life of rolling-element bearings. Mech. Syst. Signal Process. 2020, 144, 106899. [Google Scholar] [CrossRef]
  36. Pan, L.; Xiong, Y.; Zhu, Z.; Wang, L.C. Research on variable pitch control strategy of direct-driven offshore wind turbine using KELM wind speed soft sensor. Renew. Energy 2022, 184, 1002–1017. [Google Scholar] [CrossRef]
  37. Kushwah, G.S.; Ranga, V. Detecting DDoS Attacks in Cloud Computing Using Extreme Learning Machine and Adaptive Differential Evolution. Wirel. Pers. Commun. 2022, 124, 2613–2636. [Google Scholar] [CrossRef]
  38. Chakravarthy, S.R.S.; Rajaguru, H. Automatic Detection and Classification of Mammograms Using Improved Extreme Learning Machine with Deep Learning. Irbm 2022, 43, 49–61. [Google Scholar] [CrossRef]
  39. Han, E.R.; Ghadimi, N. Model identification of proton-exchange membrane fuel cells based on a hybrid convolutional neural network and extreme learning machine optimized by improved honey badger algorithm. Sustain. Energy Technol. Assess. 2022, 52, 106899. [Google Scholar] [CrossRef]
  40. Li, H.; Long, H.; Bai, P.; Zheng, M. Loss Calculation of Multi-chip IGBT Modular with the Influence of Stray Inductance. Power Electron. 2018, 52, 26–30. [Google Scholar]
  41. Ju, J.H.; Zhao, Z.M.; Shi, B.C.; Zhu, Y.C.; Yu, Z.J. Motor-Oriented Discrete State Event-Driven Method for Multitime-Scale Simulation of Power Traction Systems. IEEE Trans. Transp. Electrif. 2021, 7, 1652–1661. [Google Scholar] [CrossRef]
  42. Gorecki, P. Electrothermal Averaged Model of a Diode-IGBT Switch for a Fast Analysis of DC-DC Converters. IEEE Trans. Power Electron. 2022, 37, 13003–13013. [Google Scholar] [CrossRef]
  43. Hefner, A.R.; Diebolt, D.M. An experimentally verified IGBT model implemented in the Saber circuit simulator. In Proceedings of the 22nd Annual IEEE Power Electronics Specialists Conference (Pesc 91), Cambridge, MA, USA, 24–27 June 1991; pp. 10–19. [Google Scholar]
  44. Wang, X.; Li, Z.; Yao, F.; Tang, S. Simplified Estimation of Junction Temperature Fluctuation at the Fundamental Frequency for IGBT Modules Considering Mission Profile. IEEE Access 2019, 7, 149308–149317. [Google Scholar] [CrossRef]
  45. Khan, M.N.H.; Forouzesh, M.; Siwakoti, Y.P.; Li, L.; Kerekes, T.; Blaabjerg, F. Transformerless Inverter Topologies for Single-Phase Photovoltaic Systems: A Comparative Review. IEEE J. Emerg. Sel. Top. Power Electron. 2020, 8, 805–835. [Google Scholar] [CrossRef]
  46. Mansour, M.Z.; Me, S.P.; Hadavi, S.; Badrzadeh, B.; Karimi, A.; Bahrani, B. Nonlinear Transient Stability Analysis of Phased-Locked Loop-Based Grid-Following Voltage-Source Converters Using Lyapunov’s Direct Method. IEEE J. Emerg. Sel. Top. Power Electron. 2022, 10, 2699–2709. [Google Scholar] [CrossRef]
  47. Gorecki, P.; Wojciechowski, D. Accurate Computation of IGBT Junction Temperature in PLECS. IEEE Trans. Electron Devices 2020, 67, 2865–2871. [Google Scholar] [CrossRef]
  48. Madhusoodhanan, S.; Mainali, K.; Tripathi, A.K.; Kadavelugu, A.; Patel, D.; Bhattacharya, S. Power Loss Analysis of Medium-Voltage Three-Phase Converters Using 15-kV/40-A SiC N-IGBT. IEEE J. Emerg. Sel. Top. Power Electron. 2016, 4, 902–917. [Google Scholar] [CrossRef]
  49. Xie, K.; Jiang, Z.; Li, W. Effect of Wind Speed on Wind Turbine Power Converter Reliability. IEEE Trans. Energy Convers. 2012, 27, 96–104. [Google Scholar] [CrossRef]
  50. Hashim, F.A.; Houssein, E.H.; Hussain, K.; Mabrouk, M.S.; Al-Atabany, W. Honey Badger Algorithm: New metaheuristic algorithm for solving optimization problems. Math. Comput. Simul. 2022, 192, 84–110. [Google Scholar] [CrossRef]
  51. Wang, C.; Di, Y.; Tang, J.; Shuai, J.; Zhang, Y.; Lu, Q. The Dynamic Analysis of a Novel Reconfigurable Cubic Chaotic Map and Its Application in Finite Field. Symmetry 2021, 13, 1420. [Google Scholar] [CrossRef]
  52. Mirjalili, S.; Mirjalili, S.M.; Lewis, A. Grey Wolf Optimizer. Adv. Eng. Softw. 2014, 69, 46–61. [Google Scholar] [CrossRef] [Green Version]
  53. Dhiman, G.; Kumar, V. Seagull optimization algorithm: Theory and its applications for large-scale industrial engineering problems. Knowledge-Based Syst. 2018, 165, 169–196. [Google Scholar] [CrossRef]
Figure 1. Heat network model.
Energies 15 07366 g001
Figure 2. Three-phase inverter circuit.
Energies 15 07366 g002
Figure 3. (a): Comparison of junction temperatures at an output frequency of 50   H z ; (b): Comparison of junction temperatures at an output frequency of 5   H z .
Energies 15 07366 g003
Figure 4. Junction temperature calculation process.
Energies 15 07366 g004
Figure 5. Junction temperature wave for one year in a 2 MW wind turbine.
Energies 15 07366 g005
Figure 6. (a): Convergence curve of f 1 ( x ) ; (b): Convergence curve of f 2 ( x ) ; (c): Convergence curve of f 3 ( x ) ; (d): Convergence curve of f 4 ( x ) ; (e): Convergence curve of f 5 ( x ) ; (f): Convergence curve of f 6 ( x ) .
Energies 15 07366 g006
Figure 7. Flow chart of the IHBA-ELM model.
Energies 15 07366 g007
Figure 8. Predicted junction temperature of the HBA-ELM model.
Energies 15 07366 g008
Figure 9. Predicted junction temperature of the IHBA-ELM model.
Energies 15 07366 g009
Figure 10. Predicted junction temperature of the SOA-ELM model.
Energies 15 07366 g010
Figure 11. Predicted junction temperature of the ELM model.
Energies 15 07366 g011
Figure 12. Predicted junction temperature of the BPNN model.
Energies 15 07366 g012
Figure 13. Absolute error of prediction results.
Energies 15 07366 g013
Table 1. Test Functions.
Test FunctionsDimensionUpper BoundaryLower BoundaryOptimum Value
f 1 ( x ) = i = 1 n x i 2 30100−1000
f 2 ( x ) = i = 1 n | x i | + i = 1 n | x i | 3010−100
f 3 ( x ) = i = 1 n ( j = 1 i x j ) 2 30100−100
f 4 ( x ) = max { | x i | ,   1 i n } 30100−1000
f 5 ( x ) = i = 1 n x i 4 i + r a n d o m [ 0 ,   1 ) 301.28−1.280
f 6 ( x ) = 20 exp ( 0.2 1 n i = 1 n x i 2 ) exp ( 1 n i = 1 n cos ( 2 π x i ) ) + 20 + e 3032−320
Table 2. Test results of the algorithm.
Test FunctionsAlgorithmWorst ValueBest ValueAverage ValueVariance
f 1 ( x ) HBA6.50 × 10−1011.91 × 10−1103.59 × 10−1021.73 × 10−202
IHBA0000
GWO2.30 × 10−207.40 × 10−231.80 × 10−211.64 × 10−41
SOA2.41 × 10−542.29 × 10−701.36 × 10−552.32 × 10−109
f 2 ( x ) HBA3.11 × 10−545.81 × 10−583.60 × 10−555.75 × 10−109
IHBA0000
GWO8.86 × 10−131.00 × 10−134.34 × 10−134.18 × 10⁻²⁶
SOA8.07 × 10−394.87 × 10−462.90 × 10−402.09 × 10−78
f 3 ( x ) HBA3.03 × 10−711.41 × 10−841.87 × 10−723.94 × 10−143
IHBA0000
GWO8.56 × 10−32.15 × 10−61.24 × 10−35.49 × 10⁻⁶
SOA9.64 × 1041.99 × 1045.03 × 1042.91 × 108
f 4 ( x ) HBA1.44 × 10−433.84 × 10−509.68 × 10−457.66 × 10−88
IHBA0000
GWO1.64 × 10−46.46 × 10−62.68 × 10−59.41 × 10⁻¹⁰
SOA89.7111.9155.245.74e + 02
f 5 ( x ) HBA1.45 × 10−37.08 × 10−55.49 × 10−41.53 × 10⁻⁷
IHBA3.45 × 10−45.54 × 10−61.07 × 10−49.75 × 10⁻⁹
GWO7.68 × 10−36.73 × 10−42.79 × 10−33.51 × 10⁻⁶
SOA1.55 × 10−27.34 × 10−53.61 × 10−32.09 × 10⁻⁵
f 6 ( x ) HBA7.55 × 10−58.87 × 10−162.52 × 10−61.84 × 10−10
IHBA8.87 × 10−168.87 × 10−168.87 × 10−168.87 × 10⁻¹⁶
GWO2.78 × 10−112.38 × 10−129.71 × 10−124.02 × 10⁻²³
SOA1.51 × 10−148.87 × 10−165.15 × 10−159.59 × 10⁻³⁰
Table 3. Analysis of the results of junction temperature prediction.
Prediction ModelsEvaluation IndicatorsMaximum Value (°C)Minimum Value (°C)Average Value (°C)Variance
HBA-ELMMEA0.07930.01420.03391.0337 × 10−4
RMSE0.04200.00860.00433.8752 × 10−7
R20.99990.99940.99985.3134 × 10−9
IHBA-ELMMEA0.05260.01350.03037.0670 × 10−5
RMSE0.00520.00270.00413.3057 × 10−7
R20.99990.99960.99983.6326 × 10−9
SOA-ELMMEA0.05670.01800.03411.0939 × 10−4
RMSE0.00560.00320.00434.4091 × 10−7
R20.99990.99960.99985.6227 × 10−9
ELMMEA2.68340.08570.36370.3432
RMSE0.03870.00690.01225.4236 × 10−5
R20.99940.98290.99761.3719 × 10−5
BPNNMEA11.15540.01510.67914.0340
RMSE3.34000.12300.58920.3434
R20.99990.95220.99647.4671 × 10−5
Publisher’s Note: MDPI stays neutral with regard to jurisdictional claims in published maps and institutional affiliations.