Article

An Analytical Hierarchy-Based Method for Quantifying Hydraulic Fracturing Stimulation to Improve Geothermal Well Productivity

1
College of Energy and Mining Engineering, Shandong University of Science and Technology, Qingdao 266590, China
2
Institute of Geophysics, Polish Academy of Sciences, 01-452 Warsaw, Poland
3
School of Resources and Environmental Engineering, Hefei University of Technology, Hefei 230009, China
*
Author to whom correspondence should be addressed.
Energies 2022, 15(19), 7368; https://doi.org/10.3390/en15197368
Submission received: 5 September 2022 / Revised: 16 September 2022 / Accepted: 30 September 2022 / Published: 7 October 2022
(This article belongs to the Section H2: Geothermal)

Abstract

:
Hydraulic fracturing (HF) has been used for years to enhance oil and gas production from conventional and unconventional reservoirs. HF in enhanced geothermal systems (EGS) has become increasingly common in recent years. In EGS, hydraulic fracturing creates a geothermal collector in impermeable or low-permeable hot dry rocks. Artificial fracture networks in the collector allow for a continuous flow of fluid in a loop connecting at least two wells (injector and producer). However, it is challenging to assess the fracability of geothermal reservoirs for EGS. Consequently, it is necessary to design a method that considers multiple parameters when evaluating the potential of geothermal development. This study proposes an improved fracability index model (FI) based on the influences of fracability-related geomechanical and petrophysical properties. These include brittle minerals composition, fracture toughness, minimum horizontal in-situ stress, a brittleness index model, and temperature effect to quantify the rock’s fracability. The hierarchical analytic framework was designed based on the correlation between the influencing factors and rock fracability. The results of the qualitative and quantitative approaches were integrated into a mathematical evaluation model. The improved fracability index model’s reliability was evaluated using well logs and 3D seismic data on low-permeable carbonate geothermal reservoirs and shale gas horizontal wells. The results reveal that the improved FI model effectively demonstrates brittle regions in the low-permeable carbonate geothermal reservoir and long horizontal section of shale reservoir. We divide the rock fracability into three levels: FI > 0.59 (the rock fracability is good); 0.59 > FI > 0.32 (the rock fracability is medium); and FI < 0.32, (the rock fracability is poor). The improved FI model can assist in resolving the uncertainties associated with fracability interpretation in determining the optimum location of perforation clusters for hydraulic fracture initiation and propagation in enhanced geothermal systems.

1. Introduction

Fracability refers to a rock’s ability to fracture efficiently during hydraulic fracturing, which controls the fracture pattern and fracture network complexity [1,2]. The multistage hydraulic fracturing in low-permeability rock is affected by mineral composition, brittleness index, stress regime, presence of natural fractures, and elastic properties [3,4,5]. In recent years, the fracability index (FI) has become a standard measure for describing the resistance of rocks to hydraulic fractures [1]. Several geoscientists and engineers use the term FI to describe the quantitative evaluation of shale fracability [3,4,6].
Various FI evaluation methods have been proposed based on modifications to the classical methods [7,8]. Guo et al. [8] introduced a novel approach for evaluating the fracability of shale based on the full core diameter. This method estimated the capacity of shale to create fracture networks by considering the rock’s brittleness, hardness, natural fracture system, and fracture density. Bing et al. [9] established a mathematical model of shale fracability based on two factors: reservoir properties (shale brittleness, quartz content) and geological factors (natural fractures, diagenesis). Yuan et al. [5] and Jin et al. [10] calculated the rock’s fracability using elastic moduli-based BI and mechanical properties. Yuan et al. [5] presented a methodology for evaluating fracability that incorporates elastic moduli-based brittleness index (BI), fracture toughness (both mode-I and mode-II), and in-situ horizontal stress. The fracability model proposed by Yuan et al. [5] was modified by Yasin et al. [1] by replacing mineralogy-based BI with elastic moduli-based BI. The inclusion of mineralogy-based BI in Yuan et al. [5]‘s fracability model resulted in more accurate results [1]. Sui et al. [11] employed the analytic hierarchy process to determine the relative importance of various factors affecting shale fracability (i.e., clay content, cohesion, and internal friction angle) by weight calculation. Furthermore, Wu et al. [12] tested the influence of diagenesis and the presence of natural fractures on shale fracability using data from prior research.
Since hot dry rock (HDR) formations also have low permeability, the hydraulic fracturing (HF) design at the EGS site is not quite similar to the natural gas operation. The mechanisms of enhanced geothermal stimulation and shale reservoir fracking differ significantly. The dominant failure mode in hydraulic fracturing is mode I fracture, and the characterization of fracture toughness is also significant. In the case of EGS, fracture reactivation dominates [13]. Other differences include greater depths, high magnitudes of stresses, higher temperatures, and the presence of crystalline igneous rocks. McClure and Horne [14] reviewed ten historical EGS projects and concluded that well bore flow was caused by preexisting fractures during injection. There is a contradiction between these observations, since flow from preexisting fractures is consistent with shear stimulation. This observation was reconciled by McClure and Horne [14] by proposing that, in many cases, new fractures are formed away from the wellbore. These fractures originate from open and/or sliding natural fractures. As a result of the opening and sliding of natural fractures, there is a concentration of stress that facilitates fracture initiation. There is a possibility that propagating fractures may terminate against natural fractures, resulting in a complex network of both new and preexisting fractures.
The FI models proposed by various authors are primarily designed for shale reservoirs, which are somewhat different from HDR. Enhanced geothermal systems (EGS) can also rely on high-temperature rock mass, pore structure, and working fluid to improve permeability in addition to geomechanical and petrophysical properties, especially in carbonate reservoirs [14,15]. An EGS reservoir uses hydraulic fracturing to maximize efficiency. This technology enables the extraction of the earth’s thermal energy from impermeable (or very low permeability) HDR, which does not contain water in natural conditions [16]. The thermal energy from the HDR formation allows use of the heat from impermeable rock (e.g., igneous, metamorphic). Subsequently, it drives a turbine to generate electricity at the surface using a thermal collector developed for the EGS. It is generally possible to access the HDR formations through wells located between three to five kilometers deep, connected by induced fractures in a perspective layer. Fluid flows between injection and production wells through conduction, which is heated underground and released as energy at the surface. However, EGS differs from conventional geothermal systems in that the reservoirs must be created with an artificial conductivity to facilitate the connection between the wells [13,17]. An example of a schematic diagram of the enhanced geothermal system is shown in Figure 1.
The present study proposes an improved fracability index based on geomechanical and petrophysical properties as well as temperature effects to evaluate the geothermal potential in low permeable carbonate reservoirs. The hierarchical analytical framework was designed based on the correlation between the influencing factors and the fracability of the rock. We developed a mathematical evaluation model to assess the low permeable carbonate geothermal reservoir’s brittle, ductile, and transition zones. Ultimately, this study examines hydraulic fracturing of stimulation zones in geothermal reservoirs to maximize well productivity. We further apply the model to the horizontal shale gas well to determine the accuracy and reliability of the model.

2. A Review of Hydraulic Fracturing in the Global Geothermal Fields

Hydraulic fracturing has been widely used to stimulate oil and gas wells over the last three decades. Fracture treatments are currently being conducted on more than 70% of oil wells and 90% of gas wells [20,21,22]. Since the 1950s, “water fracturing” has been used in the hydrocarbon industry to inject low-viscosity fluids with low proppant concentrations into dry gas reservoirs. The fractures create primary fluid conduits connecting production zones far from wellbore locations [23].
A considerable number of geothermal wells have been stimulated by acid treatments in carbonate rocks (e.g., Tuscany, Italy) and water-fracturing treatments that target high-enthalpy crystalline reservoirs (e.g., upper Rhine Graben, France) [24,25,26]. The industrial applications of hydraulic proppant fracturing (HPF) to enhance geothermal sedimentary reservoir rock inflow performance have been developed worldwide. Geothermal reservoir well stimulation projects in the USA and the rest of the world have been summarized in Table 1 [18,27,28,29]. Table 1 provides geological information such as lithology, deposit depth, optimal zone temperature, and thermal energy methods. Additionally, Table 1 contains geophysical data, such as stress regimes and magnitudes, rock mechanics parameters, and ultrasonic velocity measurements. It also provides information on fracturing, including pressure, pumping rate, fracking fluids, chemical additives, and proppants.

3. Theory and Method

The procedure for developing a fracability index model using a combination of elastic parameters, fracture toughness based-BI, Mode-I, and Mode-II fracture toughness, and in-situ stress is described below (Figure 2).

3.1. Rock Fracability Influencing Factors

HF in geothermal and shale reservoirs is influenced by various factors, including rock strength, brittleness, stresses, fracture toughness, confining pressure, temperature, presence of brittle minerals, and hydrogeological as well as petrographic parameters. We have identified the following factors as being the most relevant and critical based on our literature review [18,22,29,44,45,46].

3.1.1. Fracture Toughness

Fractures more easily originate in rocks with a high BI [6]. However, fractures must be able to grow and propagate in order to provide effective fluid flow pathways. According to Zhang et al. [47], the stress intensity factor at the fracture tip reaches a critical value for fracture growth. Fracture toughness is the measure of this critical value that represents a rock’s ability to resist fracture in the presence of a crack. There are three categories of fracture toughness: Mode-I (KIC), Mode-II (KIIC), and Mode-III (KIIIC) fractures. Mode-I and Mode-II fracture toughness generally dominate fracturing. Therefore, we use KIC to characterize rock’s ability to resist fracturing under tensile stress.
Jin et al. [48] show a linear relationship between fracture toughness and confining pressure (R2 = 0.99) utilizing fracture toughness tests.
K I C = 0.2176 P c + K I C °
Jin et al. [48] analyzed fracture toughness as a function of the tensile strength (Equation (2)).
K I C ° = 0.0059 σ t 3 + 0.0923 σ t 2 + 0.517 σ t 0.3322
It is, therefore, possible to express Mode-I and Mode-II fracture toughness in terms of confining pressure and tensile strength (Equations (3) and (4)):
K I C = 0.2176 P c + 0.0059 σ t 3 + 0.0923 σ t 2 + 0.517 σ t 0.3322
K I I C = 0.0466 P c + 0.1674 σ t 0.1851

3.1.2. Brittleness Index

The brittleness of the formation is considered an important factor when evaluating the rock rupture capacities [49]. Fractures can usually be formed in formation with high BI, which is sensitive to fracture extension, leading to an extensive fracture network.
Researchers have developed more than twenty distinct brittleness indices based on different methodologies and a diverse spectrum of rock characteristics [6]. The BI model, based on the correlation between fracture toughness and confining pressure, was used in this study [50]. The empirical relationship is shown in Equation (5).
B I = B I R i c k m a n K I C B I R i c k m a n K I C m i n B I R i c k m a n K I C m a x B I R i c k m a n K I C m i n
Equation (5) can be written as,
B I = B I R i c k m a n 0.2176 P c + K I C ° B I R i c k m a n 0.2176 P c + K I C ° m i n B I R i c k m a n 0.2176 P c + K I C ° m a x B I R i c k m a n 0.2176 P c + K I C ° m i n
where K I C ° = 0.0059 σ t 3 + 0.0923 σ t 2 + 0.517 σ t 0.3322 , B I R i c k m a n = E B I + v B I 2 As shown in Equation (6), BI is calculated by taking into account Young’s modulus BI ( E B I ), Poisson’s ratio BI ( v B I ), tensile strength ( σ t ) confining pressure ( P c ), and fracture toughness (KIC).

3.1.3. Minimum Horizontal In-Situ Stress
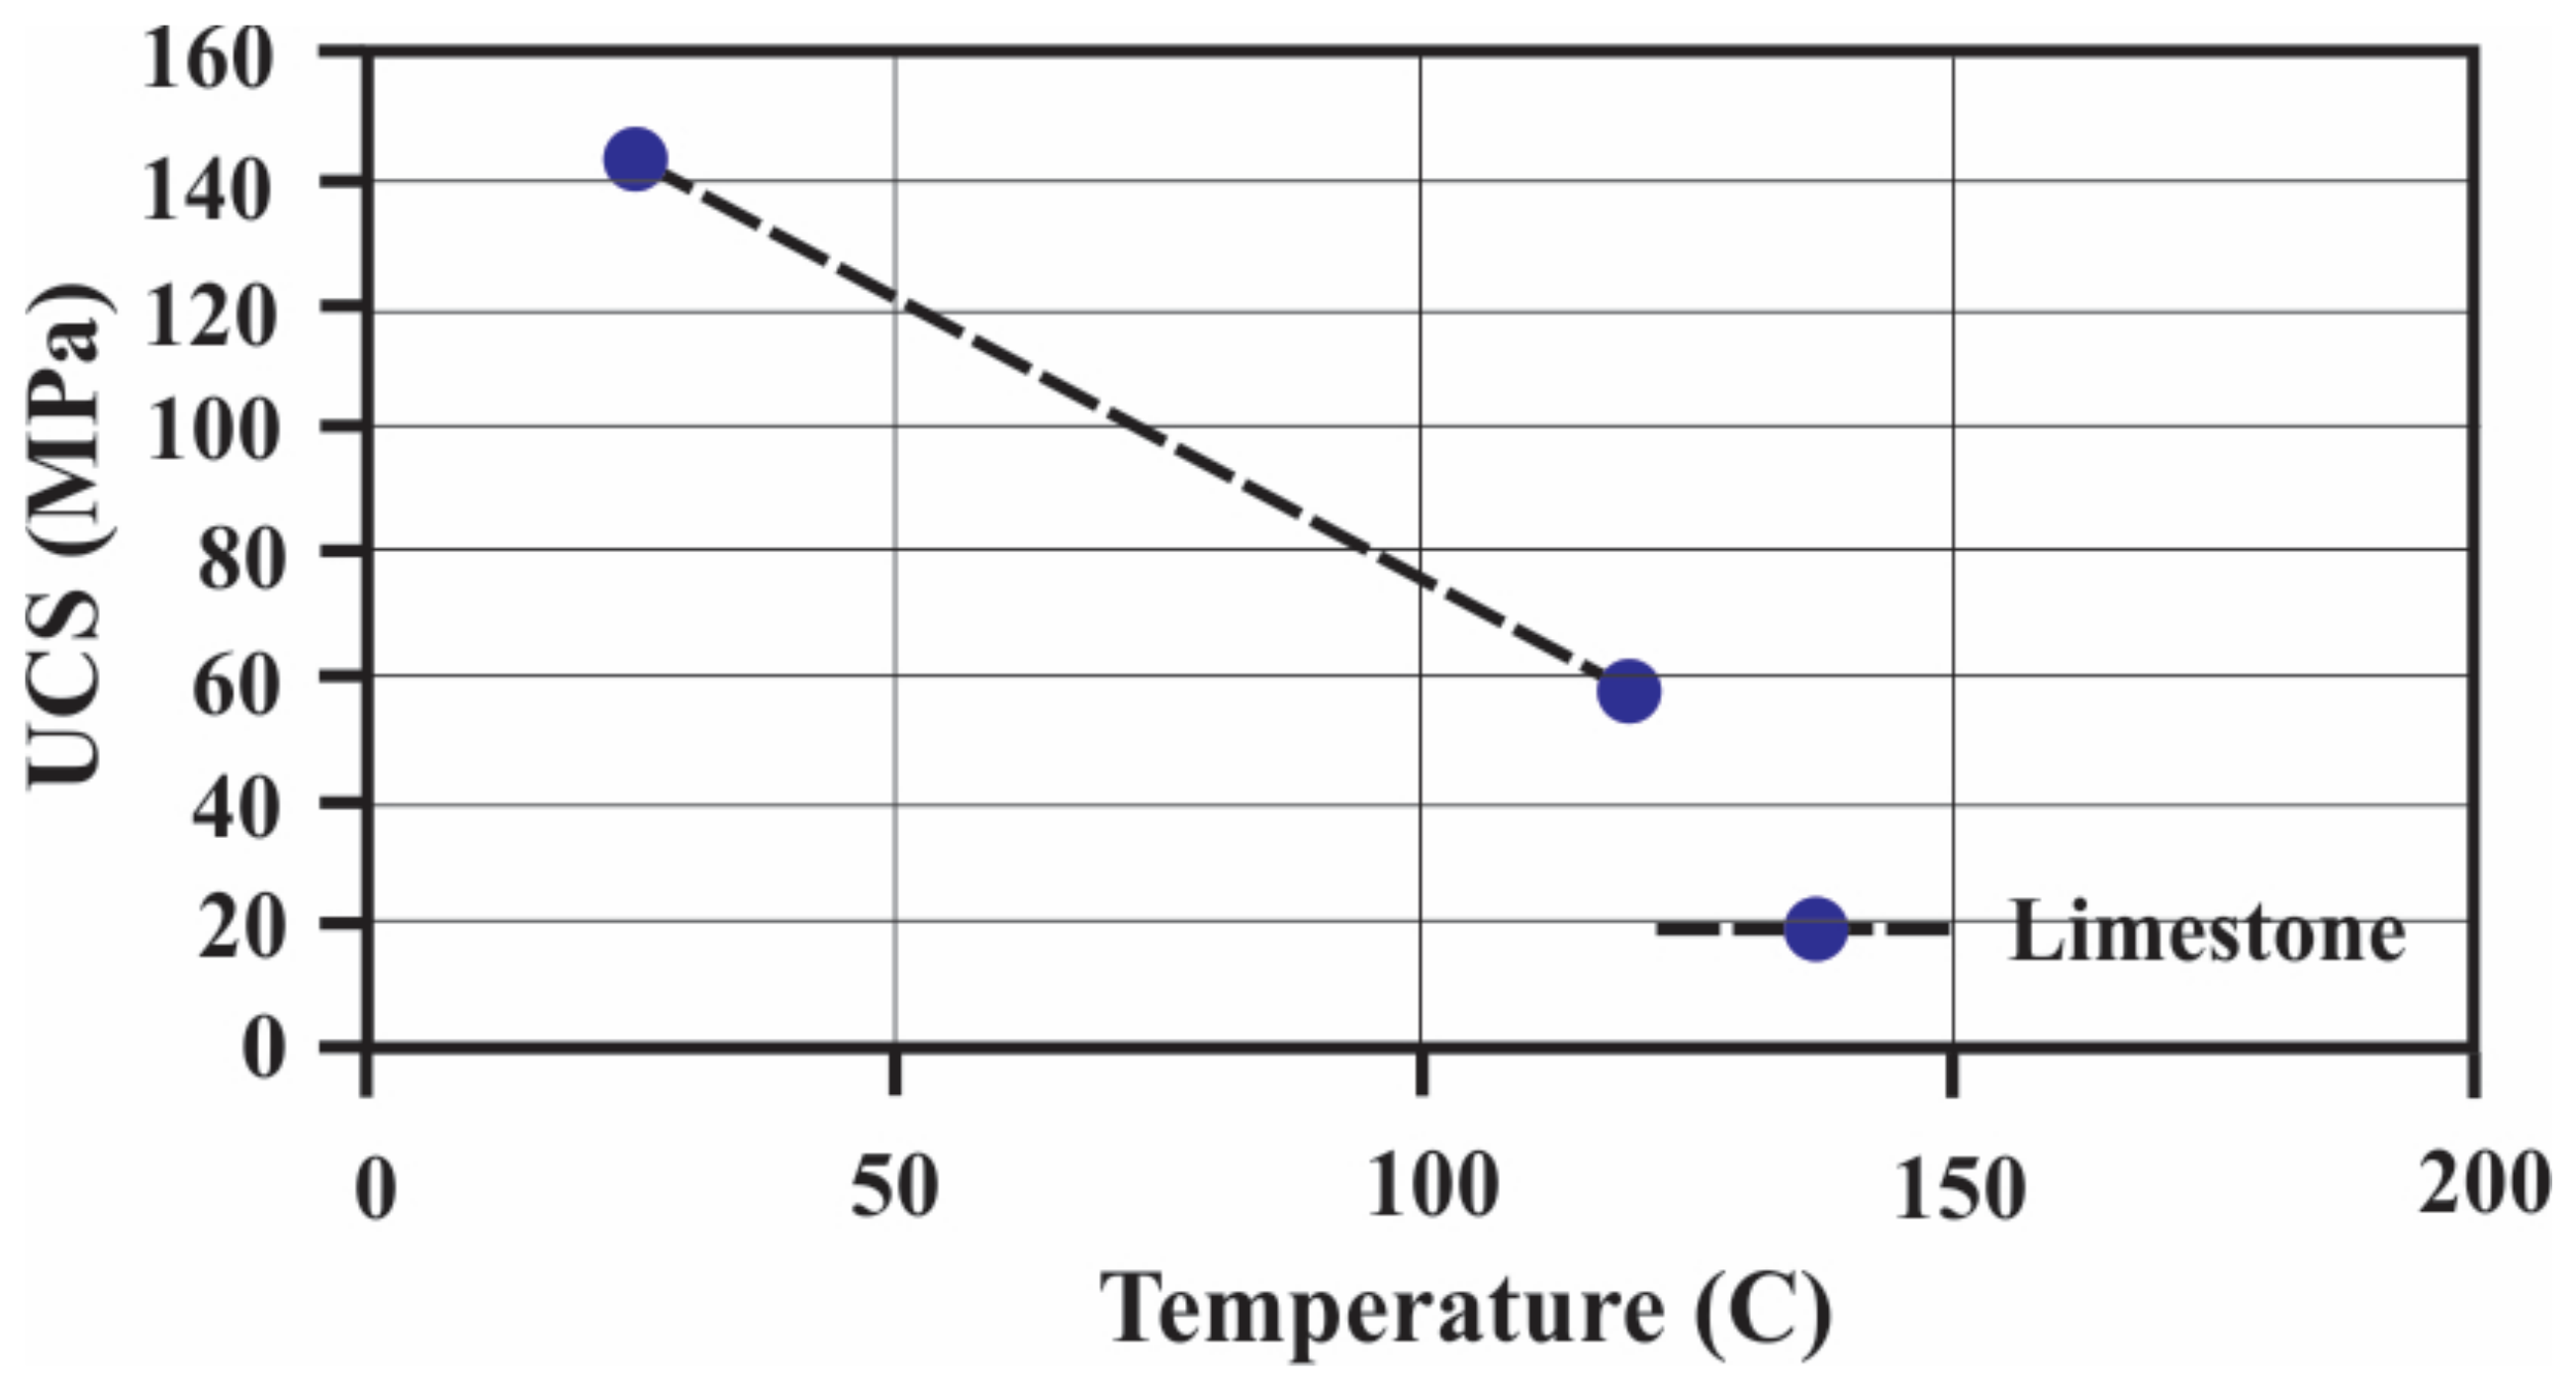
It is widely recognized that in-situ stresses directly affect hydraulic fracture propagation. Therefore, identifying in-situ stresses is essential for hydraulic fracturing operations design. The minimum horizontal stress (σhmax) can be used to determine whether the initiated fracture will propagate vertically or horizontally to subsequent layers or zones.
The σhmax was estimated using Equation (7), as proposed by Waters et al. [51], which requires the values of Poisson’s ratio (v), Biot’s coefficient ( α ), pore pressure ( P p ), Young’s modulus ( E ), and tectonic strain ( ε h m a x ) in the direction of maximum horizontal stress. The magnitude of the maximum horizontal stress was derived from the literature [52].
σ h m i n = v 1 v × σ v + 1 2 v 1 v × α P p + v 1 v 2 × E ε h m a x
where σ v = 0 z ρ z × g d z is overburden or vertical stress, ρ z is the bulk density of the rock samples (kg/m3) at depth z. The parameters g and d z represent the gravitational acceleration (9.81 m/s2) and depth in meters, respectively.

3.1.4. Temperature

Mineral decomposition at low temperatures in carbonate rocks decreases rock strength [53,54]. Earlier studies have revealed that chemical activities can also contribute to the reduction of rock strength. For example, in limestone, which is composed primarily of CaCO3, a decrease in strength can also be attributed to the breakdown and emission of CO2. Figure 3 shows that the limestone’s uniaxial compressive strength (UCS) decreases with an increase in temperature.

3.1.5. Other Influencing Factors

Cohesion, clay minerals, internal friction angle, fracture width, and natural fractures are other factors that influence rock’s fracability. However, fracture toughness may provide a complete understanding of fracability rather than cohesion. Moreover, the internal friction angle is comparable to the brittleness index [1]. Previous research has shown that fracability of the reservoir improves as the natural fracture develops [55,56]. However, natural fractures are randomly distributed in the reservoir, making it difficult to characterize natural fractures properly [6,57]. Therefore, we ignore the abovementioned factors in the quantitative evaluation of rock fracability.

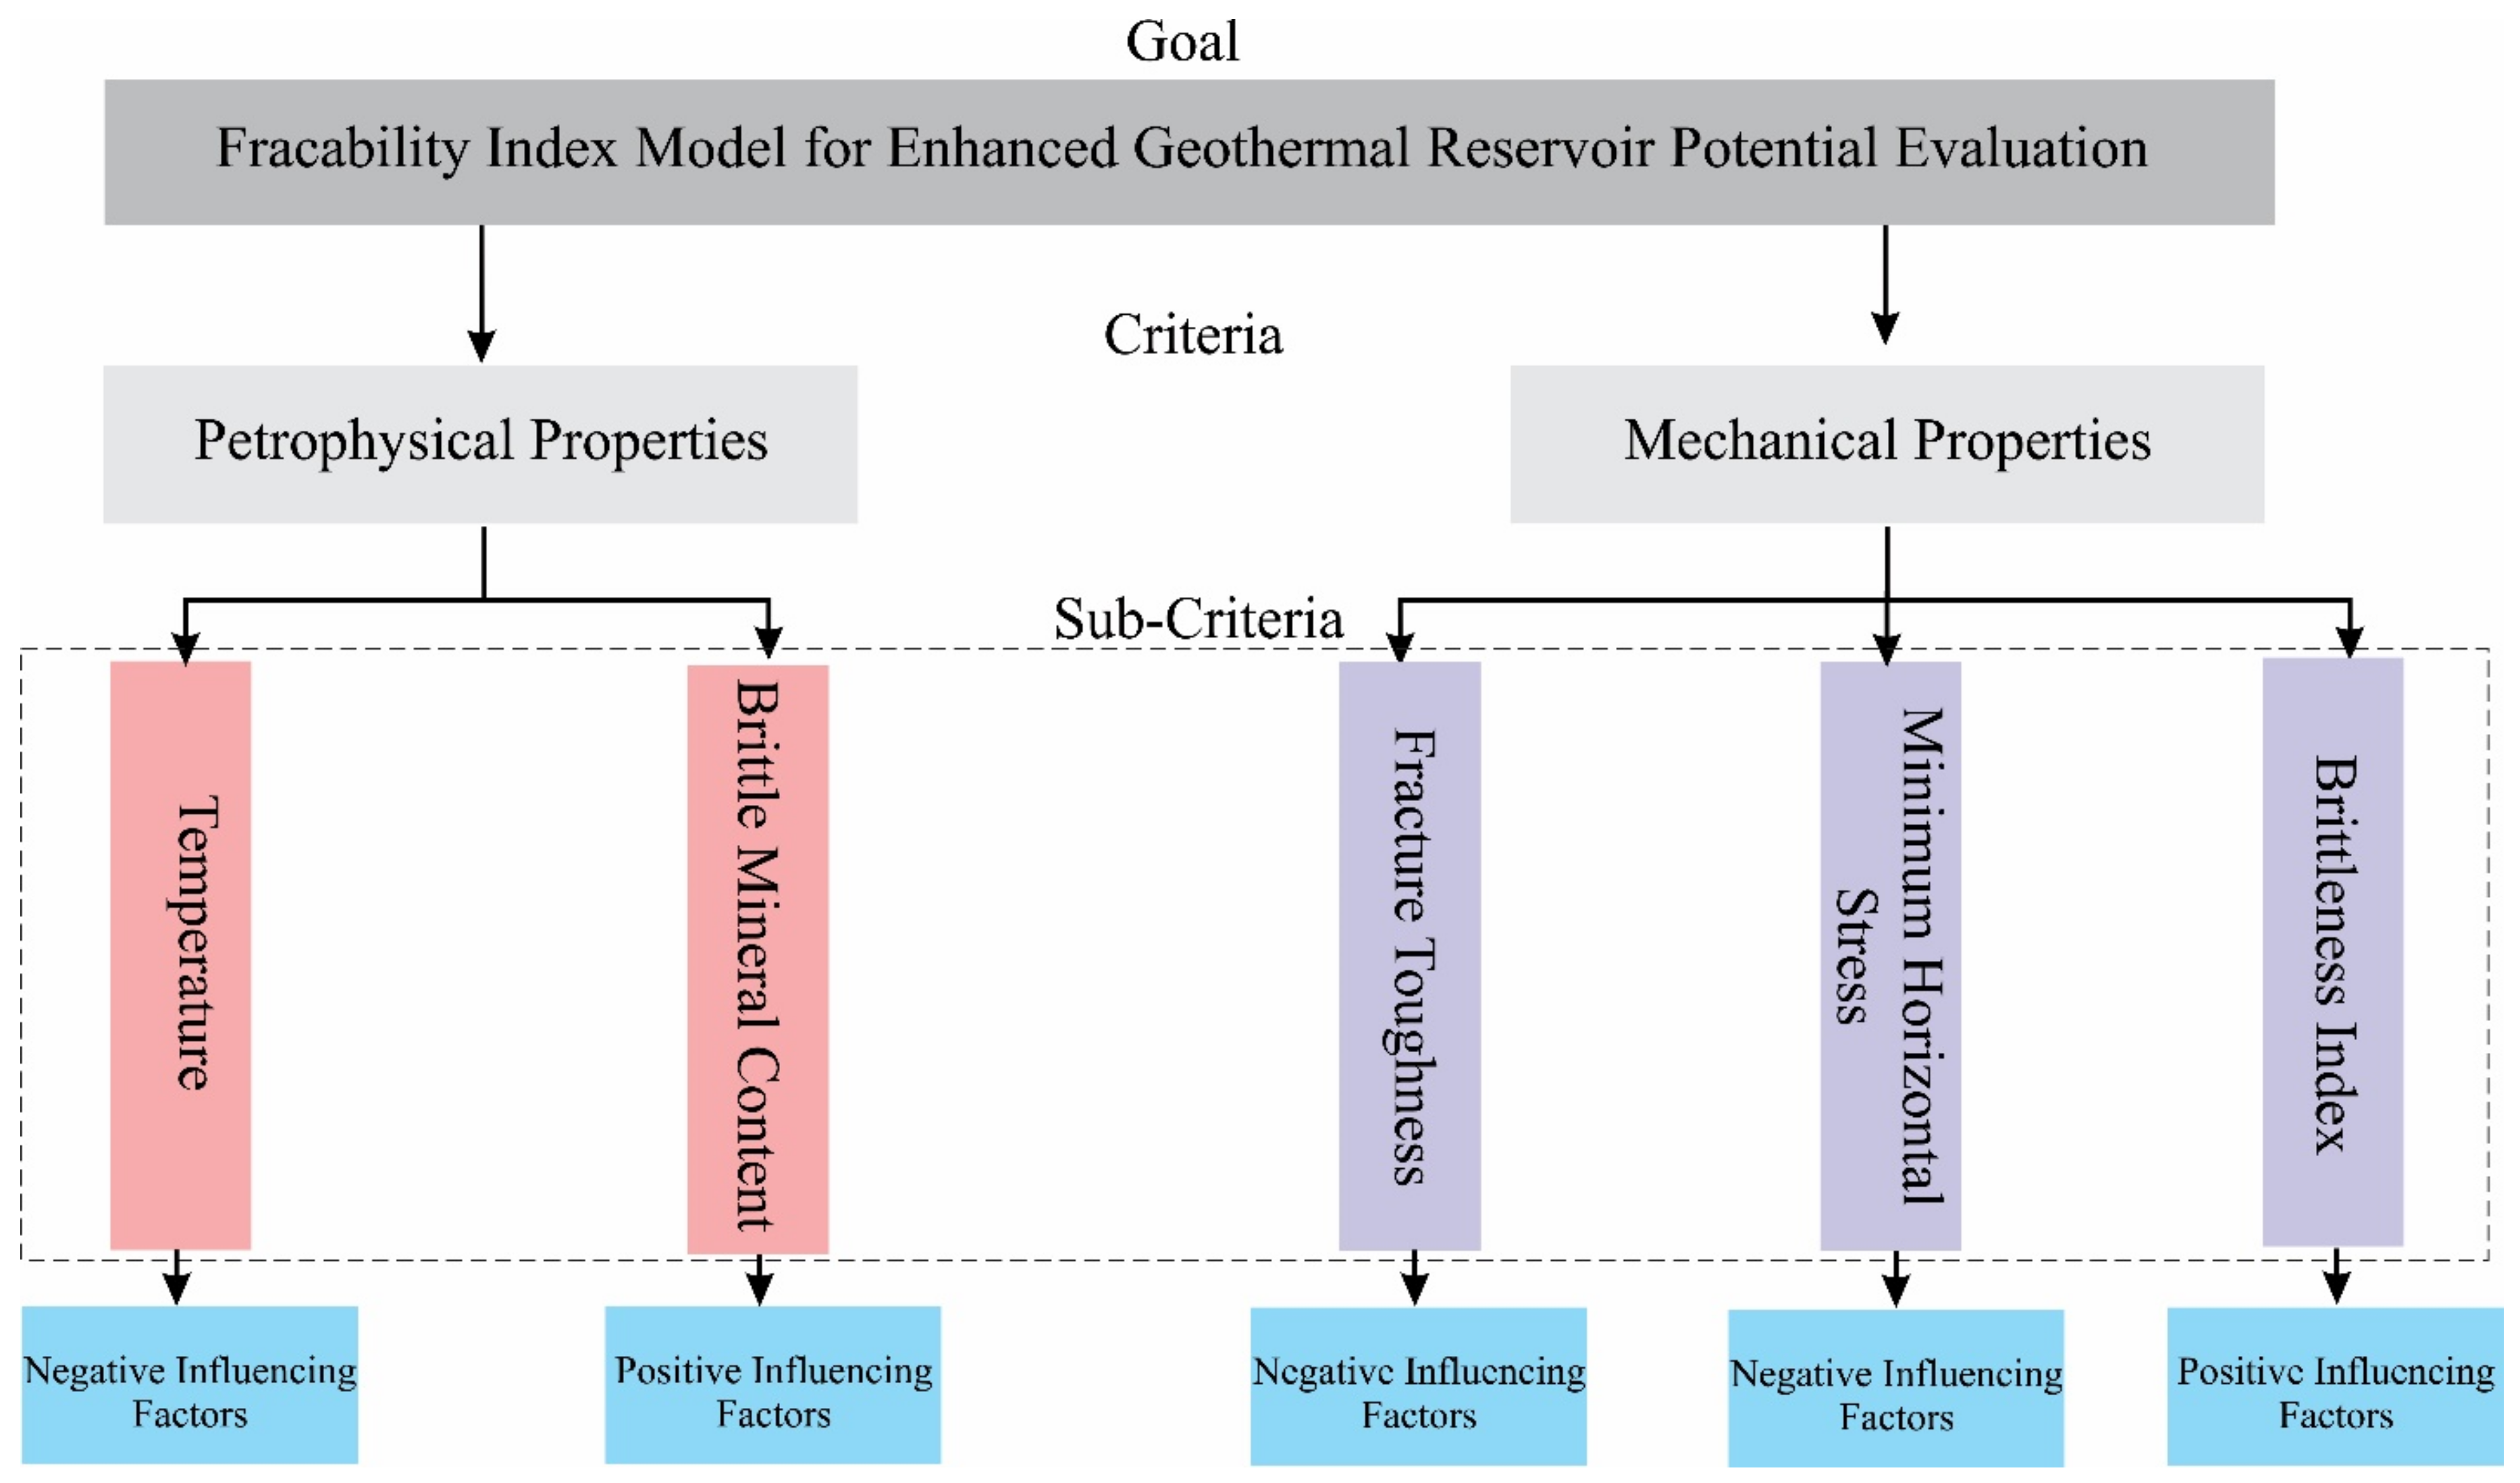
3.2. Quantification of Analytical Hierarchy-Based FI Model

The rocks with high BI and brittle minerals content (BMC) are generally easier to fracture [58]. In contrast, the lower the fracture toughness and temperature, the easier it is to induce fractures and embed proppants. In addition, the lower the minimum horizontal in-situ stress, the larger the fracture growth and fracture height confinement [59]. The hierarchical framework is designed based on the relationship between the influencing factors and the rock fracability (Figure 4).
Developing a hierarchical structural model before employing the analytic hierarchy approach to examine a problem is essential. The judgment matrix A = (aij) represents the pairwise comparison of factors based on expert subjective experience and judgment. As listed in Table 2, a numerical scale of 1–9 can describe the comparison between the factors.
The factors are compared pairwise, and the judgment matrix A can be generated, as shown in Table 3.
After determining the judgment matrix, the sum–product approach is employed to obtain the largest eigenvalue. The associated eigenvector of the judgment matrix Equation (8) determines the weight assigned to each fracability-influencing factor.
W i = j = 1 n a i j k = 1 n a k j n ,   i = 1 ,   2 ,   3 ,   n
where the number a i j represents the magnitude of factors in the matrix.
It is worth noting that the units, dimensions, and numerical ranges of these influencing factors differ, and direct comparisons are difficult. Therefore, each variable should be normalized in order to perform a proper assessment of shale fracability. Several authors have reported that the higher the BI and brittle mineral content in shale, the higher the fracability, i.e., directly proportional to the fracability [6,59]. On the other hand, lower fracture toughness values and minimum horizontal in-situ stress imply higher shale fracability, which is negatively correlated with fracability.
The positive and negative indices are normalized as:
X j = Z Z m i n Z m a x Z m i n   f o r   p o s i t i v e   f a c t o r s , X j = Z m a x Z Z m a x Z m i n   f o r   n e g a t i v e   f a c t o r s
where X j is the standardized value of the variables, Z is the variable’s value, Zmax and Zmin is the maximum and minimum value of the variables, respectively. The normalized factor X j   j = 1 ,   2 ,   3 ,   4 ,   5 is based on the brittleness index, brittle mineral content, fracture toughness, minimum horizontal stress, and temperature, respectively.
Analytical hierarchy is a method of making decisions that utilizes subjective evaluations to determine the relative importance of influencing factors. The analytical hierarchy method entails comparing and scaling the significance of the five factors with respect to fracability, i.e., determining the significance scale aij of one factor in comparison to another. To estimate the weight of each influencing factor, a matrix (aij) of its scales is constructed using Equation (8). Based on the parametric evaluation conducted from the majority of existing studies and the above analysis of factors influencing fracability in the scale matrix, brittleness is considered to be the most significant influencing factor on the fracability of rock. It is followed by fracture toughness, brittle mineral contents, minimum horizontal stress, and temperature.
Based on the relationship between the rock’s fracability and influencing factors, we suggest an improved fracability index (FIimp) evaluation model by incorporating the influence of multiple factors (Equation (10)). This model has been applied to geothermal wells to quantify the effects of hydraulic fracturing stimulation on geothermal productivity.
F I i m p i = j = 1 n W j i X j i ,
where F I i m p i reflects the shale fracability of the ith set and can be defined as the improved fracability index, w j i describes the weight given to the influencing factor, i.e., BI, brittle minerals content, KIC, and minimum horizontal stress, and x j i for the normalized value of each influencing factor. The positive and negative indicators are averaged after the extreme value transformation. The optimal value of the indicator is 1, and the adverse value is 0.

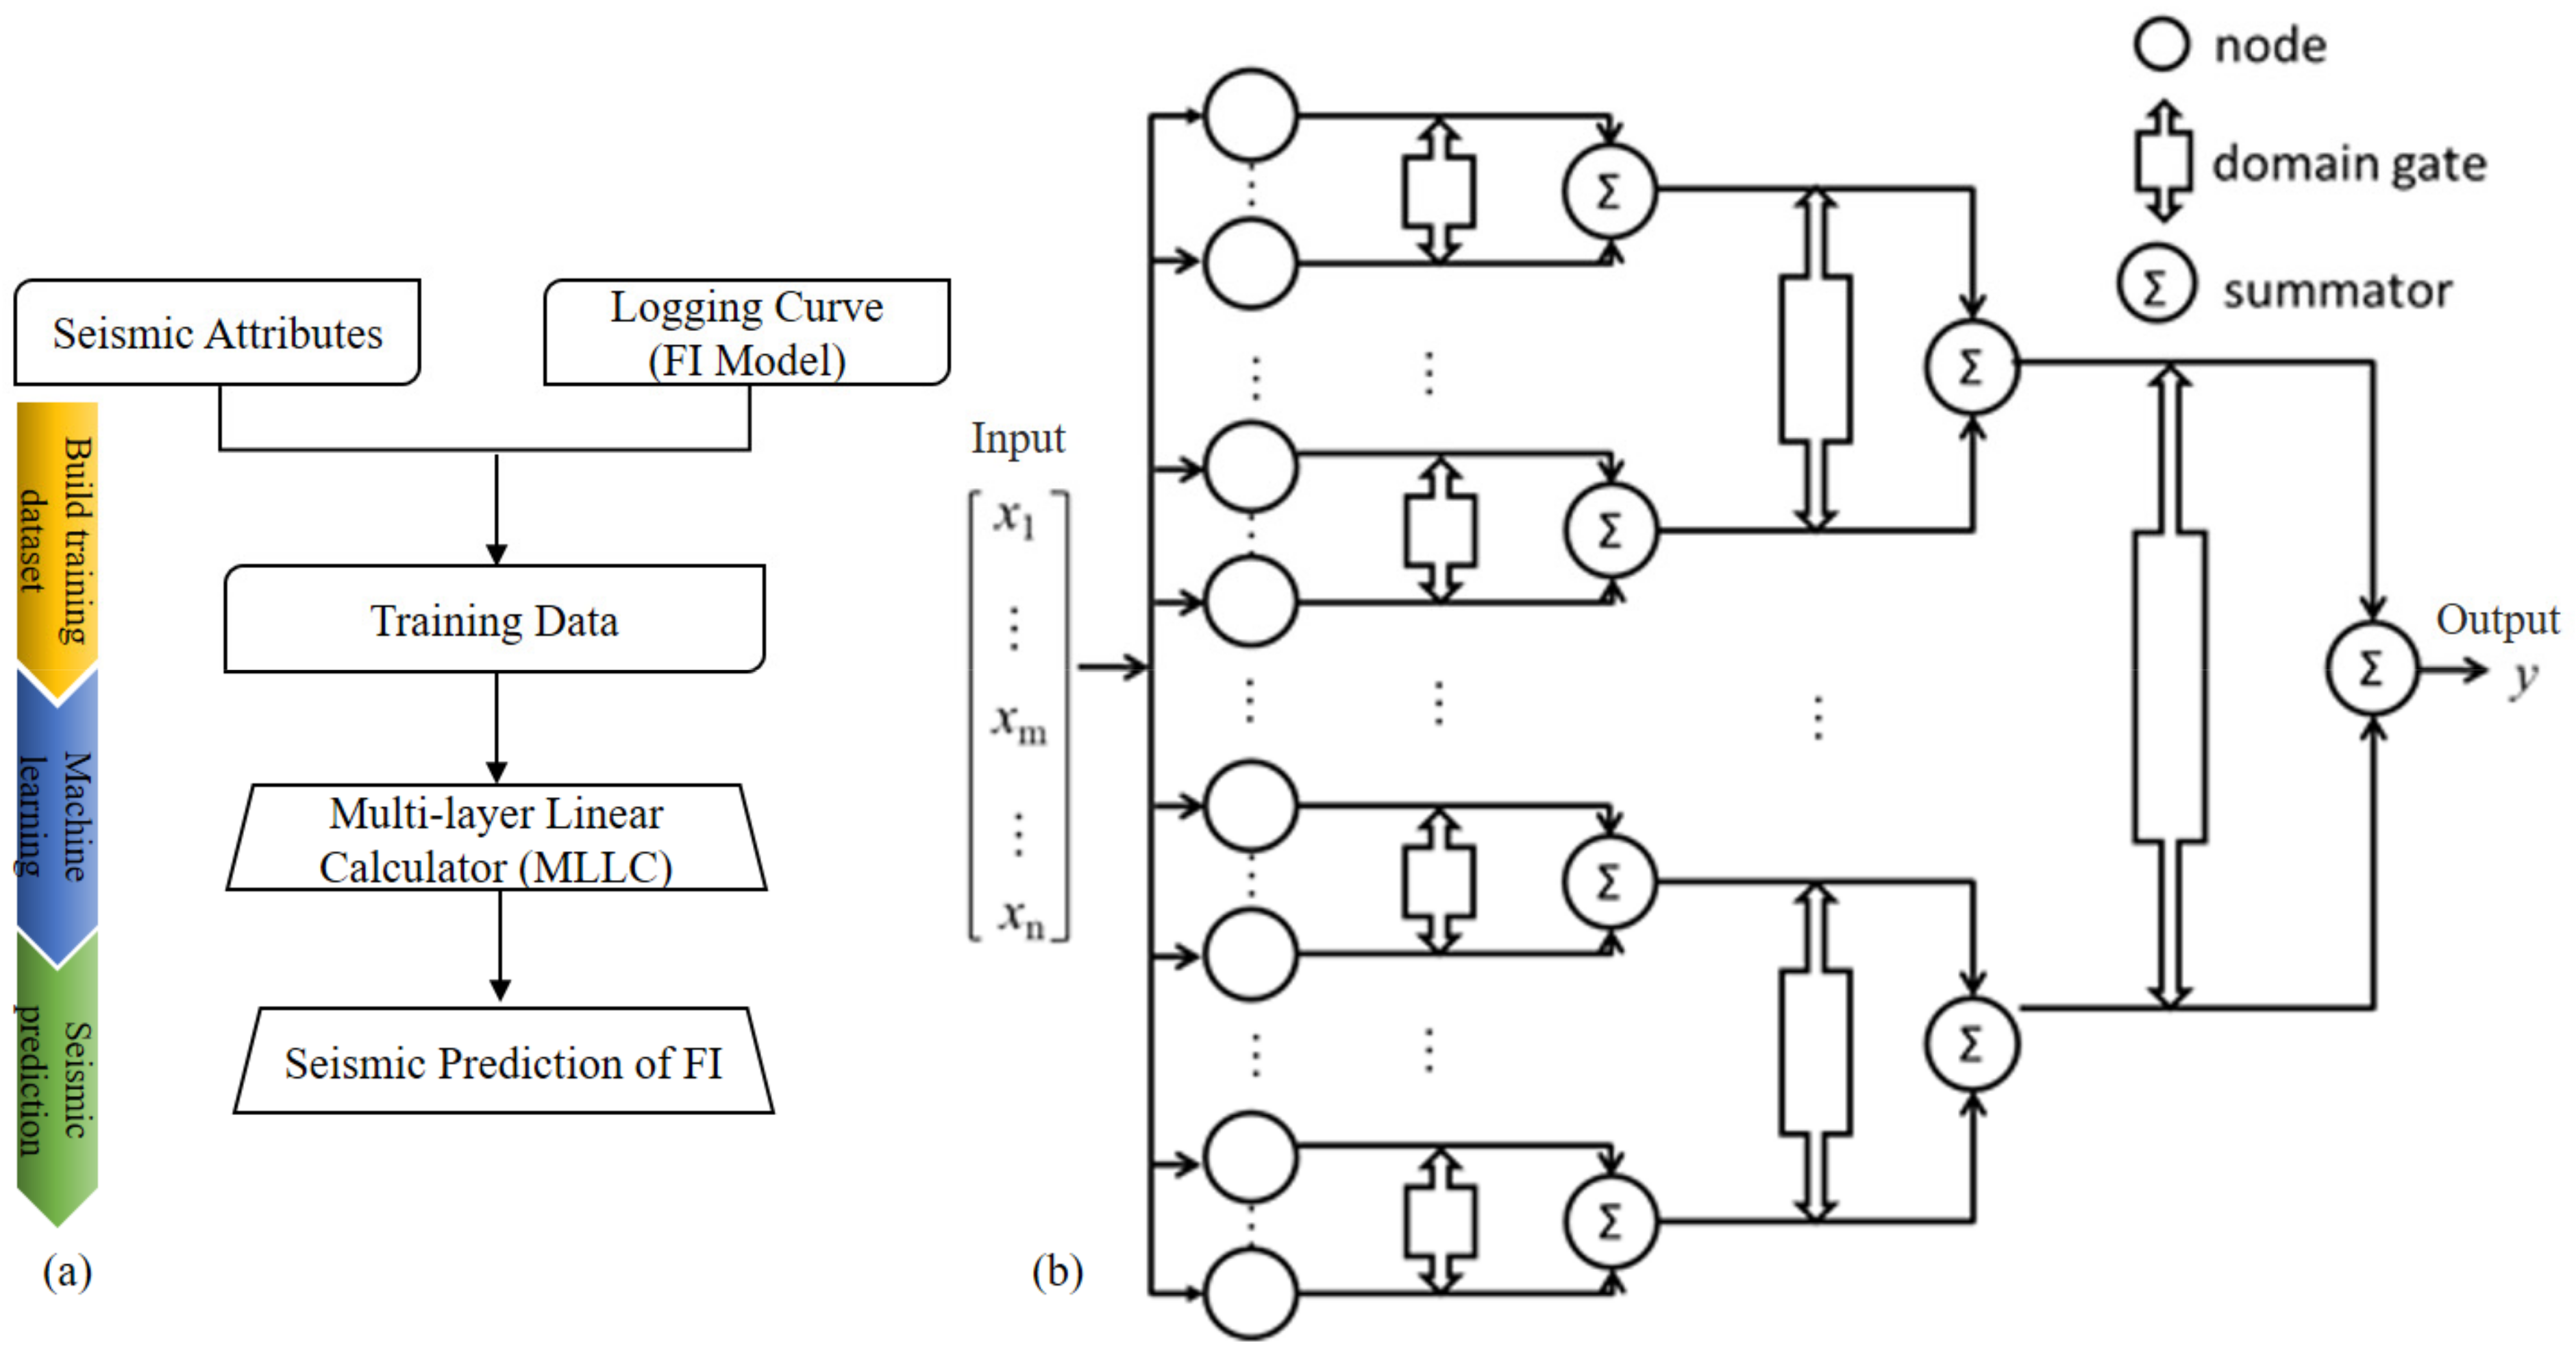
3.3. Workflow for Seismic Prediction of FI with Multi-Layer Linear Calculator

Seismic data inversion was performed with a neural network that builds a relationship between a known label of an input well and seismic data during training. Multi-layer linear calculators (MLLC) model composed of multiple linear notes and domain gates can be used to divide the nonlinear projection relationship between well-log model parameters and seismic attributes (Equations (11) and (12)) [60]. Each layer’s output weight is controlled by its domain gate. The output ‘y’ is calculated using an MLLC inversion model for input value ‘x’ (seismic characteristics) [61]. Figure 5 illustrates the workflow and structure of the MLLC algorithm for establishing a nonlinear projection relationship with well-log FI models and seismic attributes.
y = f i = 1 n x i w i + b
f = 1 1 + j = 1 1 e x p i = 0 n x i w i + b

4. Results and Discussion

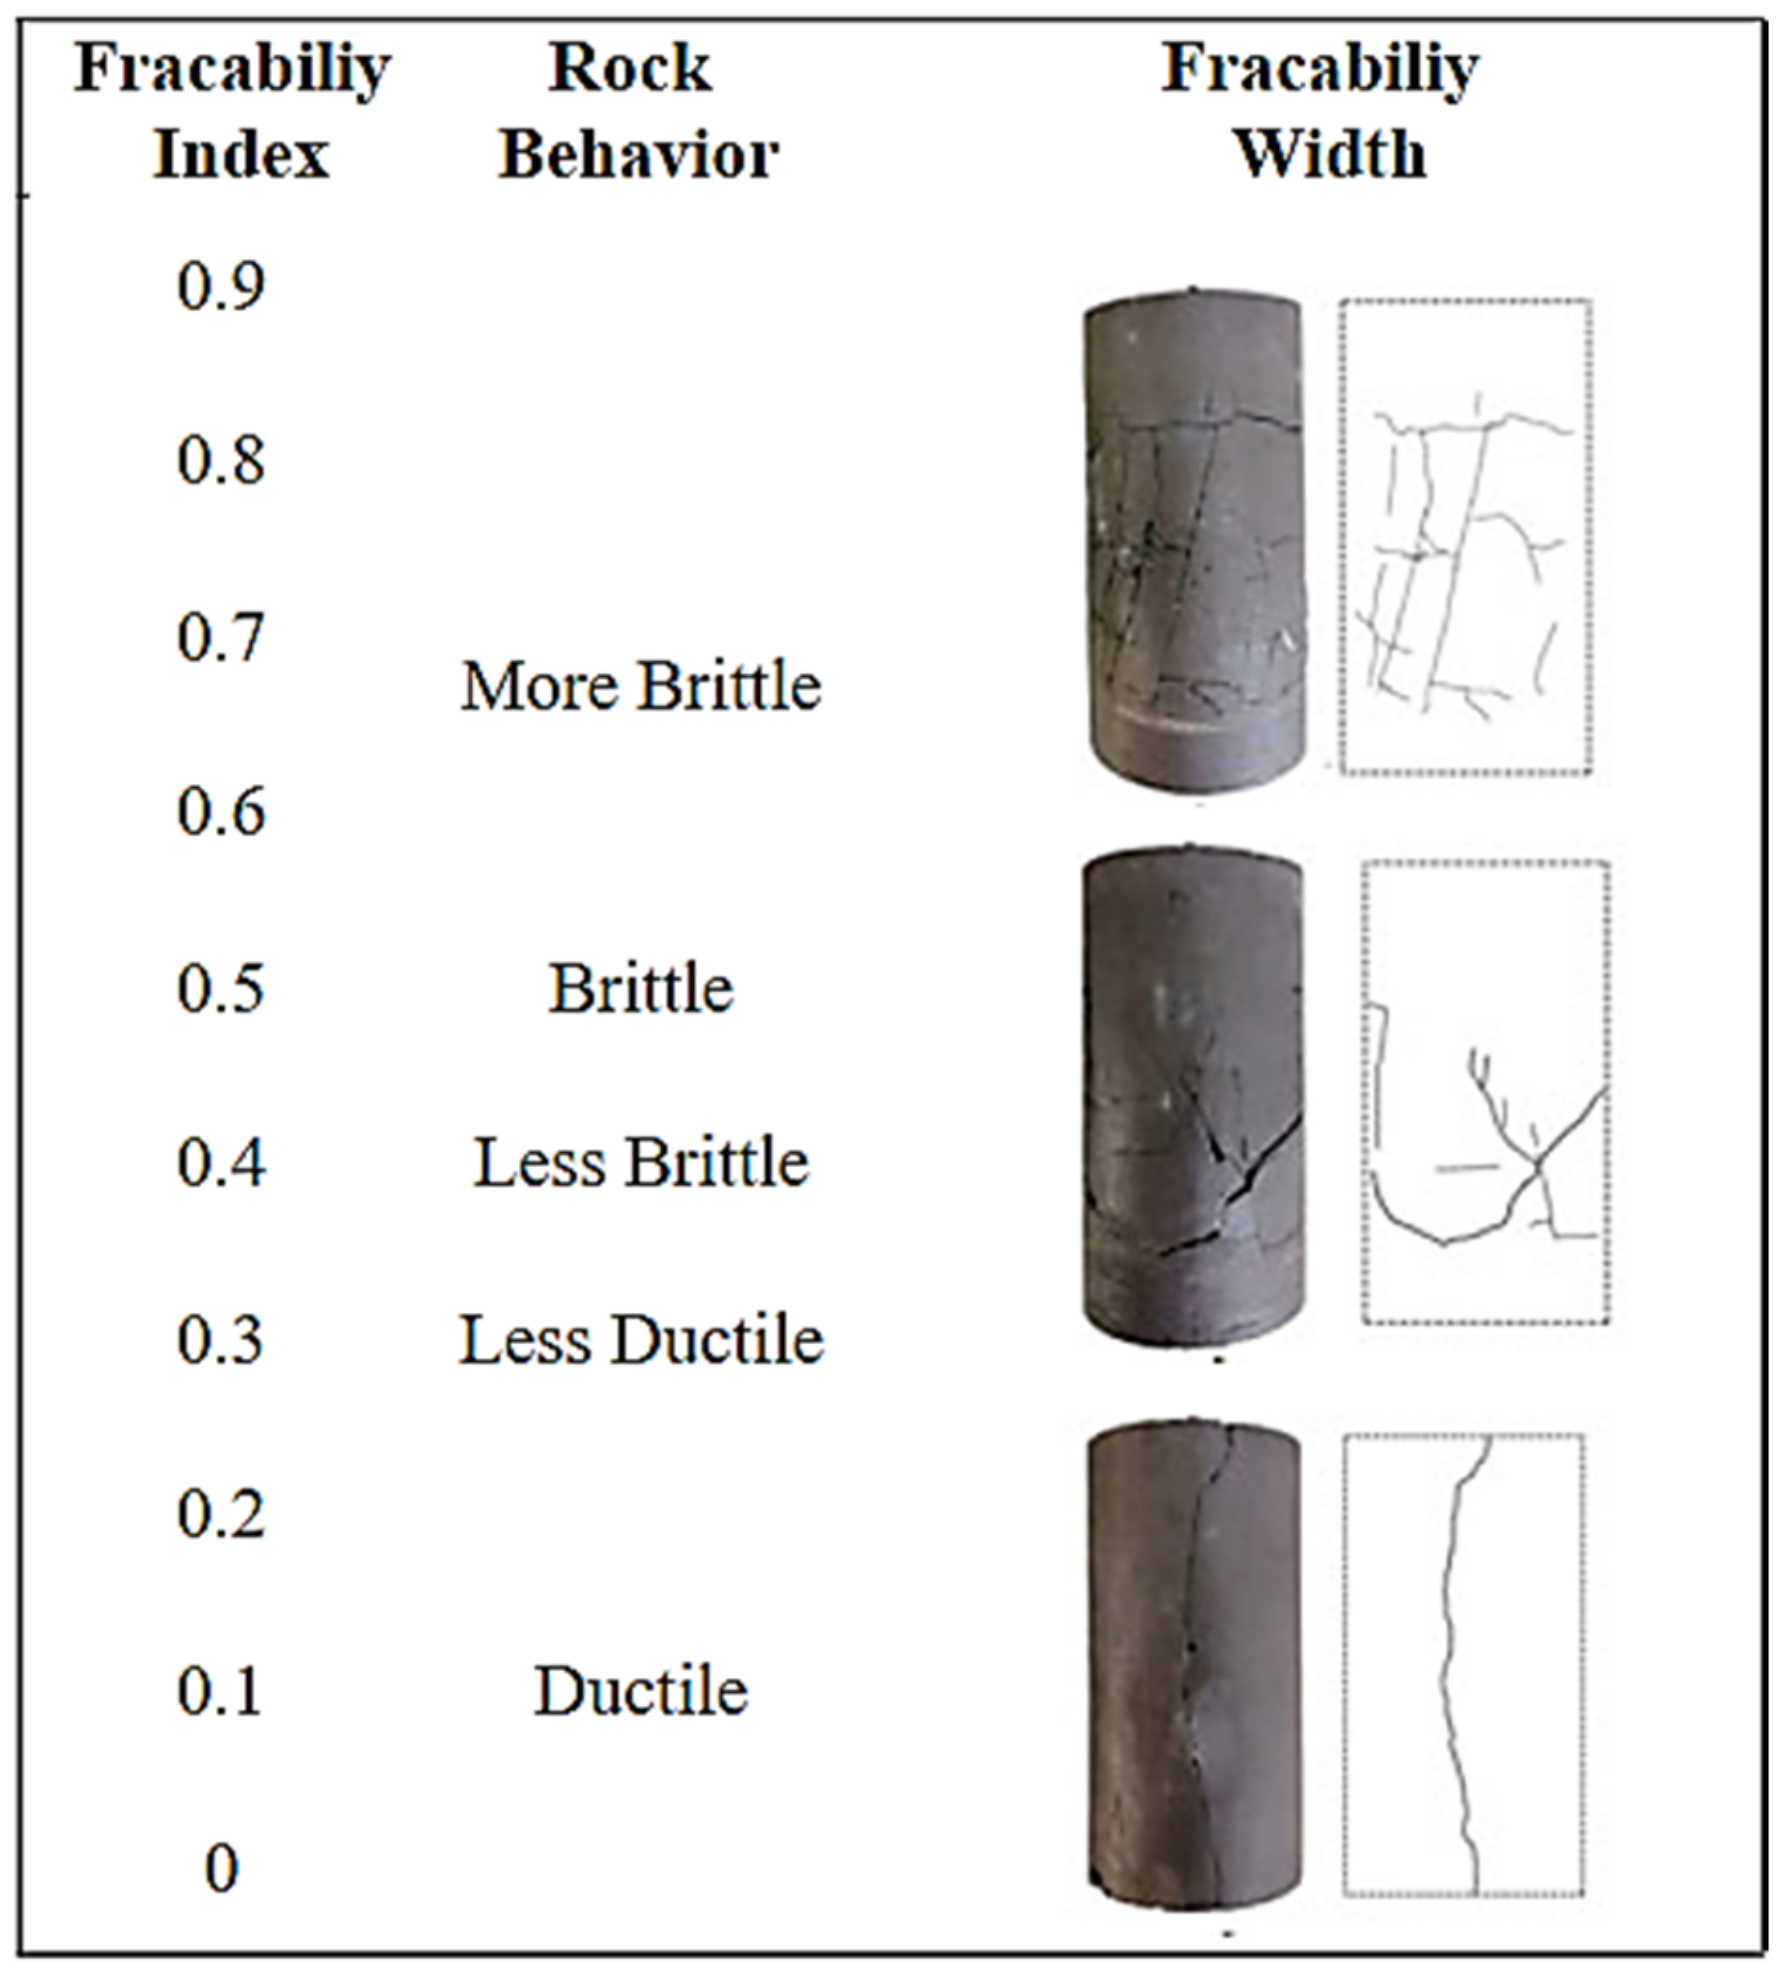
4.1. Fracability Index Classification

Fracability index values determine how easy it is to generate hydraulic fractures. Typically, a hydraulic fracturing expert defines a fracability index cutoff value by comparing the results from geological interpretation as well as logging and production data. The cutoff values for the fracability index represent the rock intervals where hydraulic fractures are more easily developed. The rock with a fracability index less than the cutoff value is generally referred to as a fracture barrier. In comparison, the rock with a fracability index greater than the cutoff value is regarded as a more fracable interval. Wu et al. [12] proposed a fracability index cutoff value of 0.598. Later, Sui et al. [62] and Ibrahim et al. [63] modified the fracability index cutoff value and suggested that rock intervals greater than 0.45 are more fracable.
The fracability of the geothermal and shale reservoirs at each point in the vertical long section is determined by substituting the values from Equations (8) and (9) into Equation (10) and establishing the relationship between Young’s modulus and Poisson’s ratio with improved FI. We divide the rock’s fracability into three levels based on the above cutoff values proposed by the previous authors and the crossplots between Young’s modulus and Poisson’s ratio with improved FI and fracture density (determined from FMI logs). We further classified the improved FI between 0.39 and 0.49 for less brittle, greater than 0.59 for highly brittle, and lower than 0.29 for ductile (Figure 6, shown with dotted lines).

4.2. Hydraulic Fracturing in Geothermal Reservoirs

The study area for geothermal reservoirs is located in the northeastern part of the Zhuangxi–Gudong buried-hill belt in Zhanhua Sag, China [64]. It is composed of a large buried-hill anticline structure that developed during the Paleozoic period. Limestone and dolomite dominate the lithology, with a high-angle fracture network. The oolitic limestone of the Zhangxia Formation is well-developed, with many high-angle fractures and few low-angle fractures [57]. A buried-hill structure is comprised primarily of limestone and dolomite (Paleozoic), both of which possess substantial geothermal potential. The historical tectonic period was also characterized by the development of karsts, which provided an appropriate location for storing hot water. The geothermal reservoir’s burial depth in the study area ranges between 2000 m and 5000 m. Xing et al. [65] performed a linear fit on the temperature and depth data to determine the geothermal gradient. The data show a consistent gradient ranging from 27.4 °C/km to 39.7 °C/km, with an average of 34.7 °C/km. Geothermal reservoirs in the study area have temperatures greater than 140 degrees, which are classified as middle–low temperature geothermal reservoirs compared to those in Germany (see Table 1).
Several abandoned oil and gas wells from the northeast China oil field have been analyzed to assess the prospects of low permeable carbonate geothermal reservoirs. The fracability of the geothermal reservoir in Well-1 is generally good except below 4600 m (Figure 7). In this section (4200–4580 m), the fracability is greater than 0.59. This is an excellent reservoir section capable of forming a complex fracture network system during hydraulic fracturing for EGS. From Figure 7, the rock is characterized by high value, e.g., FI > 0.59, where it is easier to generate complex fracture networks. In other words, the efficiency of energy transmission should be improved. A similar trend can also be observed with elastic parameters such as Young’s modulus and Poisson’s ratio. However, the fracability below 4600 m is moderate. An improved fracture network may be achieved by varying the displacement and viscosity of the fracturing fluid during fracturing. Low porosity and permeability values exist in the high FI zones (4200–4580 m), which indicates high-temperature reservoirs [66].
In Well-3, geothermal reservoirs also exhibit high fracability (e.g., FI > 0.60) throughout the reservoir section, except the upper part of the reservoir, where FI is less than 0.40 (Figure 8). Furthermore, it can form a complex fracture network during hydraulic fracturing for EGS due to its good reservoir characteristics in the middle part. The elastic parameters, such as Poisson’s ratio and Young’s modulus, are consistent with the FI. Comparatively, fracability below 3340 m is relatively low (e.g., FI < 0.60). Porosity and permeability are low in FI zones, indicating high temperatures [66].

4.3. Hydraulic Fracturing in Shale Gas Well

A shale gas horizontal well in the Sichuan basin in China was used as an example to test the reliability of the improved fracability index model using well-logs data [1,6]. Fracability of horizontal shale gas well is generally favorable, particularly between 2490 to 2520 m and 2410 to 2460 m. These high-quality reservoir sections were easy to fracture into a complex fracture network system (HF column, shown in red). The improved fracability index model demonstrates high-quality reservoir sections along the hydraulic fractured zones, resulting in the development of a complex fracture network system (Figure 9).

4.4. Quantitative Seismic Prediction of FI

The seismic reflection data was further analyzed and transformed into the spatial variability of fracability using the improved FI model. We applied a MLLC neural network to predict the spatial variations of FI from seismic inversion. Figure 10 shows the results of applying the MLLC neural network inversion approach to post-stack seismic data. The inverted FI profile over Well-1, Well-2, Well-3, and Well-4 indicates that the Paleozoic formation above Well-3 and Well-4 is ductile and difficult to fracture during EGS. The FI on the top of the Paleozoic formation in the low section around Well-1 and Well-2 tends to be more brittle (FI > 0.6) and to fracture more easily during hydraulic fracturing for EGS (Figure 10, shown with an arrow). The middle part of the Paleozoic is less brittle (e.g., 0.5 > FI > 0.2) but has considerable lateral connectivity. According to our results, the top portion of the Paleozoic formation has a high FI and correlates to a zone with more fracability and EGS prospectivity. Furthermore, the FI seismic inversion profile correlates well with the fracability index obtained from well logs; for instance, Well-3 (Figure 8) has a low FI, which corresponds to a low fracability in the seismic inversion profile (Figure 10).

4.5. Analysis of Hydraulic Fracturing

The complexity of fractures generated in the reservoir is an essential component of hydraulic fracturing [67]. The fracture complexity was classified by Warpinski et al. [68] into four categories: (a) simple planar fracture, (b) multiple complex fracture, (c) complex fracture with pre-existing open fractures, and (d) complex fracture network. Yasin et al. [1] coupled the fracability index to fracture complexity for a better understanding of the fracture propagation behavior of hydraulic fractures in rocks (Figure 11). It is shown that injecting fracturing fluid into the rock creates a complex fracture network when the fracability index is higher than 0.48. Subsequently, if the fracability index is between 0.32 and 0.48, the fracturing fluid injection will produce complex multiple fractures with the crack opening. However, it is important to utilize a fracturing fluid with lower viscosity or maintain a higher pressure in the fracture during hydraulic fracturing to develop a complex fracture network. If the fracability index is less than 0.32, the injected fracturing fluid will generate a simple or complex fracture. However, the fractures are easily closed after hydraulic fracturing, implying a poor reservoir. The improved fracability index values derived for the geothermal reservoir and shale gas formation indicate a complex fracture network, and the reservoirs act as brittle.

5. Conclusions

  • Rock fracability in HDR is primarily controlled by the temperature, brittleness index, brittle mineral composition, fracture toughness, and the magnitude of stresses. The analytical hierarchy process was used to develop a continuous fracability evaluation mathematical model by integrating qualitative and quantitative approaches. The model quantifies the strength of low permeability carbonate geothermal reservoirs and horizontal sections of shale fracability.
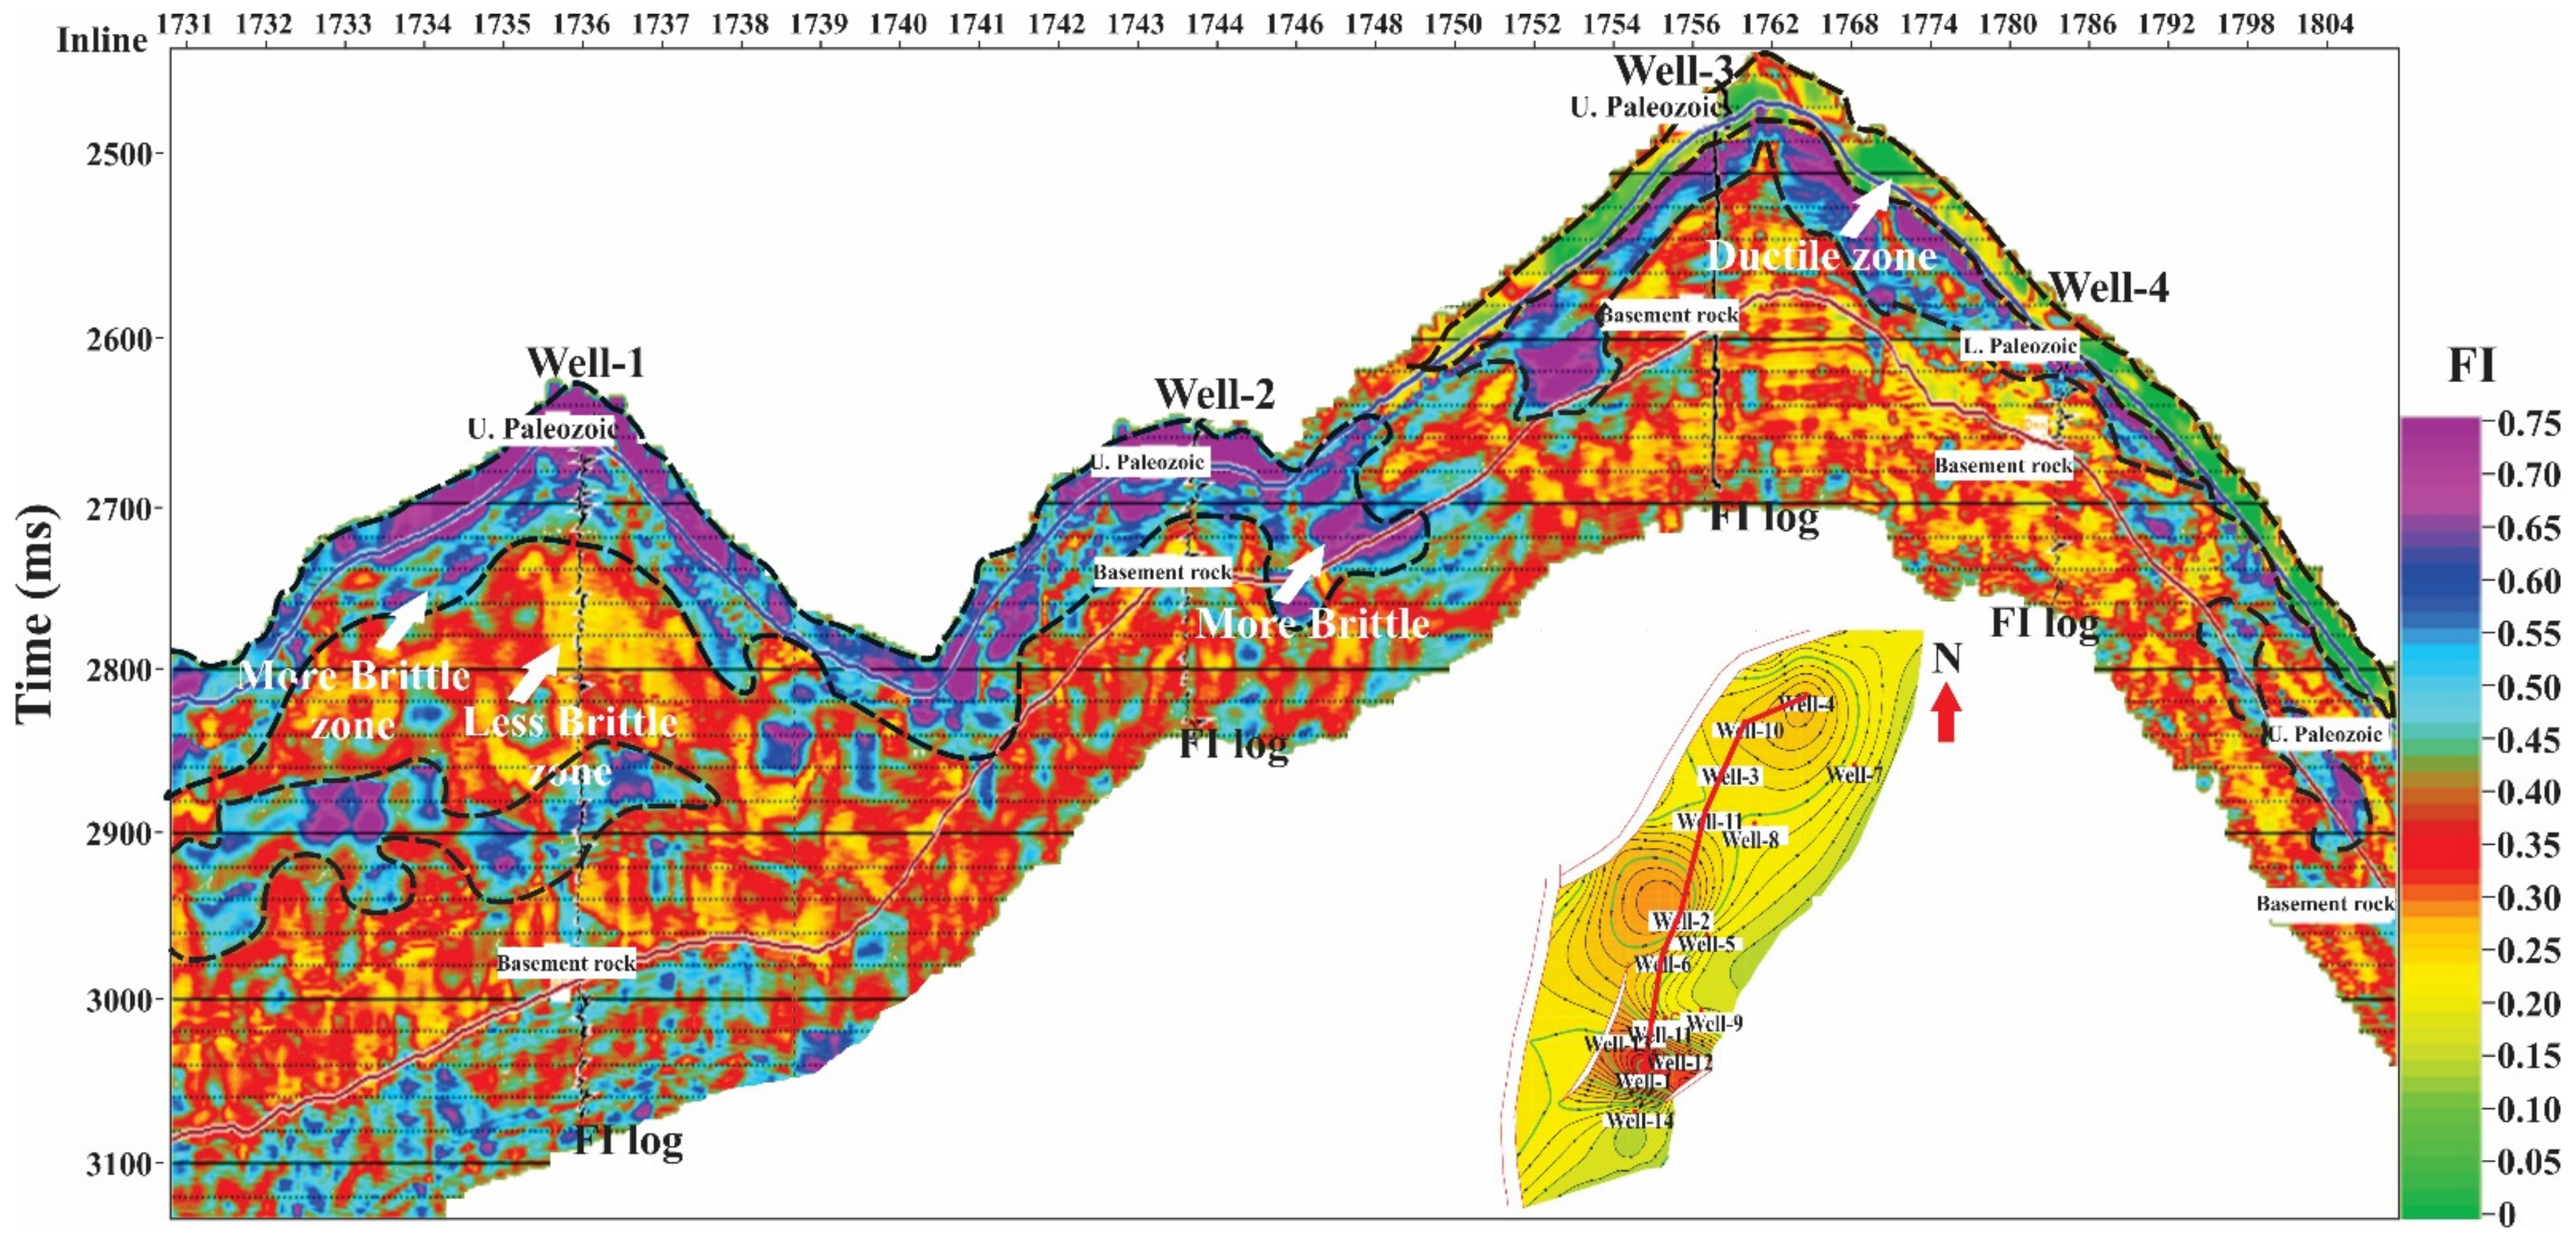
  • The improved fracability index model demonstrates a high-quality geothermal reservoir section along low permeability zones and can be utilized confidently to generate a complex fracture network system during hydraulic fracturing for EGS. Seismic inversion profiles indicate high FI and brittle behavior on top of the Paleozoic formation in the low parts of Well-1 and Well-2. Meanwhile, the top of the Paleozoic formation around Well-3 and Well-4 is ductile and difficult to fracture during hydraulic fracturing for EGS.
  • The field case study for low permeability geothermal reservoirs shows that the carbonate rocks are prone to fracture and have high heat and flow exchange efficiency. The rock has the highest potential for EGS.
  • The study took into account a wide range of geomechanical and petrophysical properties as well as temperature effects to quantify rock fracability. Still, it has some limitations that need improvement in future studies. Furthermore, acid dissolution, pore structure, and fluid type can enhance geothermal rock permeability in addition to its geomechanical properties. This is especially true of carbonate reservoir exploration since it is an incredibly effective method to fracture the reservoirs.
  • We believe that the improved fracability index and case studies will serve as practical examples for future research in similar areas, particularly in carbonate geothermal reservoirs.

Author Contributions

Conceptualization, Q.Y.; methodology, Q.Y. and N.G.; formal analysis, M.M. and R.S.A.; investigation, Q.Y. and N.G.; resources, Q.Y. and N.G.; writing—original draft preparation, Q.Y.; writing—review and editing, M.M.; visualization, R.S.A.; supervision, M.M. All authors have read and agreed to the published version of the manuscript.

Funding

This research was funded by the National Natural Science Foundation of China, grant number [42150410396].

Institutional Review Board Statement

Not applicable.

Informed Consent Statement

Not applicable.

Data Availability Statement

Not applicable.

Acknowledgments

This work was supported financially by the National Natural Science Foundation of China (Grant No. 42150410396). We would like to thank the Shandong University of Science and Technology, Qingdao, China, for allowing us to use well logs and seismic datasets for this project. Seismic experiments were conducted at the Institute of Geophysics, Polish Academy of Sciences, Warsaw, Poland.

Conflicts of Interest

The authors declare no conflict of interest.

References

  1. Yasin, Q.; Du, Q.; Sohail, G.M.; Ismail, A. Fracturing index-based brittleness prediction from geophysical logging data: Application to Longmaxi shale. Geomech. Geophys. Geo-Energ. Geo-Resour. 2018, 4, 301–325. [Google Scholar] [CrossRef]
  2. Li, Z.; Li, L.; Li, M.; Zhang, L.; Zhang, Z.; Huang, B.; Tang, C.A. A numerical investigation on the effects of rock brittleness on the hydraulic fractures in the shale reservoir. J. Nat. Gas Sci. Eng. 2018, 50, 22–32. [Google Scholar] [CrossRef]
  3. Rickman, R.; Mullen, M.; Petre, E.; Grieser, B.; Kundert, D. A Practical use of shale petrophysics for stimulation design optimization: All shale plays are not clones of the barnett shale. In Proceedings of the SPE Annual Technical Conference and Exhibition, Denver, CO, USA, 21–24 September 2008; p. SPE-115258-MS. [Google Scholar]
  4. Sone, H.; Zoback, M. Mechanical properties of shale-gas reservoir rocks—Part 1: Static and dynamic elastic properties and anisotropy. Geophysics 2013, 78, 381–392. [Google Scholar] [CrossRef] [Green Version]
  5. Yuan, J.; Zhou, J.; Liu, S.; Feng, Y.; Deng, J.; Xie, Q.; Lu, Z. An Improved Fracability-Evaluation Method for Shale Reservoirs Based on New Fracture Toughness-Prediction Models. SPE J. 2017, 22, 1704–1713. [Google Scholar] [CrossRef]
  6. Yasin, Q.; Sohail, G.M.; Liu, K.-Y.; Du, Q.-Z.; Boateng, C.D. Study on brittleness templates for shale gas reservoirs-A case study of Longmaxi shale in Sichuan Basin, southern China. Pet. Sci. 2021, 18, 1370–1389. [Google Scholar] [CrossRef]
  7. Bai, M. Why are brittleness and fracability not equivalent in designing hydraulic fracturing in tight shale gas reservoirs. Petroleum 2016, 2, 1–19. [Google Scholar] [CrossRef] [Green Version]
  8. Guo, T.; Zhang, S.C.; Ge, H. A new method for evaluating ability of forming fracture network in shale reservoir. Rock Soil Mech. 2013, 34, 947–954. [Google Scholar]
  9. Hou, B.; Chen, M.; Li, Z.; Wang, Y.; Diao, C. Propagation area evaluation of hydraulic fracture networks in shale gas reservoirs. Pet. Explor. Dev. 2014, 41, 833–838. [Google Scholar] [CrossRef]
  10. Jin, X.; Shah, S.N.; Roegiers, J.-C.; Zhang, B. An Integrated Petrophysics and Geomechanics Approach for Fracability Evaluation in Shale Reservoirs. SPE J. 2015, 20, 518–526. [Google Scholar] [CrossRef]
  11. Sui, L.; Ju, Y.; Yang, Y.; Yang, Y.; Li, A. A quantification method for shale fracability based on analytic hierarchy process. Energy 2016, 115, 637–645. [Google Scholar] [CrossRef]
  12. Wu, J.; Zhang, S.; Cao, H.; Zheng, M.; Sun, P.; Luo, X. Fracability evaluation of shale gas reservoir-A case study in the Lower Cambrian Niutitang formation, northwestern Hunan, China. J. Pet. Sci. Eng. 2018, 164, 675–684. [Google Scholar] [CrossRef]
  13. Fan, Z.; Parashar, R. Analytical Solutions for a Wellbore Subjected to a Non-isothermal Fluid Flux: Implications for Optimizing Injection Rates, Fracture Reactivation, and EGS Hydraulic Stimulation. Rock Mech. Rock Eng. 2019, 52, 4715–4729. [Google Scholar] [CrossRef]
  14. McClure, M.W.; Horne, R.N. An investigation of stimulation mechanisms in Enhanced Geothermal Systems. Int. J. Rock Mech. Min. Sci. 2014, 72, 242–260. [Google Scholar] [CrossRef] [Green Version]
  15. Li, Y.; Pan, Y.; Liu, B.; Shi, Y.; Wei, J.; Li, W. Study on CO2 foam fracturing model and fracture propagation simulation. Energy 2022, 238, 121778. [Google Scholar] [CrossRef]
  16. Mulyadi. Case study: ‘Hydraulic fracturing experience in the wayang windu geothermal field’. In Proceedings of the World Geothermal Congress 2010, Bali, Indonesia, 25–29 April 2010. [Google Scholar]
  17. Tester, J.; Anderson, B.; Batchelor, A.; Blackwell, D.; DiPippo, R.; Drake, M.; Garnish, J.; Livesay, B.; Moore, M. The Future of Geothermal Energy—Impact of Enhanced Geothermal Systems (EGS) on the United States in the 21st Century; Massachusetts Institute of Technology: Cambridge, MA, USA; Idaho National Laboratory: Idaho Falls, ID, USA, 2006. [Google Scholar]
  18. Moska, R.; Labus, K.; Kasza, P. Hydraulic Fracturing in Enhanced Geothermal Systems—Field, Tectonic and Rock Mechanics Conditions—A Review. Energies 2021, 14, 5725. [Google Scholar] [CrossRef]
  19. Zhou, L.; Zhu, Z.; Xie, X.; Hu, Y. Coupled thermal–hydraulic–mechanical model for an enhanced geothermal system and numerical analysis of its heat mining performance. Renew. Energy 2022, 181, 1440–1458. [Google Scholar] [CrossRef]
  20. Ai, K.; Duan, L.; Gao, H.; Jia, G. Hydraulic Fracturing Treatment Optimization for Low Permeability Reservoirs Based on Unified Fracture Design. Energies 2018, 11, 1720. [Google Scholar] [CrossRef] [Green Version]
  21. Amiri, H.; Ramezanzadeh, A.; Parhizgar, M. Candidate well selection for hydraulic fracturing treatment—New fracability index based on a case study in a fractured carbonate reservoir in Iran. In Proceedings of the 79th EAGE Conference and Exhibition, Paris, France, 12–15 June 2017. [Google Scholar]
  22. Gandossi, L. An Overview of Hydraulic Fracturing and Other Formation Stimulation Technologies for Shale Gas Production; Publications Office of the European Union: Luxembourg, 2016. [Google Scholar]
  23. Britt, L. Fracture stimulation fundamentals. J. Nat. Gas Sci. Eng. 2012, 8, 34–51. [Google Scholar] [CrossRef]
  24. Casini, M.; Ciuffi, S.; Fiordelisi, A.; Mazzotti, A.; Stucchi, E. Results of a 3D seismic survey at the Travale (Italy) test site. Geothermics 2010, 39, 4–12. [Google Scholar] [CrossRef]
  25. Baujard, C.; Genter, A.; Dalmais, E.; Maurer, V.; Hehn, R.; Rosillette, R.; Vidal, J.; Schmittbuhl, J. Hydrothermal characterization of wells GRT-1 and GRT-2 in Rittershoffen, France: Implications on the understanding of natural flow systems in the rhine graben. Geothermics 2017, 65, 255–268. [Google Scholar] [CrossRef] [Green Version]
  26. Lengliné, O.; Boubacar, M.; Schmittbuhl, J. Seismicity related to the hydraulic stimulation of GRT1, Rittershoffen, France. Geophys. J. Int. 2017, 208, 1704–1715. [Google Scholar] [CrossRef]
  27. Morris, C.W.; Sinclair, A.R. Evaluation Of Bottomhole Treatment Pressure for Geothermal Well Hydraulic Fracture Stimulation. J. Pet. Technol. 1984, 36, 829–836. [Google Scholar] [CrossRef]
  28. Siler, D.L.; Faulds, J.E.; Hinz, N.H.; Dering, G.M.; Edwards, J.H.; Mayhew, B. Three-dimensional geologic mapping to assess geothermal potential: Examples from Nevada and Oregon. Geotherm. Energy 2019, 7, 2. [Google Scholar] [CrossRef] [Green Version]
  29. Legarth, B.; Huenges, E.; Zimmermann, G. Hydraulic fracturing in a sedimentary geothermal reservoir: Results and implications. Int. J. Rock Mech. Min. Sci. 2005, 42, 1028–1041. [Google Scholar] [CrossRef]
  30. Lei, Z.; Zhang, Y.; Yu, Z.; Hu, Z.; Li, L.; Zhang, S.; Fu, L.; Zhou, L.; Xie, Y. Exploratory research into the enhanced geothermal system power generation project: The Qiabuqia geothermal field, Northwest China. Renew. Energy 2019, 139, 52–70. [Google Scholar] [CrossRef]
  31. Norbeck, J.H.; McClure, M.W.; Horne, R.N. Field observations at the Fenton Hill enhanced geothermal system test site support mixed-mechanism stimulation. Geothermics 2018, 74, 135–149. [Google Scholar] [CrossRef]
  32. Wyborn, D.; de Graaf, L.; Davidson, S.; Hann, S. Development of Australia’s first hot Fractured Rock (HFR) underground heat exchanger, Cooper Basin, South Australia. In Proceedings of the World Geothermal Congress 2005, Antalya, Turkey, 24–29 April 2005. [Google Scholar]
  33. Holl, H.-G.; Barton, C. Habanero field—Structure and state of stress. In Proceedings of the World Geothermal Congress, Melbourne, Australia, 19–25April 2015. [Google Scholar]
  34. Holl, H.-G. What Did we Learn about EGS in the Cooper Basin? Geodynamics Limited: London, UK, 2015. [Google Scholar]
  35. Vidal, J.; Genter, A. Overview of naturally permeable fractured reservoirs in the central and southern Upper Rhine Graben: Insights from geothermal wells. Geothermics 2018, 74, 57–73. [Google Scholar] [CrossRef]
  36. Schindler, M.; Nami, P.; Schellschmidt, R.; Teza, D.; Tischner, T. Summary of Hydraulic Stimulation Operations in the 5 km Deep Crystalline HDR/EGS Reservoir at Soultz-Sous-Forêts. In Proceedings of the Thirty-Third Workshop on Geothermal Reservoir Engineering, Stanford University, Stanford, CA, USA, 28–30 January 2008. SGP-TR-185. [Google Scholar]
  37. Moeck, I.; Schandelmeier, H.; Holl, H.-G. The stress regime in a Rotliegend reservoir of the Northeast German Basin. Int. J. Earth Sci. 2009, 98, 1643–1654. [Google Scholar] [CrossRef] [Green Version]
  38. Moeck, I.S. Catalog of geothermal play types based on geologic controls. Renew. Sustain. Energy Rev. 2014, 37, 867–882. [Google Scholar] [CrossRef] [Green Version]
  39. Park, S.; Kim, K.-I.; Xie, L.; Yoo, H.; Min, K.-B.; Kim, M.; Yoon, B.; Kim, K.Y.; Zimmermann, G.; Guinot, F.; et al. Observations and analyses of the first two hydraulic stimulations in the Pohang geothermal development site, South Korea. Geothermics 2020, 88, 101905. [Google Scholar] [CrossRef]
  40. Kwon, S.; Xie, L.; Park, S.; Kim, K.-I.; Min, K.-B.; Kim, K.Y.; Zhuang, L.; Choi, J.; Kim, H.; Lee, T.J. Characterization of 4.2-km-Deep Fractured Granodiorite Cores from Pohang Geothermal Reservoir, Korea. Rock Mech. Rock Eng. 2019, 52, 771–782. [Google Scholar] [CrossRef]
  41. Sowiżdżał, A.; Gładysz, P.; Pająk, L. Sustainable Use of Petrothermal Resources—A Review of the Geological Conditions in Poland. Resources 2021, 10, 8. [Google Scholar] [CrossRef]
  42. Wójcicki, A.; Sowiżdżał, A.; Bujakowski, W. Ocena Potencjału, Bilansu Cieplnego i Perspektywicznych Struktur Geologicznych dla Potrzeb Zamkniętych Systemów Geotermicznych (Hot Dry Rocks) w Polsce; Ministerstwo Środowiska: Warsaw, Poland, 2013.
  43. Zuchiewicz, W.; Badura, J.; Jarosinski, M. Neotectonics of Poland: Selected examples. Biul. Panstw. Inst. Geol. 2007, 425, 105–128. [Google Scholar]
  44. Zhang, H.; Wan, Z.; Elsworth, D. Failure Behavior of Hot-Dry-Rock (HDR) in Enhanced Geothermal Systems: Macro to Micro Scale Effects. Geofluids 2020, 2020, 8878179. [Google Scholar] [CrossRef]
  45. Zimmermann, G.; Blöcher, G.; Reinicke, A.; Brandt, W. Rock specific hydraulic fracturing and matrix acidizing to enhance a geothermal system—Concepts and field results. Tectonophysics 2011, 503, 146–154. [Google Scholar] [CrossRef] [Green Version]
  46. Zoback, M.D. Reservoir Geomechanics; Cambridge University Press: Cambridge, UK, 2007. [Google Scholar]
  47. Zhang, D.; Ranjith, P.G.; Perera, M.S.A. The brittleness indices used in rock mechanics and their application in shale hydraulic fracturing: A review. J. Pet. Sci. Eng. 2016, 143, 158–170. [Google Scholar] [CrossRef]
  48. Jin, Y.; Yuan, J.; Chen, M.; Chen, K.; Lu, Y.; Wang, H. Determination of Rock Fracture Toughness K IIC and its Relationship with Tensile Strength. Rock Mech. Rock Eng. 2011, 44, 621–627. [Google Scholar] [CrossRef]
  49. Yasin, Q.; Baklouti, S.; Khalid, P.; Ali, S.H.; Boateng, C.D.; Du, Q. Evaluation of shale gas reservoirs in complex structural enclosures: A case study from Patala Formation in the Kohat-Potwar Plateau, Pakistan. J. Pet. Sci. Eng. 2021, 198, 108225. [Google Scholar] [CrossRef]
  50. Hu, Y.; Wu, K.; Chen, Z.; Zhang, K.; Ji, D.; Zhong, H.; Gonzalez Perdomo, M. A Novel Model of Brittleness Index for Shale Gas Reservoirs: Confining Pressure Effect. In Proceedings of the SPE Asia Pacific Unconventional Resources Conference and Exhibition, Brisbane, Australia, 9–11 November 2015. [Google Scholar]
  51. Waters, G.A.; Lewis, R.E.; Bentley, D.C. The Effect of Mechanical Properties Anisotropy in the Generation of Hydraulic Fractures in Organic Shales. In Proceedings of the SPE Annual Technical Conference and Exhibition, Denver, CO, USA, 30 October–2 November 2011; p. SPE-146776-MS. [Google Scholar]
  52. Zhang, L.-Y.; Ma, L.-C.; Zhuo, X.-Z.; Dong, M.; Li, B.-W.; Liu, S.-X.; Sun, D.-S.; Wu, D.; Zhou, X.-G. Mesozoic–Cenozoic stress field magnitude in Sichuan Basin, China and its adjacent areas and the implication on shale gas reservoir: Determination by acoustic emission in rocks. China Geol. 2020, 3, 591–601. [Google Scholar] [CrossRef]
  53. Pinińska, J. Wpływ podwyższonej temperatury na właściwości mechaniczne skał. Prace Naukowe Instytutu Geotechniki i Hydrotechniki Politechniki Wrocławskiej. Konferencje 2007, 76, 527–534. [Google Scholar]
  54. Wan, Z.-J.; Zhao, Y.-S.; Zhang, Y.; Wang, C. Research status quo and prospection of mechanical characteristics of rock under high temperature and high pressure. Procedia Earth Planet. Sci. 2009, 1, 565–570. [Google Scholar] [CrossRef] [Green Version]
  55. Fan, Z.Q.; Jin, Z.H.; Johnson, S.E. Modelling petroleum migration through microcrack propagation in transversely isotropic source rocks. Geophys. J. Int. 2012, 190, 179–187. [Google Scholar] [CrossRef] [Green Version]
  56. Jin, Z.H.; Johnson, S.E.; Fan, Z.Q. Subcritical propagation and coalescence of oil-filled cracks: Getting the oil out of low-permeability source rocks. Geophys. Res. Lett. 2010, 37, 1. [Google Scholar] [CrossRef]
  57. Yasin, Q.; Ding, Y.; Baklouti, S.; Boateng, C.D.; Du, Q.; Golsanami, N. An integrated fracture parameter prediction and characterization method in deeply-buried carbonate reservoirs based on deep neural network. J. Pet. Sci. Eng. 2022, 208, 109346. [Google Scholar] [CrossRef]
  58. Sharma, R.; Chopra, S.; Nemati, M.; Keay, J.; Lines, L. Integration of geomechanical and mineralogical data for fracability evaluation in Utica Shale play. In SEG Technical Program Expanded Abstracts 2017; Society of Exploration Geophysicists: Houston, TX, USA, 2017; pp. 3189–3193. [Google Scholar]
  59. Sohail, G.M.; Hawkes, C.D.; Yasin, Q. An integrated petrophysical and geomechanical characterization of Sembar Shale in the Lower Indus Basin, Pakistan, using well logs and seismic data. J. Nat. Gas Sci. Eng. 2020, 78, 103327. [Google Scholar] [CrossRef]
  60. Yasin, Q.; Sohail, G.M.; Ding, Y.; Ismail, A.; Du, Q. Estimation of Petrophysical Parameters from Seismic Inversion by Combining Particle Swarm Optimization and Multilayer Linear Calculator. Nat. Resour. Res. 2020, 29, 3291–3317. [Google Scholar] [CrossRef]
  61. Ding, Y.; Cui, M.; Zhao, F.; Shi, X.; Huang, K.; Yasin, Q. A Novel Neural Network for Seismic Anisotropy and Fracture Porosity Measurements in Carbonate Reservoirs. Arab. J. Sci. Eng. 2022, 47, 7219–7241. [Google Scholar] [CrossRef]
  62. Sui, H.; Gao, W.; Hu, R. A New Evaluation Method for the Fracability of a Shale Reservoir Based on the Structural Properties. Geofluids 2019, 2019, 2079458. [Google Scholar] [CrossRef] [Green Version]
  63. Ibrahim Mohamed, M.; Mohamed, M.; Coskuner, Y.; Ibrahim, M.; Pieprzica, C.; Ozkan, E. Integrated approach to evaluate rock brittleness and fracability for hydraulic fracturing optimization in shale gas. In Proceedings of the SPE Oklahoma City Oil and Gas Symposium, Oklahoma City, OK, USA, 9–10 April 2019. [Google Scholar]
  64. Sun, Z.; Lin, C.; Zhu, P.; Chen, J. Analysis and modeling of fluvial-reservoir petrophysical heterogeneity based on sealed coring wells and their test data, Guantao Formation, Shengli oilfield. J. Pet. Sci. Eng. 2018, 162, 785–800. [Google Scholar] [CrossRef]
  65. Xing, L.; Wang, W.; Xia, Z.; Chai, B.; Wang, Y. Evaluation of the Modification Potential for Carbonate Geothermal Rocks by considering Multiple Mechanics Properties and Acid Dissolution in the Jizhong Depression, China. Lithosphere 2022, 2021, 6289799. [Google Scholar] [CrossRef]
  66. Yao, T.Y.; Li, J.S.; Huang, Y.Z. Effects of temperature and stress on porosity and permeability of low permeability reservoir. J. Shenzhen Univ. Sci. Eng. 2012, 29, 154–158. [Google Scholar] [CrossRef]
  67. Li, Q.; Xing, H.; Liu, J.; Liu, X. A review on hydraulic fracturing of unconventional reservoir. Petroleum 2015, 1, 8–15. [Google Scholar] [CrossRef] [Green Version]
  68. Warpinski, N.R.; Mayerhofer, M.J.; Vincent, M.C.; Cipolla, C.L.; Lolon, E.P. Stimulating Unconventional Reservoirs: Maximizing Network Growth While Optimizing Fracture Conductivity. J. Can. Pet. Technol. 2009, 48, 39–51. [Google Scholar] [CrossRef]
Figure 1. Schematic diagram of the operation of an enhanced geothermal system (modified after Moska et al. [18] and Zhou et al. [19]).
Energies 15 07368 g001
Figure 2. Proposed workflow to develop fracability index model.
Energies 15 07368 g002
Figure 3. The effect of temperature on uniaxial compressive strength (UCS) in carbonate sedimentary rocks (modified after Pinińska, [53]).
Energies 15 07368 g003
Figure 4. The hierarchical framework of the variables influencing the fracability of rock.
Energies 15 07368 g004
Figure 5. (a) The workflow for seismic prediction of FI. (b) Structure of multi-layer linear calculator neural network.
Energies 15 07368 g005
Figure 6. Classification of fracability index in low permeability reservoirs.
Energies 15 07368 g006
Figure 7. Logging curve of a vertical section of geothermal reservoir in Well-1.
Energies 15 07368 g007
Figure 8. Logging curve of a vertical section of the geothermal reservoir in Well-3.
Energies 15 07368 g008
Figure 9. Logging curve of a horizontal section of shale gas well. The red box in column 2 indicates the hydraulic fracturing zone.
Energies 15 07368 g009
Figure 10. FI model seismic inversion profile across wells in the study area.
Energies 15 07368 g010
Figure 11. The improved fracability index to fracture complexity (modified after Yasin et al. [1]).
Energies 15 07368 g011
Table 1. Data compilation from EGS sites related to geology, tectonics, and fracturing. Where VP and VS = compressional or P- and shear or S-wave velocities in m/s, E = Young’s modulus (GPa), v = Poisson’s ratio, σv = Vertical stress, σh = Minimum horizontal stress (MPa), σH = Maximum horizontal stress (MPa), PP = Pore pressure (MPa).
EGS SiteTime DurationTarget Depth (m)Zone Temp. (°C)LithofaciesFault RegimesPrincipal Stresses (MPa)Ultrasonic VelocitiesFracturing Fluid
Qiabuqia (China)2016/17-present3700 [30]236 [30]Middle triassic granite, AnisianNormalσv = 96, σH = 88, σh = 70E = 48, v = 0.28, E = 42, v = 0.23 [30]HSP 20/40 cross-linked gel [30]
Fenton Hill (USA)1974–19954400 (EE-2 well) [17]327 at 4390 m [17]granodiorite, gneissstrike-slip/normal [31]σH = 25 σh = 16.2 PP = 10.1 [31]E = 18, v = 0.15 (3916 m).
4102 m depth: E= 33 v = 0.16 (4102 m) [17]
MHF—fresh water
[31]
Habanero Cooper Basin
(Australia)
2003–20164400 [32]248.5 [32]syenogranite, medium and coarse-grained [33]strike-slip,
reverse, and over-thrust [34]
σv = 98 σH = 151 σh = 123 PP = 73 [33]E = 65, v = 0.25 (3657 m)Fresh water [32]
Rhine Graben (Western
Europe)
2005-presentSoultz 5200 [35]200 [35]Porphyric granites MFK, two-mica granites. Carboniferous [36]Mixed, normal and strike-slip [25]σv = 54.8 σh = 29.6 PP = 22.5; [26]E (granite) = 80 GPa (Hydraulic conductivity zones)Brine, then MHF—fresh water [36]
GeneSys Hannover (Germany)2005–20133834 [37]168 [37]Buntsandstein sediments with low permeability (Permian)Normalσh = 77 [37]E = 55, v = 0.21 E = 49, v = 0.23 (For clays)Fresh water
Groß Schönebeck (Germany)2006-present4100 [37]149Clastic and volcanic Rock (Permian)Normal & strike-slip (Moeck [38]σv = 100, σH = 91, σh = 55, PP = 44 [37]E = 55 v = 0.20 (For volcanic rocks) E = 55 v = 0.18 (For sediments)MHF—fresh water or quartz sand 20/40 mesh, cross-linked gel with high strength in HTU linear gel
Pohang (South Korea)2010–20174200 [39]140Laminated Granodiorite, PermianReverse strike-slipσv = 108, σH = 143, σh = 109, σv = 111, σH = 126, σh = 92VP = 4346, VS = 2676 Ed = 45 [40]Fresh water [39]
Poland (Karkonosze Mountains, Gorzów Block, Mogilno-Łód’z Trough, Szczecin Trough, Upper Silesian BlockThe site has not yet been fractured4000 to 5700 m [41]165 to 175 [42] 150 to 170 [41]upper Carboniferous Granite at
lower Permian low-permeable Triassic sediments [42] Permian or Carboniferous sediments (Sowiz˙dz˙ał et al., 2021)
normal with
strike-slip component (Western Poland) [43] strike-slip (Upper Silesian Block)
σv = 96 (Karkonosze Mount), σv = 103 (Gorzów Block) σv = 136 (Mogilno-Łód’z Trough);
σv = 120 (Szczecin Trough); σv = 120 (Upper Silesian Block). (Jarosi´nski et al., 2005)
The site has not yet been fractured
Table 2. Factor contribution numerical scales based on experience and judgment.
Numerical ScaleDescription
1i and j equally contribute to the factors
3i and j are slightly more important
5i and j are more important
7i and j are strongly important
9i and j are extremely important
2, 4, 6, 8 Final preparationvalues indicate an intermediate level of significance analyze the two targets in reverse order
Table 3. Judgment matrix A = of the influencing factors.
a i j Brittleness
Index
Brittle Mineral ContentFracture ToughnessMin. Horizontal StressTemperature
Brittleness index1.002.003.005.007.00
Brittle mineral content0.501.002.003.004.00
Fracture toughness0.330.501.002.003.00
Min. horizontal stress0.250.140.331.002.00
Temperature0.150.120.280.501.00
Publisher’s Note: MDPI stays neutral with regard to jurisdictional claims in published maps and institutional affiliations.

