Abstract
This article is devoted to the development of technology for improving the efficiency of directional well drilling by predicting and adjusting the system of static and dynamic components of the actual weight on the bit, based on the real-time data interpretation from telemetry sensors of the bottom hole assembly (BHA). Studies of the petrophysical and geomechanical properties of rock samples were carried out. Based on fourth strength theory and the Palmgren–Miner fatigue stress theory, the mathematical model for prediction of effective distribution of mechanical specific energy, using machine learning methods while drilling, was developed. An algorithm was set for evaluation and estimation of effective destruction of rock by comparing petrophysical data in the well section and predicting the shock impulse of the bit. Based on the theory provided, it is assumed that the given shock impulse is an actual representation of an excessive energy, conveyed to BHA. This excessive energy was quantitively determined and expressed as an adjusting coefficient for optimal weight on bit. The developed mathematical and predictive model helps to identify the presence of ineffective rock destruction and adjust drilling regime accordingly. Several well drilling datasets from the North Sea were analyzed. The effectiveness of the developed mathematical model and algorithms was confirmed by testing well drilling data.
1. Introduction
Increasing consumption volumes of raw hydrocarbon materials creates a demand in development of new oil and gas fields. The pace of placing green fields into operation largely depends on the quality and efficiency of well construction. The majority of new prospects requires higher overall expenses, mostly due to complexity of geological structure, which impose the need for development of enhanced drilling technologies. The most recent studies have shown that advanced solutions and improvements of new types of control, management, and prediction of the stress–strain state (SSS) of a dynamically active system of a drilling tool could greatly reduce capital costs of drilling process [1,2,3].
The presence of highly heterogeneous rocks under destruction, combined with insufficient control of SSS of the drilling tool and drilling regime parameters, makes it difficult to correctly estimate the optimal required weight on the PDC bit. This could result in unwanted consequences and drilling troubles, leading to rig downtime.
Furthermore, using rotary or combined drilling methods, due to either excessive or insufficient weight on bit, it is highly likely that torsional, longitudinal, and transverse vibrations of the drill string (DS) will occur. These vibration modes cause the occurrence of instant uncontrolled vibrations, including lateral and axial impacts of the bottom hole assembly (BHA) on the rock, which lead to a sharp drop in the penetration rates, loss of longitudinal stability of the tool, premature wearing out of the PDC bit, and the risk of accidents and troubles [4,5,6,7,8,9,10,11] (Figure 1).
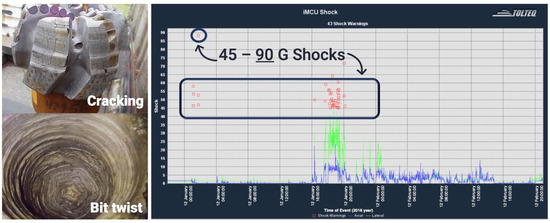
Figure 1.
The negative effect of excessive vibration on the PDC bit.
The changing frequencies and amplitudes of the shocks of the PDC bits are mathematically difficult to determine. In practice, a three-position accelerometer is located in the telemetry system to measure the vibration of the bit. According to the passport data of the equipment used for geophysical well surveys, as well as to avoid damage to the elements of the column, vibration acceleration is limited from 30 to 45 g. As a result of untimely regulation of the drilling mode parameters, due to the speed of information transfer and the response of the automatic control system of the top drive, vibration acceleration can be more than 100 g, which leads to a deviation from the design trajectory and a decrease in the quality of the wellbore or turning and fracture of the drilling tool [12,13,14].
Currently, there are a large number of technical means and technological solutions for monitoring and controlling drilling parameters, as well as methods for obtaining more reliable information received from the bottomhole via communication channels from sensors installed in BHA telemetry systems [15].
A great contribution to the solution of the problems of the dynamics of the DS in the process of drilling wells was made by the research of domestic and foreign scientists.
In the study of Baldenko [16], the development of technical solutions is discussed, in particular, small-sized sectional HDMs and drilling of ultra-small-diameter channels, as well as the methodology for choosing the configuration of the HDM sections, which are different from serial ones by means of hydraulic calculations. In the works of Woods and Yigit [17,18] a study of the selection of the optimal parameters of rate of penetration (ROP) and weight on the bit (WOB) on the cone-type bit is given. Since cone bits have a crushing–shearing effect on the rock, mathematical models will be different compared to drilling with a PDC bit—a cutting-attrition action that is widespread at the present time. The work of Simonyants [19] contains a description of the function of the angular velocity, the parameters of the coordinates of the length, and attenuation of the waves, characterizing the process of friction and destruction of the rock by the bit. Experiments have shown that the moment of friction forces as a function is nonlinear, which is further considered in the work of Spanos [20]. In the scientific work [20], a study of the control of the dynamics of the DS by developing a system for controlling bit slippage during the drilling process is given. Mathematical algorithms in this work, in particular, contain a description of a continuous function of the angular velocity with the parameters of the friction model. Due to the difficulty in determining the friction coefficients due to lithological heterogeneity, calculations using this model are difficult in practice. In the article [21], the authors propose technical solutions for drilling directional wells using a top power drive with an HDM. The authors noted that the use of an HDM with simultaneous rotation of the DS makes it possible to increase the rate of rotation without additional WOB of the DS. The control of drilling in inclined sections of the well is complicated due to the increase in friction of the drill bit against the rock. In the work of Christoforou [18], the authors consider a bit slippage model, which describes the dependence of the friction torque on the rotation speed. The model shows that when a certain critical rotation speed is exceeded, the stick–slip effect stops. Recommended measures to reduce the negative impact of equipment vibrations that occur during well drilling, as well as ways to improve the efficiency of work, are described in the work of Yamaliev [22]. The performance criteria are also given, the fulfillment of which, according to the authors, is necessary for the successful development and application of vibration protection devices for the DS.
In addition, the research of a field of gas shale rocks deformation was conducted in [23]. The main objective of the study was to simulate pulse attenuation in fractured shale core using the embedded discrete fracture model (EDFM). In order to achieve the most accurate structure evaluation of core samples, a 3D scanner was applied, which was further used for both digital twin creation and modeling of pulse attenuation. It was concluded that there is no direct relationship between viscosity reduction due to retention of small pores and behavior of fluid in fractured shale formations. Moreover, the given study reveals quite a high level of 3D scanner applicability for simulation of pulse attenuation in fractured-shale-type formations. For instance, a SkyScan 1173 scanner was applied for evaluation of physical and mechanical properties anisotropy of gas shale. Subsequent digital twin development of the studied rock sample and experimental measurements using special software (e.g., AnSYS Twin Builder) enabled more accurate pulse estimation and its impact on rock matrix, as well as predicted creation of fractures in a near-well region. In addition, it is important to mention several studies that are dedicated to that particular field of study [24,25,26].
The integrated approach to the study of impact dynamics, which consists primarily of studies of the internal structure and physical and mechanical properties of rocks, makes it possible to more accurately determine the optimal WOB and its parameters.
However, in the listed studies, the possibility of shock impulse estimation of BHA, which forms the actual PDC WOB, is not considered.
It is possible to increase the efficiency of drilling wells by developing a technology for online control of WOB [27,28] and predicting the balance of the system of static and dynamic components of the actual PDC WOB based on the interpretation of vibration acceleration data and geomechanical properties of rocks [29], obtained in real time from BHA telemetry systems.
To proceed to the stage of forming a mathematical model based on the construction of numerical experiments, the following hypothesis was formulated:
If a critical WOB is applied to a DS located in a well of a certain diameter and length, its stability may be lost, leading to longitudinal or spiral bending (Figure 2) [30].
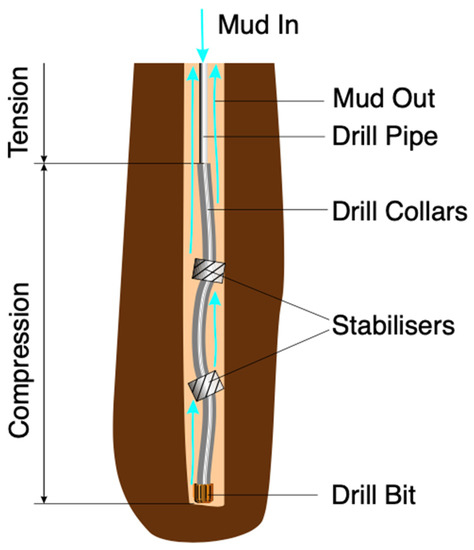
Figure 2.
Buckling of the BHA.
The loss of stability and the change in the spatial shape of the drill bit is due to both the excess of the static load on the bit over the axial rigidity of the rod and the dynamic component, which is formed as a result of torsional vibrations of the BHA, and the impact of axial and lateral vibrations due to the destruction of the rock by the bit with the occurrence of shock impulse of the BHA.
The shock impulse of the BHA is characterized by vibration acceleration and displacement (penetration-cutting depth) of the bit tooth into the rock.
2. Materials and Methods
2.1. Development of Algorithms for Association of Axial and Transverse Vibrations While Drilling
To calculate the elastically deformable rod, the work considers axial vibrations arising in the BHA, considering the DS to be a spring [31,32,33,34,35].
At each moment of time, the axial deformation of the DS is caused by a certain resultant force, which is resisted by the elasticity of the spring:
However, it is also important to consider dissipative forces that contribute to the damping of oscillations, for example, friction forces [36,37]. Let us combine them into a common term of resistance forces, proportional to the first derivative of the displacement:
Let us denote k/m as ω2, and r/m as 2θ, where ω is the circular frequency of harmonic oscillations, and β is the damping coefficient.
Knowing that the general solution to the equations of damped oscillations can be represented using a combination of harmonic oscillations and an exponential term (4):
We use the derivatives of this function to simplify the differential Equation (5):
Since DS vibrations are observed in practice, it can be argued that the square of the cyclic frequency is greater than the square of the damping coefficient.
Replacing ω2 − θ 2 with the corrected cyclic frequency ω12, we obtain the harmonic oscillation equation. This solution is known to be (6):
whence from Equations (4) and (6) we obtain (7):
Therefore, combining (5)–(7), we obtain (8):
Boundary conditions are set.
Oscillations are generated when the bit hits the bottom hole [37]. In addition to being in the gravity field, the bit is also exposed to the forces of the bottomhole resistance to the penetration of the indenter [38,39]. Using the energy strength criterion, we find the energy stored after impact (9):
This energy gives the bit an upward motion; Equations (10) and (11):
The resulting equation describes one wave propagating from the bottom along the BHA.
The algorithm development methodology includes the following steps:
- The height of the bit indenter—h, the damping coefficient that combines the action of dissipative forces and controls the rate of damping of vibrations, the Young’s modulus of the string, the outer and inner diameters of the DS, its mass, length of the BHA, and the frequency of shocks generated at the bottom are set.
- The initial conditions are assumed as follows: the DS is lowered to the bottom, the rock is destroyed, and the first wave is simultaneously generated, which makes the following contribution to the effective acceleration of gravity acting on the DS, Equation (8).
- For the time in the specified range, the generation of new waves is calculated. New waves can be generated in two ways: (1) the wave, propagating at the speed of sound in steel, reaches the top of the BHA. The wave is reflected, which can be represented as an instantaneous damping of the incident wave with the generation of a secondary reflected wave in the opposite direction; (2) the DS is again lowered to the bottom, generating a wave when the indenter contacts the bottom rock.
- A graph of the total impact of waves is built for a given time, taking into account their attenuation, the decrement of which can be expressed as , where T—period, moreover , and .
The additional effective WOB created by vibrations, expressed as an additional effective acceleration of gravity, can be used to accelerate the destruction of the rock. In this regard, it seems necessary to develop an algorithm that would make it possible to establish the dependence of the axial WOB and rotation speed sufficient to destroy a particular rock in order to optimize the drilling process using axial vibrations.
This can be achieved using the energy strength criterion. The use of the energy criterion seems to be the most convenient, because it allows us to fully present the kinetic energy of the rock-cutting tool coming into contact with the bottom and allows us to take into account both the axial and rotational movements of the bit.
Let the triaxial compressive strength σ and its Poisson’s ratio μ be known.
We represent the graph in coordinates ω–g, where g presents the effective acceleration due to gravity, that is, the linear coefficient connecting the axial WOB at a given time and the mass of the DS that creates it.
Let us calculate the energy imparted by the DS. It can be expressed as consisting of two terms, expressed in stresses—axial σ1 and lateral perpendicular to it, caused by the bit rotation—σ3.
Let all the energy pass into the energy of transformation. Then, it will be possible to apply the energy criterion of strength to determine the combinations of angular velocity and effective gravitational acceleration required for destruction (12):
where
- m—the mass of the BHA, kg.
- Ac—contact area proportional to the indenter area, m2.
In this case, the rotational energy (13) is expressed as
where
- ω—the angular velocity of rotation of the bit, rad/s.
- I—the moment of inertia of the BHA, kg × m2.
The moment of inertia of the BHA is defined as the moment of inertia of the cylinder (14):
where R—the radius of the BHA, m.
Lateral stress (15) is expressed as follows:
where
- —cutting depth for rock breaking, m.
- n—rate of rotation, rpm.
Then, the total stress, compared with the compressive strength (16), will be equal to
Taking advantage of the condition of rock destruction , it is possible to calculate the minimum value of gravitational acceleration required for rock destruction for any value of the circular velocity, which will allow the use of axial vibrations to optimize the drilling process.
If the angular velocity and effective gravitational acceleration are accurately maintained, the energy will be mostly spent on the destruction of the rock, and in exceeding that, a significant excess of energy will appear, leading to the formation of additional excess vibrations.
In order to determine the shock impulse of the BHA, it is required to conduct experimental studies to establish the range of longitudinal and transverse deformations of rocks with different petrophysical and physical–mechanical properties.
2.2. Experimental Research of Longitudinal and Transverse Deformation of Rock Samples
A servo-hydraulic installation of triaxial volumetric compression MTS 815 is used as an installation for conducting experimental studies.
Figure 3 shows the results of the research of longitudinal (Figure 3a) and transverse deformation (Figure 3b) of rock samples. A summary table with rock data is shown in Table 1.
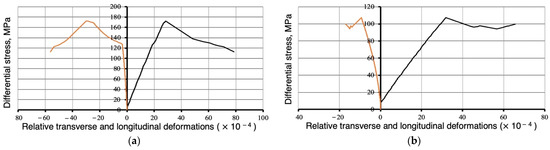
Figure 3.
Physical and mechanical properties of rock samples: (a)—silty sandstone; (b)—siltstone.

Table 1.
Strength characteristics of rocks.
The results of Table 1 shows that for silty sandstone, the longitudinal deformation ranges from 0.28 mm to 0.79 mm, and for siltstone, from 0.33 mm to 0.65 mm. These indicators of rock deformation are taken as a parameter—the depth of cut during the destruction of the rock to determine the shock impulse of the BHA.
2.3. Simulation of the Dynamics of Directional Indention to Determine the Cutting Depth of the Drilling of Rocks
When drilling with PDC bits, cutting–abrasive destruction of the rock occurs. Since the angle of inclination of the PDC-indenter has a certain inclination to the surface of the rock, a directional indention occurs with the contact plane.
Let us consider the dynamic component of PDC bit shocks while drilling. The indention force acting on the cutter will be the impulse—S. The velocity of the center of mass of the BHA— at the beginning of the indention is directed at an angle to the rock and can be represented in the form of linear velocity and axial velocity at the moment of indention (Figure 4), and is mathematically described by the system of Equation (17).
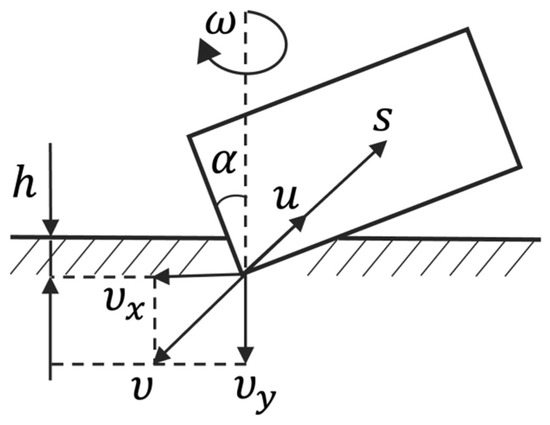
Figure 4.
Diagram of directional indention of PDC-indenter, where α—angle of inclination of the bit indenter, degrees; u—speed of the reflected mechanical wave, m/s; S—impulse, N×s.
The depth of cut of a PDC bit is a direct indication of its aggressiveness. The greater the depth of cut, the more aggressive the bit interacts with the rock and the higher the potential ROP. On the other hand, however, high cutting depth leads to high reactive torque and can cause stick–slip effect, increased vibration acceleration, and subsequent loss of tool control during slide drilling. To prevent torsional vibrations, PDC bits are equipped with cutting depth stops.
The depth of cut for determining the rotational energy is taken from the considerations of penetration per revolution of the bit (18). When the cutting depth is less than 2 mm, the rock is destroyed plastically, and when the cutting depth is more than 3 mm, brittle destruction of the rock occurs.
where v—ROP, m/s.
In this case, the shock impulse can be determined based on the reflection coefficient of mechanical waves and presented in the form (19):
where ko—reflection coefficient of mechanical waves.
The reflection coefficient of mechanical waves (20) depends on the elastic properties and impedance of the tool material and the rock:
where —impedance of material and rock, respectively, kg × s/m2.
The shock impulse (21), based on the substitution of Equations (17) and (20) in (19), is calculated as
To clarify the shock time, it is necessary to take into account the elastic propagation of waves in the BHA and rock. The rebound of the bit will depend on the coefficient of relative elastic properties of materials celast (dimensionless coefficient) (22), expressed by the following equation:
where
- —Young’s modulus of steel and rock, GPa.
- —density of steel and rock, respectively, kg/m3.
The shock time, t (s) (23), is determined by the following expression:
Accordingly, the average value of the shock reaction N, kN (24), is calculated as follows:
2.4. Analysis of the Drilling Process Performance
It is rather problematic to quantify the effectiveness of rock destruction during drilling, since it is impossible to accurately determine the effective ratio of the applied axial and transverse forces. In scientific studies [40,41,42], it was found that the ratio of the axial and rotational force of the impact is about 83%, and the optimal load angle was 50 degrees from the vertical. However, these experiments took into account a single PDC bit insertion.
For a quantitative assessment, it is proposed to introduce the coefficient of the unloading capacity of the BHA—k. This coefficient is the ratio of the energies supplied to the bottomhole—axial and rotational (25). Quantification is determined empirically from field data.
Axial and rotational energy (26) can be determined in accordance with the following system of equations:
where
- N—number of rotations.
- Mb—torque on bit, N·m.
- M—torque on rotor, N·m.
- —bit sliding coefficient, units.
- —drill string sliding coefficient of friction, units.
- —zenith angle, rad.
Using the unloading capacity coefficient we derive the stress ratios. Based on the fourth theory of strength, axial and rotational energy form the stress tensors (27) σ1 and σ3:
Hence, the correction coefficient β (28) follows, which can be represented by the coefficient k:
Then, the energy-efficient WOB based on the systems of Equations (26)–(28) is expressed as follows:
Hence, the energy-efficient WOB PDC (30) is
The contact area in the case of determining axial vibrations (31) is determined as 1/2 of the cross-sectional area, since when drilling with a PDC bit, only a part of the bit interacts with the bottom:
To verify a mathematical model, it is necessary to produce correlation analysis using the Pearson correlation coefficient (32):
For a qualitative estimate of the dynamic WOB, it is proposed to use the mechanical specific energy (MSE) parameter [43]. This criterion is widely used to determine complications while drilling wells.
MSE analysis is capable of displaying the effects of low bit vibration that conventional telemetry tools cannot show in real time. The advantage of downhole accelerometers is that they clearly indicate the type of vibration that occurs, while more experience is required to determine them from the MSE curve.
The energy efficiency of rock destruction by a bit is achieved when the MSE value approaches the uniaxial compressive strength of rocks [44].
A qualitative estimate of the condition implies the identification of areas of ineffective drilling. The MSE parameter (33) is the energy expended to destroy a unit volume of rock:
where
- E—energy spent on rock destruction, J.
- V—volume of destroyed rock, m3.
Initially, the concept of mechanical specific energy for rotating drilling was proposed by Teale in 1965 [42]. The total MSE is presented in the form of axial and rotational components and is expressed as follows (34) and (35):
where
- Sb—borehole cross-sectional area, m2.
The abovementioned model has two main variables—torque at the bit and weight on bit. However, torque and WOB field data is usually in the form of surface measurement, which makes MSE calculation much more complicated. Several studies, such as [43], optimized Teale’s model, so the precision of calculation has been improved. It was proposed to use a functional relationship between WOB and torque at the bit. However, due to the great difference in WOB values at the surface and at the bottom hole, this model also contained a bungee of errors and several limitations.
Researchers [45] proposed to add a term of hydraulic energy, as it contributes to destruction of the rock. However, its role is quite complex and cannot be applied in all cases, because bit hydraulics are mostly responsible for removal of drill cuttings from the bottom hole.
Authors [40] addressed the problem of difference in values of WOB and torque at the surface and at the bottom and came up with WOB–torque relationships, which can help to calculate real MSE values. This model includes the artificially introduced bit-specific coefficient of sliding friction to express torque as a function of WOB [43]. This model is used here to calculate real MSE values, because given data for computation is in the form of surface measurements.
- —Actual WOB at the bottom hole, N.
- —torque at the bottom hole, N × m.
- —bit sliding coefficient of friction, units.
- —drill string sliding coefficient of friction, units.
- —zenith angle, rad.
Given these relationships, it is assumed that average values for PDC bits range from 0.6 to 0.9 [46], while DS sliding coefficient of friction is estimated to be 0.25 to 0.4 [47]. Figure 5 highlights the relationship between the WOB ratio and the bottom hole deviation angle. The value of the bit sliding coefficient is set to 0.35.
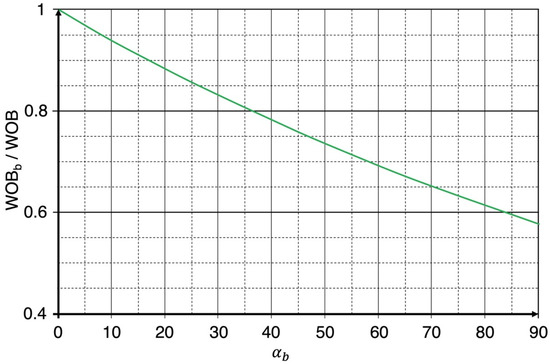
Figure 5.
Relationship between WOB ratio and bottom hole deviation angle.
Authors [48] proposed a new method of drilling optimization, based on real-time MSE computation. The key point is that three regions of a drilling system were introduced to track the efficiency of the process: region A—inadequate depth of cut, region B—efficient bit, and region C—founder. It is assumed that bit is efficient, if rate of penetration is linearly dependent on weight on bit (region B), whereas rate of penetration reaches founder point (region C), the ROP–WOB relationship is nonlinear, which may cause several types of drilling troubles. The algorithm of tracking region B and maintaining drilling mode parameters, corresponding to this region, was developed. Figure 6 illustrates the three regions of the drilling mode system [49].
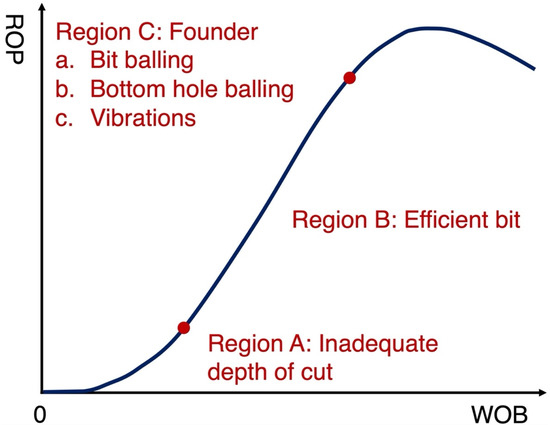
Figure 6.
ROP–WOB relationship.
In this paper, based on the abovementioned algorithm, in order to track possible zones of vibrations, it is suggested to introduce two zones, corresponding to each configuration of drilling mode parameters—green and red [49]. The green area (38) indicates stable drilling when the MSE values are minimal. The ROP–WOB relation is linear, which means that the rate-to-load ratio does not change over time. The red area (39) is characterized by high MSE values and leads to complications such as vibrations, sticking, tool wear, etc. The ROP–WOB relation is nonlinear (Figure 7).
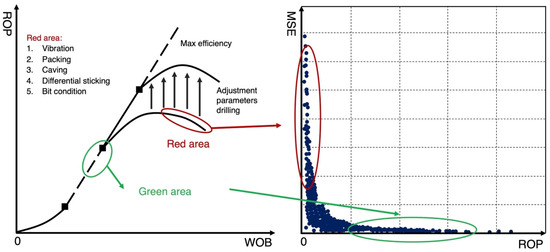
Figure 7.
The mechanism for determining the areas of complications using MSE.
Green area:
Red area:
2.5. Algorithm for Predicting and Monitoring the Impulse and Determining the Most Efficient WOB While Drilling Directional Wells
On the basis of laboratory research of triaxial rock compression and data from telemetry downhole systems, an algorithm was proposed to predict and monitor the shock impulse of a bit and to determine the most effective WOB while drilling directional wells. The algorithm is shown in Figure 8.
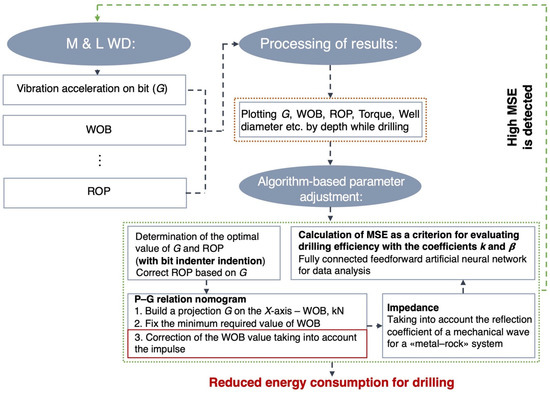
Figure 8.
Algorithm for determining the effective use of MSE.
First of all, a model was developed for determining the intervals of occurrence of torsional vibrations based on the MSE calculation [50].
The program requires the following input parameters: WOB; hook weight; torque; ROP; rotation frequency; well diameter; gamma-ray logging; riser pressure.
The program calculates MSE for the selected interval of the well and determines abnormally high energy values that are not typical for drilling this interval. Based on practice, when a certain value of MSE is reached, there is a high probability of occurrence of torsional vibrations [51,52].
To analyze wells data, a machine learning method was applied—a fully connected feedforward neural network. The method is well suited for solving data classification problems in the absence or impossibility of calculating the parameters of the probability distribution and distance measure.
The architecture of a fully connected neural network was selected: one hidden layer with eight input and two output neurons. One of the output neurons indicates the presence of torsional vibrations, and the other describes the stability of the parameters. At the input, the neural network perceives the eight parameters listed above.
From the data [53], the training and test samples were selected in an 80/20 ratio. The learning process is shown in Figure 9.
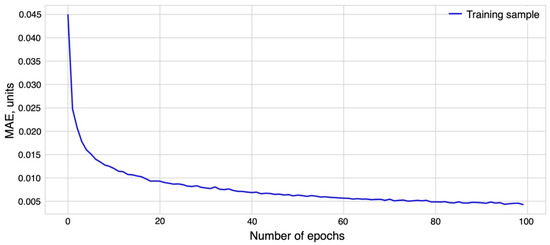
Figure 9.
Model training.
The MAE parameter is used as an estimation of the model in the training process. MAE is the mean absolute error, calculated as
where
- y—the predicted value of the model.
- x—the real value.
- n—number of values.
3. Results of Research and Analysis of Developed Algorithms
Based on production data at the Volve field, the North Sea shelf determines the coefficient of the unloading capacity of the BHA and the correction coefficient β. This is an open source data from Equinor [53].
As an example, based on the analysis of the data drilling of 1000–3500 m of the well F_14, the average unloading capacity of the BHA for drilling wells on the intervals of a different lithological and stratigraphic section of rocks is calculated. The results of the calculations are presented in Table 2.
Table 2.
The values of the coefficients depending on the type of rock.
The drilling parameters are presented: WOB—from 5 to 140 kN, the rate of rotation is from 0 to 143 rpm, the torque is from 2 to 24 kN × m, and the well diameter—215.9 mm.
Figure 10 shows the results of the program in the well F_9A.
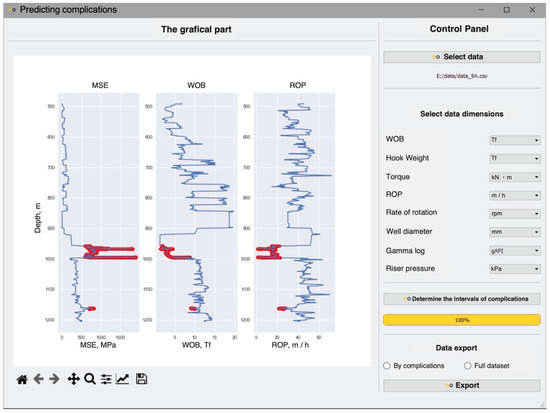
Figure 10.
The results of the program based on well data F_9A.
The program analyzes the parameters of the drilling mode in the interval of 500–1200 m along the wellbore. From a depth of 950 m there is a change in geology—clays and loams are replaced by sandstones. At the same time, the drilling mode was chosen incorrectly, as a result of which high values of the MSE are observed. High MSE values characterize an incorrectly selected drilling mode. Excessive energy contributes to the formation of torsional vibrations of the drill bit and BHA, which led to breakage and wear of the bit at a depth of 1009 m in well F_9A.
For the selection of correct drilling parameters, it is proposed to use the derived empirical coefficients k and β. We consider drilling intervals 950–1000 m and 1020–1100 m and define the average values of these coefficients. Table 3 presents average data values to calculate each of the intervals.
Table 3.
Calculation data.
Figure 11 shows the result of the calculation on the entire well section F_9A. In the range of 950–1000 m, high MSE values are observed, more than 2 GPa, and relatively low values of WOB—less than 30 kN. The BHA unloading capacity coefficient is 0.008 units, which is a low value for sandstone. From Table 2, it follows that k for sandstone varies in the range from 0.04 to 0.08 units. As it was analyzed, values below 0.01 cause elastic impacts of the bit on the bottomhole. Thus, practically all the energy for destruction is kinetic rotating. Therefore, with insufficient penetration of the bit cutters, there is a high probability of torsional vibrations. In this case, the discrepancy between k table values leads to the occurrence of axial and transverse vibration acceleration.
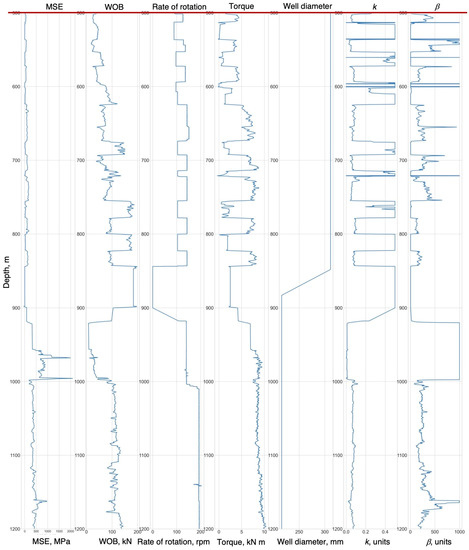
Figure 11.
The results of the calculation.
To determine the combined effect of axial and transverse shocks, it is necessary to determine the average depth of cut in the interval under consideration [54,55]. The cutting depth according to (18) is
Thus, the cutting depth per revolution is 2.5 mm (Figure 12a). Based on laboratory experiments and the data given, when an indenter is introduced less than 2 mm, the rock undergoes predominantly plastic deformation (Figure 12b). The joint action of the axial and transverse components of vibration accelerations is described based on considerations of the accumulation of fatigue stresses in the rock according to the Palmgren–Miner theory [56]. To calculate the energy efficient load, we use Equation (35). Taking into account the calculated coefficients k and , the G will be
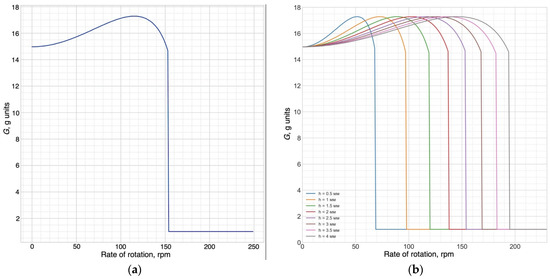
Figure 12.
Nomograms: (a)—rate of rotation–G relation; (b)—axial and lateral shocks–rate of rotation relation from the cutting depth of sandstone.
Figure 13a shows that the recommended WOB in the interval of 950–1000 m is 100–120 kN, when the dynamic WOB is minimal. However, when drilling this interval, a WOB of 30 kN was chosen, which is caused by an increase in the dynamic component of the WOB.
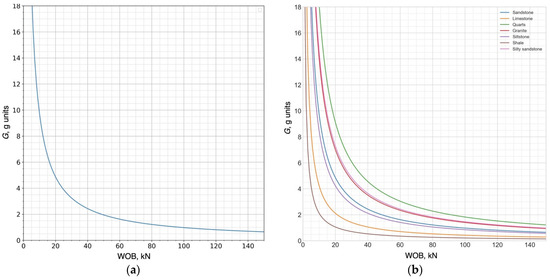
Figure 13.
Nomograms: (a)—WOB–G relation; (b)—axial and lateral shocks–rate of rotation relation from the cutting depth of sandstone.
Based on Figure 12a and Figure 13a, with a recommended WOB of 100–120 kN and a rate of rotation of more than 155 rpm, brittle fracture of the rock occurs in the interval of 950–1000 m. At a rate of rotation of 140 rpm, the rock is deformed plastically, which causes the formation of axial and transverse vibration acceleration of 15–16 g.
- The shock impulse is calculated according to (21):
- The shock time is determined by (23):
- The average magnitude of the shock reaction according to (24):
The average value of the shock reaction is 354.5 kN, which significantly exceeds the static WOB of 31 kN, by more than 11 times. When adjusting the parameters of the static weight and the rate of rotation, optimal and uninterrupted destruction of the rock at the bottom is achieved. The average value of the shock reaction is 354.5 kN, which significantly exceeds the static WOB of 31 kN (Table 3), by more than 11 times. When adjusting the parameters of the static WOB and the rate of rotation, a stable destruction of the rock at the bottomhole is achieved.
The results of the verification of the mathematical model according to (32) are shown in Figure 14 (accuracy is 91.6%).
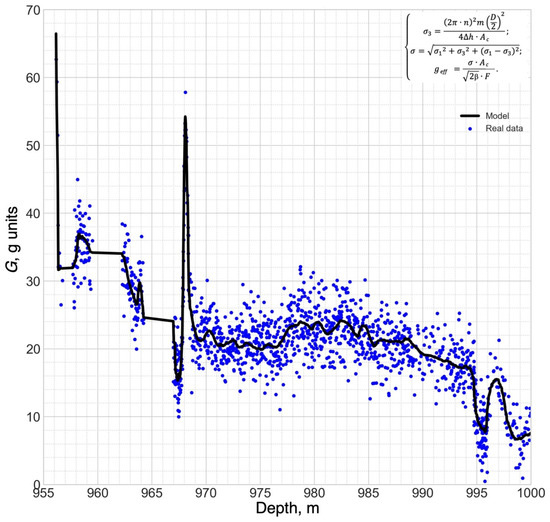
Figure 14.
Verification of the mathematical model.
4. Discussion
The existing methods of WOB monitoring presented in the article demonstrate possible risks during drilling operations. These risks can cause accidents (loose assembly elements, tool breakage, etc.), leading to an increase in the cost of the well.
The algorithm and computer program presented for the first time make it possible to determine and predict the critical dynamic WOB bit resulting from impacts of the rock cutting tool on the rock. The solution of this problem makes it possible to implement the technology [48,49,51,52], which ensures the reduction of errors in the process of selection of regime parameters for drilling wells.
In order to quantify the effectiveness of the drilling process, in addition to the qualitative determination by means of MSE described in [39,49], an empirical coefficient of BHA unloading capacity k was introduced to pass a certain rock, which is defined as the ratio of axial and rotational energy required to destroy the rocks, taking into account its physical and mechanical properties. On the basis of field data, the model was verified and the average values of k were determined for the passage of each lithotype, at which the most effective destruction of the rock occurs. As a result, it was found that for sandstone the optimal value of k is from 0.04 to 0.08 units, for limestone, k—0.03–0.05 units, and for shale, k—0.05–0.1 units
For the first time in the work, the dynamics of the oblique impact of the PDC bit on the rock were simulated to assess the negative impact of torsional vibrations on the rock cutting tool. Studies in [51] do not give a clear definition of the depth of cut. To achieve this, this research uses the principle of rock destruction in conjunction with the fourth theory of strength and the hypothesis of the accumulation of fatigue stresses by Palmgren–Miner.
Based on field data from telemetry sensors, it was possible to determine, with minimal error, the values of axial and transverse shocks of the dynamic WOB when drilling different types of rocks, as well as the average values of the support reaction in the event of a high dynamic WOB, leading to breakage of the BHA elements.
The paper presents the methodology and method for determining the dynamics of work and predicting the actual weight on the cutting–chipping action bit; however, this problem is also acute for optimizing the operation of BHA shock impulses during the interaction of rock and rock-cutting tools, for example, crushing–shearing and abrasive–cutting action. These include cone and diamond (impregnated) bits. For example, to date, many factories have reduced the output of roller cone bits due to the failure of bearing assemblies, bearings, causing a decrease in their reliability and motor resource. The use of the results of this work in predicting the actual WOB will provide a multiple increase in reliability and durability, for example, for the operation of roller cone bits and other mechanisms that are limited in terms of dynamic shock component. For example, in the passports of the manufacturer of a roller bit, the maximum WOB when drilling wells is from 160 kN. The installed software package and the algorithm for calculating in the «online» mode of drilling wells, taking into account data from the vibration acceleration sensor and the well logging system (LWD), which determines the petrophysical properties of the rock, will make it possible to identify the excess of the critical dynamic WOB and ensure the transmission of information to the automated control system of the top drive about the need to regulate the static component of the WOB in the BHA or the bit speed.
In discussion, it can be noted that in this work an attempt was made not only to limit the PDC WOB or to reduce the rotational speed of the DS according to the available information from the vibration acceleration sensors, for example, no more than 75–100 g, as is now accepted in the world community with drilling wells, and to make the right decision, but also to calculate and monitor the actual axial impact impulse and the resulting energy expended on the destruction of the rock.
5. Conclusions
Based on the results of a complex of laboratory bench tests and computational experiments, the following conclusions can be drawn:
- The necessity and expediency of monitoring and predicting BHA shock impulse, which is the basis for the formation of an energy-efficient WOB during well drilling, were theoretically substantiated and scientifically confirmed.
- Based on experimental studies of the physical and mechanical properties of rocks with a hardness of 60 to 170 MPa, a range of longitudinal and transverse deformations was established, which makes it possible to estimate the penetration depth of the PDC bit cutting structure for the determination of the BHA impact impulse and its prediction using the lithological and stratigraphic data of the well.
- A mathematical model was developed that enabled us to determine effective PDC WOB, represented by the introduced BHA unloading capacity coefficient, based on the discussed energy-efficient rock destruction theory.
- Based on the proposed algorithm for determination of the minimum resultant vibration acceleration of the BHA and the cut depth of the rock, which ensure the creation of its optimal shock impulse, a technology for monitoring and predicting energy-efficient PDC WOB was developed.
Determination of the dynamic component of WOB for drilling with cone bits and extending their motor resource to the level of PDC bits operation time will be presented in the next scientific works of the Mining University [57,58,59].
6. Patents
In the course of scientific work, the following patents were developed:
- Kunshin, A.A.; Starikov, V.V.; Buslaev G.V. Program for predicting possible complications while drilling in real time based on artificial neural networks and calculating the mechanical specific energy. Russia. Certificate No. 2021665628, 30 September 2021.
- Kunshin, A.A.; Dvoynikov, M.V. Program for determining the required WOB while drilling wells with vibration acceleration of the BHA. Russia. Certificate No. 2020616213, 11 June 2020.
- Kunshin, A.A.; Dvoynikov, M.V.; Polyansky, S.D. Program for determining vibration acceleration with damped axial vibrations of the drill string. Russia. Certificate No. 2020615753, 1 June 2020.
- Kunshin, A.A.; Sidorov, D.A.; Buslaev, G.V.; Dvoynikov, M.V. Downhole shock absorber. Russia. Patent No. 2749705 C1, 16 June 2021.
Author Contributions
Conceptualization, M.D. and A.K.; methodology, A.K.; software, V.S.; validation, A.K., M.D. and E.T.; formal analysis, A.K. and V.S.; investigation, A.K. and V.S.; resources, M.D.; data curation, M.D. and E.T.; writing—original draft preparation, A.K. and V.S.; writing—review and editing, A.K. and V.S.; visualization, A.K. and V.S.; supervision, M.D.; project administration, A.K. All authors have read and agreed to the published version of the manuscript.
Funding
This research was funded by subsidy for the fulfillment of a state task in the field of scientific activity for 2021, grant number FSRW-2020-0014.
Institutional Review Board Statement
Not applicable.
Informed Consent Statement
Not applicable.
Data Availability Statement
Not applicable.
Conflicts of Interest
The authors declare no conflict of interest.
References
- Islamov, S.; Grigoriev, A.; Beloglazov, I.; Savchenkov, S.; Gudmestad, O.T. Research Risk Factors in Monitoring Well Drilling—A Case Study Using Machine Learning Methods. Symmetry 2021, 13, 1293. [Google Scholar] [CrossRef]
- Alexandrov, V.; Kobulia, G. Optimization of the field economics. Vestn. McKinsey 2011, 24. Available online: http://vestnikmckinsey.ru/oil-ang-gas/optimizaciya-ehkonomiki-mestorozhdenij (accessed on 19 September 2022).
- Alyautdinov, R.T. Optimization of oil field development in modern conditions. Sustain. Dev. Sci. Educ. J. 2020, 4. [Google Scholar]
- Dvoynikov, M.V.; Budovskaya, M.E. Development of a hydrocarbon completion system for wells with low bottomhole temperatures for conditions of oil and gas fields in Eastern Siberia. J. Min. Inst. 2022, 253, 12–22. [Google Scholar] [CrossRef]
- Quanta, Z.; Zongming, Z.; Bing, H.; Linhu, M.; Jiaxiang, X. Downhole vibration causing a drill collar failure and solutions. Nat. Gas Ind. B 2017, 4, 73–80. [Google Scholar] [CrossRef]
- Mardashov, D.V.; Bondarenko, A.V.; Raupov, I.R. Technique for calculating technological parameters of non-Newtonian liquids injection into oil well during workover. J. Min. Inst. 2022, 1–14. [Google Scholar] [CrossRef]
- Al-AbdulJabbar, A.; Mahmoud, A.A.; Elkatatny, S.; Abughaban, M. A Novel Artificial Neural Network-Based Correlation for Evaluating the Rate of Penetration in a Natural Gas Bearing Sandstone Formation: A Case Study in a Middle East Oil Field. J. Sens. 2021, 2022, 9444076. [Google Scholar] [CrossRef]
- Gurina, E.; Klyuchnikov, N.; Antipova, K.; Koroteev, D. Forecasting the abnormal events at well drilling with machine learning. Appl. Intell. 2021, 52, 9980–9995. [Google Scholar] [CrossRef]
- Ren, Y.; Wang, N.; Jiang, J.; Zhu, J.; Song, G.; Chen, X. The Application of Downhole Vibration Factor in Drilling Tool Reliability Big Data Analytics—A Review. ASME. ASME J. Risk Uncertain. Part B 2019, 5, 010801. [Google Scholar] [CrossRef]
- Golitsyna, M.; Semenikhin, A.; Chebuniaev, I.; Vasilyev, V.; Koryabkin, V.; Makarov, V.; Simon, I.; Baybolov, T.; Osmonalieva, O. Automatic Method for Anomaly Detection while Drilling. In Proceedings of the First EAGE Digitalization Conference and Exhibition, Vienna, Austria, 30 November–3 December 2020; pp. 1–5. [Google Scholar] [CrossRef]
- Alley, S.D.; Sutherland, G.B. The Use of Real-Time Downhole Shock Measurements to Improve BHA Component Reliability. In Proceedings of the SPE Annual Technical Conference and Exhibition, Dallas, TX, USA, 6–9 October 1991. [Google Scholar]
- Mitchell, R.F.; Allen, M.B. Lateral vibration: The key to BHA failure analysis. World Oil 1985, 200, 5103137. [Google Scholar]
- Dareing, D.W.; Livesay, J. Longitudinal and Angular Drill String Vibrations with Dampening; ASME—American Society of Mechanical Engineers: New York, NY, USA, 1968; pp. 671–679. [Google Scholar]
- Berro, M.J.; Reich, M. Laboratory investigations of a hybrid mud pulse telemetry (HMPT)—A new approach for speeding up the transmitting of MWD/LWD data in deep boreholes. J. Pet. Sci. Eng. 2019, 183, 106374. [Google Scholar] [CrossRef]
- Fjær, E.; Martin Holt, R.; Horsrud, P.; Raaen, A.M.; Risnes, R. Mechanical properties and in situ stresses from field data. Dev. Pet. Sci. 2021, 72, 429–459. [Google Scholar] [CrossRef]
- Lyagov, I.A.; Baldenko, F.D.; Lyagov, A.V.; Yamaliev, V.U.; Lyagova, A.A. Methodology for calculating technical efficiency of power sections in small-sized screw downhole motors for the «Perfobur» system. J. Min. Inst. 2019, 240, 694–700. [Google Scholar] [CrossRef]
- Galle, E.M.; Woods, H.B. Best Constant Weight and Rotary Speed for Rotary Rock Bits; AIME Drilling and Production Practice; American Petroleum Institute (API): Washington, DC, USA, 1963; pp. 48–55. [Google Scholar]
- Yigit, A.S.; Christoforou, A.P. Stick-Slip and Bit-Bounce Interaction in Oil-Well Drill strings. J. Energy Resour. Technol. 2006, 128, 268–274. [Google Scholar] [CrossRef]
- Simonyants, S.L.; Al Taee, M. Stimulation of the Drilling Process with the Top Driven Screw Downhole Motor. J. Min. Inst. 2019, 238, 438–442. [Google Scholar] [CrossRef]
- Spanos, P.D.; Sengupta, A.K.; Cunningham, R.A.; Paslay, P.R. Modeling of Roller Cone Bit Lift-Off Dynamics in Rotary Drilling. ASME J. Energy Resour. Technol. 1995, 117, 197–207. [Google Scholar] [CrossRef]
- Dawson, R.; Lin, Y.Q.; Spanos, P.D. Drill String Stick-Slip Oscillations. In Proceedings of the Conference of the Society for Experimental Mechanics, Houston, TX, USA, 14–19 June 1987; pp. 590–595. [Google Scholar]
- Batretdinov, T.V.; Yamaliev, V.U. Analysis of drill string vibrations and the use of damping devices. Sci. J. Oil Gas Bus. 2016, 6, 5–22. (In Russian) [Google Scholar] [CrossRef][Green Version]
- Jia, B.; Xian, C.-G. Permeability measurement of the fracture-matrix system with 3D embedded discrete fracture model. Pet. Sci. 2022, 19, 1757–1765. [Google Scholar] [CrossRef]
- Han, G.; Liu, X.; Huang, J. Theoretical Comparison of Test Performance of Different Pulse Decay Methods for Unconventional Cores. Energies 2020, 13, 4557. [Google Scholar] [CrossRef]
- Jia, B.; Jin, L.; Mibeck, B.A.; Smith, S.A.; Sorensen, J.A. An integrated approach of measuring permeability of naturally fractured shale. J. Pet. Sci. Eng. 2019, 186, 106716. [Google Scholar] [CrossRef]
- Zhang, J.; Liu, H.; Boudjatit, M. Matrix permeability measurement from fractured unconventional source-rock samples: Method and application. J. Contam. Hydrol. 2020, 233, 103663. [Google Scholar] [CrossRef] [PubMed]
- Kamatov, K.A.; Buslaev, G.V. Solutions for Drilling Efficiency Improvement in Extreme Geological Conditions of Timano-Pechora Region. In Proceedings of the SPE Russian Petroleum Technology Conference, Moscow, Russia, 26–28 October 2015. [Google Scholar] [CrossRef]
- Gospodarikov, A.P.; Zatsepin, M.A. Mathematical modeling of nonlinear boundary value problems in geomechanics. Gorn. Zhurnal 2019, 12, 16–20. [Google Scholar] [CrossRef]
- Leine, R.I.; Van Campen, D.H.; Keultjes, W.J. Stick-slip Whirl Interaction in Drill string Dynamics. J. Sound Acoust. 2002, 124, 209–220. [Google Scholar] [CrossRef]
- Navarro-Lopez, E.; Cortes, D. Sliding-mode of a multi-DOF oil well drill string with stick-slip oscillations. In Proceedings of the 2007 American Control Conference, New York, NY, USA, 11–13 July 2007; pp. 3837–3842. [Google Scholar] [CrossRef]
- Saldivar, B.; Boussaada, I.; Mounier, H.; Mondié, S.; Niculescu, S.I. An Overview on the Modeling of Oilwell Drilling Vibrations. IFAC Proc. Vol. 2014, 47, 5169–5174. [Google Scholar] [CrossRef]
- Tucker, R.W.; Wang, C. On the effective control of torsional vibrations in drilling systems. J. Sound Vib. 1999, 224, 101–122. [Google Scholar] [CrossRef]
- Challamel, N. Rock destruction effect on the stability of a drilling structure. J. Sound Vib. 2000, 233, 235–254. [Google Scholar] [CrossRef]
- Saldivar, M.B.; Mondié, S. Drilling vibration reduction via attractive ellipsoid method. J. Frankl. Inst. 2013, 350, 485–502. [Google Scholar] [CrossRef]
- Bolobov, V.I.; Plaschinskiy, V.; Thanh, B.L. Crack propagation in rock upon impact. Obogashchenie Rud 2019, 5, 3–8. [Google Scholar] [CrossRef]
- Bolobov, V.I.; Chupin, S.A.; Bochkov, V.S.; Mishin, I.I. Increasing the service life of rock cutting tools by increasing the wear resistance of their holders by thermomechanical treatment. Gorn. Zhurnal 2019, 5, 67–71. [Google Scholar] [CrossRef]
- Zha, Y.; Pham, S. Monitoring downhole drilling vibrations using surface data through deep learning. In Proceedings of the SEG International Exposition and Annual Meeting, Anaheim, CA, USA, 15–20 September 2018. [Google Scholar] [CrossRef]
- Lykov, Y.V.; Gorelikov, V.G.; Gantulga, B. Analytical research and classification of mechanism of diamond drilling-bits contact with rocks during well sinking. IOP Conf. Ser. Earth Environ. Sci. 2017, 87, 022012. [Google Scholar] [CrossRef]
- Chen, X.; Gao, D.; Yang, J. Drilling Performance Optimization Based on Mechanical Specific Energy Technologies. Drilling 2018, 35, 133–161. [Google Scholar] [CrossRef]
- Richard, T.; Detournay, E.; Drescher, A.; Nicodeme, P.; Fourmaintraux, D. The scratch test as a means to measure strength of sedimentary rocks. In Proceedings of the EuRock’98 Conference (Rock Mechanics in Petroleum Engineering), Trondheim, Norway, 8–10 July 1998; Volume 2, pp. 15–22. [Google Scholar] [CrossRef]
- Zhang, H.; Shubin, L.; Hongjian, N. Numerical study on optimal impact angle of a single PDC cutter in impact rock cutting. Energy Rep. 2021, 7, 4172–4183. [Google Scholar] [CrossRef]
- Teale, R. The concept of specific energy in rock drilling. Int. J. Rock Mech. Min. Sci. Geomech. 1965, 2, 57–73. [Google Scholar] [CrossRef]
- Mazen, A.Z.; Rahmanian, N.; Mujtaba, I.M.; Hassanpour, A. Effective mechanical specific energy: A new approach for evaluating PDC bit performance and cutters wear 2021. J. Pet. Sci. Eng. 2020, 196, 108030. [Google Scholar] [CrossRef]
- Mohan, K.; Adil, F.; Samuel, R. Tracking drilling efficiency using hydro-mechanical specific energy. In Proceedings of the SPE/IADC Drilling Conference and Exhibition, Amsterdam, The Netherlands, 17–19 March 2009. [Google Scholar] [CrossRef]
- Rashidi, B.; Hareland, G.; Fazaelizadeh, M.; Svigir, M. Comparative study using rock energy and drilling strength models. In Proceedings of the 44th U.S. Rock Mechanics Symposium and 5th U.S. Canada Rock Mechanics Symposium, Salt Lake City, UT, USA, 27–30 June 2010. [Google Scholar]
- Juan, L. Research on torque and drag in extended-reach horizontal wells and its application in Chenghai-1 area. Oil Drill. Prod. Technol. 2009, 31, 21–25. [Google Scholar]
- Dupriest, F.E.; Koederitz, W.L. Maximizing drill rates with real-time surveillance of mechanical specific energy. In Proceedings of the SPE/IADC Drilling Conference, Amsterdam, The Netherlands, 23–25 February 2005. [Google Scholar] [CrossRef]
- Chen, X.; Gao, D.; Guo, B.; Feng, Y. Real-time optimization of drilling parameters based on mechanical specific energy for rotating drilling with positive displacement motor in the hard formation. J. Nat. Gas Sci. Eng. 2016, 35 Part A, 686–694. [Google Scholar] [CrossRef]
- Pessier, R.C.; Fear, M.J. Quantifying common drilling problems with mechanical specific energy and a bit-specific coefficient of sliding friction. In Proceedings of the SPE Annual Technical Conference and Exhibition, Washington, DC, USA, 4–7 October 1992. [Google Scholar] [CrossRef]
- Kunshin, A.A.; Starikov, V.V.; Buslaev, G.V. Program for Predicting Possible Complications while Drilling in Real Time Based on Artificial Neural Networks and Calculating the Mechanical Specific Energy. Russia Certificate No. 2021665628, 30 September 2021. [Google Scholar]
- Liu, S.; Ni, H.; Wang, X.; Wang, P.; Li, N. Numerical study of the compound vertical and horizontal impact cutting with a single PDC cutter. Energy Rep. 2020, 6, 1520–1527. [Google Scholar] [CrossRef]
- Mahmoud, A.A.; Elkatatny, S.; Al Shehri, D. Application of Machine Learning in Evaluation of the Static Young’s Modulus for Sandstone Formations. Sustainability 2020, 12, 1880. [Google Scholar] [CrossRef]
- Equinor ASA. Available online: https://www.equinor.com/en/what-we-do/norwegian-continental-shelf-platforms/volve.html (accessed on 19 September 2022).
- Kunshin, A.A.; Dvoynikov, M.V. Program for Determining the Required WOB while Drilling Wells with Vibration Acceleration of the BHA. Russia Certificate No. 2020616213, 11 June 2020. [Google Scholar]
- Kunshin, A.A.; Dvoynikov, M.V.; Polyansky, S.D. Program for Determining Vibration Acceleration with Damped Axial Vibrations of the Drill String. Russia Certificate No. 2020615753, 1 June 2020. [Google Scholar]
- Abdelkrim, A.; Aissa, A.; Mostefa, B.; Abdelkader, D.; Mohammed, E.G. Fatigue life estimation of components with use a non-linear energy model coupled a finite element method. In Proceedings of the International Conference on Materials & Energy, Baku, Azerbaijan, 22–25 May 2020; p. 307. [Google Scholar] [CrossRef]
- Litvinenko, V.S.; Bowbrick, I.; Naumov, I.A.; Zaitseva, Z. Global guidelines and requirements for professional competencies of natural resource extraction engineers: Implications for ESG principles and sustainable development goals. J. Clean. Prod. 2022, 338, 130530. [Google Scholar] [CrossRef]
- Morenov, V.; Leusheva, E.; Lavrik, A.; Lavrik, A.; Buslaev, G. Gas-Fueled Binary Energy System with Low-Boiling Working Fluid for Enhanced Power Generation. Energies 2022, 15, 2551. [Google Scholar] [CrossRef]
- Zimin, R.Y.; Kuchin, V.N. Improving the Efficiency of Oil and Gas Field Development through the Use of Alternative Energy Sources in the Arctic. In Proceedings of the 2020 International Multi-Conference on Industrial Engineering and Modern Technologies (FarEastCon), Vladivostok, Russia, 6–9 October 2020; pp. 1–5. [Google Scholar] [CrossRef]


Publisher’s Note: MDPI stays neutral with regard to jurisdictional claims in published maps and institutional affiliations. |
© 2022 by the authors. Licensee MDPI, Basel, Switzerland. This article is an open access article distributed under the terms and conditions of the Creative Commons Attribution (CC BY) license (https://creativecommons.org/licenses/by/4.0/).